X-ray spectral correlations in a sample of Low-mass black hole X-ray binaries in the hard state
Abstract
The power-law emission and reflection component provide valuable insights into the accretion process around a black hole. In this work, thanks to the broadband spectra coverage of the Nuclear Spectroscopic Telescope Array, we study the spectral properties for a sample of low-mass black hole X-ray binaries (BHXRBs). We find that there is a positive correlation between the photon index and the reflection fraction (the ratio of the coronal intensity that illuminates the disk to the coronal intensity that reaches the observer), consistent with previous studies, but except for MAXI J1820+070. It is quite interesting that this source also deviates from the well-known “V”-shaped correlation between the photon index and the X-ray luminosity log, when it is in the bright hard state. More specifically, the -shaped correlation between and log is observed, as the luminosity decreases by a factor of 3 in a narrow range from to . Furthermore, we discover a strong positive correlation between and the X-ray luminosity for BHXRBs in the hard state, which puts a constraint on the disk-corona coupling and the evolution.
1 Introduction
The primary X-ray emission in X-ray binaries and active galactic nuclei (AGNs) produced via inverse Compton scattering of the soft photons in the hot compact region, often referred to as corona, is described by a power law with a high energy cutoff (Done et al., 2007; You et al., 2012; Yuan & Narayan, 2014). A reflection component, which is believed to be produced by the illumination of the reflecting medium by the primary X-ray, is also observed. The reflection component is composed of fluorescent emission lines and a hump in the range of 20–40 keV. We use the photon index to describe the slope of the primary X-ray, which indicates the fraction of the energy from the soft seed photons deposited into the corona. The reflection fraction is used to indicate the fraction of the primary X-ray intercepted by the reflection medium, namely, the relative cold disk (García et al., 2013). The correlations between the X-ray properties (e.g., and broad-band luminosity ) and imply the geometric and physical properties of the accretion flow around the central object (Wu & Gu, 2008; Plant et al., 2014; You et al., 2021).
The positive correlation between and was found for the black hole X-ray binary (BHXRB) GX 339-4 in the hard state by fitting Ginga spectra (Ueda et al., 1994). Zdziarski et al. (1999) reported a similar correlation in Seyfert galaxies and in the hard state of four binary systems, and provided evidence for the reflective medium as the dominant source for seed photons to the corona. The correlation was also studied by analyzing RXTE/PCA data for GX 339-4 and Cyg X-1 hard state (Gilfanov et al., 1999; Revnivtsev et al., 2001), and for the sample of low-mass X-ray binaries (LMXBs; Steiner et al. 2016). However, the physical interpretation of this correlation is still under debate, which might be either the evolution of the inner radius (Zdziarski et al., 1999; Qiao & Liu, 2017; Liu & Qiao, 2022) in the scenario of the truncated disk, or the bulk velocity of the corona with respect to the disk (Beloborodov, 1999). As for the correlation between and , it was found that the gradually increases as the source luminosity rises for GX 339-4 in the hard state, which was interpreted in the scenario of the truncated disk (Plant et al., 2014). However, a statistical study of the correlation between and for a sample of LMXBs is required, in order to not only verify the observational correlation but also well understand the physical origin behind this correlation.
The Nuclear Spectroscopic Telescope Array (NuSTAR) is the first focusing telescope above 10 keV (Harrison et al., 2013). The high signal-to-noise ratio and broad energy band provide a good opportunity to better study the primary X-ray and the reflection hump, compared to previous spectral studies (Diaz et al., 2020; Draghis et al., 2020; Connors et al., 2021; Marino et al., 2021; Tripathi et al., 2021; Feng et al., 2022; Prabhakar et al., 2022; Rout et al., 2022). The correlation between and by analysing NuSTAR spectra has been recently reported for Seyfert galaxies (Ezhikode et al., 2020; Panagiotou & Walter, 2020) and radio galaxies (Kang et al., 2020).
The motivation of this work is to statistically study the correlations between the X-ray properties ( and ) and , in a sample of stellar-mass black hole systems in the hard state, using NuSTAR archived data. This paper is organized as follows. In section 2, we present the sample selection and data reduction. In section 3, we give the spectral analysis and the best-fit results. Finally, the discussions and conclusions are presented in section 4.
2 Sample and Data Reduction
In this work, we adopt the NuSTAR sample of 17 LMXBs which is constructed by Yan et al. (2020), consisting of 165 observations downloaded from HEASARC. The data reduction was performed through the NUPIPELINE task of NUSTARDAS included in HEAsoft 6.29.
We set saamode=optimized and tentacle=yes to filter passages through the South Atlantic Anomaly, and set arfmlicorr=yes to correct the temperature dependence of the multilayer insulation (MLI) for the FPMA data (Madsen et al., 2020). For the bright sources, we use STATUS==b0000xxx00xxxx000 to reprocess the data 111https://heasarc.gsfc.nasa.gov/docs/nustar/analysis/. CALDB version 2021115 is used for the calibration. We extract the source spectra within a uniform radius of 90 at the source position, and the background spectra within an annulus defined between 180′′ and 200′′.
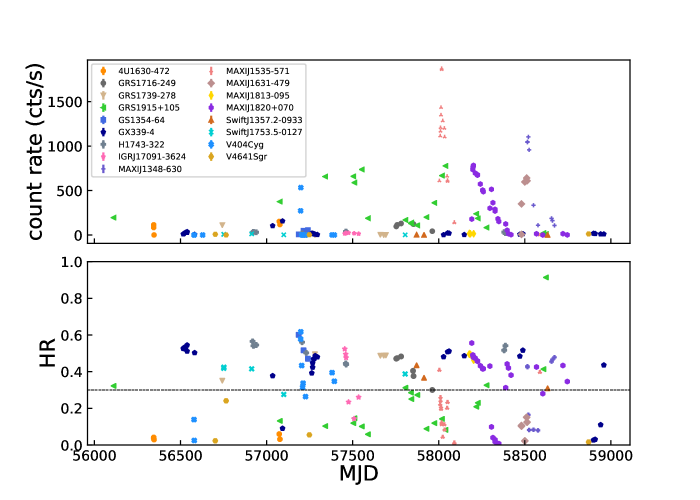
An overview of all data is presented in Figure 1, in which the observation of 4U 1630-472 on MJD 56723 (30001016002) and the observation of H1743-322 on MJD 57251 (80002040006) are excluded, due to the spectra being dominated by the background. We plot the count rate within 3–78 keV and the hardness ratio (HR) defined as the 10–78 keV count rate divided by the 3–10 keV count rate in the upper and lower panels, respectively. In this work, we aim to study the correlations between the X-ray primary and the disk reflection of LMXBs in the hard state. We set HR 0.3 as the selection criterion for the hard state. In this condition, observations of 4U 1630-472, MAXI J1631-479, and V4641 Sgr are excluded. Furthermore, we also exclude observations for which the spectral fits do not require the reflection component, in the sense that those spectra can be well described by an absorbed power-law model, or an absorbed power-law plus diskbb model.
Additionally, the observations of V404 Cyg on MJD 57198 (ObsID: 90102007002) and MJD 57199 (ObsID: 90102007003), and GRS 1915+105 on MJD 58608 (ObsID: 90501321002) and MJD 58623 (ObsID: 30502008002), are excluded, the spectra of which are quite complex and cannot be well fitted in our preliminary analysis with the reflection model (). For V404 Cyg in the 2015 outburst, strong flares were observed, which were thought to be related to transient jet activity of ejecting plasma close to a BH. The corresponding spectral fitting to the NuSTAR observations on MJD 57198 and 57199 suggested that an X-ray source is close to a BH with a height smaller than 6 and its spectra are extremely hard with (Walton et al., 2017). For GRS 1915+105, the NuSTAR observations indicated that it was also in the flaring state on MJD 58608 and 58623, given the clear detection of the absorption features in the spectral residual, which were attributed to the accretion disk winds (Koljonen & Tomsick, 2020; Aramburu Sanchez et al., 2020). Therefore, the final sample in this work is composed of 12 LMXBs with 69 observations in total. Detailed information is provided in Table 1 and Table LABEL:tab:obs_detail.
3 Spectral analysis
We perform the spectral fitting in XSPEC 12.11.1 (Arnaud, 1996). We account for the Galactic absorption using TBabs (Wilms et al., 2000). The column density () was fixed to the values presented in Table 1, most of which are obtained from the previous spectral analysis in the literature. We adopt a relativistic reflection model relxillCp (García et al., 2013; Dauser et al., 2014; García et al., 2014), to account for the reprocessed emission between the disk and corona. This reflection model contains both the direct Comptonization from the corona and its reflection on the disk. Therefore, TBabs*relxillCp in XSPEC notation, is used to fit spectra in our sample. A possible disk component (diskbb) and a nonrelativistic reflection model xillverCp will be added if they can significantly improve the fitting. The nonrelativistic reflection component xillverCp may originate from the distant disk reflection. So, the ionization parameter is fixed at a low value with , for simplicity. And the Comptonization parameters (the electron temperature and the photon index) in xillverCp are linked to the ones in relxillCp (Buisson et al., 2019; You et al., 2021). Note that, for the reflection model relxillCp, no specific geometry of the Comptonization source is assumed, but with an artificial broken power-law emissivity. Alternative reflection models with significant findings of spectral complexity are also available in the literature (Mahmoud & Done, 2018; Zdziarski et al., 2021a, b; Kawamura et al., 2022).
| Source | ( ) | Inclination (∘) | Mass | Distance (kpc) | Ref. |
|---|---|---|---|---|---|
| GRS 1716-249 | 0.6 | - | - | 6 | [1] - - [2] |
| GRS 1739-278 | 2.3 | - | - | 7.5 | [3] - - [4] |
| GRS 1915+105 | 6.11 | 12.4 | 8.6 | [5] [6] [6] [6] | |
| GS 1354-64 | 0.7 | 7.6 | 7 | [7] [8] [8] [9] | |
| GX 339-4 | 0.41 | 37-78 | 5.9 | 9 | [10][11][11][11] |
| H1743-322 | 2.3 | - | - | 8.5 | [12][13] - [13] |
| IGR J17091-3624 | 1.59 | - | - | 12 | [14] - - [27] |
| MAXI J1348-630 | 0.86 | - | - | 2.2 | [15] - - [16] |
| MAXI J1535-571 | 5.5 | - | - | 4.1 | [17] - - [18] |
| MAXI J1813-095 | 0.82 | - | - | 6 | [19] - - [26] |
| MAXI J1820+070 | 0.15 | 8.48 | 2.96 | [20][21][28][21] | |
| Swift J1753.5-0127 | 0.2 | 7.4 | 8.42 | [22][23][24][25] |
[1]Bharali et al. (2019); [2]Saikia et al. (2022); [3]Miller et al. (2015); [4]Yan & Yu (2017); [5]Miller et al. (2013); [6]Reid et al. (2014); [7]El-Batal et al. (2016); [8]Casares et al. (2009); [9]Gandhi et al. (2019); [10]Wang-Ji et al. (2018); [11]Heida et al. (2017); [12]Chand et al. (2020); [13]Steiner et al. (2012); [14]Xu et al. (2017); [15]Chakraborty et al. (2021); [16]Chauhan et al. (2021); [17]Dong et al. (2022); [18]Chauhan et al. (2019); [19]Jiang et al. (2022); [20]Uttley et al. (2018); [21]Atri et al. (2020); [22]Shaw et al. (2016b); [23]Neustroev et al. (2014); [24]Shaw et al. (2016a); [25]Gandhi et al. (2019); [26]Jana et al. (2021); [27]Iyer et al. (2015); [28]Torres et al. (2020)
As for relxillCp, the inclination angle is left free in the spectral fitting, except GRS 1915+105, MAXI J1820+070, and GX 339-4. The inclination angles of the first two sources are adopted from the measurements of jet inclination angles (Reid et al., 2014; Atri et al., 2020), i.e., for GRS 1915+105 and for MAXI J1820+070. However, we notice that there is a large misalignment () between the inclination angles of the jet and binary orbit in MAXI J1820+070 (Poutanen et al., 2022). As for GX 339-4, the binary inclination is constrained to be from the VLT/X-shooter observations. Moreover, as suggested by Zdziarski et al. (2019), the inclination of this source is unlikely to be high, which is supported by the absence of the disk winds (Ponti et al., 2012) and the track on the hardness–intensity diagram (Muñoz-Darias et al., 2013). In the preliminary spectral fits of GX 339-4, the inclination is pegged at a lower limit. Therefore, the inclination angle of this source is fixed at in the following fits. In this work, we aim at determining the connection between the corona and accretion disk, while the robust estimate of the BH spin for an individual source of the sample is beyond the scope of this paper. Therefore, for simplicity, we fix the BH spin for the NuSTAR sample here. The photon index , reflection parameter , the electron temperature , the iron abundance and normalization were free parameters in the spectral fits.
For a given source, the two free parameters, i.e., the inclination of the binary system and the Fe abundance of the accretion disk, are expected to be constant. Therefore, we perform joint fits to multi-epoch spectra for a given source, in the sense that the two parameters between the multi-spectra are linked. Given that (i) the complexity in configuring the xcm files for the joint fits with the complex reflection model, and (2) the reported rip occurring in early 2016 in the MLI associated with FPMA, which resulted in an increased photon flux in FPMA spectra of bright sources 222https://heasarc.gsfc.nasa.gov/docs/nustar/nustar_faq.html#MLI, we will only use the FPMB spectra in the energy band of 3–78 keV, for each observation. For MAXI J1820+070, due to the complex fitting model (the disk component, the relativistic reflection and the nonrelativistic reflection) and there being 18 spectra in total, we divide these spectra into two data sets: one for the rising hard state before MJD=58303, and the other one for the decaying hard state after MJD = 58303 (Buisson et al., 2019). The iron abundance of the second data set is fixed at the best-fitting value of the second data sets, in order to keep this parameter constant during the outburst in 2018.
The best-fitting results are obtained by implementing a Markov Chain Monte Carlo (MCMC) algorithm in XSPEC to create a chain of parameter values whose density gives the probability distribution for that parameter. The analysis of the probability distributions derived from the MCMC chains is implemented using the corner package Foreman-Mackey et al. (2013). The best-fit results for each free parameter are taken as the medians of the corresponding posterior distributions, and the error bars correspond to the 68% confidence interval ( uncertainty).
The best-fitting results are presented in Table 3. Once the best-fitting result is derived, we then use the convolution model cflux to estimate the unobserved 3–78 keV X-ray fluxes of the relxillCp component.
4 Results and Discussion
4.1 Disk-Corona Relation
The hard X-ray from the corona illuminates the disk, which is reprocessed within the disk to produce the reflection spectrum (George & Fabian, 1991; García et al., 2013; You et al., 2021; Klepczarek et al., 2023). Therefore, the reflection spectrum is a crucial ingredient to study the relation between the corona and disk (You et al., 2021). We then explore the disk-corona relation through the correlations between different spectral parameters.
4.1.1 The - relation
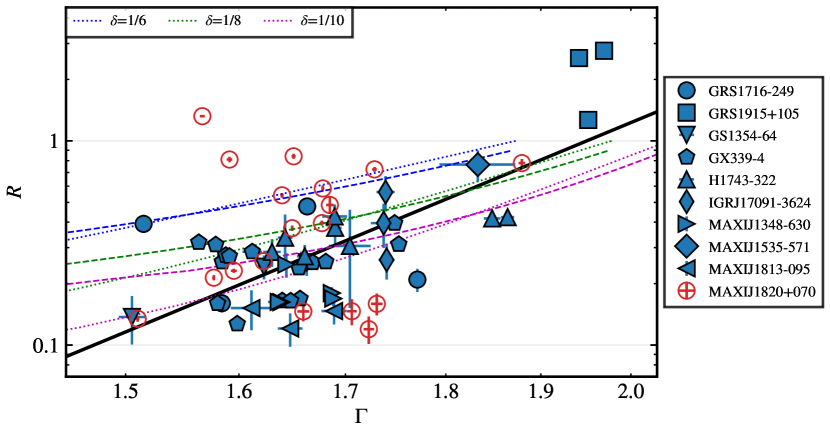
For GRS 1739-278 and Swift J1753.5-0127, the spectra can be well fitted by a simple Comptonization model nthcomp (Zdziarski et al., 1996) without the presence of the reflection features. This means the reflection fraction cannot be well constrained by the data. Therefore, excluding these two sources, we examine the correlation between and using Spearman rank-order test. In order to take into account uncertainties of the parameters, we perform Monte Carlo sampling of the and (Curran, 2014). We notice that some observations of MAXI J1820+070 apparently deviate from this correlation with a large scatter. The complexity of this source will be discussed below. If MAXI J1820+070 is excluded from the sample, we obtain a correlation between and , with the Spearman’s coefficient of at a significance of 3.78 .
Furthermore, in order to better understand the physical origin of the correlation, we need to derive the form of the correlation. Zdziarski et al. (1999) studied the correlation between and the by fitting a few phenomenological functions to the data. And, they found that the best model is a power law, with , . Here, we use the linmix algorithm (Kelly, 2007) implemented in Python 333https://github.com/jmeyers314/linmix to fit the above correlation with a linear function . The best-fitting results are , (see also Figure 2).
The reflection fraction could be approximated as the ratio of the luminosity of the primary X-ray source with unit luminosity incident on the disk to the one radiated outward to infinity,
| (1) |
where is the incident luminosity over the disk (Zdziarski et al., 1999). And the photon index can be estimated from the Compton amplification factor of the thermal Comptonization (Beloborodov, 1999),
| (2) |
The Compton amplification factor is defined as , where is the power in seed photons scattered in the sphere (assuming a unit optical depth).
In the scenario of the truncated disk, both the reflection fraction and the Compton amplification factor depend on the disk truncation radius , which can be estimated from Eq. (1) and (2) of Zdziarski et al. (1999). In the scenario of the outflowing X-ray source, assuming the geometry is steady, both and also depend on the outflowing velocity of the corona, which can be determined from Eq. (3) and (7) of Beloborodov (1999). We plot the predicted correlations between and for these two scenarios, in the case of , , and (see the dotted and dashed lines). It can be seen that both scenarios predict positive correlations between and , which are qualitatively consistent with the observed correlation (except for MAXI J1820+070) in the NuSTAR sample.
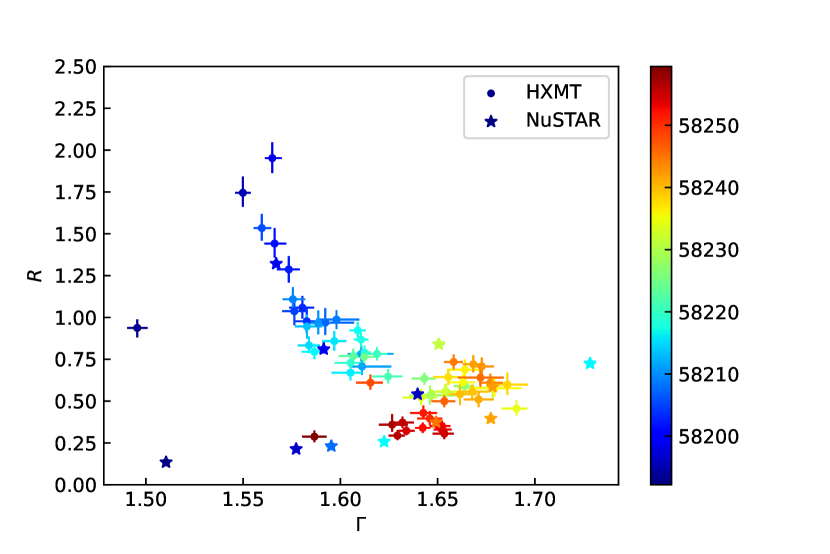
Some observations of MAXI J1820+070 apparently deviate from the positive - correlation above. It seems that there is a negative correlation between and in MAXI J1820+070. We notice that Insight-HXMT also monitored this source with higher cadence and in a broader energy band (2–150 keV) during the outburst in 2018, which was comprehensively studied in You et al. (2021). In order to study the evolution of MAXI J1820+070, we also plot the and obtained from You et al. (2021) in Figure 3. 444At the time of preparing the publication of You et al. (2021), relxill v 1.4.0 was the latest available version, with the bug fixed in v 1.4.3, see http://www.sternwarte.uni-erlangen.de/~dauser/research/relxill/. In this work, using the latest version of relxill, the spectral fits to Insight-HXMT spectra are updated. Combining the results from both NuSTAR and Insight-HXMT, it is evident that (i) the reflection fraction is indeed large and can reach up to during the peak of the rising hard state (around MJD 58200); (ii) there is indeed a negative correlation, where the reflection fraction rapidly decreases from 2.0 to 0.25, as increases in a narrow range from 1.55 to 1.7. The Spearman coefficient is -0.59 at a significance of 5.88 .
4.1.2 The - correlation
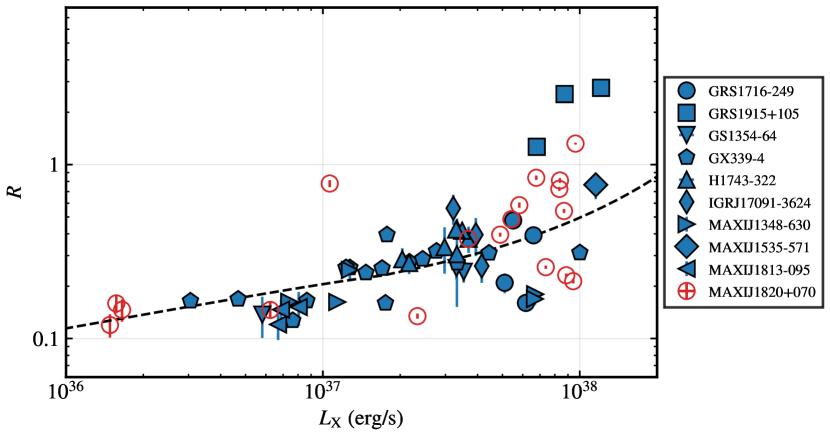
We then study the possible correlation between and log for this NuSTAR sample. The Spearman coefficient of the correlation between and is 0.66 at a significance of 5.02 . This positive correlation can be explained in the truncated disk model. It is hard to directly compute the Comptonization luminosity , but it is proportional to the luminosity of the seed photons which are scattered in the X-ray source, i.e., (Poutanen et al., 2018). The reflection fraction is computed with Equation (1), and is computed using Equations (1) and (2) of Zdziarski et al. (1999). is a function of the truncation radius of the accretion disk. The model prediction of the – correlation is plotted in Figure 4, as a dashed line. The observations roughly follow the model prediction below , and apparently deviate from it at higher luminosity.
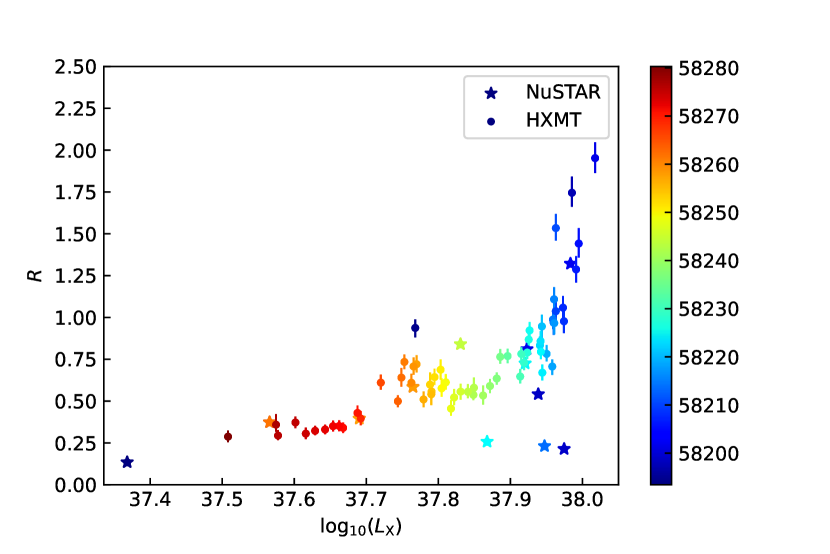
The positive correlation between and for MAXI J1820+070 is much more evident than the one for the sample study above. For clarity, we plot the estimates and log in Fig. 5, including the results of both NuSTAR and Insight-HXMT during the rising hard state of the outburst in 2018. It can be seen that these combined estimates do show a positive correlation, with the reflection fraction rapidly increasing over one order of magnitude as the luminosity increases by a factor of 3. The Spearman coefficient is 0.8 at a significance of 9.4 .
In the truncated disk model (Esin et al., 1997; Done et al., 2007; Qiao & Liu, 2012), it is proposed that the outer disk truncation radius decreases with the mass accretion rate, which leads to the softening of the spectrum. If assuming the inner Comptonization source (i.e., advection-dominated accretion flow) is static, the reflection fraction will increase with the mass accretion rate (i.e., the luminosity), given that the reflection fraction increases as the truncation radius decreases (Zdziarski et al., 1999). Plant et al. (2014) carried out a systematic analysis of the reflection spectrum throughout three outbursts of GX 339-4. It was found that gradually increases as the source luminosity for this source in the hard state, which was interpreted in the scenario of the truncated disk. In De Marco et al. (2017), the X-ray reverberation lags in GX 339-4 were measured in the hard state, which were found to decrease as a function of X-ray luminosity. In the truncated disk model, the decrease in the lag amplitude suggests a decrease in the relative distance between the disk and corona, which may lead to an increase in the reflection fraction. Therefore, the positive correlation - derived in this work, is consistent with previous spectral and timing studies. Recently, in Sridhar et al. (2020), the RXTE observations of of GX 339-4 in the 2002 and 2004 outbursts were reanalysed. They found that the reflection strengths in the 2002–2003 outburst with high X-ray flux is larger than the ones in the 2004–2005 outburst with low X-ray flux (see their Tables 2 and 3).
4.1.3 The - correlation
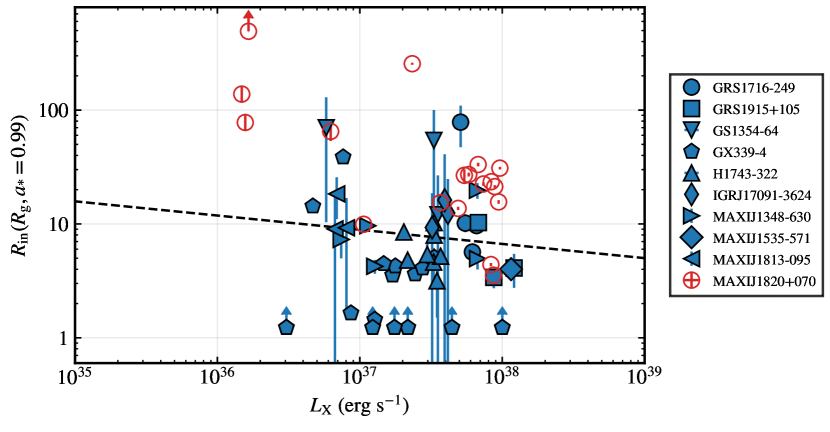
In this work, the disk inner radius is estimated from the spectral fits with the reflection model. In Figure 6, we plot the evolution of the disk inner radius with the X-ray luminosity of the reflection model in 3–78 keV, which shows that the disk is truncated in the hard state. We fit the correlation with the linear function Eq. (3), by replacing the and with log and log and excluding all the lower limits of . The best-fit result is plotted as the solid line. The best-fitting slope is -0.12, which indicates a negative correlation. The Spearman coefficient of the correlation for the data is -0.04 at the significance of 0.25 . Due to the large scatter, we cannot draw a conclusion that a negative correlation between R and L exists among the sample.
By recalibrating the RXTE data to a better precision, García et al. (2015b) reanalyzed six composite RXTE spectra of GX 339–4 in the hard state, with the luminosity spanning by one order of magnitude. The reflection model relxill was used to measure the inner disk radius. They found that the disk is slightly truncated by a few gravitational radii at a few percent of Eddington, and the disk inner radius tends to decrease with the source luminosity. The same conclusion of the evolution of the disk inner radii with the source luminosities for GX 339-4 was also drawn in Plant et al. (2015). Recently, the same timing analysis was also applied to MAXI J1820+070 by De Marco et al. (2021). It was found that the frequency of thermal reverberation lags steadily increases during the outburst in 2018, implying that the relative distance between the X-ray source and the disk decreases (i.e., the decrease of the inner radius of the disk) as the source softens.
In this work, the disk component is required in the spectral fits to the NuSTAR data for some of the sources in the sample, e.g., MAXI J1820+070. The inner radius can also be estimated from the normalization of the diskbb (Kubota et al., 1998). However, in the spectral fits to Insight-HXMT observations of MAXI J820+070, the estimated from the diskbb components is larger than the ISCO, while the disk inner radius is fixed at ISCO (You et al., 2021) in the relativistic reflection model, based on the spectral/timing results in Kara et al. (2019). Such a disagreement would indicate that the diskbb components are only phenomenological descriptions of the complex spectra (Zdziarski et al., 2022b). More importantly, the estimate of from the diskbb component also strongly depends on the boundary condition and the color hardening factor (Kubota & Makishima, 2004; Sridhar et al., 2020; Zdziarski et al., 2022a).
4.2 Luminosity-dependent corona properties
4.2.1 - Correlation
In this work, we do the spectral fitting for the NuSTAR sample of LMXBs using the relativistic reflection model. The broadband luminosity and the corona properties, including the electron temperature and the photon index, can be well measured, so that we could statistically study the dependence of the corona properties on the X-ray luminosity. For the accreting BH sources (including AGNs and BHXRBs), it was found that there is a “V”-shaped correlation between the photon index and log (Yamaoka et al., 2005; Wu & Gu, 2008; Yang et al., 2015; Yan et al., 2020), i.e.,
| (3) |
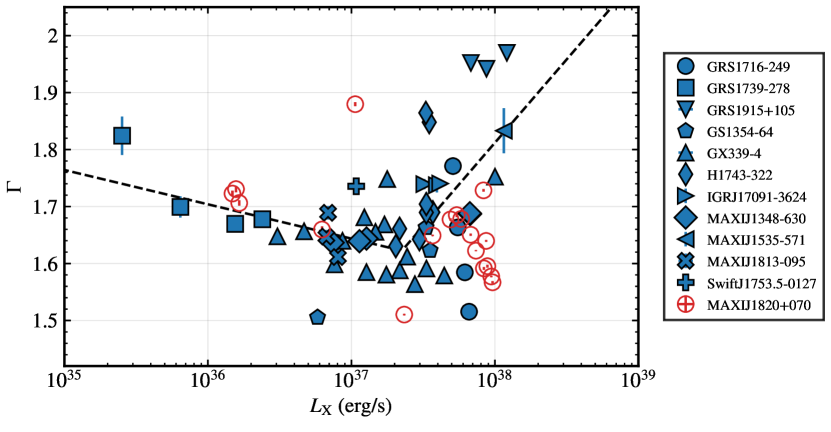
In this work, we investigate this correlation for the NuSTAR sample of LMXBs. The derived and log from the spectral fitting are plotted in Fig.7. Apparently, there is a also “V”-shape correlation between and log. Following Yan et al. (2020), we fit the correlation with the broken linear function Eq. (3), by replacing the and with log and . The best-fit result is plotted as the solid line in Fig.7. The correlation is broken at the luminosity , below which the slope is , and above which the slope is 0.29. The Spearman coefficients of the correlation for the data below and above this broken luminosity are -0.30 and 0.39 at the significances of 1.43 and 1.91 , respectively. Due to the larger scatter between different sources, the negative/positive correlation below/above the broken luminosity are not very significant. This is consistent with previous studies on AGNs and BHXRBs (Wu & Gu, 2008; Yang et al., 2015; Yan et al., 2020).
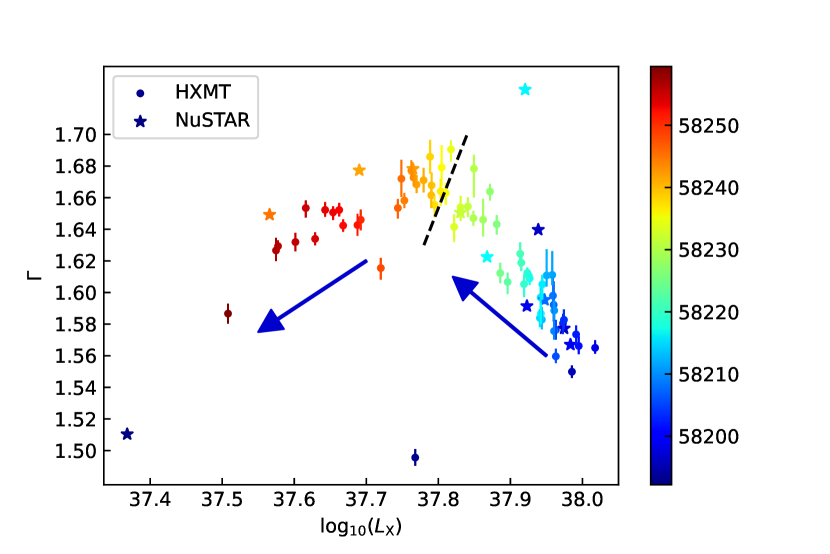
In Fig. 8, we plot the estimates and log () from both this work and You et al. (2021), for MAXI J1820+070. Meanwhile, we associate each data point with the corresponding MJD, indicated as the color bar on the right. It can be seen that the NuSTAR results are consistent with the Insight-HXMT ones. More importantly, we notice an interesting “”-shaped correlation between the photon index and log, as the luminosity decreases by a factor of 3 in the narrow range from to . More specifically, firstly increases as decreases. But, after around MJD = 58250 (see the dashed line in Fig. 8), starts to decrease as continually decreases. We note that Wang et al. (2020b) studied the evolution of the temporal properties of MAXI J1820+070 over the same time with Insight-HXMT data sets. They also found the different behaviors of the HR, the fractional rms, and time lag before and after MJD 58,257, which suggests a transition occurred around this point.
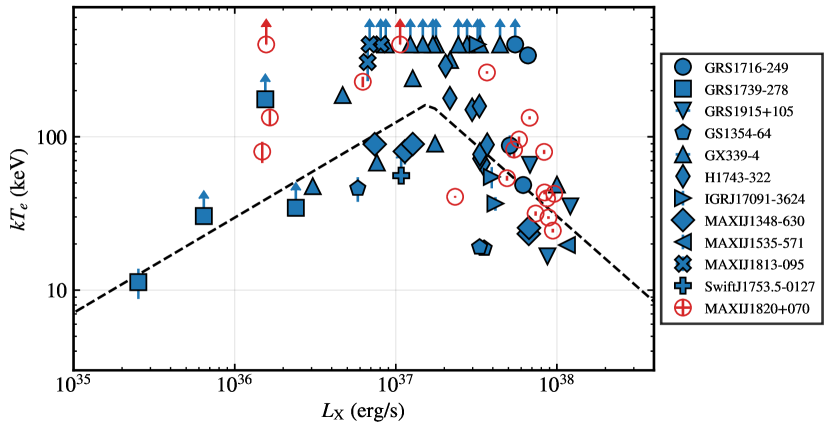
4.2.2 - Correlation
It was also found that there is a “”-shaped correlation between the electron temperature and log (Yan et al., 2020). Note that Yan et al. (2020) were not aimed at deriving the exact value of , but instead at the trend of the - correlation. So the spectral fitting was simply carried out by the use of the Comptonization model (nthcomp) without considering the role of the reflection component. This is acceptable for the low-luminosity regime , since the reflection emission in this case is systematically weak (Fürst et al., 2016; Beri et al., 2019). However, the estimate of is probably affected by the relativistic reflection components, for the high-luminosity regime , which is covered by the sample in this work (Fabian et al., 2015; García et al., 2015a). Therefore, it is essential for us to revisit the - correlation using the measurements from the spectral fitting with the relativistic reflection model. We plot the and derived from the spectral fitting with the reflection model in Fig.9, which appear to still display the “”-shaped correlation between them. We fit the correlation with the broken linear function Eq. (3), by replacing the and with log and and excluding all the lower limits of . The best-fitting result is plotted as the dashed line. The correlation is broken at the luminosity log, below which the slope is 0.62, and above which the correlation is . The Spearman coefficients of the correlation for the data below and above this broken luminosity are 0.50 and -0.61 at the significances of 1.42 and 3.16 , respectively. This is qualitatively consistent with previous studies on BHXRBs (Yan et al., 2020).
5 Conclusions
In this work, we systematically study the evolution of the primary X-ray and the reflection component, for the NuSTAR sample of LMXBs in the hard state. The photon index and the reflection fraction are well constrained. We find that is positively correlated with for the sample except for MAXI J1820+070. The positive correlation is in consistent with previous studies of LMXBs (Ueda et al., 1994; Zdziarski et al., 1999; Steiner et al., 2016) and AGNs (Diaz et al., 2020; Draghis et al., 2020; Connors et al., 2021). The - correlation could be explained in the scenarios of both the truncated disk and the outflowing X-ray source. Then we calculate the X-ray luminosity of the reflection model between 3 and 78 keV. It is interesting that there is a strong positive correlation between and the X-ray luminosity for BHXRBs in the hard state, which puts a constraint on the disk-corona coupling and the evolution. Moreover, We report “V”-shaped correlation between and log and “”-shaped correlation between and log, which is in agreement with previous results. Combining the NuSTAR and Insight-HXMT results which obtained from (You et al., 2021), we find a negative correlation and a “”-shaped correlation between and log for MAXI J1820+070 in the bright hard state. The physical mechanism behind the particular behavior of MAXI J1820+070 is unknown. It challenges our knowledge of the accretion flow of black hole binary, and needs further exploration in the future.
References
- Aramburu Sanchez et al. (2020) Aramburu Sanchez, P., Neilsen, J., & Steiner, J. 2020, in American Astronomical Society Meeting Abstracts, Vol. 235, American Astronomical Society Meeting Abstracts #235, 369.14
- Arnaud (1996) Arnaud, K. A. 1996, in ASP Conf. Ser., Vol. 101, Astronomical Data Analysis Software and Systems V, ed. G. H. Jacoby & J. Barnes, 17
- Atri et al. (2020) Atri, P., Miller-Jones, J. C. A., Bahramian, A., et al. 2020, MNRAS, 493, L81, doi: 10.1093/mnrasl/slaa010
- Bambi et al. (2017) Bambi, C., Cárdenas-Avendaño, A., Dauser, T., García, J. A., & Nampalliwar, S. 2017, ApJ, 842, 76, doi: 10.3847/1538-4357/aa74c0
- Beloborodov (1999) Beloborodov, A. M. 1999, The Astrophysical Journal, 510, L123, doi: 10.1086/311810
- Beri et al. (2019) Beri, A., Tetarenko, B. E., Bahramian, A., et al. 2019, MNRAS, 485, 3064, doi: 10.1093/mnras/stz616
- Bharali et al. (2019) Bharali, P., Chandra, S., Chauhan, J., et al. 2019, MNRAS, 487, 3150, doi: 10.1093/mnras/stz1492
- Brenneman & Reynolds (2006) Brenneman, L. W., & Reynolds, C. S. 2006, ApJ, 652, 1028, doi: 10.1086/508146
- Buisson et al. (2019) Buisson, D. J. K., Fabian, A. C., Barret, D., et al. 2019, MNRAS, 490, 1350, doi: 10.1093/mnras/stz2681
- Casares et al. (2009) Casares, J., Orosz, J. A., Zurita, C., et al. 2009, ApJS, 181, 238, doi: 10.1088/0067-0049/181/1/238
- Chakraborty et al. (2021) Chakraborty, S., Ratheesh, A., Bhattacharyya, S., et al. 2021, MNRAS, 508, 475, doi: 10.1093/mnras/stab2530
- Chand et al. (2020) Chand, S., Agrawal, V. K., Dewangan, G. C., Tripathi, P., & Thakur, P. 2020, ApJ, 893, 142, doi: 10.3847/1538-4357/ab829a
- Chauhan et al. (2019) Chauhan, J., Miller-Jones, J. C. A., Anderson, G. E., et al. 2019, MNRAS, 488, L129, doi: 10.1093/mnrasl/slz113
- Chauhan et al. (2021) Chauhan, J., Miller-Jones, J. C. A., Raja, W., et al. 2021, MNRAS, 501, L60, doi: 10.1093/mnrasl/slaa195
- Connors et al. (2021) Connors, R., García, J., Tomsick, J., et al. 2021, arXiv e-prints, arXiv:2101.06343. https://arxiv.org/abs/2101.06343
- Curran (2014) Curran, P. A. 2014, ArXiv e-prints, 1411, arXiv:1411.3816. http://adsabs.harvard.edu/abs/2014arXiv1411.3816C
- Dauser et al. (2014) Dauser, T., García, J., Parker, M. L., Fabian, A. C., & Wilms, J. 2014, MNRAS, 444, L100, doi: 10.1093/mnrasl/slu125
- Dauser et al. (2016) Dauser, T., García, J., Walton, D. J., et al. 2016, A&A, 590, A76, doi: 10.1051/0004-6361/201628135
- De Marco et al. (2021) De Marco, B., Zdziarski, A. A., Ponti, G., et al. 2021, A&A, 654, A14, doi: 10.1051/0004-6361/202140567
- De Marco et al. (2017) De Marco, B., Ponti, G., Petrucci, P. O., et al. 2017, MNRAS, 471, 1475, doi: 10.1093/mnras/stx1649
- Diaz et al. (2020) Diaz, Y., Arévalo, P., Hernández-García, L., et al. 2020, MNRAS, 496, 5399, doi: 10.1093/mnras/staa1762
- Done et al. (2007) Done, C., Gierliński, M., & Kubota, A. 2007, A&A Rev., 15, 1, doi: 10.1007/s00159-007-0006-1
- Dong et al. (2022) Dong, Y., Liu, Z., Tuo, Y., et al. 2022, MNRAS, 514, 1422, doi: 10.1093/mnras/stac1466
- Draghis et al. (2020) Draghis, P. A., Miller, J. M., Cackett, E. M., et al. 2020, ApJ, 900, 78, doi: 10.3847/1538-4357/aba2ec
- El-Batal et al. (2016) El-Batal, A. M., Miller, J. M., Reynolds, M. T., et al. 2016, ApJ, 826, L12, doi: 10.3847/2041-8205/826/1/L12
- Esin et al. (1997) Esin, A. A., McClintock, J. E., & Narayan, R. 1997, ApJ, 489, 865, doi: 10.1086/304829
- Ezhikode et al. (2020) Ezhikode, S. H., Dewangan, G. C., Misra, R., & Philip, N. S. 2020, MNRAS, 495, 3373, doi: 10.1093/mnras/staa1288
- Fabian et al. (2015) Fabian, A. C., Lohfink, A., Kara, E., et al. 2015, MNRAS, 451, 4375, doi: 10.1093/mnras/stv1218
- Feng et al. (2022) Feng, Y., Zhao, X., Gou, L., et al. 2022, Science China Physics, Mechanics, and Astronomy, 65, 219512, doi: 10.1007/s11433-021-1790-7
- Foreman-Mackey et al. (2013) Foreman-Mackey, D., Hogg, D. W., Lang, D., & Goodman, J. 2013, PASP, 125, 306, doi: 10.1086/670067
- Fürst et al. (2015) Fürst, F., Nowak, M. A., Tomsick, J. A., et al. 2015, ApJ, 808, 122, doi: 10.1088/0004-637X/808/2/122
- Fürst et al. (2016) Fürst, F., Tomsick, J. A., Yamaoka, K., et al. 2016, ApJ, 832, 115, doi: 10.3847/0004-637X/832/2/115
- Gandhi et al. (2019) Gandhi, P., Rao, A., Johnson, M. A. C., Paice, J. A., & Maccarone, T. J. 2019, MNRAS, 485, 2642, doi: 10.1093/mnras/stz438
- García et al. (2013) García, J., Dauser, T., Reynolds, C. S., et al. 2013, ApJ, 768, 146, doi: 10.1088/0004-637X/768/2/146
- García et al. (2014) García, J., Dauser, T., Lohfink, A., et al. 2014, ApJ, 782, 76, doi: 10.1088/0004-637X/782/2/76
- García et al. (2015a) García, J. A., Dauser, T., Steiner, J. F., et al. 2015a, ApJ, 808, L37, doi: 10.1088/2041-8205/808/2/L37
- García et al. (2015b) García, J. A., Steiner, J. F., McClintock, J. E., et al. 2015b, ApJ, 813, 84, doi: 10.1088/0004-637X/813/2/84
- García et al. (2019) García, J. A., Tomsick, J. A., Sridhar, N., et al. 2019, ApJ, 885, 48, doi: 10.3847/1538-4357/ab384f
- George & Fabian (1991) George, I. M., & Fabian, A. C. 1991, MNRAS, 249, 352, doi: 10.1093/mnras/249.2.352
- Gilfanov et al. (1999) Gilfanov, M., Churazov, E., & Revnivtsev, M. 1999, A&A, 352, 182. https://arxiv.org/abs/astro-ph/9910084
- Harrison et al. (2013) Harrison, F. A., Craig, W. W., Christensen, F. E., et al. 2013, ApJ, 770, 103, doi: 10.1088/0004-637X/770/2/103
- Heida et al. (2017) Heida, M., Jonker, P. G., Torres, M. A. P., & Chiavassa, A. 2017, ApJ, 846, 132, doi: 10.3847/1538-4357/aa85df
- Ingram et al. (2016) Ingram, A., van der Klis, M., Middleton, M., et al. 2016, MNRAS, 461, 1967, doi: 10.1093/mnras/stw1245
- Iyer et al. (2015) Iyer, N., Nandi, A., & Mandal, S. 2015, ApJ, 807, 108, doi: 10.1088/0004-637X/807/1/108
- Jana et al. (2021) Jana, A., Jaisawal, G. K., Naik, S., et al. 2021, Research in Astronomy and Astrophysics, 21, 125, doi: 10.1088/1674-4527/21/5/125
- Jia et al. (2022) Jia, N., Zhao, X., Gou, L., et al. 2022, MNRAS, 511, 3125, doi: 10.1093/mnras/stac121
- Jiang et al. (2019) Jiang, J., Fabian, A. C., Wang, J., et al. 2019, MNRAS, 484, 1972, doi: 10.1093/mnras/stz095
- Jiang et al. (2020) Jiang, J., Fürst, F., Walton, D. J., Parker, M. L., & Fabian, A. C. 2020, MNRAS, 492, 1947, doi: 10.1093/mnras/staa017
- Jiang et al. (2022) Jiang, J., Buisson, D. J. K., Dauser, T., et al. 2022, MNRAS, 514, 1952, doi: 10.1093/mnras/stac1401
- Kang et al. (2020) Kang, J., Wang, J., & Kang, W. 2020, ApJ, 901, 111, doi: 10.3847/1538-4357/abadf5
- Kara et al. (2019) Kara, E., Steiner, J. F., Fabian, A. C., et al. 2019, Nature, 565, 198, doi: 10.1038/s41586-018-0803-x
- Kawamura et al. (2022) Kawamura, T., Axelsson, M., Done, C., & Takahashi, T. 2022, MNRAS, 511, 536, doi: 10.1093/mnras/stac045
- Kelly (2007) Kelly, B. C. 2007, ApJ, 665, 1489, doi: 10.1086/519947
- Klepczarek et al. (2023) Klepczarek, Ł., Niedźwiecki, A., & Szanecki, M. 2023, MNRAS, 519, L79, doi: 10.1093/mnrasl/slac156
- Koljonen & Tomsick (2020) Koljonen, K. I. I., & Tomsick, J. A. 2020, A&A, 639, A13, doi: 10.1051/0004-6361/202037882
- Kubota & Makishima (2004) Kubota, A., & Makishima, K. 2004, ApJ, 601, 428, doi: 10.1086/380433
- Kubota et al. (1998) Kubota, A., Tanaka, Y., Makishima, K., et al. 1998, PASJ, 50, 667, doi: 10.1093/pasj/50.6.667
- Liu & Qiao (2022) Liu, B. F., & Qiao, E. 2022, iSci, 25, 103544, doi: 10.1016/j.isci.2021.103544
- Madsen et al. (2020) Madsen, K. K., Grefenstette, B. W., Pike, S., et al. 2020, arXiv e-prints, arXiv:2005.00569. https://arxiv.org/abs/2005.00569
- Mahmoud & Done (2018) Mahmoud, R. D., & Done, C. 2018, MNRAS, 480, 4040, doi: 10.1093/mnras/sty2133
- Marino et al. (2021) Marino, A., Barnier, S., Petrucci, P. O., et al. 2021, A&A, 656, A63, doi: 10.1051/0004-6361/202141146
- Miller et al. (2013) Miller, J. M., Parker, M. L., Fuerst, F., et al. 2013, ApJ, 775, L45, doi: 10.1088/2041-8205/775/2/L45
- Miller et al. (2015) Miller, J. M., Tomsick, J. A., Bachetti, M., et al. 2015, The Astrophysical Journal, 799, L6, doi: 10.1088/2041-8205/799/1/l6
- Muñoz-Darias et al. (2013) Muñoz-Darias, T., Coriat, M., Plant, D. S., et al. 2013, MNRAS, 432, 1330, doi: 10.1093/mnras/stt546
- Neustroev et al. (2014) Neustroev, V. V., Veledina, A., Poutanen, J., et al. 2014, MNRAS, 445, 2424, doi: 10.1093/mnras/stu1924
- Panagiotou & Walter (2020) Panagiotou, C., & Walter, R. 2020, A&A, 640, A31, doi: 10.1051/0004-6361/201937390
- Plant et al. (2014) Plant, D. S., Fender, R. P., Ponti, G., Muñoz-Darias, T., & Coriat, M. 2014, MNRAS, 442, 1767, doi: 10.1093/mnras/stu867
- Plant et al. (2015) —. 2015, A&A, 573, A120, doi: 10.1051/0004-6361/201423925
- Ponti et al. (2012) Ponti, G., Fender, R. P., Begelman, M. C., et al. 2012, MNRAS, 422, L11, doi: 10.1111/j.1745-3933.2012.01224.x
- Poutanen et al. (2018) Poutanen, J., Veledina, A., & Zdziarski, A. A. 2018, A&A, 614, A79, doi: 10.1051/0004-6361/201732345
- Poutanen et al. (2022) Poutanen, J., Veledina, A., Berdyugin, A. V., et al. 2022, Science, 375, 874, doi: 10.1126/science.abl4679
- Prabhakar et al. (2022) Prabhakar, G., Mandal, S., Athulya, M. P., & Nandi, A. 2022, MNRAS, 514, 6102, doi: 10.1093/mnras/stac1176
- Qiao & Liu (2012) Qiao, E., & Liu, B. F. 2012, ApJ, 744, 145, doi: 10.1088/0004-637X/744/2/145
- Qiao & Liu (2017) —. 2017, MNRAS, 467, 898, doi: 10.1093/mnras/stx121
- Reid et al. (2014) Reid, M. J., McClintock, J. E., Steiner, J. F., et al. 2014, ApJ, 796, 2, doi: 10.1088/0004-637X/796/1/2
- Revnivtsev et al. (2001) Revnivtsev, M., Gilfanov, M., & Churazov, E. 2001, A&A, 380, 520, doi: 10.1051/0004-6361:20011413
- Ross & Fabian (2005) Ross, R. R., & Fabian, A. C. 2005, MNRAS, 358, 211, doi: 10.1111/j.1365-2966.2005.08797.x
- Rout et al. (2022) Rout, S. K., Vadawale, S., Garcia, J., & Connors, R. 2022, arXiv e-prints, arXiv:2212.05293. https://arxiv.org/abs/2212.05293
- Saikia et al. (2022) Saikia, P., Russell, D. M., Baglio, M. C., et al. 2022, ApJ, 932, 38, doi: 10.3847/1538-4357/ac6ce1
- Shaw et al. (2016a) Shaw, A. W., Charles, P. A., Casares, J., & Hernández Santisteban, J. V. 2016a, MNRAS, 463, 1314, doi: 10.1093/mnras/stw2092
- Shaw et al. (2016b) Shaw, A. W., Gandhi, P., Altamirano, D., et al. 2016b, MNRAS, 458, 1636, doi: 10.1093/mnras/stw417
- Shreeram & Ingram (2020) Shreeram, S., & Ingram, A. 2020, MNRAS, 492, 405, doi: 10.1093/mnras/stz3455
- Sridhar et al. (2020) Sridhar, N., García, J. A., Steiner, J. F., et al. 2020, ApJ, 890, 53, doi: 10.3847/1538-4357/ab64f5
- Steiner et al. (2012) Steiner, J. F., McClintock, J. E., & Reid, M. J. 2012, ApJ, 745, L7, doi: 10.1088/2041-8205/745/1/L7
- Steiner et al. (2016) Steiner, J. F., Remillard, R. A., García, J. A., & McClintock, J. E. 2016, ApJ, 829, L22, doi: 10.3847/2041-8205/829/2/L22
- Stiele & Kong (2021) Stiele, H., & Kong, A. K. H. 2021, ApJ, 914, 93, doi: 10.3847/1538-4357/abfaa5
- Torres et al. (2020) Torres, M. A. P., Casares, J., Jiménez-Ibarra, F., et al. 2020, ApJ, 893, L37, doi: 10.3847/2041-8213/ab863a
- Tripathi et al. (2021) Tripathi, A., Zhang, Y., Abdikamalov, A. B., et al. 2021, ApJ, 913, 79, doi: 10.3847/1538-4357/abf6cd
- Ueda et al. (1994) Ueda, Y., Ebisawa, K., & Done, C. 1994, PASJ, 46, 107
- Uttley et al. (2018) Uttley, P., Gendreau, K., Markwardt, C., et al. 2018, The Astronomer’s Telegram, 11423, 1
- Walton et al. (2017) Walton, D. J., Mooley, K., King, A. L., et al. 2017, ApJ, 839, 110, doi: 10.3847/1538-4357/aa67e8
- Wang et al. (2020a) Wang, J., Kara, E., Steiner, J. F., et al. 2020a, ApJ, 899, 44, doi: 10.3847/1538-4357/ab9ec3
- Wang et al. (2022) Wang, P. J., Kong, L. D., Chen, Y. P., et al. 2022, MNRAS, 512, 4541, doi: 10.1093/mnras/stac773
- Wang et al. (2020b) Wang, Y., Ji, L., Zhang, S. N., et al. 2020b, ApJ, 896, 33, doi: 10.3847/1538-4357/ab8db4
- Wang-Ji et al. (2018) Wang-Ji, J., García, J. A., Steiner, J. F., et al. 2018, ApJ, 855, 61, doi: 10.3847/1538-4357/aaa974
- Wilms et al. (2000) Wilms, J., Allen, A., & McCray, R. 2000, ApJ, 542, 914, doi: 10.1086/317016
- Wu & Gu (2008) Wu, Q., & Gu, M. 2008, ApJ, 682, 212, doi: 10.1086/588187
- Xu et al. (2018a) Xu, Y., Nampalliwar, S., Abdikamalov, A. B., et al. 2018a, ApJ, 865, 134, doi: 10.3847/1538-4357/aadb9d
- Xu et al. (2017) Xu, Y., García, J. A., Fürst, F., et al. 2017, ApJ, 851, 103, doi: 10.3847/1538-4357/aa9ab4
- Xu et al. (2018b) Xu, Y., Harrison, F. A., García, J. A., et al. 2018b, ApJ, 852, L34, doi: 10.3847/2041-8213/aaa4b2
- Yamaoka et al. (2005) Yamaoka, K., Uzawa, M., Arai, M., Yamazaki, T., & Yoshida, A. 2005, Chinese Journal of Astronomy and Astrophysics Supplement, 5, 273
- Yan et al. (2020) Yan, Z., Xie, F.-G., & Zhang, W. 2020, ApJ, 889, L18, doi: 10.3847/2041-8213/ab665e
- Yan & Yu (2017) Yan, Z., & Yu, W. 2017, MNRAS, 470, 4298, doi: 10.1093/mnras/stx1562
- Yang et al. (2015) Yang, Q.-X., Xie, F.-G., Yuan, F., et al. 2015, MNRAS, 447, 1692, doi: 10.1093/mnras/stu2571
- You et al. (2012) You, B., Cao, X., & Yuan, Y.-F. 2012, ApJ, 761, 109, doi: 10.1088/0004-637X/761/2/109
- You et al. (2021) You, B., Tuo, Y., Li, C., et al. 2021, Nature Communications, 12, 1025, doi: 10.1038/s41467-021-21169-5
- Yuan & Narayan (2014) Yuan, F., & Narayan, R. 2014, ARA&A, 52, 529, doi: 10.1146/annurev-astro-082812-141003
- Zdziarski et al. (2021a) Zdziarski, A. A., Dziełak, M. A., De Marco, B., Szanecki, M., & Niedźwiecki, A. 2021a, ApJ, 909, L9, doi: 10.3847/2041-8213/abe7ef
- Zdziarski et al. (1996) Zdziarski, A. A., Johnson, W. N., & Magdziarz, P. 1996, MNRAS, 283, 193, doi: 10.1093/mnras/283.1.193
- Zdziarski et al. (1999) Zdziarski, A. A., Lubiński, P., & Smith, D. A. 1999, MNRAS, 303, L11, doi: 10.1046/j.1365-8711.1999.02343.x
- Zdziarski et al. (2022a) Zdziarski, A. A., You, B., & Szanecki, M. 2022a, ApJ, 939, L2, doi: 10.3847/2041-8213/ac9474
- Zdziarski et al. (2022b) Zdziarski, A. A., You, B., Szanecki, M., Li, X.-B., & Ge, M. 2022b, ApJ, 928, 11, doi: 10.3847/1538-4357/ac54a7
- Zdziarski et al. (2019) Zdziarski, A. A., Ziółkowski, J., & Mikołajewska, J. 2019, MNRAS, 488, 1026, doi: 10.1093/mnras/stz1787
- Zdziarski et al. (2021b) Zdziarski, A. A., Jourdain, E., Lubiński, P., et al. 2021b, ApJ, 914, L5, doi: 10.3847/2041-8213/ac0147
- Zhang et al. (2019a) Zhang, Y., Abdikamalov, A. B., Ayzenberg, D., et al. 2019a, ApJ, 875, 41, doi: 10.3847/1538-4357/ab0e79
- Zhang et al. (2019b) Zhang, Y., Abdikamalov, A. B., Ayzenberg, D., Bambi, C., & Nampalliwar, S. 2019b, ApJ, 884, 147, doi: 10.3847/1538-4357/ab4271
| Source | ObsID | Detector | MJD | Exp. | Counts (s-1) | HR |
|---|---|---|---|---|---|---|
| GRS 1716-249 | 80201034006 | FPMA | 57758.50 | 6046.56 | 113.90 0.14 | 0.47 |
| FPMB | 57758.50 | 6134.49 | 108.20 0.13 | 0.46 | ||
| 80201034007 | FPMA | 57781.32 | 42465.19 | 129.50 0.06 | 0.48 | |
| FPMB | 57781.32 | 43515.15 | 119.30 0.05 | 0.47 | ||
| 90202055002 | FPMA | 57850.61 | 17897.52 | 125.40 0.08 | 0.40 | |
| FPMB | 57850.61 | 18259.78 | 115.70 0.08 | 0.39 | ||
| 90202055004 | FPMA | 57853.70 | 15797.47 | 121.70 0.09 | 0.38 | |
| FPMB | 57853.70 | 16100.69 | 112.70 0.08 | 0.36 | ||
| GRS 1739-278 | 80101050002 | FPMA | 57280.89 | 41241.62 | 0.35 0.00 | 0.50 |
| FPMB | 57280.89 | 40965.48 | 0.38 0.00 | 0.43 | ||
| 80102101002 | FPMA | 57660.89 | 26310.03 | 3.14 0.01 | 0.49 | |
| FPMB | 57660.89 | 26102.79 | 3.00 0.01 | 0.47 | ||
| 80102101004 | FPMA | 57680.63 | 25897.14 | 0.88 0.01 | 0.49 | |
| FPMB | 57680.63 | 25703.41 | 0.88 0.01 | 0.46 | ||
| 80102101005 | FPMA | 57692.85 | 27021.16 | 1.93 0.01 | 0.49 | |
| FPMB | 57692.85 | 26903.39 | 1.78 0.01 | 0.47 | ||
| GRS 1915+105 | 10002004001 | FPMA | 56111.06 | 14696.17 | 195.00 0.12 | 0.32 |
| FPMB | 56111.06 | 15114.49 | 181.70 0.11 | 0.32 | ||
| 80401312002 | FPMA | 58277.51 | 26167.74 | 82.96 0.06 | 0.33 | |
| FPMB | 58277.51 | 26396.31 | 76.44 0.05 | 0.32 | ||
| 90202045002 | FPMA | 57806.17 | 13903.36 | 169.20 0.11 | 0.31 | |
| FPMB | 57806.17 | 14093.44 | 158.60 0.11 | 0.30 | ||
| GS 1354-64 | 90101006002 | FPMA | 57186.30 | 24021.18 | 6.94 0.02 | 0.60 |
| FPMB | 57186.30 | 23694.70 | 6.37 0.02 | 0.58 | ||
| 90101006004 | FPMA | 57214.59 | 28797.52 | 48.24 0.04 | 0.52 | |
| FPMB | 57214.59 | 28624.73 | 44.72 0.04 | 0.50 | ||
| 90101006006 | FPMA | 57240.31 | 34965.82 | 54.92 0.04 | 0.47 | |
| FPMB | 57240.31 | 35030.46 | 51.89 0.04 | 0.46 | ||
| GX 339-4 | 80001013002 | FPMA | 56516.01 | 35090.43 | 10.41 0.02 | 0.53 |
| FPMB | 56516.01 | 35098.32 | 10.15 0.02 | 0.52 | ||
| 80001013004 | FPMA | 56520.75 | 20794.25 | 17.41 0.03 | 0.53 | |
| FPMB | 56520.75 | 20834.18 | 16.42 0.03 | 0.52 | ||
| 80001013006 | FPMA | 56528.54 | 23152.06 | 27.74 0.03 | 0.52 | |
| FPMB | 56528.54 | 23244.36 | 26.10 0.03 | 0.51 | ||
| 80001013008 | FPMA | 56538.44 | 43189.25 | 36.39 0.03 | 0.51 | |
| FPMB | 56538.44 | 43438.82 | 34.54 0.03 | 0.50 | ||
| 80001013010 | FPMA | 56582.00 | 97569.81 | 6.16 0.01 | 0.50 | |
| FPMB | 56582.00 | 97944.22 | 5.87 0.01 | 0.49 | ||
| 80001015001 | FPMA | 57035.24 | 10377.22 | 103.70 0.10 | 0.38 | |
| FPMB | 57035.24 | 10549.82 | 96.38 0.10 | 0.37 | ||
| 80102011002 | FPMA | 57262.56 | 18249.12 | 18.76 0.03 | 0.39 | |
| FPMB | 57262.56 | 17658.19 | 17.54 0.03 | 0.38 | ||
| 80102011004 | FPMA | 57267.53 | 17370.83 | 16.44 0.03 | 0.45 | |
| FPMB | 57267.53 | 17202.23 | 15.33 0.03 | 0.44 | ||
| 80102011006 | FPMA | 57272.63 | 16239.13 | 13.87 0.03 | 0.47 | |
| FPMB | 57272.63 | 16091.85 | 13.03 0.03 | 0.45 | ||
| 80102011010 | FPMA | 57282.43 | 35689.01 | 7.70 0.01 | 0.49 | |
| FPMB | 57282.43 | 35563.32 | 7.27 0.01 | 0.47 | ||
| 80102011012 | FPMA | 57295.06 | 41332.23 | 4.15 0.01 | 0.48 | |
| FPMB | 57295.06 | 41322.83 | 3.87 0.01 | 0.46 | ||
| 80302304002 | FPMA | 58028.15 | 20523.68 | 2.38 0.01 | 0.48 | |
| FPMB | 58028.15 | 20767.70 | 2.23 0.01 | 0.46 | ||
| 80302304004 | FPMA | 58051.58 | 17046.56 | 21.97 0.04 | 0.51 | |
| FPMB | 58051.58 | 16956.34 | 20.58 0.04 | 0.50 | ||
| 80302304005 | FPMA | 58059.90 | 18515.38 | 19.72 0.03 | 0.51 | |
| FPMB | 58059.90 | 18534.54 | 18.39 0.03 | 0.49 | ||
| 80502325008 | FPMA | 58959.06 | 22397.06 | 10.33 0.02 | 0.44 | |
| FPMB | 58959.06 | 22166.46 | 9.57 0.02 | 0.43 | ||
| 90401369004 | FPMA | 58488.63 | 3621.66 | 13.05 0.06 | 0.52 | |
| FPMB | 58488.63 | 3616.51 | 12.04 0.06 | 0.50 | ||
| H1743-322 | 80001044002 | FPMA | 56918.66 | 50252.45 | 26.22 0.02 | 0.57 |
| FPMB | 56918.66 | 50387.07 | 25.39 0.02 | 0.55 | ||
| 80001044004 | FPMA | 56923.77 | 61278.07 | 34.86 0.02 | 0.54 | |
| FPMB | 56923.77 | 61339.79 | 33.88 0.02 | 0.53 | ||
| 80001044006 | FPMA | 56939.78 | 25666.98 | 31.02 0.03 | 0.55 | |
| FPMB | 56939.78 | 25721.70 | 29.17 0.03 | 0.53 | ||
| 80002040002 | FPMA | 57206.13 | 27418.52 | 18.02 0.03 | 0.56 | |
| FPMB | 57206.13 | 27603.63 | 16.53 0.02 | 0.54 | ||
| 80202012002 | FPMA | 57460.07 | 65869.27 | 38.61 0.02 | 0.44 | |
| FPMB | 57460.07 | 66283.17 | 36.43 0.02 | 0.43 | ||
| 80202012004 | FPMA | 57462.29 | 64870.79 | 37.00 0.02 | 0.44 | |
| FPMB | 57462.29 | 65040.59 | 34.68 0.02 | 0.43 | ||
| 80202012006 | FPMA | 58387.37 | 65702.67 | 20.10 0.02 | 0.54 | |
| FPMB | 58387.37 | 65610.73 | 18.99 0.02 | 0.53 | ||
| 90401335002 | FPMA | 58380.12 | 38443.65 | 32.36 0.03 | 0.52 | |
| FPMB | 58380.12 | 38425.23 | 30.52 0.03 | 0.51 | ||
| IGR J17091-3624 | 80001041002 | FPMA | 57454.09 | 43297.76 | 15.80 0.02 | 0.52 |
| FPMB | 57454.09 | 42957.81 | 14.75 0.02 | 0.51 | ||
| 80202014002 | FPMA | 57459.60 | 20239.92 | 20.64 0.03 | 0.50 | |
| FPMB | 57459.60 | 20278.74 | 19.23 0.03 | 0.48 | ||
| 80202014004 | FPMA | 57461.81 | 20700.15 | 22.79 0.03 | 0.48 | |
| FPMB | 57461.81 | 20515.16 | 21.24 0.03 | 0.46 | ||
| MAXI J1348-630 | 80402315002 | FPMA | 58515.13 | 3038.04 | 1043.00 0.59 | 0.43 |
| FPMB | 58515.13 | 3208.37 | 906.00 0.53 | 0.42 | ||
| 80402315004 | FPMA | 58515.60 | 736.34 | 1048.00 1.20 | 0.42 | |
| FPMB | 58515.60 | 778.54 | 911.50 1.09 | 0.42 | ||
| 80502304002 | FPMA | 58655.40 | 13783.86 | 186.80 0.12 | 0.45 | |
| FPMB | 58655.40 | 14172.58 | 172.20 0.11 | 0.44 | ||
| 80502304004 | FPMA | 58660.50 | 15367.24 | 161.90 0.10 | 0.47 | |
| FPMB | 58660.50 | 15773.25 | 149.50 0.10 | 0.46 | ||
| 80502304006 | FPMA | 58672.38 | 17181.65 | 107.60 0.08 | 0.48 | |
| FPMB | 58672.38 | 17460.58 | 100.00 0.08 | 0.47 | ||
| MAXI J1535-571 | 90301013002 | FPMA | 58003.79 | 10142.25 | 609.40 0.25 | 0.41 |
| FPMB | 58003.79 | 10670.31 | 549.40 0.23 | 0.40 | ||
| MAXI J1813-095 | 80402303002 | FPMA | 58177.50 | 20546.62 | 16.18 0.03 | 0.50 |
| FPMB | 58177.50 | 20002.84 | 15.16 0.03 | 0.49 | ||
| 80402303004 | FPMA | 58183.60 | 20433.92 | 13.43 0.03 | 0.49 | |
| FPMB | 58183.60 | 20346.84 | 12.69 0.03 | 0.49 | ||
| 80402303006 | FPMA | 58202.73 | 23238.40 | 14.52 0.03 | 0.46 | |
| FPMB | 58202.73 | 23099.06 | 13.66 0.02 | 0.45 | ||
| MAXI J1820+070 | 90401309002 | FPMA | 58191.94 | 11769.40 | 178.90 0.12 | 0.56 |
| FPMB | 58191.94 | 11980.90 | 169.90 0.12 | 0.55 | ||
| 90401309004 | FPMA | 58198.04 | 2760.78 | 735.20 0.52 | 0.49 | |
| FPMB | 58198.04 | 2876.89 | 663.50 0.48 | 0.48 | ||
| 90401309006 | FPMA | 58198.30 | 4539.90 | 761.20 0.41 | 0.49 | |
| FPMB | 58198.30 | 4762.39 | 681.20 0.38 | 0.48 | ||
| 90401309008 | FPMA | 58201.53 | 3046.06 | 776.90 0.51 | 0.48 | |
| FPMB | 58201.53 | 3214.09 | 689.60 0.47 | 0.47 | ||
| 90401309010 | FPMA | 58201.86 | 2660.36 | 782.70 0.54 | 0.48 | |
| FPMB | 58201.86 | 2801.44 | 697.00 0.50 | 0.47 | ||
| 90401309012 | FPMA | 58212.20 | 12334.25 | 695.40 0.24 | 0.47 | |
| FPMB | 58212.20 | 12964.31 | 624.30 0.22 | 0.46 | ||
| 90401309013 | FPMA | 58224.95 | 1834.38 | 672.60 0.61 | 0.46 | |
| FPMB | 58224.95 | 1934.06 | 597.70 0.59 | 0.45 | ||
| 90401309014 | FPMA | 58225.29 | 9208.80 | 677.90 0.27 | 0.46 | |
| FPMB | 58225.29 | 9708.55 | 603.80 0.25 | 0.45 | ||
| 90401309016 | FPMA | 58241.80 | 13792.23 | 572.90 0.21 | 0.43 | |
| FPMB | 58241.80 | 14431.53 | 514.60 0.21 | 0.42 | ||
| 90401309018 | FPMA | 58255.16 | 2733.45 | 504.50 0.48 | 0.42 | |
| FPMB | 58255.16 | 2879.63 | 457.10 0.40 | 0.41 | ||
| 90401309019 | FPMA | 58255.63 | 9444.10 | 503.40 0.25 | 0.42 | |
| FPMB | 58255.63 | 9938.34 | 455.80 0.21 | 0.41 | ||
| 90401309021 | FPMA | 58297.17 | 21867.83 | 301.10 0.12 | 0.43 | |
| FPMB | 58297.17 | 22852.97 | 272.20 0.11 | 0.42 | ||
| 90401309033 | FPMA | 58388.92 | 24892.60 | 124.20 0.07 | 0.31 | |
| FPMB | 58388.92 | 25342.94 | 116.50 0.07 | 0.31 | ||
| 90401309035 | FPMA | 58397.30 | 18569.88 | 53.27 0.05 | 0.44 | |
| FPMB | 58397.30 | 18640.73 | 50.71 0.05 | 0.44 | ||
| 90401309037 | FPMA | 58404.95 | 37682.99 | 14.04 0.02 | 0.42 | |
| FPMB | 58404.95 | 37608.34 | 13.18 0.02 | 0.41 | ||
| 90401324002 | FPMA | 58259.25 | 6570.79 | 486.70 0.27 | 0.42 | |
| FPMB | 58259.25 | 6931.40 | 438.00 0.25 | 0.41 | ||
| 90501311002 | FPMA | 58567.83 | 28666.65 | 13.82 0.02 | 0.43 | |
| FPMB | 58567.83 | 28590.56 | 12.92 0.02 | 0.42 | ||
| 90501337002 | FPMA | 58721.31 | 44577.57 | 14.25 0.02 | 0.43 | |
| FPMB | 58721.31 | 44311.46 | 13.28 0.02 | 0.43 | ||
| Swift J1753.5-0127 | 30001148002 | FPMA | 56913.42 | 40434.75 | 12.32 0.02 | 0.42 |
| FPMB | 56913.42 | 40476.89 | 11.69 0.02 | 0.41 |
| ObsID | (keV) | (deg.) | () | log | (keV) | () | () | ||||||
|---|---|---|---|---|---|---|---|---|---|---|---|---|---|
| GRS 1716-249(a) | |||||||||||||
| 80201034006 | 0.45 | 2609.8 | 2.5 | 9.8 | 4.6 | 1.584 | 3.91 | 2.8 | 48.5 | 0.16 | 267.4 | - | |
| 80201034007 | 0.46 | 2927.5 | 10.0* | … | 7.9 | 1.515 | 4.06 | … | 339.4 | 0.39 | 292.1 | - | |
| 90202055002 | 0.49 | 2050.2 | 3.3 | … | 8.3 | 1.663 | 4.11 | … | 400* | 0.48 | 191.9 | - | |
| 90202055004 | 0.51 | 1634.4 | 10.0* | … | 63.7 | 1.771 | 3.94 | … | 87.7 | 0.21 | 217.2 | - | |
| GRS 1739-278(b) | |||||||||||||
| 80101050002 | - | - | - | - | - | 1.824 | - | - | 11.3 | - | 44.2 | - | |
| 80102101002 | - | - | - | - | - | 1.68 | - | - | 34.4 | - | 265.5 | - | |
| 80102101004 | - | - | - | - | - | 1.699 | - | - | 30.4 | - | 82.6 | - | |
| 80102101005 | - | - | - | - | - | 1.670 | - | - | 175.6 | - | 166.8 | - | |
| GRS 1915+105(c) | |||||||||||||
| 10002004001 | 0.35 | 184770.9 | 2.2 | 2.8 | 1.942 | 4.50* | 3.7 | 16.6 | 2.54 | 141.1 | 30.9 | ||
| 80401312002 | 0.48 | 6891.3 | 3.8 | … | 8.4 | 1.952 | 4.01 | … | 65.7 | 1.27 | 108.0 | 15.0 | |
| 90202045002 | 0.40 | 53310.0 | 2.4 | … | 3.3 | 1.970 | 4.40 | … | 35.2 | 2.76 | 127.6 | 19.7 | |
| GS 1354-64(d) | |||||||||||||
| 90101006002 | - | - | 4.4 | 29.0 | 56.9 | 1.505 | 3.03 | 0.5* | 46.1 | 0.14 | 20.3 | - | |
| 90101006004 | - | - | 2.7 | … | 9.8 | 1.623 | 2.97 | … | 18.7 | 0.24 | 83.6 | - | |
| 90101006006 | - | - | 4.6 | … | 44.1 | 1.663 | 3.48 | … | 19.1 | 0.25 | 82.4 | - | |
| GX 339-4(d) | |||||||||||||
| 80001013002 | - | - | 2.48 | 1.18 | 1.585 | 1.93 | 5.3 | 240.8 | 0.255 | 36.6 | - | ||
| 80001013004 | - | - | 2.85 | … | 1.0* | 1.588 | 3.01 | … | 316.9 | 0.275 | 59.0 | - | |
| 80001013006 | - | - | 6.25 | … | 4.13 | 1.591 | 2.97 | … | 400* | 0.272 | 94.9 | - | |
| 80001013008 | - | - | 2.83 | … | 1.0* | 1.579 | 3.09 | … | 400* | 0.310 | 125.0 | - | |
| 80001013010 | - | - | 2.04 | … | 31.43 | 1.598 | 1.73 | … | 67.9 | 0.127 | 18.2 | - | |
| 80001015001 | - | - | 2.87 | … | 1.0* | 1.752 | 3.44 | … | 48.8 | 0.311 | 198.7 | - | |
| 80102011002 | - | - | 7.46 | … | 3.47 | 1.748 | 3.51 | … | 400* | 0.395 | 38.3 | - | |
| 80102011004 | - | - | 5.07 | … | 2.88 | 1.669 | 3.30 | … | 400* | 0.254 | 43.2 | - | |
| 80102011006 | - | - | 10.0* | … | 3.63 | 1.656 | 2.99 | … | 400* | 0.239 | 41.1 | - | |
| 80102011010 | - | - | 2.33 | … | 1.34 | 1.640 | 3.00 | … | 400* | 0.165 | 24.7 | - | |
| 80102011012 | - | - | 2.66 | … | 11.65 | 1.657 | 2.62 | … | 187.2 | 0.169 | 11.9 | - | |
| 80302304002 | - | - | 1.73 | … | 1.0* | 1.648 | 2.93 | … | 47.6 | 0.165 | 5.7 | - | |
| 80302304004 | - | - | 10.0* | … | 3.33 | 1.564 | 3.16 | … | 400* | 0.318 | 81.0 | - | |
| 80302304005 | - | - | 10.0* | … | 2.95 | 1.612 | 3.02 | … | 400* | 0.286 | 66.4 | - | |
| 80502325008 | - | - | 2.80 | … | 1.0* | 1.681 | 3.18 | … | 400* | 0.256 | 28.9 | - | |
| 90401369004 | - | - | 0.0* | … | 1.0* | 1.581 | 1.91 | … | 90.3 | 0.160 | 43.0 | - | |
| H1743-322(d) | |||||||||||||
| 80001044002 | - | - | 2.7 | 51.9 | 4.4 | 1.642 | 1.8 | 0.5* | 150.1 | 0.34 | 76.0 | - | |
| 80001044004 | - | - | 2.3 | … | 4.2 | 1.690 | 2.0 | … | 88.9 | 0.38 | 85.2 | - | |
| 80001044006 | - | - | 1.9 | … | 8.3 | 1.690 | 1.4 | … | 76.8 | 0.43 | 73.8 | - | |
| 80002040002 | - | - | 2.2 | … | 6.9 | 1.630 | 0.1* | … | 290.0 | 0.29 | 57.2 | - | |
| 80202012002 | - | - | 1.1 | … | 2.6 | 1.848 | 1.7 | … | 66.9 | 0.42 | 80.4 | - | |
| 80202012004 | - | - | 2.3 | … | 3.8 | 1.864 | 1.5 | … | 158.4 | 0.42 | 81.5 | - | |
| 80202012006 | - | - | 2.5 | … | 3.9 | 1.661 | 0.1* | … | 178.5 | 0.27 | 57.5 | - | |
| 90401335002 | - | - | 1.9 | … | 6.5 | 1.704 | 1.7 | … | 72.0 | 0.31 | 78.4 | - | |
| IGR J17091-3624(d) | |||||||||||||
| 80001041002 | - | - | 2.2 | 52.3 | 7.6 | 1.739 | 1.3 | 0.5* | 400* | 0.56 | 39.0 | - | |
| 80202014002 | - | - | 2.7 | … | 13.2 | 1.737 | 2.5 | … | 54.7 | 0.40 | 42.1 | - | |
| 80202014004 | - | - | 1.8 | … | 10.1 | 1.740 | 2.6 | … | 36.7 | 0.26 | 45.3 | - | |
| MAXI J1348-630(a) | |||||||||||||
| 80402315002 | 0.50 | 16290.3 | 2.2 | 17.3 | 4.0 | 1.687 | 3.58 | 2.1 | 25.5 | 0.18 | 1930.9 | - | |
| 80402315004 | 0.53 | 9955.0 | 10.0* | … | 16.1 | 1.688 | 3.45 | … | 23.3 | 0.17 | 1952.1 | - | |
| 80502304002 | 0.58 | 744.8 | 2.6 | … | 3.5 | 1.644 | 3.43 | … | 89.6 | 0.25 | 444.5 | - | |
| 80502304004 | 0.54 | 1209.0 | 3.1 | … | 7.8 | 1.639 | 3.21 | … | 80.3 | 0.16 | 419.7 | - | |
| 80502304006 | 0.59 | 335.3 | 2.4 | … | 5.9 | 1.637 | 3.09 | … | 89.5 | 0.16 | 287.5 | - | |
| MAXI J1535-571(c) | |||||||||||||
| 90301013002 | 0.40 | 217048.3 | 5.9 | 56.4 | 3.3 | 1.83 | 3.7 | 1.2 | 19.7 | 0.77 | 863.5 | 111.9 | |
| MAXI J1813-095(d) | |||||||||||||
| 80402303002 | - | - | 3.7 | 17.9 | 7.5 | 1.61 | 3.4 | 1.5 | 400* | 0.15 | 49.1 | - | |
| 80402303004 | - | - | 3.9 | … | 7.4 | 1.65 | 2.8 | … | 307.2 | 0.12 | 41.2 | - | |
| 80402303006 | - | - | 6.2 | … | 14.9 | 1.69 | 3.1 | … | 400* | 0.15 | 39.4 | - | |
| MAXI J1820+070(c) | |||||||||||||
| 90401309002 | 1.5* | 4.6 | 10.0* | 207.7 | 1.510 | 0.1* | 2.47 | 40.6 | 0.13 | 525.7 | 33.2 | ||
| 90401309004 | 1.5* | 26.0 | 2.0 | … | 2.9 | 1.640 | 1.98 | … | 39.7 | 0.54 | 1628.1 | 0.1* | |
| 90401309006 | 1.21 | 84.1 | 2.0 | … | 12.7 | 1.577 | 3.20 | … | 24.4 | 0.21 | 1536.1 | 180.1 | |
| 90401309008 | 0.73 | 598.2 | 1.7 | … | 19.1 | 1.591 | 3.80 | … | 43.3 | 0.81 | 1256.3 | 300.0 | |
| 90401309010 | 0.96 | 147.5 | 2.1 | … | 25.1 | 1.567 | 3.90 | … | 42.5 | 1.32 | 996.9 | 318.4 | |
| 90401309012 | 1.08 | 113.8 | 2.4 | … | 17.3 | 1.595 | 3.25 | … | 29.7 | 0.23 | 1464.5 | 144.1 | |
| 90401309013 | 0.63 | 875.6 | 2.0 | … | 3.6 | 1.728 | 1.74 | … | 79.7 | 0.73 | 1555.8 | 0.7 | |
| 90401309014 | 1.03 | 138.6 | 2.8 | … | 18.2 | 1.623 | 3.24 | … | 31.6 | 0.26 | 1383.7 | 137.5 | |
| 90401309016 | 0.53 | 2974.1 | 10.0* | … | 27.0 | 1.651 | 3.73 | … | 133.1 | 0.84 | 1029.4 | 169.6 | |
| 90401309018 | 0.87 | 182.5 | 2.2 | … | 11.1 | 1.677 | 3.35 | … | 53.7 | 0.40 | 1034.1 | 62.8 | |
| 90401309019 | 0.73 | 462.7 | 10.0* | … | 22.1 | 1.678 | 3.51 | … | 96.0 | 0.58 | 991.9 | 135.9 | |
| 90401309021 | 0.74 | 287.8 | 2.6 | … | 12.5 | 1.649 | 3.23 | … | 262.7 | 0.37 | 843.9 | 54.2 | |
| 90401309033 | 0.70 | 406.4 | 3.2 | … | 8.1 | 1.880 | 3.33 | … | 400* | 0.78 | 203.9 | 10.3 | |
| 90401309035 | 1.32 | 1.9 | 10.0* | … | 52.8 | 1.660 | 2.90 | … | 228.4 | 0.15 | 156.0 | 3.5 | |
| 90401309037 | - | - | 10.0* | … | 63.3 | 1.730 | 2.91 | … | 400* | 0.16 | 38.1 | 2.1 | |
| 90401324002 | 0.80 | 271.6 | 10.0* | … | 21.7 | 1.685 | 3.46 | … | 82.5 | 0.49 | 986.5 | 112.6 | |
| 90501311002 | - | - | 10.0* | … | 112.4 | 1.723 | 2.85 | … | 80.0 | 0.12 | 32.8 | 3.1 | |
| 90501337002 | - | - | 10.0* | - | 400.0* | 1.706 | 2.71 | … | 133.6 | 0.15 | 37.5 | 3.0 | |
| Swift J1753.5-0127(b) | |||||||||||||
| 30001148002 | - | - | - | - | - | 1.736 | - | - | 55.8 | - | - | - | |
Note:
- The letter ‘a’ indicates the spectral model TBabs*(diskbb+relxillCp) adopted in the sources.
- The letter ‘b’ indicates the spectral model TBabs*nthcomp adopted in the sources.
- The letter ‘c’ indicates the spectral model TBabs*(diskbb+relxillCp+xillverCp) adopted in the sources.
- The letter ‘d’ indicates the spectral model TBabs*relxillCp adopted in the sources.
- The symbol ‘’ indicates the parameters are pegged at lower/upper limit adopted in the spectral fits.
- The symbol ‘’ indicates the parameters are fixed at the values given in Table 1.
- The symbol ‘…’ indicates the parameters are linked in the joint fits for a given source.
- The symbol ‘-’ for and in the diskbb model indicates that the disk component is not required in the fits for a given observation. = 0.05 keV and are fixed in the joint fits.
Appendix A Comparison with the existing constraints
A.1 GRS 1716-249
The spectral analysis for the four epochs, i.e., 80201034006, 80201034007, 90202055002, and 90202055004, was also done by Jiang et al. (2020). In their spectral fits, the power-law model cutoffpl is used to account for the coronal emission, and the relconvlp*reflionx is adopted to model the relativistic disk reflection, where kerrconv is a relativistic blurring function based on ray-tracing simulations (Brenneman & Reynolds, 2006) and reflionx accounts for the reflection from an ionized accretion disk of constant density (Ross & Fabian, 2005). Their results show that the inclination angle is low with , and the accretion disk is of low iron abundance and highly ionized, which are consistent with our results. The Comptonization continua are harder with the photon index in the range of 1.3-1.5 than the ones in our fitting results, and the reflection fraction is about 0.25. Note that, the modeling of the relativistic disk reflection with relconvlp*reflionx is based on the assumption of a simple lamppost geometry, and more importantly, the empirical reflection fraction in relconvlp*reflionx is different from the physical reflection fraction in the reflection model relxillCp adopted in our work (Dauser et al., 2016).
A.2 GRS 1739-278
The four NuSTAR spectra of GRS 1739-278 studied in this work are well described by a power-law continuum with an exponential cutoff, which agrees with the results in previous studies (Fürst et al., 2016; Yan et al., 2020). Joint fits of XMM-Newton and NuSTAR for one epoch observation on MJD 57281 (ObsID: 80101050002) by Fürst et al. (2016) revealed the signatures of reflection. Their spectral fits indicate a low reflection fraction with for a hard spectrum with photon index , which agrees well with the low end of the - correlation.
A.3 GRS 1915+105
The NuSTAR spectrum of GRS 1915+105 in 2012 (ObsID: 10002004001) was analyzed in previous studies with the reflection model (Miller et al., 2013; Zhang et al., 2019a, b; Shreeram & Ingram, 2020). In Miller et al. (2013), the spectral model mainly consists of (kerrconvreflionx)+cutoffpl. Assuming the disk inner edge being at ISCO, their best fits prefer a high BH spin with and a large inclination angle for this binary system with , and strongly exclude the fitting results with a much high cutoff energy. As a comparison, in our fits of this observation with the assumptions of and , the fitted inner radius of the disk is about 2 , and the electron temperature is about 17 keV. However, the derived photon index in our fits is about 1.9, which is larger than the one () in Miller et al. (2013). The same observation was also studied using the relativistic reflection models relxill_NK (Bambi et al., 2017) which belongs to the RELXILL family (Zhang et al., 2019a, b; Shreeram & Ingram, 2020). The fitted photon index in those studies is large with , instead.
A.4 GS 1354-64
The three NuSTAR spectra of GS 1354-64 were analyzed by Yan et al. (2020) in which the Comptonization model (nthcomp) is adopted, while the disk reflection is not included, for simplicity. In their spectral fits, the photon index of the Comptonization continuum is , 1.65, and the fitted electron temperature is low with 10–20 keV, which are consistent with the results in this work.
Moreover, two of the three NuSTAR spectra (ObsID: 90101006002, 90101006004), were also analyzed in previous studies with the reflection model (El-Batal et al., 2016; Xu et al., 2018a; Tripathi et al., 2021). El-Batal et al. (2016) found a large truncation radius for the accretion disk with for 90101006002, but a small truncation radius, which is close to for 90101006004. In this work, we also find the similar results that the disk is truncated at a large radius with for 90101006002, but at a small radius for 90101006004. And a low iron abundance with is preferred in both El-Batal et al. (2016) and our work.
A.5 GX 339-4
The NuSTAR spectra of GX 339-4 studied in this work mainly consist of the observations in 2013 (Fürst et al., 2015; Wang-Ji et al., 2018; Jiang et al., 2019), 2015 (Wang-Ji et al., 2018; Jiang et al., 2019), and 2017 (García et al., 2019; Wang et al., 2020a). For the observations in 2013 (ObsID: 80001013002-04-06-08-10) and 2015 (ObsID: 80102011002-04-06-10-12), the reflection models in the relxill family are implemented by Wang-Ji et al. (2018) in the joint fits to NuSTAR and Swift data. In their results, the inclination angle is constrained with , which supports the assumption of the inclination angle in our fits. And the electron temperatures are found to be large with hundreds of kiloelectronvolts and the disk inner radii are close to the ISCO, which are consistent with our fitting results. The constrained photon index is in the range of 1.5-1.7, as we find in this work. And both Wang-Ji et al. (2018) and our work found that the spectra prefers to a high iron abundance. Note that, such a high iron overabundance may be due to the assumed constant electron density of the accretion disk (Jiang et al., 2019).
A.6 H1743-322
The NuSTAR spectra of H1743-322 were also analyzed with the phenomenological models (Yan et al., 2020; Wang et al., 2022) and the reflection models in the relxill family (Ingram et al., 2016; Chand et al., 2020; Stiele & Kong, 2021). A low iron abundance with and a small disk truncation radius of a few times are suggested in the spectral fits (Ingram et al., 2016; Stiele & Kong, 2021). And the fitted photon index and the reflection fraction by Stiele & Kong (2021) follow the derived correlation in this work.
A.7 IGR J17091-3624
The NuSTAR spectra of IGR J17091-3624 were analyzed by Xu et al. (2017) with the reflection models in the relxill family. In their spectral results, the constrained inner radii are about of tens of gravitational radii, and the iron abundance is low with , which are consistent with the results in this work. And the fitted photon index and the reflection fraction are slightly lower than the ones in our results.
A.8 MAXI J1348-630
Two of the NuSTAR spectra of MAXI J1348-630 studied in this work (ObsIDs: 80402315002 and 80402315004) were also analyzed in Chakraborty et al. (2021) and Jia et al. (2022) with the reflection models in the relxill family. In their results, the disk temperature at the inner radius is about 0.5 keV. For the Comptonizing source, the photon index , and the electron temperature keV. These measurements are consistent with the ones in this work. We notice that the disk in their fits is truncated at , while the inner radius in our results is about . Furthermore, their reflection fraction is slightly smaller than the one in our fits.
A.9 MAXI J1535-571
The NuSTAR spectra of MAXI J1348-630 were analyzed by Xu et al. (2018b) and Dong et al. (2022). The observation (ObsID = 90301013002) was fitted by Xu et al. (2018b) with different flavors of the reflection models in the relxill family. Our fitting results, in terms of the disk properties (the inner temperature , iron abundance, and the ionization parameter), the Comptonization spectrum (the electron temperature and the photon index), and the reflection fraction, are consistent with the ones in Xu et al. (2018b).
A.10 MAXI J1813-095
The three NuSTAR spectra of MAXI J1813-095 were stacked by Jiang et al. (2022) for the spectral analysis with the reflection models in the relxill family. In their results, the inclination of the source is found to be low with which supports our conclusion of a low inclination angle of . And, the disk properties (the inner temperature , iron abundance, and the ionization parameter), the Comptonization spectrum (the electron temperature and the photon index) in our fits are consistent with the ones in Jiang et al. (2022).
A.11 MAXI J1820+070
The NuSTAR spectra of MAXI J1820+070 in the 2018 outburst were analyzed by Buisson et al. (2019) with a dual-lamppost model (two lampposts at different coronal heights) relxilllpCp in the relxill family. In their results, the inclination angle is fitted to be , while it is fixed with (Atri et al., 2020) in this work. Note that there is a large misalignment () between the inclination angle of the jet and the binary orbit in MAXI J1820+070 (Poutanen et al., 2022).
A.12 Swift J1753.5-0127
The NuSTAR spectra of Swift J1753.5-0127 studied in this work are well-described by a power-law continuum with an exponential cutoff. The Comptonization spectrum, in terms of the electron temperature and the photon index, in our fits are consistent with the results in previous studies (Yan et al., 2020), which include the Swift data as well.