Changes in Commuter Behavior from COVID-19 Lockdowns in the Atlanta Metropolitan Area
Abstract
This paper analyzes the impact of COVID-19 related lockdowns in the Atlanta, Georgia metropolitan area by examining commuter patterns in three periods: prior to, during, and after the pandemic lockdown. A cellular phone location dataset is utilized in a novel pipeline to infer the home and work locations of thousands of users from the Density-based Spatial Clustering of Applications with Noise (DBSCAN) algorithm. The coordinates derived from the clustering are put through a reverse geocoding process from which word embeddings are extracted in order to categorize the industry of each work place based on the workplace name and Point of Interest (POI) mapping. Frequencies of commute from home locations to work locations are analyzed in and across all three time periods. Public health and economic factors are discussed to explain potential reasons for the observed changes in commuter patterns.
1 Introduction
This paper is motivated by a desire to gain an understanding of the impact of COVID-19 on work-related travel behaviors in the Atlanta metropolitan area. The paper analyzes and answers the following questions:
-
1.
Where do people in the Atlanta metropolitan area live and work?
-
2.
How did people’s commuter travel behaviors change over the course of the COVID-19 pandemic and its associated lockdowns?
-
3.
How have different industries changed their work styles as a result of the COVID-19 pandemic and its associated lockdowns?
From a high-level perspective, this paper provides a novel methodology for answering the above questions that consists of the following steps:
-
1.
Divide cell phone location data to users active before, during, and after COVID-19 lockdowns in the Atlanta area.
-
2.
Apply density-based clustering to identify home locations, work locations, and days present at each.
-
3.
Use reverse geocoding combined with a bag-of-words model to map locations to workplace addresses and industries.
-
4.
Analyze user commuter and work behaviors in relation to work industry before, during, and after COVID-19 lockdowns in the Atlanta area.
The paper is organized as follows. Section 2 first presents a short survey of related literature. Next, Section 3 describes the cell phone location dataset and its characteristics. Section 4 follows with details on the clustering procedure, while Section 5 delves into the reverse geocoding and address mapping step. Section 6 presents the final results of the analysis and Section 7 ends with a discussion of the results.
2 Literature Review
There have been a few recent papers that use cell phone location, GPS data, and smart card data to understand urban mobility patterns. The use of cell phone location data to generate home and work trip pairs, as well as assign some trip purposes are explored by [6]. [1] compare Estonian mobile data with population register data to analyze the effectiveness of a model that determined home and work locations for users. More recently, [20] use smart card data for home and work location detection, while [24] use mobile data to understand the spatial structure of urban commuting. [23] also use mobile data to examine how people move around under the context of key activity locations. Patterns in home-work commuting are also examined by [13]. [28] focus on learning taxi driver behavior from GPS data.
The use of density-based clustering methods on mobile phone data has also been explored in prior literature. [11] improve on the existing DBSCAN algorithm methods to identify trip ends from Chinese mobile phone location data. [27] use DBSCAN clustering to cluster public transit passengers into regional travel areas. [18] implement DBSCAN for noise reduction as they infer route choice for commuter trips. DBSCAN is used as the final step in deriving the characteristics of commuting patterns on key commuting routes by [25].
A few recent papers have looked at the impact of the COVID-19 pandemic on human mobility patterns. [7] estimate how individual mobility outside the home is affected by local disease prevalence and restriction orders to stay-at-home. [3] document the evolution of work-from-home behaviors over the course of the pandemic and the expectation for that kind of working behavior in the future. [4] uses cell phone location data to understand the impact of the pandemic on nursing home entries. [10] look at the correlation between demographic and socioeconomic variables and home-dwelling time records as a result of stay-at-home orders derived from large-scale mobile phone location tracking data. [26] build an interactive tool and process anonymized mobile device location data to identify trips and produce a set of variables including a social distancing index, the percentage of people staying at home, the number of visits to work and non-work locations, out-of-town trips, and trip distance. [12] look at how the number of COVID-19 cases can be used to predict the following week’s travel behaviors in Houston, Texas. [17] analyze the impacts of COVID-19 on micromobility use and perception.
The choice of the Atlanta metropolitan area as a case study in this paper is also based in prior literature analyzing location data, commuter behavior, and commuter location data. [21] use GPS data to analyze destination choice behavior for vehicle trips in Atlanta. [19] and [22] discuss the consistency of commuter behavior using public rail in Atlanta. The impact on this consistency in Atlanta as a result of the pandemic is analyzed by [2] who also propose a resilient multimodal transit system to serve the Atlanta area in a pandemic case in the context of COVID-19. [9] consider commuter home locations in the integration of latent demand into the design of an on-demand multimodal transit system for Atlanta. The use of the OpenStreetMap Application Programming Interface (API) for Atlanta area points of interest has also been implemented by [14] who build a tool to explore the transit accessibility in the Atlanta metropolitan area to those points of interest.
Based on the literature above, there exists a gap in using cell phone (or any similar type of) location data to derive a breakdown of remote and in-person commute behaviors by work industry. Ultimately, the main novel contributions of this paper relate to the analysis of lockdown effects on commuter behaviors. To our knowledge, there are no comparable methods in the existing literature for deriving granular analysis on commuting patterns by industry from mobile location data. The pipeline that connects density-based clustering to reverse geocoding to work type is also a unique and novel contribution, and is scalable in its potential applications outside of the Atlanta area and in temporal periods beyond the focus on COVID-19 lockdowns.
3 Data
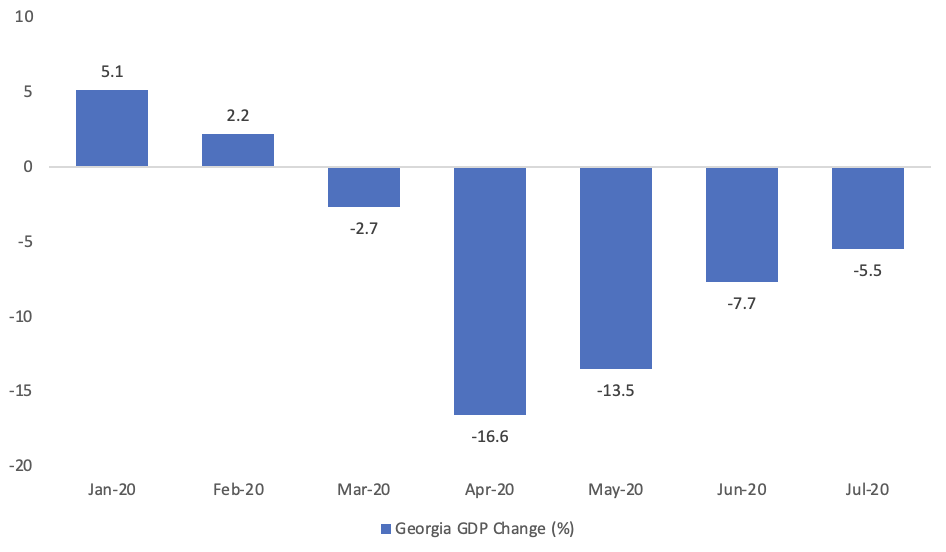
The paper uses a dataset from X-Mode which contains the cell phone latitude and longitude location data for a set of anonymized users who use mobile applications with the X-Mode platform integrated. X-Mode is a data collection platform for location data that app developers can choose to integrate into their app [15]. The original dataset contains over 12 terabytes of location data for users all over the United States, so the first step is to preprocess the data to focus on the target time and locations. The data is filtered and contained to a bounding box around the metropolitan area surrounding the city of Atlanta. The city of Atlanta is located in Fulton County, Georgia which is the county in Georgia that saw the largest number of COVID-19 cases and related deaths in 2020, with 56,800 reported COVID-19 cases over the year. The resulting data points are further filtered to include user locations during the months of January 2020 (baseline pre-pandemic), April 2020 (pandemic lockdown), and July 2020 (pandemic post-lockdown). The Gross Domestic Product (GDP) of the state of Georgia grew by 5.1% in January 2020 compared to January 2019, decreased by 16.6% in April 2020 compared to April 2019 (the largest decrease in the last decade), and fell by 5.5% in July 2020 compared to July 2019. The monthly GDP trend is shown in Figure 1. These months are analyzed and focused on in this paper.
In January 2020, which was used as a baseline, there were around 430,000 unique users who had at least one location point tracked and logged to the dataset. In order to achieve a generalization of the users’ travel patterns, the number of active days for each user in January is calculated. A threshold of greater than 24 days with at least one data point present in the dataset is set to maintain a strong clustering result. With this threshold, a little over 21,000 users are identified as having enough information in the month of January. The location data for a single month for one anonymized user is displayed on the map as point clusters and a heat map in Figure 2.

4 Clustering Methods
To begin the analysis of commuter behavior from the location data, work and home locations are needed to be determined. To do so, a clustering approach is used. Work location and home location for each user are identified using DBSCAN clustering. DBSCAN is a density-based clustering algorithm that takes a set of points in some space and groups together points that are closely packed together [8]. It is used here due to its quality performance in finding core samples of high density at home and work locations and expanding clusters from them. The following process of location identification below is used:
-
1.
Starting with the filtered data containing 21,000 users from above, further filter the data to the group of users with more than 300 data points of activity during the pre-pandemic period in January. If a user has fewer than 300 activities, the home and work locations derived might not be accurate. Those users with fewer than 300 data points of activity are not assigned any home and work locations. 4,500 of the 21,000 user subset meet this criteria.
-
2.
Taking the filtered group of users, divide the user’s GPS data into workdays and weekend. For each sub-dataset, cluster the GPS data using DBSCAN. The parameters for DBSCAN are set to be eps = 0.001, and minsample = 5% of the sample size and were manually tuned.
-
3.
Find the cluster centers for the above users for workdays and weekends.
-
4.
For each cluster center, find which days they appear in within a month.
-
5.
The cluster center that appears most frequently in terms of days in January (that also has a frequency greater than 17 days) is classified as the “home location”. If there is no “home location” found, then go to the next user.
-
6.
Remove the “home location” from the list of cluster centers and find the most frequent location that appear in workdays in the list of cluster centers. If that location appears more than 10 days per month, then identify that location as “work location”.
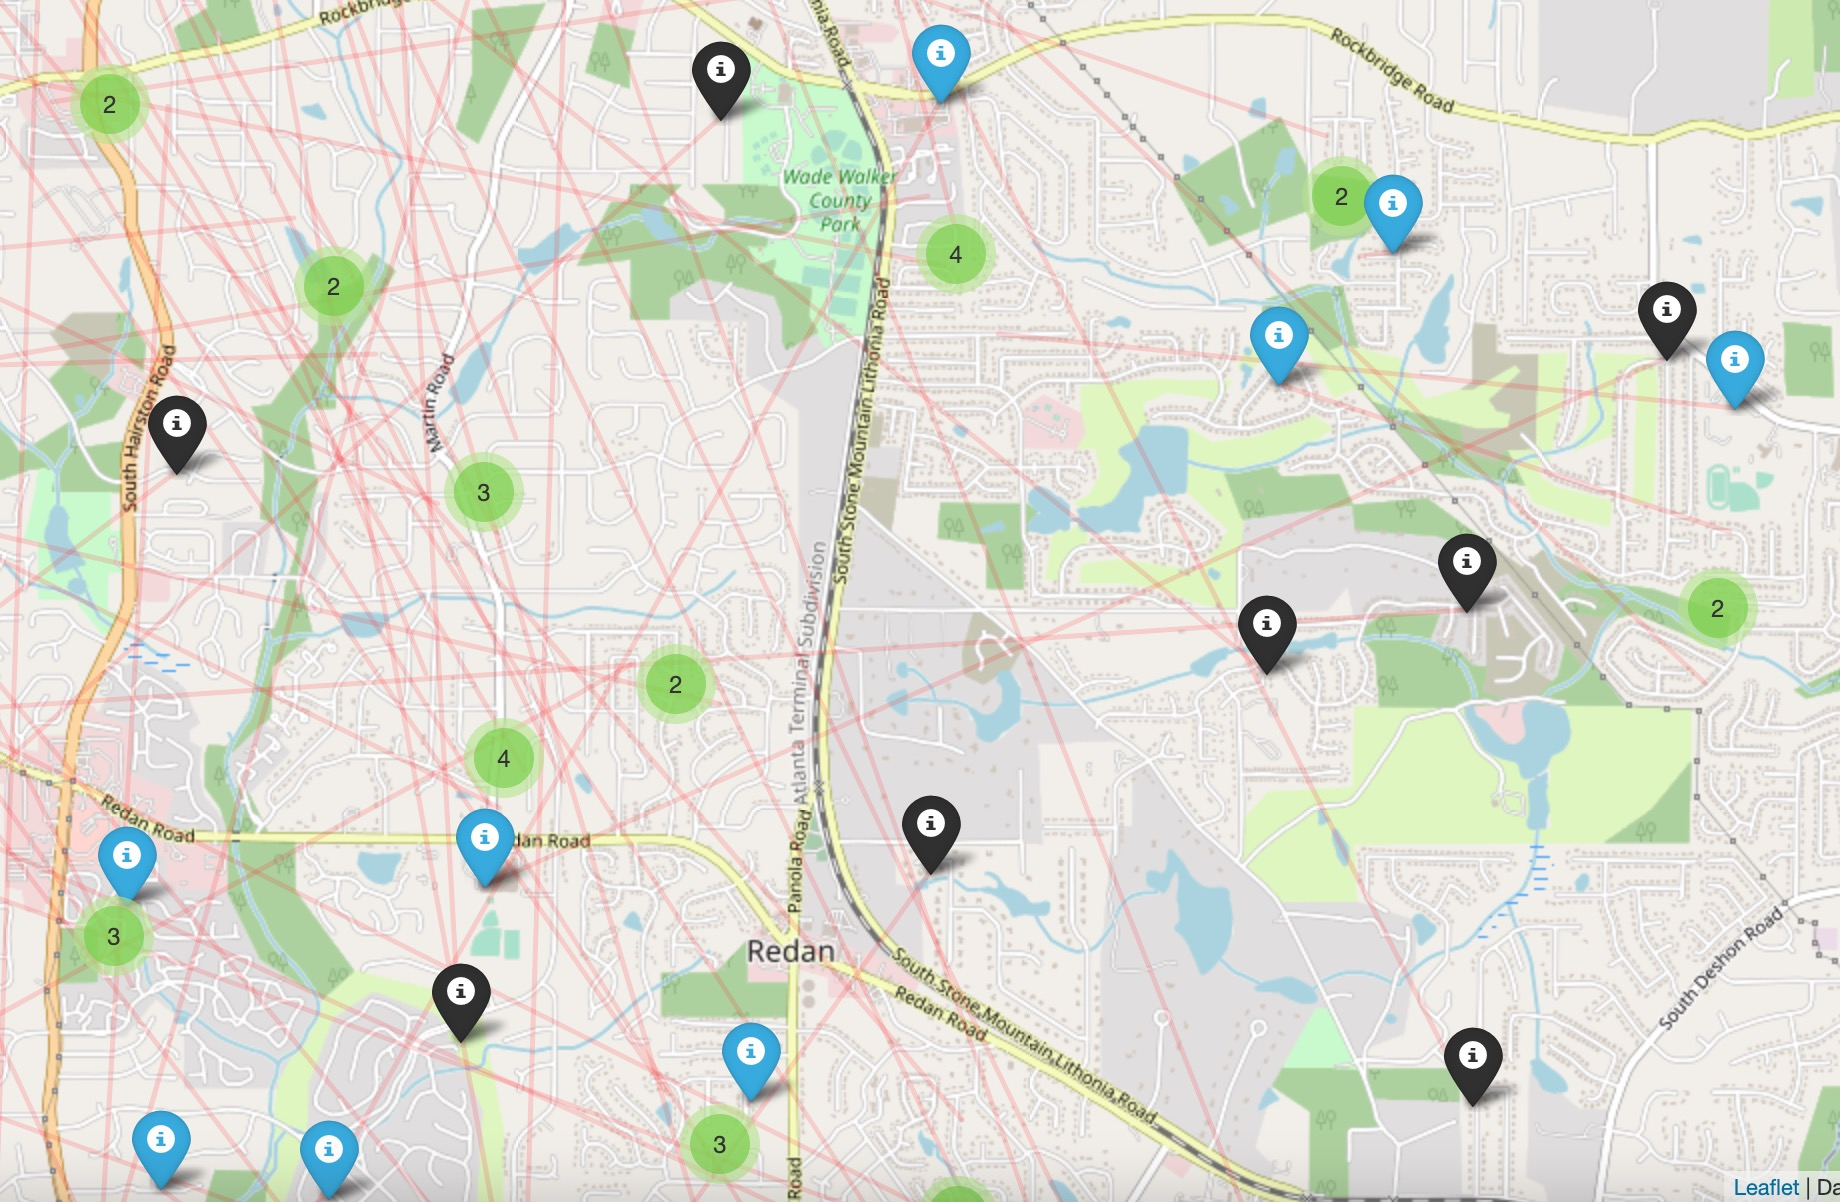

Using this method, the anonymous user in Figure 2 will have their home location identified within the top cluster of 1,658 points and their work location identified within the leftmost cluster of 371 points. After repeating the above steps on the 21,000 user subset, 1,428 users are also above the 24 day activity threshold in April and July as well. This roughly 1.5K user subset is the main focus of the analysis going forward in this paper. These clusters were also manually inspected to obtain a high-level of confidence in the accuracy of the home and work labels based on the general locations of where one might expect to see residential and commercial areas. The home locations (in black) and work locations (in blue) of some of those 1,428 users are shown as markers and marker clusters in Figure 3. Home and work locations for any particular user are connected in the figure by a red line. The distribution of the distances between the home and work locations for these users are shown in kilometers in Figure 4.
5 Reverse Geocoding
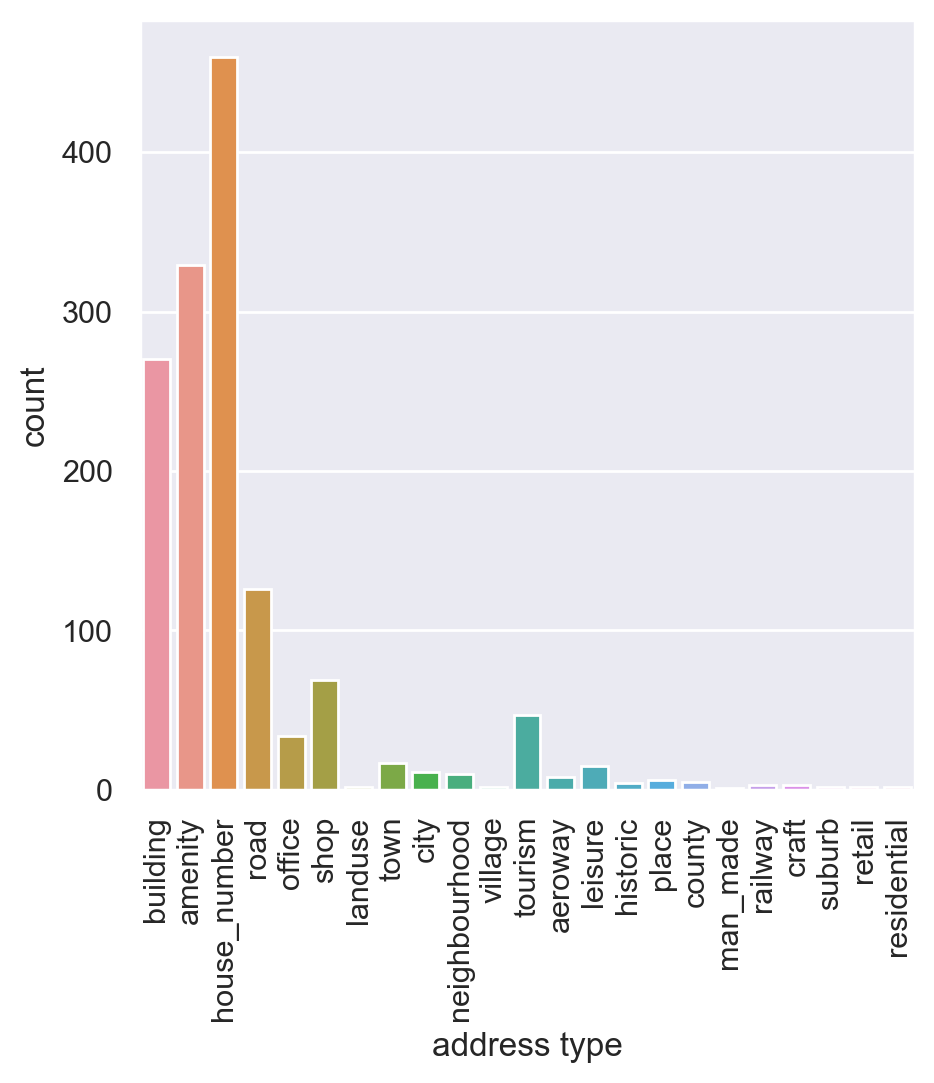
To figure out the work types of these users and analyze the change in their work patterns during the pandemic, a reverse geocoding procedure is applied on the latitude and longitude of their work locations. The Nominatim OpenStreetMap API is used to retrieve the actual name of the work locations; for example, “Drury Inn” or “Wells Fargo” [16] [5]. For the set of work locations where the Nominatim OpenStreetMap API is unable to provide a workplace name, a database of Atlanta points of interest is used to map the work locations to workplace names. For the remainder of the few unmapped work locations, a manual mapping is done through Google Maps.
After the workplace names for all of the users are gathered, a bag-of-words model is run on the work place names. The purpose of the bag-of-words model is to count the frequency of the words that appear in the names of workplaces in the roughly 1.5K workplace set. Some high-frequency words are identified such as “school”, “hotel”, and “hospital”. These high-frequency words serve as guidance for designing the word embeddings to extract categories from location names. The generated categories are presented in Table 1. The word embeddings extract categories from the location names. For example, any workplace with the word “University”, “School”, or “Academy“ in the title is mapped by the word embeddings program to the Education category (except in the case of workplace names like “Emory University Hospital” which is mapped to the Medical category). Similarly, workplace names containing “Taco”, “Pizza”, or “Diner” are mapped to the Restaurant category.
6 Results
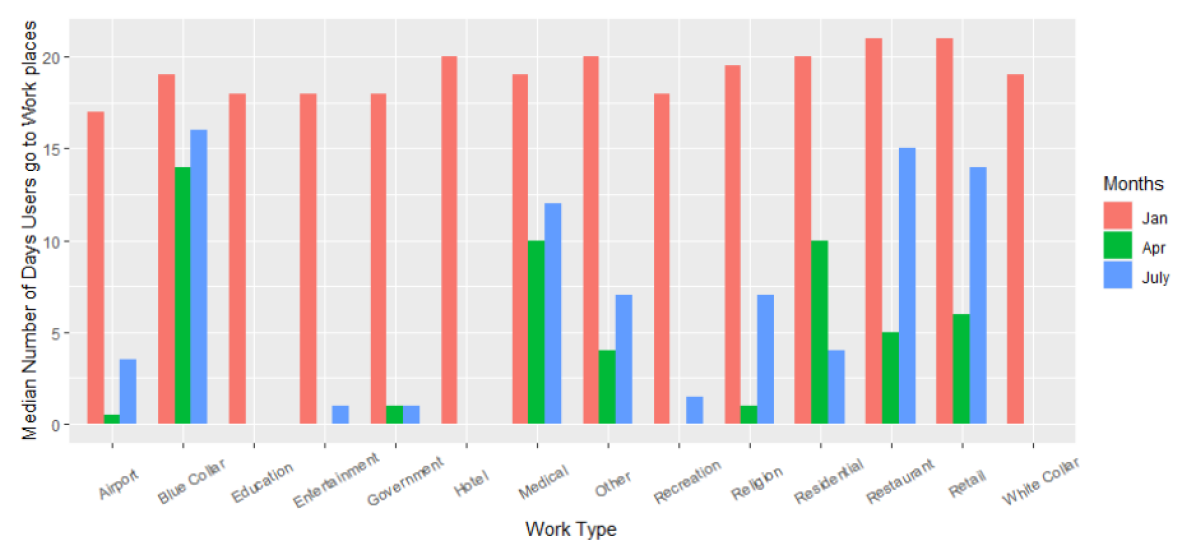
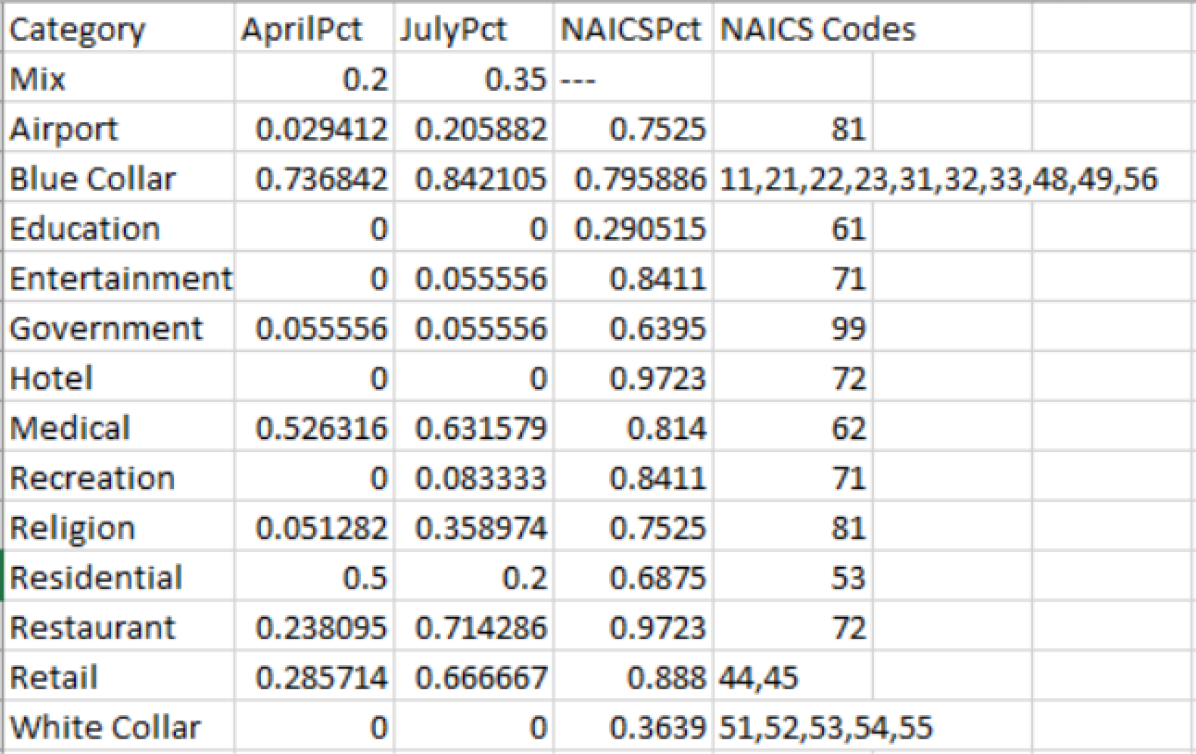
Table 1 displays the number of people associated with each workplace category out of the 1,428 users analyzed. The notes column details the types of workplaces that were mapped to each category at the reverse geocoding step. The largest categories contained people in Mix, Retail, White Collar, and Education jobs. A comparison between the 1,428 user subset and the roughly 21,000 users who were only active in January in the dataset (not including the users in the 1,428 user subset) is created, and it is found that the distribution of job type by percentage is roughly similar. This can verify that the subsets generated in the analysis are representative of the overall Atlanta metropolitan area community. The median workdays over each month and the associated percentiles are shown in Table 2. In that table, the 25% percentiles refers to fewer than 25% of the users in that category working fewer than the specified number of days. The median number of days is graphed in Figure 6. While all occupation types see a decrease in the number of days users went in to work, the Blue Collar and Medical fields see the greatest resilience of in-person work. Some fields like the White Collar and Education sectors see their median day count drop to zero as a result of the possibility of virtual transition these sectors have. Some sectors like the hotel industry or entertainment venues also see a median day count drop to zero as a result of forced closings and layoffs from lockdown policies in Atlanta. Figure 7 shows a comparison between the percentage of days worked in person during the pandemic months compared to the expected percentage of days worked in person from the North American Industry Classification System (NAICS) dataset, which is a government dataset for businesses in Canada, Mexico, and the United States on how necessary in-person work is within different occupations and industries.
| Categories | Count | Note |
| Airport | 14 | Airport Terminals, Parking Lots |
| Blue Collar | 59 | Manufacturing, Vehicle Repair, Cemetery Work |
| Education | 156 | K-12 schools and Higher education, Preschools |
| Entertainment | 9 | Stadium, theatre, theater, movie, bowling, opera, museum, orchestra |
| Government | 30 | City Halls, Mints, Consulates |
| Hotel | 51 | Hotels, Motels |
| Medical | 130 | Hospitals, Urgent Care, Dentists/Chiropractic Offices |
| Mix | 385 | Small Businesses, Home Businesses, etc. |
| Recreation | 16 | Trails, Parks, Golf Courses, Tennis Courts |
| Religion | 28 | Churches, Temples, Mosques |
| Residential | 70 | Apartments, Townhomes, Condos |
| Restaurant | 90 | Food and Drink eat-in Establishments |
| Retail | 203 | Brick-and-mortar Retail |
| White Collar | 187 | Large Office Buildings/Companies |
| Jan | Apr | July | |||||||
| Categories | 50% | 25% | 75% | 50% | 25% | 75% | 50% | 25% | 75% |
| Other | 20 | 17 | 22 | 4 | 0 | 17 | 7 | 0 | 19 |
| Airport | 17 | 16 | 22 | 1 | 0 | 4 | 4 | 0 | 13 |
| Blue Collar | 19 | 16 | 21 | 14 | 1 | 20 | 16 | 3 | 20 |
| Education | 18 | 16 | 19 | 0 | 0 | 1 | 0 | 0 | 3 |
| Entertainment | 18 | 16 | 19 | 0 | 0 | 0 | 1 | 0 | 4 |
| Government | 18 | 15 | 19 | 1 | 0 | 3 | 1 | 0 | 5 |
| Hotel | 20 | 16 | 22 | 0 | 0 | 7 | 0 | 0 | 15 |
| Medical | 19 | 16 | 21 | 10 | 1 | 19 | 12 | 2 | 18 |
| Recreation | 18 | 14 | 22 | 0 | 0 | 3 | 2 | 0 | 18 |
| Religion | 20 | 15 | 23 | 1 | 0 | 6 | 7 | 0 | 13 |
| Residential | 20 | 17 | 23 | 10 | 0 | 22 | 4 | 0 | 22 |
| Restaurant | 21 | 18 | 24 | 5 | 0 | 18 | 15 | 1 | 20 |
| Retail | 21 | 18 | 24 | 6 | 0 | 20 | 14 | 1 | 20 |
| White Collar | 19 | 16 | 21 | 0 | 0 | 2 | 0 | 0 | 5 |
7 Discussion
The most impactful conclusion stems from the three different types of median workday changes over time seen in the results. One type of trajectory is a sudden large drop in in-person work as the COVID-19 pandemic struck that continues post-lockdown as well. This is seen in categories like White Collar, Education, Entertainment, Hotel, and Government. The second type of trajectory that is noticeable is a large drop as COVID-19 struck that then bounces back (but not all the way to normal levels) post-lockdown. This trajectory is seen in categories like Restaurants and Retail locations. The third type of trajectory is a small drop to a level that stays consistent through lockdown and post-lockdown, as seen in Blue Collar and Medical work. For the most part, the first category contains jobs that either can easily be transitioned virtually or jobs that are impossible to transition virtually and thus had to pause. The second category contains those kinds of jobs that had to temporarily stop during lockdown but were able to come back in non-traditional ways such as outdoor seating-only for restaurants or online order and pick-up operations in retail locations. The third category contains those jobs that had to continue in-person regardless of the pandemic conditions, such as medical work or running a grocery store. Further conclusions can be drawn from the NAICS percentages. While some in-person work percentages align with the government expectation for work-from-home pre-COVID-19, as seen in the case of Blue Collar work, many occupations see a large drop from the expectation during lockdown, such as a 73% drop in Restaurant work and Airport work or a 97% drop in Hotel work. This large drop from the expectation can be attributed to the effect of legislation and policy on in-person work. Since legislation forced the closing of many service-based companies such as bowling alleys, theaters and restaurants that did not have outdoor seating, these jobs that would normally be considered by the government to be in-person were no longer possible. Potential areas of future work include expanding this analysis to other cities and comparing the results with Atlanta. Another interesting line of analysis would be to analyze these workplaces from the customer perspective and see where people went during COVID-19. Credit card data could be used to compare where consumers spent their money in-person versus online. The addition of smart card data and other forms of public transit data sources can also be used to further the granularity of the analysis over time in this paper. After some time, analysis of the long-term effects and implications of the pandemic on the greater commuter culture would be useful to explore.
References
- [1] Rein Ahas, Siiri Silm, Erki Saluveer and Olle Järv “Modelling home and work locations of populations using passive mobile positioning data” In Location based services and TeleCartography II Springer, 2009, pp. 301–315
- [2] Ramon Auad et al. “Resiliency of on-demand multimodal transit systems during a pandemic” In Transportation Research Part C: Emerging Technologies 133 Elsevier, 2021, pp. 103418
- [3] Alexander Bick, Adam Blandin and Karel Mertens “Work from home before and after the Covid-19 outbreak” In Available at SSRN 3786142, 2021
- [4] M Keith Chen, Judith A Chevalier and Elisa F Long “Nursing home staff networks and COVID-19” In Proceedings of the National Academy of Sciences 118.1 National Acad Sciences, 2021, pp. e2015455118
- [5] Konstantin Clemens “Geocoding with openstreetmap data” In GEOProcessing 2015, 2015, pp. 10
- [6] Serdar Çolak et al. “Analyzing cell phone location data for urban travel: current methods, limitations, and opportunities” In Transportation Research Record 2526.1 SAGE Publications Sage CA: Los Angeles, CA, 2015, pp. 126–135
- [7] Samuel Engle, John Stromme and Anson Zhou “Staying at home: mobility effects of covid-19” In Available at SSRN 3565703, 2020
- [8] Martin Ester, Hans-Peter Kriegel, Jörg Sander and Xiaowei Xu “A Density-Based Algorithm for Discovering Clusters in Large Spatial Databases with Noise” In Proc. of 2nd International Conference on Knowledge Discovery and, 1996, pp. 226–231
- [9] Hongzhao Guan, Beste Basciftci and Pascal Van Hentenryck “Heuristic Algorithms for Integrating Latent Demand into the Design of Large-Scale On-Demand Multimodal Transit Systems” In arXiv preprint arXiv:2212.03460, 2022
- [10] Xiao Huang et al. “Staying at home is a privilege: Evidence from fine-grained mobile phone location data in the United States during the COVID-19 pandemic” In Annals of the American Association of Geographers 112.1 Taylor & Francis, 2022, pp. 286–305
- [11] Haihang Jiang et al. “Improved F-DBSCAN for Trip End Identification Using Mobile Phone Data in Combination with Base Station Density” In Journal of Advanced Transportation 2022 Hindawi, 2022
- [12] Junfeng Jiao, Mira Bhat and Amin Azimian “Measuring travel behavior in Houston, Texas with mobility data during the 2020 COVID-19 outbreak” In Transportation letters 13.5-6 Taylor & Francis, 2021, pp. 461–472
- [13] Kevin S Kung, Kael Greco, Stanislav Sobolevsky and Carlo Ratti “Exploring universal patterns in human home-work commuting from mobile phone data” In PloS one 9.6 Public Library of Science San Francisco, USA, 2014, pp. e96180
- [14] Alexander Li et al. “Ease and Equity of Point of Interest Accessibility via Public Transit in the US” In arXiv preprint arXiv:2212.06954, 2022
- [15] “Mode - empowering innovation with Quality Location” In X, 2022 URL: https://xmode.io/
- [16] OpenStreetMap contributors “Planet dump retrieved from https://planet.osm.org ”, https://www.openstreetmap.org, 2017
- [17] Shiva Pourfalatoun and Erika E Miller “Effects of covid-19 pandemic on use and perception of micro-mobility” In Available at SSRN 4113031, 2022
- [18] Pitchaya Sakamanee, Santi Phithakkitnukoon, Zbigniew Smoreda and Carlo Ratti “Methods for inferring route choice of commuting trip from mobile phone network data” In ISPRS International Journal of Geo-Information 9.5 MDPI, 2020, pp. 306
- [19] Tejas Santanam, Anthony Trasatti, Pascal Van Hentenryck and Hanyu Zhang “Public Transit for Special Events: Ridership Prediction and Train Optimization” In arXiv preprint arXiv:2106.05359, 2021
- [20] Nilufer Sari Aslam, Tao Cheng and James Cheshire “A high-precision heuristic model to detect home and work locations from smart card data” In Geo-spatial Information Science 22.1 Taylor & Francis, 2019, pp. 1–11
- [21] Stefan Schönfelder et al. “Analysis of commute Atlanta instrumented vehicle GPS data: Destination choice behavior and activity spaces” In Arbeitsberichte Verkehrs-und Raumplanung 350 ETH, Eidgenössische Technische Hochschule Zürich, IVT, Institut für …, 2006
- [22] Anthony Trasatti “Data-Driven Design of On-Demand Multimodal Transit Systems”, 2022
- [23] Yang Xu et al. “Understanding aggregate human mobility patterns using passive mobile phone location data: a home-based approach” In Transportation 42.4 Springer, 2015, pp. 625–646
- [24] Xiping Yang et al. “Understanding the spatial structure of urban commuting using mobile phone location data: a case study of Shenzhen, China” In Sustainability 10.5 MDPI, 2018, pp. 1435
- [25] Wenbin Yao et al. “Analysis of Key Commuting Routes Based on Spatiotemporal Trip Chain” In Journal of Advanced Transportation 2022 Hindawi, 2022
- [26] Lei Zhang et al. “Interactive covid-19 mobility impact and social distancing analysis platform” In Transportation Research Record SAGE Publications Sage CA: Los Angeles, CA, 2020, pp. 03611981211043813
- [27] Xinhuan Zhang et al. “Research on the method of travel area clustering of urban public transport based on Sage-Husa adaptive filter and improved DBSCAN algorithm” In PLoS one 16.12 Public Library of Science San Francisco, CA USA, 2021, pp. e0259472
- [28] Yingjie Zhang, Beibei Li and Ramayya Krishnan “Learning individual behavior using sensor data: The case of global positioning system traces and taxi drivers” In Information Systems Research 31.4 INFORMS, 2020, pp. 1301–1321