Tensor network simulation of the quantum Kibble-Zurek quench
from the Mott to superfluid phase in the two-dimensional Bose-Hubbard model
Abstract
Quantum simulations of the Bose-Hubbard model (BHM) at commensurate filling can follow spreading of correlations after a sudden quench for times long enough to estimate their propagation velocities. In this work we perform tensor network simulation of the quantum Kibble-Zurek (KZ) ramp from the Mott towards the superfluid phase in the square lattice BHM and demonstrate that even relatively short ramp/quench times allow one to test the power laws predicted by the KZ mechanism (KZM). They can be verified for the correlation length and the excitation energy but the most reliable test is based on the KZM scaling hypothesis for the single particle correlation function: scaled correlation functions for different quench times evaluated at the same scaled time collapse to the same scaling function of the scaled distance. The scaling of the space and time variables is done according to the KZ power laws.
I Quantum Kibble-Zurek mechanism
The Kibble-Zurek mechanism (KZM) originated from a scenario for topological defect formation in cosmological phase transitions driven by expanding and cooling Universe Kibble (1976); *K-b; *K-c. Kibble considered independent selection of broken symmetry vacua in causally disconnected regions. The result is a mosaic of broken symmetry domains, whose size is limited by the causal horizon, leading to topologically nontrivial configurations. However, the speed of light is not relevant for laboratory experiments in condensed matter systems where, instead, a dynamical theory for the continuous phase transitions Zurek (1985); *Z-b; *Z-c; del Campo and Zurek (2014) predicts the scaling of the defects density as a function of the quench rate employing equilibrium critical exponents. It has been verified by numerous simulations Laguna and Zurek (1997); Yates and Zurek (1998); Dziarmaga et al. (1999); Antunes et al. (1999); Bettencourt et al. (2000); Zurek et al. (2000); Uhlmann et al. (2007); *KZnum-h; *KZnum-i; Witkowska et al. (2011); Das et al. (2012); Sonner et al. (2015); Chesler et al. (2015); Liu et al. (2020) and condensed matter experiments Chung et al. (1991); Bowick et al. (1994); Ruutu et al. (1996); Bäuerle et al. (1996); Carmi et al. (2000); Monaco et al. (2002); Maniv et al. (2003); Sadler et al. (2006a); Weiler et al. (2008); Monaco et al. (2009); Golubchik et al. (2010); Chiara et al. (2010); Mielenz et al. (2013); Ulm et al. (2013); Pyka et al. (2013); Chae et al. (2012); Lin et al. (2014); Griffin et al. (2012); Donadello et al. (2014); Deutschländer et al. (2015); Chomaz et al. (2015); Yukalov et al. (2015); Navon et al. (2015); Liu et al. (2018); Rysti et al. (2021). Topological defects play central role in these studies as they survive inevitable dissipation.
Their role was played down in the quantum KZM (QKZM) that considers quenches across quantum critical points in isolated quantum systems Damski (2005); Zurek et al. (2005); Polkovnikov (2005); Dziarmaga (2005, 2010); Polkovnikov et al. (2011); Schützhold et al. (2006); Saito et al. (2007); Mukherjee et al. (2007); Cucchietti et al. (2007); Cincio et al. (2007); Polkovnikov and Gritsev (2008); Sengupta et al. (2008); Sen et al. (2008); Dziarmaga et al. (2008); Damski and Zurek (2010); De Grandi et al. (2010); Pollmann et al. (2010); Damski et al. (2011); Zurek (2013); Sharma et al. (2015); Dutta and Dutta (2017); Jaschke et al. (2017); Białończyk and Damski (2018); del Campo (2018); Puebla et al. (2019); Sinha et al. (2019); Rams et al. (2019); Mathey and Diehl (2020); Białończyk and Damski (2020a); Sadhukhan et al. (2020); Revathy and Divakaran (2020); Rossini and Vicari (2020); Hódsági and Kormos (2020); Białończyk and Damski (2020b); Roychowdhury et al. (2021); Sadhukhan et al. (2020); Schmitt et al. (2022); Nowak and Dziarmaga (2021); Dziarmaga and Rams (2022); Dziarmaga et al. (2022). It was tested by experiments Sadler et al. (2006b); Anquez et al. (2016); Baumann et al. (2011); Clark et al. (2016); Chen et al. (2011); Braun et al. (2015a); Gardas et al. (2018); Meldgin et al. (2016); Keesling et al. (2019); Bando et al. (2020); Weinberg et al. (2020); King et al. (2022a); Semeghini et al. (2021); Satzinger et al. (2021). Recent developments in Rydberg atoms’ quantum simulators Ebadi et al. (2021); Scholl et al. (2021); Semeghini et al. (2021); Satzinger et al. (2021) and coherent D-Wave King et al. (2022a, b) open possibility to study the QKZM in two and three spatial dimensions and/or to employ it as a test of quantumness of the simulator Nowak and Dziarmaga (2021); King et al. (2022a); Dziarmaga and Rams (2022); Schmitt et al. (2022); Dziarmaga et al. (2022).
The QKZM can be described in brief as follows. A smooth ramp crossing the critical point at time can be linearized in its vicinity as
| (1) |
Here is a dimensionless parameter in a Hamiltonian, that measures distance from the quantum critical point, and is called a quench time. Initially, the system is prepared in its ground state far from the critical point. At first the evolution adiabatically follows the ground state of the changing Hamiltonian until the adiabaticity fails near time when the energy gap becomes comparable to the ramp rate: . This KZM timescale is
| (2) |
Here and are the dynamical and the correlation length critical exponents, respectively.
From a causality point of view Zurek (1985); *Z-b; *Z-c; Sadhukhan et al. (2020), which is most straightforward when the dynamical exponent and the excitations have a definite speed of sound at the critical point, the correlation length initially grows as in step with the correlation length in the adiabatic ground state, that would eventually diverge at the critical point, but near its diverging growth rate,
| (3) |
exceeds the speed limit at which correlations can spread near the critical point. The following growth is limited by Sadhukhan et al. (2020), where is the relevant speed of sound at the critical point. The correlation length at ,
| (4) |
defines the characteristic KZ length. Despite the following growth between and , the correlation range when crossing the critical point is also proportional to although usually a few times longer Sadhukhan et al. (2020). The causality picture can be generalized to where has to be replaced by a relevant speed of excitations that depends on Sadhukhan et al. (2020).
The two KZ scales are interrelated by
| (5) |
Accordingly, in the KZM regime after , observables are expected to satisfy the KZM dynamical scaling hypothesis Kolodrubetz et al. (2012); Chandran et al. (2012); Francuz et al. (2016) with being the unique scale. For, say, a two-point observable , where is a distance between the two points, it reads
| (6) |
where is the state during the quench, is the scaling dimension, and is a non-universal scaling function.
In this paper we consider the QKZM in the 2D Bose-Hubbard model (BHM) on an infinite square lattice. We assume commensurate filling of one particle per site with a well defined Mott-superfluid quantum phase transition. A sudden quench from deep in the Mott phase to the superfluid side of the transition was studied both experimentally Takasu et al. (2020) and numerically Kaneko and Danshita (2022). After the quench the system was allowed to evolve with the final Hamiltonian for a time long enough to estimate the speed at which correlations were spreading – the central phenomenon in the causal interpretation of the QKZM. The aim of the present paper is to demonstrate numerically that these evolution times would also be long enough to verify the KZM scaling hypothesis.
The experimental set up Takasu et al. (2020), where the initial state is a Mott state with the commensurate particle per site, provides an opportunity to go beyond the previous experimental test Chen et al. (2011) where the initial atomic cloud had non-uniform occupation numbers in the range . in the center of the trap may be just large enough to explain why the measured power laws for relatively fast quenches were consistent with the QKZM but with the mean-field values of the critical exponents. Another attempt was made in Ref. Braun et al., 2015b but a limited range of available parameters made the experimental results inconclusive, though in good agreement with numerical simulations of the experimental set-up. On the numerical front a more tractable 1D version was considered Dziarmaga and Zurek (2014); Gardas et al. (2017) where the Kosterlitz-Thouless nature of the transition makes only logarithmically dependent on and, therefore, a clear-cut test of the KZM would require quench times ranging over many orders of magnitude. In contrast, the 2D transition is sharper, the KZM power laws are steeper and their experimental verification should be unambiguous. However, numerical simulation of the non-integrable 2D model is more demanding as the applicability of the numerically exact tensor-network DMRG-like methods becomes severely limited in 2D and one may be forced to resort to the mean-field Gutzwiller ansatzShimizu et al. (2018) instead. In this work we overcome the limitations of the quasi-1D DMRG by employing a genuine 2D tensor network.
II 2D tensor network algorithm
Typical quantum many body states can be represented efficiently by tensor networks Verstraete et al. (2008); Orús (2014). These include the matrix product states (MPS) in one dimension (1D) Fannes et al. (1992), the projected entangled pair state (PEPS) in 2D Nishio et al. (2004); Verstraete and Cirac (2004), or the multi-scale entanglement renormalization ansatz (MERA) Vidal (2007, 2008); Evenbly and Vidal (2014a, b) incarnating the real space renormalization group. Recently an infinite PEPS ansatz (iPEPS) was employed to simulate unitary time evolution on infinite latticesCzarnik et al. (2019); Hubig and Cirac (2019); Hubig et al. (2020); Abendschein and Capponi (2008); Kshetrimayum et al. (2020, 2021); Dziarmaga (2021, 2022a); Schmitt et al. (2022); Kaneko and Danshita (2022, 2023). The simulations include spreading of correlations after a sudden quench in the Bose-Hubbard model (BHM)Kaneko and Danshita (2022) and the transverse field Ising model Kaneko and Danshita (2023) as well as the KZ ramp in the latter Schmitt et al. (2022). In this work we perform simulations of the KZ ramp in the BHM that seem timely in view of the new opportunities opened by the recent experiment Takasu et al. (2020).
We apply the neighbourhood tensor update (NTU) algorithm Dziarmaga (2021) that was previously used to simulate the many body localization Dziarmaga (2022a) and the KZ ramp in the Ising model Schmitt et al. (2022). The evolution operator is Suzuki-Trotter decomposed Trotter (1959); Suzuki (1966, 1976) into a product of nearest neighbor(NN) Trotter gates. As each Trotter gate increases the bond dimension along its NN bond, it has to be truncated back to its original value to prevent its exponential growth with time. The truncation has to be done in a way that minimizes an error afflicted to the quantum state. There are several numerical error measures, each of them implying a different algorithm: the simple update (SU) Hubig et al. (2020); Kshetrimayum et al. (2020), the full update (FU) Phien et al. (2015); Czarnik et al. (2019), the neighbourhood tensor update (NTU) Dziarmaga (2021); Schmitt et al. (2022); Dziarmaga (2022a), or gradient tensor update (GTU) Dziarmaga (2022b). The NTU error measure is explained in Fig. 1. This is the efficient and stable algorithm to be employed here.
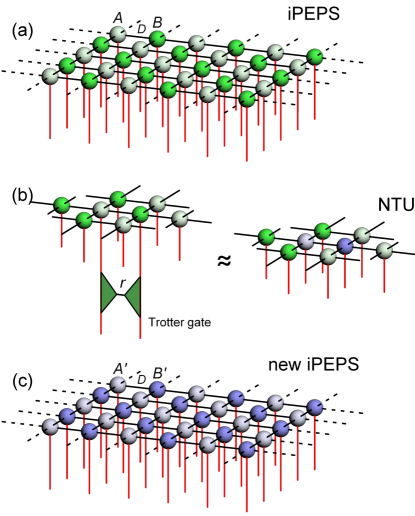
In each Trotter gate the Frobenius norm of the difference between the left () and right () hand sides of Fig. 1b is minimized. The norm,
| (7) |
is what we call an NTU error. For small enough time step it should become proportional to . is an estimate for an error inflicted on local observables by the bond dimension truncation. Accumulating Trotter errors can eventually derail the time evolution. In the worst case scenario the errors are additive. This motivates an integrated NTU error Sinha et al. (2022),
| (8) |
where the sum is over all performed Trotter gates. For a second order Suzuki-Trotter decomposition on a bipartite square lattice, where each time step is a sequence of NN Trotter gates, which is 4 gates per site, estimates an error of a typical local observable. The observables are calculated with the help of the corner transfer matrix renormalization group Corboz et al. (2014); Corboz (2016).
III Bose Hubbard model
The Hamiltonian on an infinite square lattice is
| (9) |
Here and , respectively, creates and annihilates a boson on site , is the number operator, is the strength of the hopping between nearest-neighbor sites, and is on-site repulsion strength. denotes summation over nearest-neighbor (NN) pairs in the hopping energy (every pair contributes to the sum only once). For the commensurate filling of particles per site the continuous Mott-superfluid quantum phase transition is located at Elstner and Monien (1999); Capogrosso-Sansone et al. (2008); Krutitsky (2016). The dynamical exponent and the correlation length exponent , hence .
In an optical lattice both and depend on the recoil energy. Deep in the tight binding regime the dependence of is roughly exponential while that of is relatively weak (if not negligible). In a tensor network simulation the dimension of the local Hilbert space has to be truncated to a finite physical dimension , i.e., to occupation numbers . This is self-consistent on the Mott side of the transition, including the critical point, thanks to limited variance of occupation numbers .
IV Sudden quench revisited
As a benchmark, but also to make contact with Ref. Kaneko and Danshita, 2022, we begin with a sudden quench from deep in the Mott insulator phase to the superfluid. In this section we define the energy scale by setting . The initial Hamiltonian has zero tunnelling, , and the initial ground state is a Fock state:
| (10) |
with one particle per site. This is a product state that can be represented by an initial iPEPS with bond dimension . Then non-zero tunnelling is suddenly switched on at . As in Ref. Kaneko and Danshita, 2022 we consider , i.e., a quench withing the Mott phase. This quench has been performed experimentally in Ref. Takasu et al., 2020 although with a somewhat smoother ramp.
After the quench we follow time evolution of the single particle correlation function
| (11) |
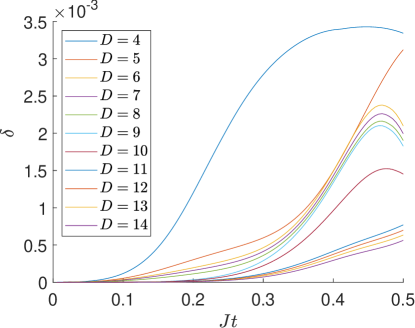
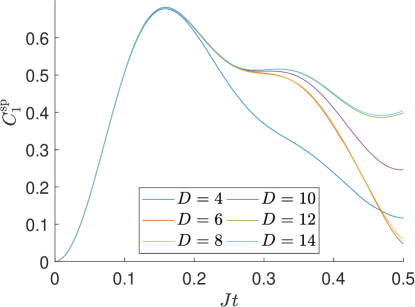
Here is a distance between sites and . Figure 2 shows time evolution of the NN correlator, , up to . Acceptable convergence in this time window requires bond dimension at least . If we were looking just at then it might appear converged already for but closer inspection of the corresponding NTU error in the bottom panel of Fig. 2 reveals that the NTU error does not improve in this range of as if adding more bond dimension did not improve expressive power of the iPEPS ansatz for this problem. Hidden symmetries may require increasing not by but by or more in order to accommodate not just one more virtual state but a whole multiplet before the expressive power is improved Hasik and Becca (2019). The error begins to improve again from and already brings it down to an acceptable level. At the same time, the curves appear converging again but this time with an acceptable level of the integrated NTU error.
This test shows that a combination of the more -efficient NTU algorithm, than the simple update used in Ref. Kaneko and Danshita, 2022, and higher bond dimensions can significantly increase simulable evolution time. The result encourages us to step beyond the sudden quench and attempt smooth KZ ramps that, by their very nature, take longer times.
V Kibble-Zurek ramp
The Kibble-Zurek quench also begins from the product state (10) but the hopping rate is increased by a smooth ramp instead of the sudden jump. Near the critical point the ramp can be approximated by a linear slope. It is convenient to parameterize the ramp as
| (12) |
where is the critical point and is varied from to either as a straight linear ramp or, for instance,
| (13) |
The former is just linear while the latter can be considered approximately linear in the neighborhood of the critical point at , where , provided that quench time is long enough for in (2) to fall withing the regime of validity of the linearization. The additional qubic term in (13) was added to make its first derivative equal to zero at the beginning of the ramp when . This smoothing prevents extra initial excitations that would be created by the abrupt beginning of the linear ramp and might overshadow the KZM excitations created near the critical point. They do not pose a problem for long enough when their energy, proportional to , becomes negligible compared to the KZM excitation energy that is proportional to , but extra bond dimension would be necessary from the very beginning of the tensor network simulation in order to accommodate their extra entanglement. In principle the extra entanglement is not a problem for a quantum simulator/experiment but the relative suppression of the abrupt excitation still requires longer ramp times that are limited by dissipation. In either case there are good reasons to begin the ramp smoothly.
Furthermore, as the on-site repulsion strength, , depends on the recoil energy relatively weakly — when compared to the hopping rate — here we conveniently assume that it is constant and choose the unit of energy such that . Even if we allowed to be time-dependent it could be linearized near the critical point and the only effect of the time dependence would be effective multiplication of by a constant factor. This factor would not affect the KZM scaling hypothesis.
In our simulations the tunneling rate is smoothly ramped up to the critical point at with a time step that is short enough for the second order Suzuki-Trotter scheme to be accurate. As our aim is to verify the KZM power laws, quench times are incremented geometrically as , where is a non-negative integer up to . Longer require larger bond dimensions, up to , as they allow for longer KZM correlation length to build up. The accuracy/convergence was monitored with the NTU error as for the sudden quench. We present results obtained with the physical dimension . Selective test with show that is accurate enough in consistency with small variance of occupation numbers in our simulations.
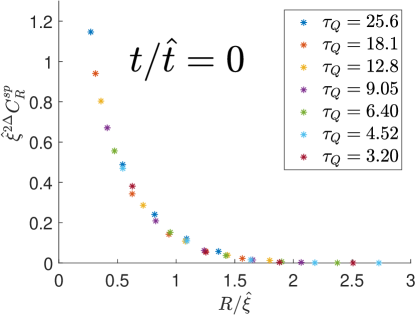
Our main focus is the single particle correlation function. It is the most sensitive probe of the KZM as it quantifies just how the long range order builds up when the system is driven across the Mott-superfluid transition. In particular, according to the general KZM scaling hypothesis (6), when the ramp is crossing the critical point at the correlator should satisfy:
| (14) |
Here is a non-universal scaling function, is an anomalous dimension, and is the KZ correlation length. The correlator at the critical point is plotted in Fig. 3. The top panel shows raw data for while the bottom one the same data but scaled according to (14). In the rescaling we use and with the numerical coefficients set equal to for definiteness. For the single particle correlation function , where Elstner and Monien (1999); Capogrosso-Sansone et al. (2008); Krutitsky (2016). The collapse of the plots with different demonstrates that we reached quench times long enough for the KZM scaling hypothesis to hold as their is small enough to fall within the critical regime near the transition.
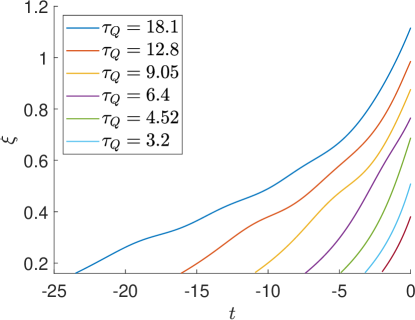
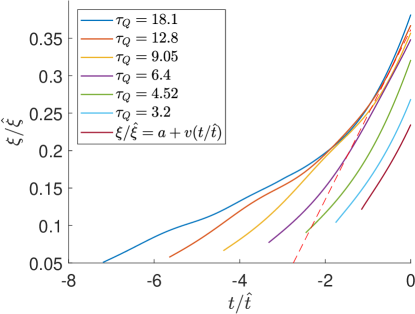
Although the correlation function is not quite exponential, an exponential profile seems to be a reasonably good first approximation that allows to characterize the range of correlations by a single number. In order to ignore numerical noise in the correlator’s long range tail we define the correlation length as . The length is plotted in the top panel of Fig. 4 for several different quench times. Furthermore, motivated by a more general KZM scaling hypothesis,
| (15) |
that should hold in the KZM regime after , in the bottom panel of Fig. 4 we show scaled correlation length, , in function of scaled time, . According to the hypothesis, for long enough the scaled plots should collapse in the KZM regime and, indeed, this is what we can see for the slowest quenches. The collapse allows a linear fit to the collapsed sections of the plots after . Our estimate of the slope is . According to the causality version of KZM, the slope is upper bounded by twice the sound velocity at the critical point and, indeed, it is lower than the Lieb-Robinson velocity predicted and measured in Refs. Kaneko and Danshita, 2022; Takasu et al., 2020, respectively. However, it is strangely low as compared to the upper bound, at odds with many other examples Sadhukhan et al. (2020). We will come back to this issue below.
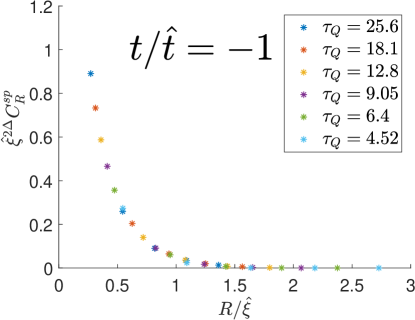
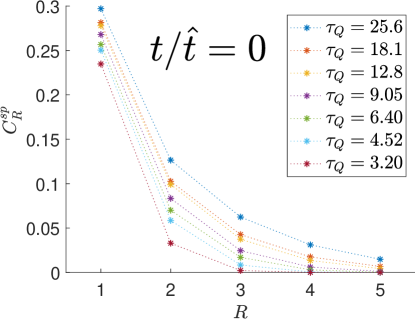
In the meantime, we observe that the collapse in the bottom panel of Fig. 4 is consistent with the general KZM scaling hypothesis (15). This conclusion is further corroborated by a direct test — without any assumption of an exponential or any other specific profile — made in Fig. 5, where scaled correlation functions for different , but for the same scaled time , are plotted together. Their collapse appears even better than the later one at in Fig. 3. These earlier states are less entangled, their correlations are shorter, hence their representation by the tensor network is more accurate. Similar collapses can be obtained in the whole range completing demosntration of the KZM scaling hypothesis for the single particle correlation function.
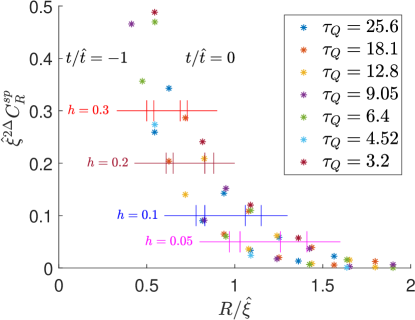
The collapsed correlation functions in Figs. 3 and 5, equal to the scaling functions in (15), provide a more controlled way to estimate the propagation speed Sadhukhan et al. (2020). For a small threshold value and the two values of the scaled time, , equation
| (16) |
can be solved with respect to scaled distance . Given that for we have , the increase of the scaled distance between and is the propagation speed, . Gradually decreasing allows to probe the speed at which farther correlations are spreading and thus make contact with the Lieb-Robinson bound on the asymptote of the correlation function. Figure 6 shows graphic solution of (16), including its error bars, that results in a series of estimates: , , , in our units where . The same speed estimates for an arbitrary are listed in Table 1. The speed appears to increase as threshold is lowered but, at the same time, its error bars increase due to the growing relative significance of numerical uncertainties farther in the correlator tail. Within the error bars the speed is approaching the estimate Kaneko and Danshita (2022); Takasu et al. (2020) that is its upper speed limit according to the casual picture of the Kibble-Zurek mechanism.
| h | v |
|---|---|
| 0.3 | 3.2(7)J |
| 0.2 | 3.8(8)J |
| 0.1 | 5.0(11)J |
| 0.05 | 5.6(17)J |
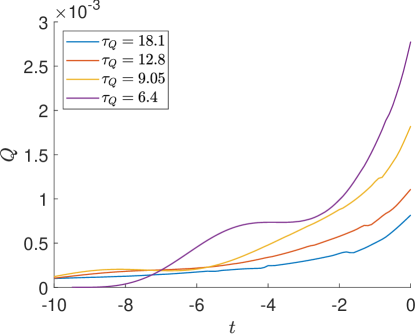
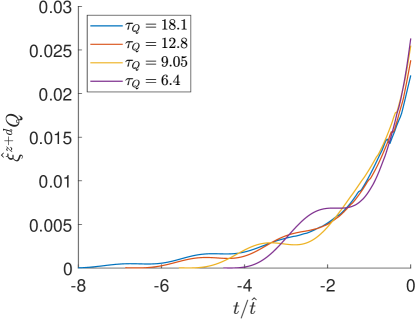
In addition to the single particle correlation function we can also consider excitation energy per site:
| (17) |
Here is the ground state energy of the instantaneous Hamiltonian and is the number of lattice sites. In the KZ regime after the excitation energy should satisfy a scaling hypothesis
| (18) |
where is a non-universal scaling function. On the one hand, with the dependence of on is very steep allowing for a clear-cut test but, on the other hand, with increasing the excitation energy quickly becomes a small difference of two large numbers that is prone to numerical errors. Nevertheless, in the top panel of Fig.7 we plot the excitation energy in function of time for several values of the quench time and in the bottom panel we show the same plots but after the rescaling. The scaled plots demonstrate a rather convincing collapse in the KZM regime after .
VI Thermalization
In order to follow thermalization in the non-integrable model the KZM ramp can be stopped either on the superfluid side of the transition or even right at the critical point where the thermalization should be the most expedient, unhampered by any gap in the energy spectrum. The following unitary evolution with the critical Hamiltonian conserves the KZM excitation energy density while the state evolves into a thermal one with temperature . The critical dispersion, , means thermal excitations up to and thermal excitation energy . Equating with we obtain a “KZ temperature”
| (19) |
and a thermal correlation range . Despite this proportionality the thermal correlator is not the same as the KZ one immediately after stopping the ramp. Interestingly, similar thermalization at and near the critical point but after a sudden quench was considered in Ref. Haldar et al., 2021.
VII Conclusion
The state of the art quantum simulators of the Bose-Hubbard model at commensurate filling allow one to follow spreading of correlations after a sudden quench for times long enough to estimate their propagation velocities. Our 2D tensor network simulations demonstrate that the experimental times would also be long enough to test the quantum Kibble-Zurek mechanism by verifying the KZM scaling hypothesis for the single particle correlation function. The experiment could push this test beyond the limited range of quench times achievable by the classical simulation where the KZM scaling hypothesis should become even more convincing. It could also follow thermalization of the KZ excitations after the ramp is stopped which is a notoriously difficult task for the classical simulation due to rapid growth of entanglement. These are the challenges worthy a genuine quantum simulation.
Acknowledgements.
We are indebted to Ryui Kaneko for comments on the speed limit for correlations. This research was supported in part by the National Science Centre (NCN), Poland under project 2019/35/B/ST3/01028 (J.M.) and project 2021/03/Y/ST2/00184 within the QuantERA II Programme that has received funding from the European Union Horizon 2020 research and innovation programme under Grant Agreement No 101017733 (J.D.). The research was also supported by a grant from the Priority Research Area DigiWorld under the Strategic Programme Excellence Initiative at Jagiellonian University (J.D.).References
- Kibble (1976) T. W. B. Kibble, J. Phys. A9, 1387 (1976).
- Kibble (1980) T. W. B. Kibble, Physics Reports 67, 183 (1980).
- Kibble (2007) T. W. B. Kibble, Physics Today 60, 47 (2007).
- Zurek (1985) W. H. Zurek, Nature 317, 505 (1985).
- Zurek (1993) W. H. Zurek, Acta Phys. Polon. B24, 1301 (1993).
- Zurek (1996) W. H. Zurek, Physics Reports 276, 177 (1996).
- del Campo and Zurek (2014) A. del Campo and W. H. Zurek, Int. J. Mod. Phys. A 29, 1430018 (2014).
- Laguna and Zurek (1997) P. Laguna and W. H. Zurek, Phys. Rev. Lett. 78, 2519 (1997).
- Yates and Zurek (1998) A. Yates and W. H. Zurek, Phys. Rev. Lett. 80, 5477 (1998).
- Dziarmaga et al. (1999) J. Dziarmaga, P. Laguna, and W. H. Zurek, Phys. Rev. Lett. 82, 4749 (1999).
- Antunes et al. (1999) N. D. Antunes, L. M. A. Bettencourt, and W. H. Zurek, Phys. Rev. Lett. 82, 2824 (1999).
- Bettencourt et al. (2000) L. M. A. Bettencourt, N. D. Antunes, and W. H. Zurek, Phys. Rev. D 62, 065005 (2000).
- Zurek et al. (2000) W. H. Zurek, L. M. A. Bettencourt, J. Dziarmaga, and N. D. Antunes, Acta Phys. Pol. B 31, 2937 (2000).
- Uhlmann et al. (2007) M. Uhlmann, R. Schützhold, and U. R. Fischer, Phys. Rev. Lett. 99, 120407 (2007).
- Uhlmann et al. (2010a) M. Uhlmann, R. Schützhold, and U. R. Fischer, Phys. Rev. D 81, 025017 (2010a).
- Uhlmann et al. (2010b) M. Uhlmann, R. Schützhold, and U. R. Fischer, New J. Phys 12, 095020 (2010b).
- Witkowska et al. (2011) E. Witkowska, P. Deuar, M. Gajda, and K. Rzażewski, Phys. Rev. Lett. 106, 135301 (2011).
- Das et al. (2012) A. Das, J. Sabbatini, and W. H. Zurek, Sci. Rep. 2 (2012), 10.1038/srep00352.
- Sonner et al. (2015) J. Sonner, A. del Campo, and W. H. Zurek, Nat. Comm. 6, 7406 (2015).
- Chesler et al. (2015) P. M. Chesler, A. M. García-García, and H. Liu, Phys. Rev. X 5, 021015 (2015).
- Liu et al. (2020) I.-K. Liu, J. Dziarmaga, S.-C. Gou, F. Dalfovo, and N. P. Proukakis, Phys. Rev. Research 2, 033183 (2020).
- Chung et al. (1991) I. Chung, R. Durrer, N. Turok, and B. Yurke, Science 251, 1336 (1991).
- Bowick et al. (1994) M. J. Bowick, L. Chandar, E. A. Schiff, and A. M. Srivastava, Science 263, 943 (1994).
- Ruutu et al. (1996) V. M. H. Ruutu, V. B. Eltsov, A. J. Gill, T. W. B. Kibble, M. Krusius, Y. G. Makhlin, B. Plaçais, G. E. Volovik, and W. Xu, Nature 382, 334 (1996).
- Bäuerle et al. (1996) C. Bäuerle, Y. M. Bunkov, S. N. Fisher, H. Godfrin, and G. R. Pickett, Nature 382, 332 (1996).
- Carmi et al. (2000) R. Carmi, E. Polturak, and G. Koren, Phys. Rev. Lett. 84, 4966 (2000).
- Monaco et al. (2002) R. Monaco, J. Mygind, and R. J. Rivers, Phys. Rev. Lett. 89, 080603 (2002).
- Maniv et al. (2003) A. Maniv, E. Polturak, and G. Koren, Phys. Rev. Lett. 91, 197001 (2003).
- Sadler et al. (2006a) L. E. Sadler, J. M. Higbie, S. R. Leslie, M. Vengalattore, and D. M. Stamper-Kurn, Nature 443, 312 (2006a).
- Weiler et al. (2008) C. N. Weiler, T. W. Neely, D. R. Scherer, A. S. Bradley, M. J. Davis, and B. P. Anderson, Nature 455, 948 (2008).
- Monaco et al. (2009) R. Monaco, J. Mygind, R. J. Rivers, and V. P. Koshelets, Phys. Rev. B 80, 180501 (2009).
- Golubchik et al. (2010) D. Golubchik, E. Polturak, and G. Koren, Phys. Rev. Lett. 104, 247002 (2010).
- Chiara et al. (2010) G. D. Chiara, A. del Campo, G. Morigi, M. B. Plenio, and A. Retzker, New J. Phys. 12, 115003 (2010).
- Mielenz et al. (2013) M. Mielenz, J. Brox, S. Kahra, G. Leschhorn, M. Albert, T. Schaetz, H. Landa, and B. Reznik, Phys. Rev. Lett. 110, 133004 (2013).
- Ulm et al. (2013) S. Ulm, J. Roßnagel, G. Jacob, C. Degünther, S. T. Dawkins, U. G. Poschinger, R. Nigmatullin, A. Retzker, M. B. Plenio, F. Schmidt-Kaler, and K. Singer, Nat. Comm. 4, 2290 (2013).
- Pyka et al. (2013) K. Pyka, J. Keller, H. L. Partner, R. Nigmatullin, T. Burgermeister, D. M. Meier, K. Kuhlmann, A. Retzker, M. B. Plenio, W. H. Zurek, A. del Campo, and T. E. Mehlstäubler, Nat. Comm. 4, 2291 (2013).
- Chae et al. (2012) S. C. Chae, N. Lee, Y. Horibe, M. Tanimura, S. Mori, B. Gao, S. Carr, and S.-W. Cheong, Phys. Rev. Lett. 108, 167603 (2012).
- Lin et al. (2014) S.-Z. Lin, X. Wang, Y. Kamiya, G.-W. Chern, F. Fan, D. Fan, B. Casas, Y. Liu, V. Kiryukhin, W. H. Zurek, C. D. Batista, and S.-W. Cheong, Nat. Phys. 10, 970 (2014).
- Griffin et al. (2012) S. M. Griffin, M. Lilienblum, K. T. Delaney, Y. Kumagai, M. Fiebig, and N. A. Spaldin, Phys. Rev. X 2, 041022 (2012).
- Donadello et al. (2014) S. Donadello, S. Serafini, M. Tylutki, L. P. Pitaevskii, F. Dalfovo, G. Lamporesi, and G. Ferrari, Phys. Rev. Lett. 113, 065302 (2014).
- Deutschländer et al. (2015) S. Deutschländer, P. Dillmann, G. Maret, and P. Keim, Proc. Natl. Acad. Sci. U.S.A. 112, 6925 (2015).
- Chomaz et al. (2015) L. Chomaz, L. Corman, T. Bienaimé, R. Desbuquois, C. Weitenberg, S. Nascimbène, J. Beugnon, and J. Dalibard, Nat. Comm. 6, 6162 (2015).
- Yukalov et al. (2015) V. Yukalov, A. Novikov, and V. Bagnato, Phys. Lett. A 379, 1366 (2015).
- Navon et al. (2015) N. Navon, A. L. Gaunt, R. P. Smith, and Z. Hadzibabic, Science 347, 167 (2015).
- Liu et al. (2018) I.-K. Liu, S. Donadello, G. Lamporesi, G. Ferrari, S.-C. Gou, F. Dalfovo, and N. P. Proukakis, Commun. Phys. 1, 24 (2018).
- Rysti et al. (2021) J. Rysti, J. T. Mäkinen, S. Autti, T. Kamppinen, G. E. Volovik, and V. B. Eltsov, Phys. Rev. Lett. 127, 115702 (2021).
- Damski (2005) B. Damski, Phys. Rev. Lett. 95, 035701 (2005).
- Zurek et al. (2005) W. H. Zurek, U. Dorner, and P. Zoller, Phys. Rev. Lett. 95, 105701 (2005).
- Polkovnikov (2005) A. Polkovnikov, Phys. Rev. B 72, 161201 (2005).
- Dziarmaga (2005) J. Dziarmaga, Phys. Rev. Lett. 95, 245701 (2005).
- Dziarmaga (2010) J. Dziarmaga, Adv. Phys. 59, 1063 (2010).
- Polkovnikov et al. (2011) A. Polkovnikov, K. Sengupta, A. Silva, and M. Vengalattore, Rev. Mod. Phys. 83, 863 (2011).
- Schützhold et al. (2006) R. Schützhold, M. Uhlmann, Y. Xu, and U. R. Fischer, Phys. Rev. Lett. 97, 200601 (2006).
- Saito et al. (2007) H. Saito, Y. Kawaguchi, and M. Ueda, Phys. Rev. A 76, 043613 (2007).
- Mukherjee et al. (2007) V. Mukherjee, U. Divakaran, A. Dutta, and D. Sen, Phys. Rev. B 76, 174303 (2007).
- Cucchietti et al. (2007) F. M. Cucchietti, B. Damski, J. Dziarmaga, and W. H. Zurek, Phys. Rev. A 75, 023603 (2007).
- Cincio et al. (2007) L. Cincio, J. Dziarmaga, M. M. Rams, and W. H. Zurek, Phys. Rev. A 75, 052321 (2007).
- Polkovnikov and Gritsev (2008) A. Polkovnikov and V. Gritsev, Nat. Phys. 4, 477 (2008).
- Sengupta et al. (2008) K. Sengupta, D. Sen, and S. Mondal, Phys. Rev. Lett. 100, 077204 (2008).
- Sen et al. (2008) D. Sen, K. Sengupta, and S. Mondal, Phys. Rev. Lett. 101, 016806 (2008).
- Dziarmaga et al. (2008) J. Dziarmaga, J. Meisner, and W. H. Zurek, Phys. Rev. Lett. 101, 115701 (2008).
- Damski and Zurek (2010) B. Damski and W. H. Zurek, Phys. Rev. Lett. 104, 160404 (2010).
- De Grandi et al. (2010) C. De Grandi, V. Gritsev, and A. Polkovnikov, Phys. Rev. B 81, 012303 (2010).
- Pollmann et al. (2010) F. Pollmann, S. Mukerjee, A. G. Green, and J. E. Moore, Phys. Rev. E 81, 020101 (2010).
- Damski et al. (2011) B. Damski, H. T. Quan, and W. H. Zurek, Phys. Rev. A 83, 062104 (2011).
- Zurek (2013) W. H. Zurek, J. Phys. Condens. Matter 25, 404209 (2013).
- Sharma et al. (2015) S. Sharma, S. Suzuki, and A. Dutta, Phys. Rev. B 92, 104306 (2015).
- Dutta and Dutta (2017) A. Dutta and A. Dutta, Phys. Rev. B 96, 125113 (2017).
- Jaschke et al. (2017) D. Jaschke, K. Maeda, J. D. Whalen, M. L. Wall, and L. D. Carr, New J. Phys. 19, 033032 (2017).
- Białończyk and Damski (2018) M. Białończyk and B. Damski, J. Stat. Mech. Theory Exp. 2018, 073105 (2018).
- del Campo (2018) A. del Campo, Phys. Rev. Lett. 121, 200601 (2018).
- Puebla et al. (2019) R. Puebla, O. Marty, and M. B. Plenio, Phys. Rev. A 100, 032115 (2019).
- Sinha et al. (2019) A. Sinha, M. M. Rams, and J. Dziarmaga, Phys. Rev. B 99, 094203 (2019).
- Rams et al. (2019) M. M. Rams, J. Dziarmaga, and W. H. Zurek, Phys. Rev. Lett. 123, 130603 (2019).
- Mathey and Diehl (2020) S. Mathey and S. Diehl, Phys. Rev. Research 2, 013150 (2020).
- Białończyk and Damski (2020a) M. Białończyk and B. Damski, J. Stat. Mech. Theory Exp. 2020, 013108 (2020a).
- Sadhukhan et al. (2020) D. Sadhukhan, A. Sinha, A. Francuz, J. Stefaniak, M. M. Rams, J. Dziarmaga, and W. H. Zurek, Phys. Rev. B 101, 144429 (2020).
- Revathy and Divakaran (2020) B. S. Revathy and U. Divakaran, J. Stat. Mech. Theory Exp. 2020, 023108 (2020).
- Rossini and Vicari (2020) D. Rossini and E. Vicari, Phys. Rev. Research 2, 023211 (2020).
- Hódsági and Kormos (2020) K. Hódsági and M. Kormos, SciPost Phys. 9, 55 (2020).
- Białończyk and Damski (2020b) M. Białończyk and B. Damski, Phys. Rev. B 102, 134302 (2020b).
- Roychowdhury et al. (2021) K. Roychowdhury, R. Moessner, and A. Das, Phys. Rev. B 104, 014406 (2021).
- Schmitt et al. (2022) M. Schmitt, M. M. Rams, J. Dziarmaga, M. Heyl, and W. H. Zurek, Sci. Adv. 8, eabl6850 (2022).
- Nowak and Dziarmaga (2021) R. J. Nowak and J. Dziarmaga, Phys. Rev. B 104, 075448 (2021).
- Dziarmaga and Rams (2022) J. Dziarmaga and M. M. Rams, Phys. Rev. B 106, 014309 (2022).
- Dziarmaga et al. (2022) J. Dziarmaga, M. M. Rams, and W. H. Zurek, Phys. Rev. Lett. 129, 260407 (2022).
- Sadler et al. (2006b) L. E. Sadler, J. M. Higbie, S. R. Leslie, M. Vengalattore, and D. M. Stamper-Kurn, Nature 443, 312 (2006b).
- Anquez et al. (2016) M. Anquez, B. A. Robbins, H. M. Bharath, M. Boguslawski, T. M. Hoang, and M. S. Chapman, Phys. Rev. Lett. 116, 155301 (2016).
- Baumann et al. (2011) K. Baumann, R. Mottl, F. Brennecke, and T. Esslinger, Phys. Rev. Lett. 107, 140402 (2011).
- Clark et al. (2016) L. W. Clark, L. Feng, and C. Chin, Science 354, 606 (2016).
- Chen et al. (2011) D. Chen, M. White, C. Borries, and B. DeMarco, Phys. Rev. Lett. 106, 235304 (2011).
- Braun et al. (2015a) S. Braun, M. Friesdorf, S. S. Hodgman, M. Schreiber, J. P. Ronzheimer, A. Riera, M. del Rey, I. Bloch, J. Eisert, and U. Schneider, Proc. Natl. Acad. Sci. U.S.A. 112, 3641 (2015a).
- Gardas et al. (2018) B. Gardas, J. Dziarmaga, W. H. Zurek, and M. Zwolak, Sci. Rep. 8, 4539 (2018).
- Meldgin et al. (2016) C. Meldgin, U. Ray, P. Russ, D. Chen, D. M. Ceperley, and B. DeMarco, Nat. Phys. 12, 646 (2016).
- Keesling et al. (2019) A. Keesling, A. Omran, H. Levine, H. Bernien, H. Pichler, S. Choi, R. Samajdar, S. Schwartz, P. Silvi, S. Sachdev, P. Zoller, M. Endres, M. Greiner, V. Vuletić, and M. D. Lukin, Nature 568, 207 (2019).
- Bando et al. (2020) Y. Bando, Y. Susa, H. Oshiyama, N. Shibata, M. Ohzeki, F. J. Gómez-Ruiz, D. A. Lidar, S. Suzuki, A. del Campo, and H. Nishimori, Phys. Rev. Research 2, 033369 (2020).
- Weinberg et al. (2020) P. Weinberg, M. Tylutki, J. M. Rönkkö, J. Westerholm, J. A. Åström, P. Manninen, P. Törmä, and A. W. Sandvik, Phys. Rev. Lett. 124, 090502 (2020).
- King et al. (2022a) A. D. King, S. Suzuki, J. Raymond, et al., Nat. Phys. (2022a).
- Semeghini et al. (2021) G. Semeghini, H. Levine, A. Keesling, S. Ebadi, T. T. Wang, D. Bluvstein, R. Verresen, H. Pichler, M. Kalinowski, R. Samajdar, A. Omran, S. Sachdev, A. Vishwanath, M. Greiner, V. Vuletic, and M. D. Lukin, Science 374, 1242 (2021).
- Satzinger et al. (2021) K. J. Satzinger et al., Science 374, 1237 (2021).
- Ebadi et al. (2021) S. Ebadi, T. T. Wang, H. Levine, A. Keesling, G. Semeghini, A. Omran, D. Bluvstein, R. Samajdar, H. Pichler, W. W. Ho, S. Choi, S. Sachdev, M. Greiner, V. Vuletic, and M. D. Lukin, Nature 595, 227 (2021).
- Scholl et al. (2021) P. Scholl, M. Schuler, H. J. Williams, A. A. Eberharter, D. Barredo, K.-N. Schymik, V. Lienhard, L.-P. Henry, T. C. Lang, T. Lahaye, A. M. Läuchli, and A. Browaeys, Nature 595, 233 (2021).
- King et al. (2022b) A. D. King, J. Raymond, T. Lanting, R. Harris, A. Zucca, F. Altomare, A. J. Berkley, K. Boothby, S. Ejtemaee, C. Enderud, E. Hoskinson, S. Huang, E. Ladizinsky, A. J. R. MacDonald, G. Marsden, R. Molavi, T. Oh, G. Poulin-Lamarre, M. Reis, C. Rich, Y. Sato, N. Tsai, M. Volkmann, J. D. Whittaker, J. Yao, A. W. Sandvik, and M. H. Amin, “Quantum critical dynamics in a 5000-qubit programmable spin glass,” (2022b).
- Kolodrubetz et al. (2012) M. Kolodrubetz, B. K. Clark, and D. A. Huse, Phys. Rev. Lett. 109, 015701 (2012).
- Chandran et al. (2012) A. Chandran, A. Erez, S. S. Gubser, and S. L. Sondhi, Phys. Rev. B 86, 064304 (2012).
- Francuz et al. (2016) A. Francuz, J. Dziarmaga, B. Gardas, and W. H. Zurek, Phys. Rev. B 93, 075134 (2016).
- Takasu et al. (2020) Y. Takasu, T. Yagami, H. Asaka, Y. Fukushima, K. Nagao, S. Goto, I. Danshita, and Y. Takahashi, Science Advances 6, eaba9255 (2020), https://www.science.org/doi/pdf/10.1126/sciadv.aba9255 .
- Kaneko and Danshita (2022) R. Kaneko and I. Danshita, Communications Physics 5, 65 (2022).
- Braun et al. (2015b) S. Braun, M. Friesdorf, S. S. Hodgman, M. Schreiber, J. P. Ronzheimer, A. Riera, M. del Rey, I. Bloch, J. Eisert, and U. Schneider, Proceedings of the National Academy of Sciences 112, 3641 (2015b).
- Dziarmaga and Zurek (2014) J. Dziarmaga and W. H. Zurek, Scientific Reports 4, 5950 (2014).
- Gardas et al. (2017) B. Gardas, J. Dziarmaga, and W. H. Zurek, Phys. Rev. B 95, 104306 (2017).
- Shimizu et al. (2018) K. Shimizu, Y. Kuno, T. Hirano, and I. Ichinose, Phys. Rev. A 97, 033626 (2018).
- Verstraete et al. (2008) F. Verstraete, V. Murg, and J. Cirac, Adv. Phys. 57, 143 (2008).
- Orús (2014) R. Orús, Ann. Phys. (Amsterdam) 349, 117 (2014).
- Fannes et al. (1992) M. Fannes, B. Nachtergaele, and R. Werner, Comm. in Math. Phys. 144, 443 (1992).
- Nishio et al. (2004) Y. Nishio, N. Maeshima, A. Gendiar, and T. Nishino, arXiv:cond-mat/0401115 (2004).
- Verstraete and Cirac (2004) F. Verstraete and J. I. Cirac, arXiv:cond-mat/0407066 (2004).
- Vidal (2007) G. Vidal, Phys. Rev. Lett. 99, 220405 (2007).
- Vidal (2008) G. Vidal, Phys. Rev. Lett. 101, 110501 (2008).
- Evenbly and Vidal (2014a) G. Evenbly and G. Vidal, Phys. Rev. Lett. 112, 220502 (2014a).
- Evenbly and Vidal (2014b) G. Evenbly and G. Vidal, Phys. Rev. B 89, 235113 (2014b).
- Czarnik et al. (2019) P. Czarnik, J. Dziarmaga, and P. Corboz, Phys. Rev. B 99, 035115 (2019).
- Hubig and Cirac (2019) C. Hubig and J. I. Cirac, SciPost Phys. 6, 31 (2019).
- Hubig et al. (2020) C. Hubig, A. Bohrdt, M. Knap, F. Grusdt, and J. I. Cirac, SciPost Phys. 8, 21 (2020).
- Abendschein and Capponi (2008) A. Abendschein and S. Capponi, Phys. Rev. Lett. 101, 227201 (2008).
- Kshetrimayum et al. (2020) A. Kshetrimayum, M. Goihl, and J. Eisert, Phys. Rev. B 102, 235132 (2020).
- Kshetrimayum et al. (2021) A. Kshetrimayum, M. Goihl, D. M. Kennes, and J. Eisert, Phys. Rev. B 103, 224205 (2021).
- Dziarmaga (2021) J. Dziarmaga, Phys. Rev. B 104, 094411 (2021).
- Dziarmaga (2022a) J. Dziarmaga, Phys. Rev. B 105, 054203 (2022a).
- Kaneko and Danshita (2023) R. Kaneko and I. Danshita, “Dynamics of correlation spreading in low-dimensional transverse-field ising models,” (2023).
- Trotter (1959) H. F. Trotter, Proc. Amer. Math. Soc. 10, 545 (1959).
- Suzuki (1966) M. Suzuki, J. Phys. Soc. Jpn. 21, 2274 (1966).
- Suzuki (1976) M. Suzuki, Prog. Theor. Phys. 56, 1454 (1976).
- Phien et al. (2015) H. N. Phien, J. A. Bengua, H. D. Tuan, P. Corboz, and R. Orús, Phys. Rev. B 92, 035142 (2015).
- Dziarmaga (2022b) J. Dziarmaga, Phys. Rev. B 106, 014304 (2022b).
- Sinha et al. (2022) A. Sinha, M. M. Rams, P. Czarnik, and J. Dziarmaga, Phys. Rev. B 106, 195105 (2022).
- Corboz et al. (2014) P. Corboz, T. M. Rice, and M. Troyer, Phys. Rev. Lett. 113, 046402 (2014).
- Corboz (2016) P. Corboz, Phys. Rev. B 94, 035133 (2016).
- Elstner and Monien (1999) N. Elstner and H. Monien, Phys. Rev. B 59, 12184 (1999).
- Capogrosso-Sansone et al. (2008) B. Capogrosso-Sansone, i. m. c. G. m. c. Söyler, N. Prokof’ev, and B. Svistunov, Phys. Rev. A 77, 015602 (2008).
- Krutitsky (2016) K. V. Krutitsky, Physics Reports 607, 1 (2016), ultracold bosons with short-range interaction in regular optical lattices.
- Hasik and Becca (2019) J. Hasik and F. Becca, Phys. Rev. B 100, 054429 (2019).
- Haldar et al. (2021) A. Haldar, K. Mallayya, M. Heyl, F. Pollmann, M. Rigol, and A. Das, Phys. Rev. X 11, 031062 (2021).