Supplementary Material for Current-Induced Metallization and Valence Transition in Black SmS
S1. Drude and Lorentz fitting for reflectivity spectra
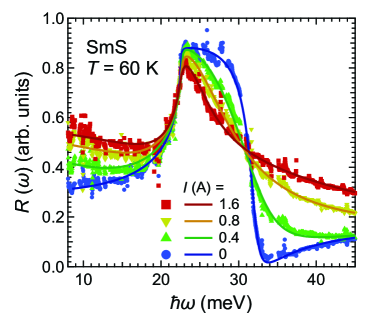
In the current-dependent reflectivity () measurements, the absolute value of the could not be obtained because the conventional in-situ gold evaporation method [1] can not be used. Then, we adopted the following combination of Drude and Lorentz functions [2] for the fitting of experimentally obtained spectra (), which do not have exact reflectivity, as follows:
Here, is a complex dielectric function as a function of frequency (photon energy). Constant values of , , , and are the sum of the real part of the dielectric constant at a higher frequency (energy) region, the dielectric constant of vacuum, the elementary charge, and the electron rest mass, respectively. In the Drude function, is the effective electron density, , where and are the carrier density and the effective carrier mass, and is the relaxation time of carriers. In the Lorentz function, are the effective density of phonons, , where and are the density and reduced mass of the phonon, respectively, and and are the frequency and the dumping constant of the phonon, respectively. spectra can be regarded as a relative spectra, which corresponds to actual spectra () multiplied by the magnification constant (). We obtained seven parameters (, , , , , , and ) in the function fitted by a nonlinear least-square method to . In these parameters, even though is changed in different sample settings, , and are almost constant as 3.0 and 22.5 meV, respectively. Other parameters, , , , and , are changed by temperatures and currents. An example of the fitting results is shown in Fig. S1. and as functions of temperature and current are plotted in Figs. 1(c–f), and and are shown in the next section.
S2. Temperature and Current dependences of phonon parameters
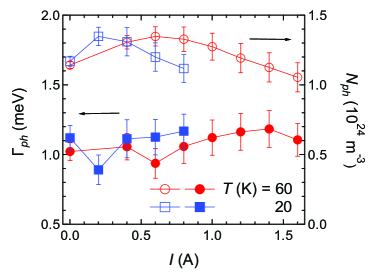
Current-dependent and for TO phonons at and 60 K, at which the nonlinear current dependence appears, are shown in Fig. S2. Both parameters are unchanged so much in comparison with and shown in Figs. 1(c–f), especially the damping constant is almost constant in the whole current region, even though and are strongly variable. This result suggests that the sample temperature, one of the origins of the , did not change so much in the measured current region below 1.6 A.
References
- Homes et al. [1993] C. C. Homes, M. Reedyk, D. A. Cradles, and T. Timusk, Appl. Opt. 32, 2976 (1993).
- Dressel and Grüner [2002] M. Dressel and G. Grüner, Electrodyn. Solids (Cambridge University Press, 2002).