Comparison and Analysis of Cognitive Load under 2D/3D Visual Stimuli
Abstract
Whether the human brain responds differently to 2D and 3D visual stimuli is a fascinating and important issue for understanding cognitive processes. In this study, we investigated the cognitive differences between human responses to 2D and 3D visual stimuli using EEG data analysis. Our experiment involved presenting 4 video stimuli that contain typical cognitive tasks. Participants are required to watch both 2D and 3D stimuli while their EEG data are recorded simultaneously. We then analyzed the power of alpha and theta oscillations in their EEG data and used the cognitive load index (CLI) as an indicator to evaluate their brain activities. Our results indicate that 3D videos containing simple observation tasks induced higher cognitive load in most participants. However, only half of the participants had a higher cognitive load for the calculation tasks. Though the cognitive load level of participants showed significant individual differences, our experiments suggest that 3D visual stimuli may induce more cognitive activities than 2D ones on average.
Index Terms:
Cognitive load, alpha oscillations, theta oscillations, 3D videoI Introduction
COGNITION is a fundamental psychological function in humans that encompasses the processes of acquiring, interpreting, and utilizing information. The cognitive load, or the amount of mental effort required to process input information, always increases with the complexity of cognitive tasks. The cognitive load is significant in the design of human-machine interacting systems[1]. For instance, the performance of eye-tracking-based control systems is heavily related to the efficiency of visual content cognition.
In terms of capturing information, virtual stimuli captured by human visual systems can be classified into 3D and 2D video stimuli. Compared to 2D videos, 3D videos can provide a more immersive viewing experience. Thus, an important issue is investigating the cognitive load variations when humans are experienced 3D or 2D video stimuli.
Some questionnaire measuring methods for cognitive load has been proposed [2, 3, 4]. Besides, Physiological indicators-based cognition measuring methods take heart rate[5], eye movements[6], hormone levels[7], functional magnetic resonance imaging (fMRI), electroencephalography (EEG)[8, 9], etc. as measuring parameters. However, physiological methods for measuring cognitive load have their limitations. For example, heart rate changes and hormone levels are not sensitive to changes in transient cognitive load, while the sensitivity of pupil changes to changes in cognitive load decreases with the age of the participant[6]. In contrast, EEG is a good scheme for measuring cognitive load. It has highly high real-time performance and can non-invasive monitor brain activity in various experimental environments. Although EEG is easily affected by motion noise during acquisition[10], modern EEG systems are equipped with powerful software which can effectively remove various artifacts.
II EEG and Index of Cognitive Load
II-A Alpha and theta oscillation
Among all kinds of EEG oscillations, alpha, and theta oscillations are most relevant to cognitive processes[11, 12, 13], and their changes reflect what happens to the participant during information processing, which the participant cannot directly express with words. Alpha oscillation is related to spatial existence, text memory, and attention[14, 15, 16]. Theta oscillation is believed to be related to episodic memory[17, 18]. Klimesch[8] believes that theta oscillation is related to the process of receiving new information. That is, when participants encode new information, theta oscillation power will increase significantly. Miller designed a series of semantic consistency and situational recognition tasks in a study[18]. He analyzed EEG data by using event-related desynchronization (ERD) as a method to measure the uniform correlation variation of the power of theta oscillation and alpha oscillation. The experimental results show that the encoding of situational information is related to theta oscillation, while the semantic memory process is related to alpha oscillation. In addition, some studies have shown that compared with the age-matched control group, the power of alpha oscillation in dementia participants decreased, while the power of theta oscillation increased[19, 20, 21].
As mentioned above, alpha oscillation and theta oscillation are closely related to cognition. Therefore, research on EEG changes under 3D and 2D video stimulation involves the analysis of alpha oscillation and theta oscillation[22, 16, 23, 24]. However, their conclusions are not uniform. In Kweon’s study[16], the alpha oscillation of participants watching 2D video is higher than that of 3D video. In Dan’s study[22], participants had higher alpha power when watching 3D videos containing complex tasks and similar alpha power when watching 2D and 3D videos of less complex tasks. Klimesch clearly explained in his article[8] that brain waves such as alpha oscillation have substantial individual differences, and the data in Dan’s and Kweon’s research also conform to this feature. In this case, if the average value is used as the basis for data comparison, the characteristics of samples with smaller absolute values of data will be covered by the characteristics of samples with larger absolute values. Therefore, an independent comparison of individuals may be a more reasonable way.
II-B Index of cognitive load (CLI)
The index of cognitive load (CLI) can be expressed by the ratio of the absolute power of theta oscillation and alpha oscillation, which includes the influence of the two oscillations on cognition. Holm et al.[25] believed through experimental comparison that the theta oscillation in the cognitive load index should use the absolute power of the participant’s frontal lobe (Fz) theta oscillation, and the alpha oscillation should use the absolute power of the participant’s parietal lobe (Pz) alpha oscillation. They believe that, at this time, the ratio of the two can effectively monitor cognitive load. For individuals, the larger the CLI, the more effective the brain’s behavior, which should also mean that the work can be completed more effectively. However, being in a state of excessive cognitive load for a long time will make people fast tired, increase error rate and affect work efficiency.
III Evaluating Experiments Setup and Analysing Methodos
III-A Participants
The study included 12 participants without visual impairment, including seven men and five women. Among them, there was a male participant whose artifact was too large, so we abandoned his data. The remaining participants were between 21 and 25 years old, with an average age of 22.82 (SE=1.78). Before the formal experiment, each participant watched 3D videos through our 3D playback equipment and confirmed that they could observe 3D effects. In addition, participants were asked to ensure the quality of rest and avoid drinking alcohol and caffeine from the day to the time before the experiment.
III-B Video stimulation
Many studies exploring the difference between the EEG displayed by people watching 3D and 2D video classify the video [22, 16]. On the one hand, when people watch videos, they always watch with a purpose (or task). On the other hand, the intensity of changes in video content varies. Therefore, we can classify videos from two aspects: the purpose of watching videos and the content of videos. From the perspective of purpose, we can divide videos into videos with simple observation tasks and videos with simple calculation tasks. From the perspective of video content, we can divide it into videos with violent changes in content and calm videos. The ”changes” can be either the change of the object displayed in the video or the change of the video angle. When we define (a) - (d) corresponding to four videos, videos can be classified according to Table I.
| Simple observation | Simple calculation | |
| Violent | video (a) | video (b) |
| Clam | video (c) | video (d) |
-
1
The videos (a)-(d) in the table represent the first to fourth videos.
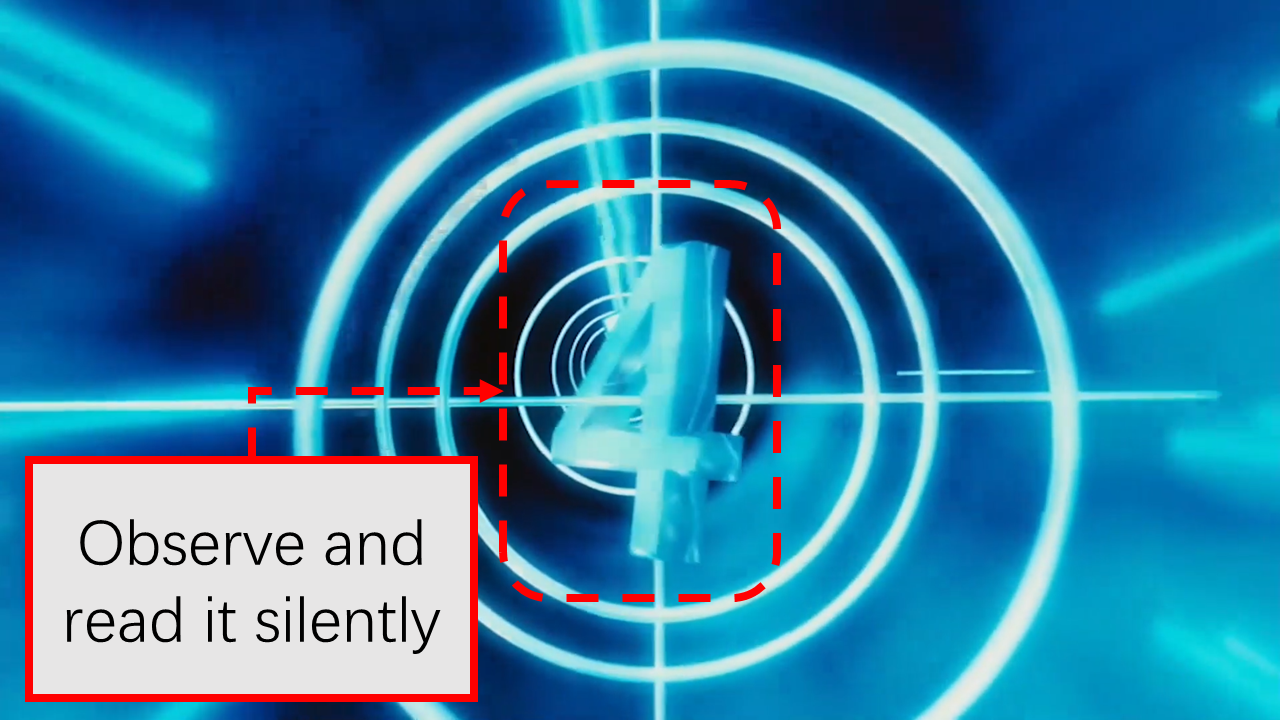
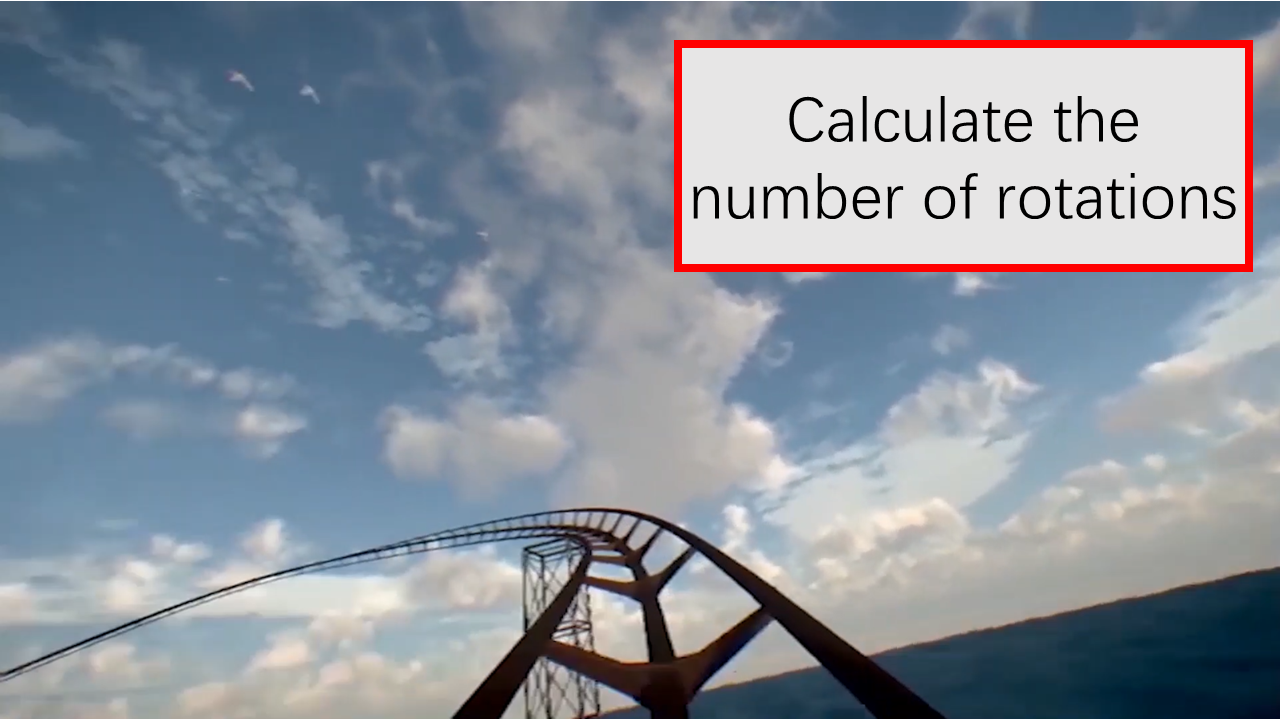
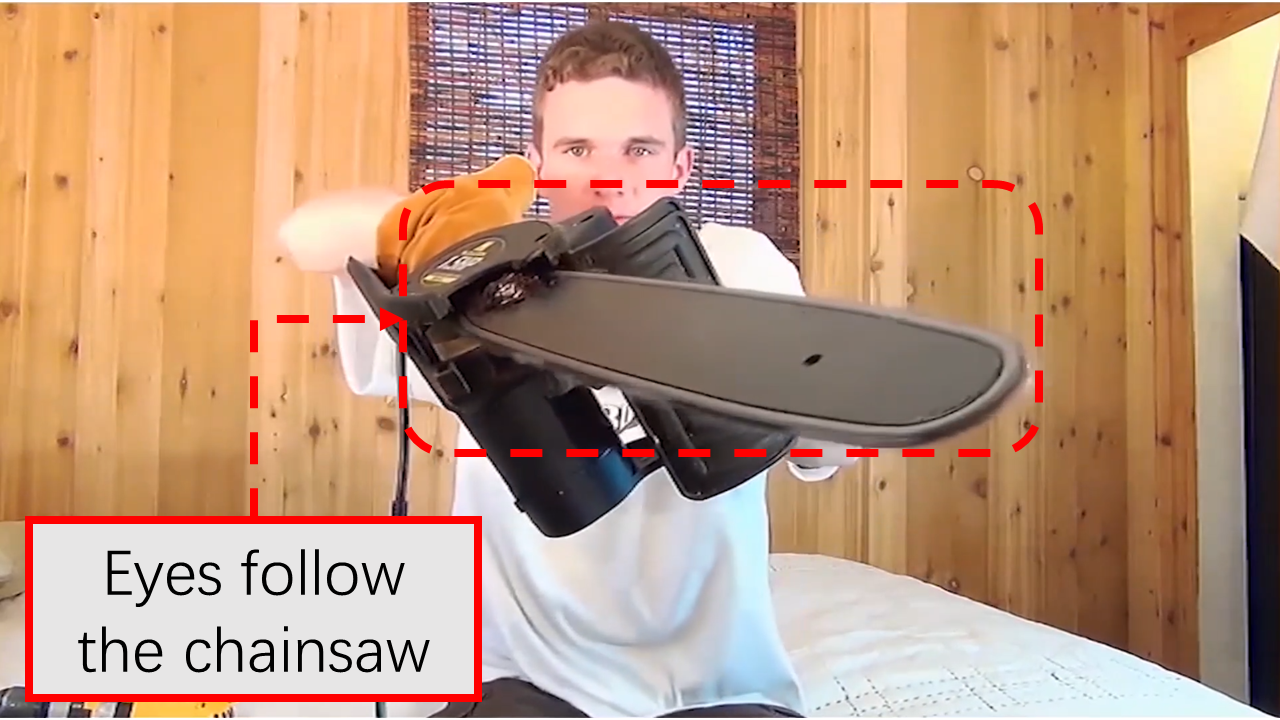
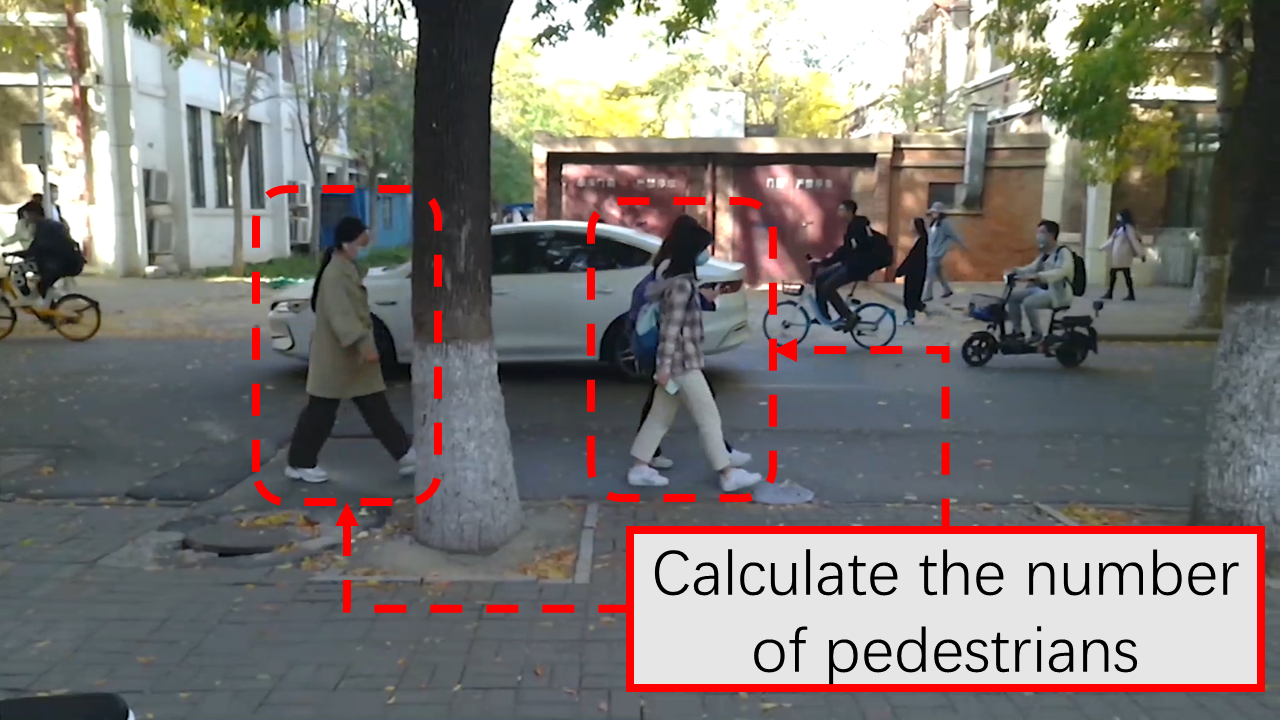
The video stimuli used in this experiment are divided into four segments, both of which have 2D and 3D versions. The main content of the first video is huge Arabic numerals. The number in the video will change from 9 to 1. During the experiment, the participants will be asked to follow the number changes to count down in their minds. The main content of the second video is a virtual roller coaster. The video perspective will rotate from time to time. The degree of rotation is sometimes 180 degrees, sometimes 360 degrees. In addition, the perspective of the video periodically rotates several 360 degrees continuously and quickly. During the experiment, participants were asked to calculate the total number of 360 degrees of rotation. In the calculation process, every two 180-degree angle rotations are required to be regarded as a 360-degree angle rotation, regardless of whether the two 180-degree angle rotations are continuous. The main content of the third video is that a man is using an electric saw. During the experiment, participants were asked to keep an eye on the electric saw at all times. The fourth short video is mainly about pedestrian-intensive streets. The fourth video is primarily about crowded streets. Participants were asked to calculate how many people passed from left to right in the video during the experiment. The car shown in the video is required to be regarded as two people.
The four videos are in the form of 2 x 2. From the tasks carried by the video, the first video and the third video are videos with simple observation tasks, while the second video and the fourth video are videos with simple calculation task. Judging from the degree of violent changes in video content, the first and second videos belong to videos with violent changes in content, while the third and fourth videos belong to calm videos.
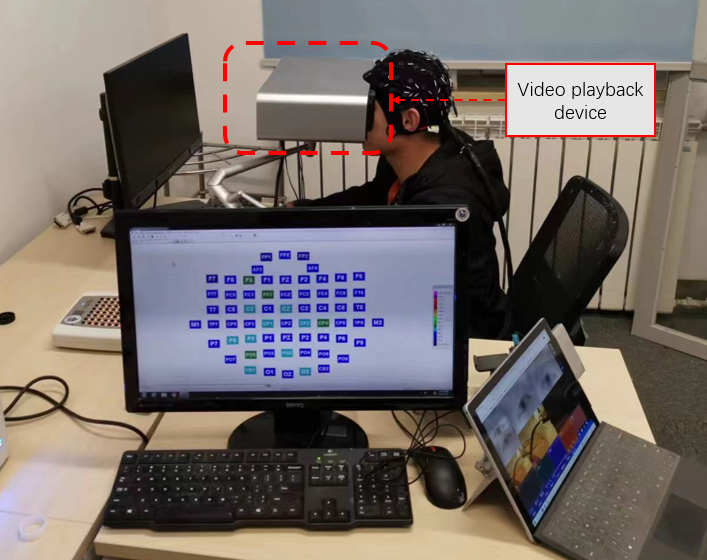
III-C Video playback device
The video playback device we use is a desktop with dimensions of 412 in length, 270 in width, and 105 in thickness. The device has an excellent 3D playback effect and can be used in experiments[26]. Like most VR devices, our video playback device achieves 3D effects by outputting different images to the left and right eyes of participants. Participants’ visual field will be limited to the player when they watch the video by using the device. In addition, if the video has the requirement of outputting audio, the device can output audio through noise-reduction headphones. This experiment explores the impact of video form on cognitive load, so we did not let the device output audio.
III-D Procedures
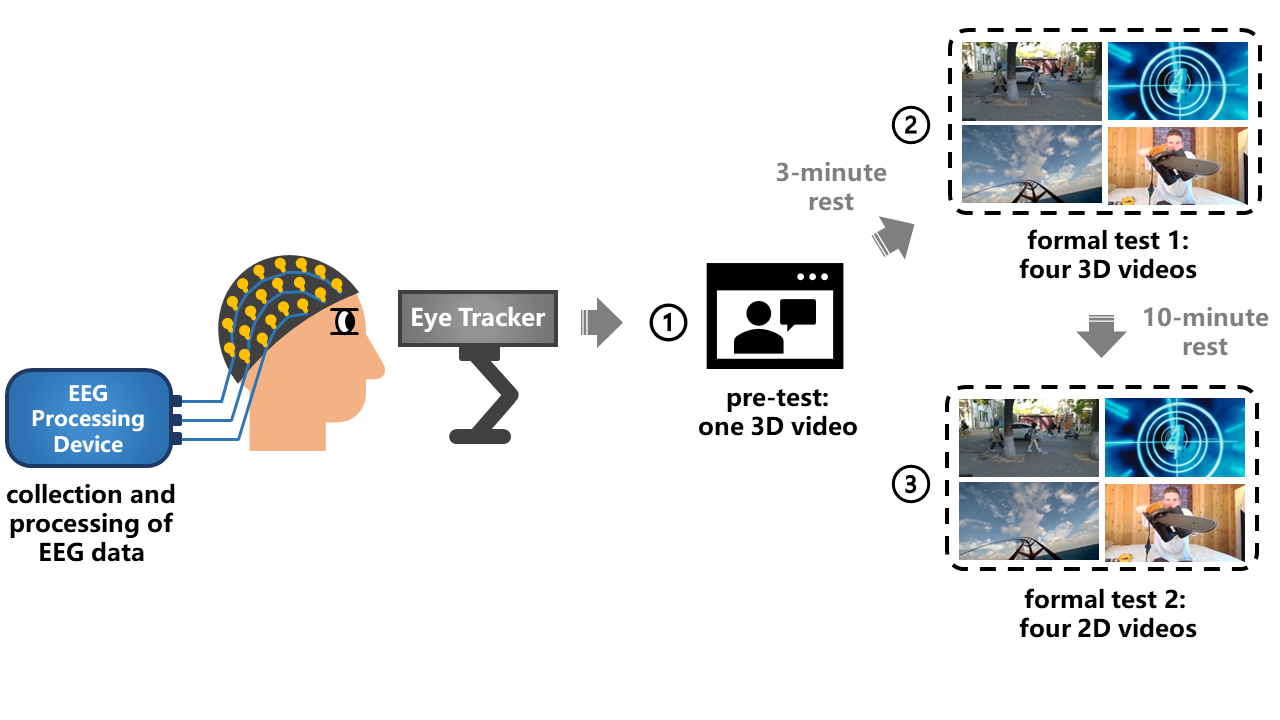
Before the beginning of the experiment, the participants will receive the paper with the specific task of the experiment. The experiment started after the participants confirmed that they understood the task content. The flow of the experiment is shown in Fig. 1. The participants sat in front of the video playback device. The EEG cap was applied and calibrated. Each participant was asked to watch an unrelated 3D video first. Then the participants began to watch four 3D videos in sequence after a 3-minute rest. Before each video, the participants were asked to repeat the task requirements corresponding to the video to ensure that they still remembered the task content. After watching a video, the participants were asked to take a 5-minute rest. Then, we will ask the participants to take a 10-minute rest. After the rest, the participants watched the 2D version again according to the above process. The process of participants watching the video is shown in Fig. 3.
III-E EEG recording and pre-processing
According to the international 10-10 system, we used a 64-channel EEG recorder (Neuracle Technology, Changzhou, China) to collect and record EEG signals at a sampling rate of 1000Hz while participants watched the video. Keep the electrode impedance below 5k during EEG recording. Since this experiment aims to analyze cognitive load, we mainly record the Fz and Pz electrodes. M1 and M2 electrodes are used for re-reference in subsequent pretreatment. We use the EEGLAB toolbox [27] to preprocess the collected data. The main processes of preprocessing include filtering, baseline correction, and artifact removal. In the filtering process, we use a 0.5-30Hz band-pass filter. In addition, independent component analysis (ICA) is used to remove artifacts, which are mainly ophthalmic and myoelectric. Finally, the average power of alpha (4-8Hz) and theta (8-12Hz) of the EEG signal is calculated by Fourier transform.
IV Results
IV-A Alpha and theta power distribution
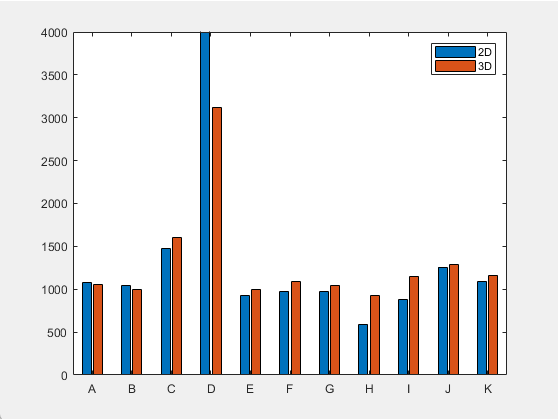
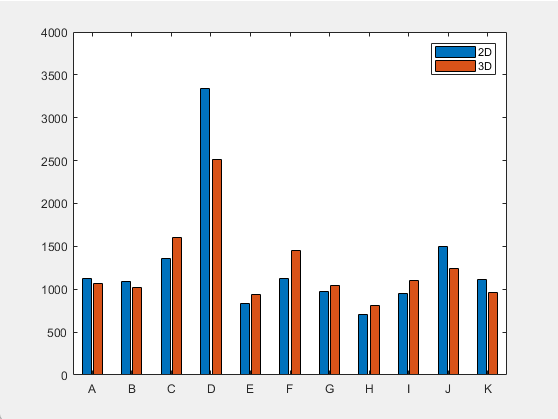
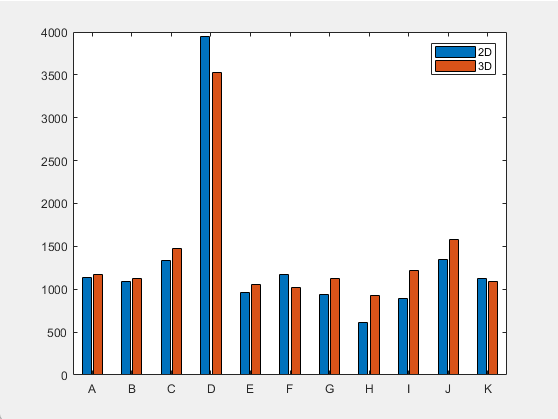
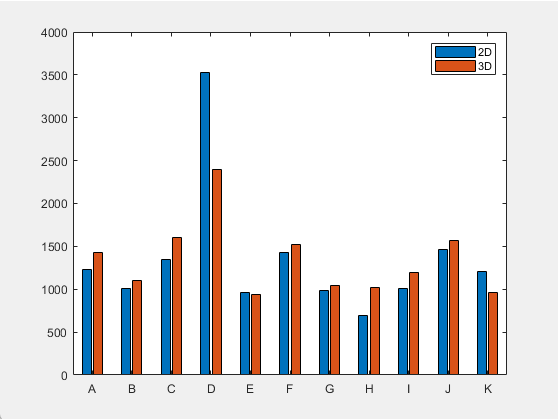
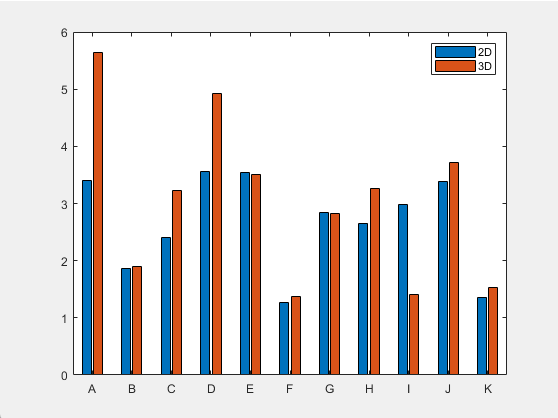
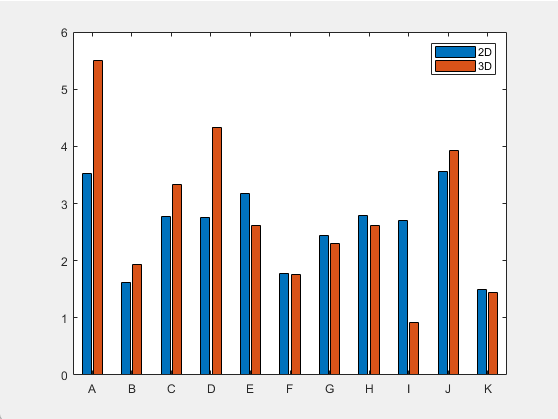
We calculate the power of alpha oscillation and theta oscillation according to the EEG signals collected. Fig. 4 shows the power of theta oscillation in the four videos of 2D and 3D versions. Fig. 5 shows the power of alpha oscillation in the four videos of the participants in 2D and 3D versions.
Fig. 4 shows that most people have higher theta oscillation power when watching the 3D video, especially when watching the first and third videos, which are classified as videos with simple observation tasks. For the first video, eight of the participants had a greater theta oscillation power when watching the 3D version of the video than when watching the 2D version, while three of the participants had a lower theta oscillation power when watching the 3D version of the video than when watching the 2D version. For the second video, five of the participants had a greater theta oscillation power when watching the 3D version of the video than when watching the 2D version, while six of the participants had a lower theta oscillation power when watching the 3D version of the video than when watching the 2D version. For the third video, eight of the participants had a greater theta oscillation power when watching the 3D version of the video than when watching the 2D version, while three of the participants had a lower theta oscillation power when watching the 3D version of the video than when watching the 2D version. For the fourth video, four of the participants had a greater theta oscillation power when watching the 3D version of the video than when watching the 2D version, while five of the participants had a lower theta oscillation power when watching the 3D version of the video than when watching the 2D version.
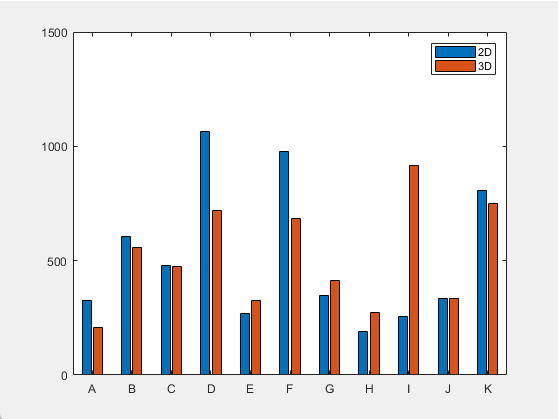
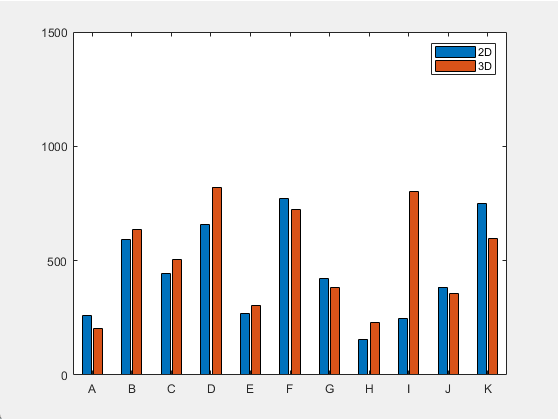
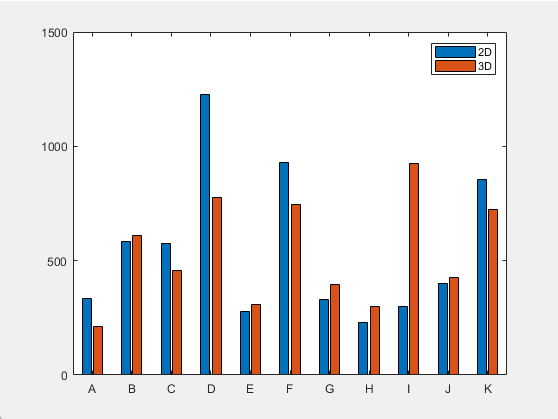
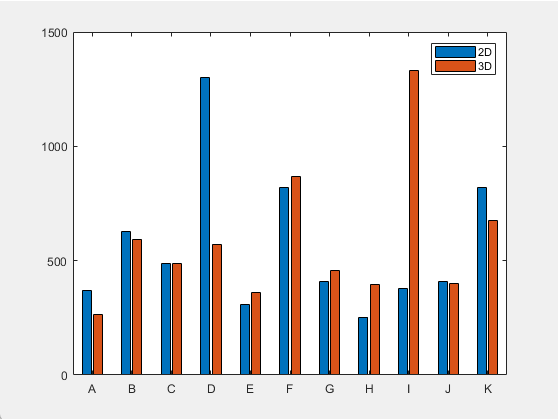
Fig. 5 shows that there is no regular difference in the power of the alpha oscillation when the participants watch 3D and 2D videos. For the first video, the alpha oscillation power of 5 participants watching the 3D version of the video was greater than that of the 2D version, while the alpha oscillation power of 4 participants watching the 3D version of the video was lower than that of the 2D version. The other two people showed almost the same alpha power when watching the two versions of the video. For the second video, the alpha oscillation power of 6 participants watching the 3D version of the video was greater than that of the 2D version, while the alpha oscillation power of 5 participants watching the 3D version of the video was lower than that of the 2D version. For the third video, the alpha oscillation power of 6 participants watching the 3D version of the video was greater than that of the 2D version, while the alpha oscillation power of 5 participants watching the 3D version of the video was lower than that of the 2D version. For the fourth video, the alpha oscillation power of 5 participants watching the 3D version of the video was greater than that of the 2D version, while the alpha oscillation power of 5 participants watching the 3D version of the video was lower than that of the 2D version. Another person showed almost the same alpha power when watching the two versions of the video.
IV-B Comparison of cognitive load index (CLI)
According to the power of theta oscillation and alpha oscillation obtained in the previous section, we use the formula
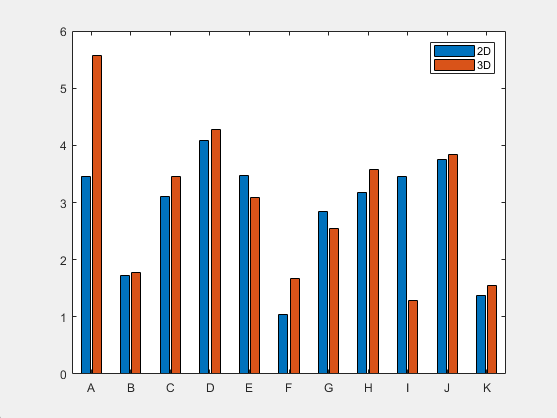
to calculate CLI. The results are shown in Fig. 6. According to the calculation results, we found that the characteristics of CLI are similar to those of theta oscillation power. That is, most participants have larger CLI and theta power when watching the 3D versions of the first and third videos. For the first and third videos, 8 of the 11 participants had a larger CLI when watching the 3D version of the videos. In addition, although the specific values are different, the CLI differences of the 11 participants when watching the 2D and 3D versions of the first and third videos are the same. That is, the 8 participants who watched the 3D version of the first video with a larger CLI were the 8 participants who watched the 3D version of the third video with a larger CLI. There is no statistical difference between the second and fourth videos. In addition, the CLI of 11 participants showed significant individual differences. The average and variance of the CLI when they watch each video are listed in Table II.
| Video (a) | Video (b) | Video (c) | Video (d) | |
| 2D | ||||
| 3D |
-
1
The videos (a) (b) in the table represent the first to fourth videos.
-
2
The numbers outside the brackets are the average values of the CLI, and the numbers in the brackets are the standard deviations
V Discussion
This study aims to explore the cognitive differences between participants watching the 3D video and 2D video in different situations. Compared with the 2D video, the 3D video should be more in line with our daily habits of observing real scenes. However, in life, many people feel more uncomfortable and tired when watching 3D movies than watching 2D movies [28, 29]. One view is that compared with 2D video, 3D video provides additional depth information about the scene. Therefore, we need additional mental resources when receiving visual information. For videos with simple observation tasks, our research results show that the cognitive load of participants when watching 3D video is higher than that of 2D video. Therefore, the 3D video will enable people to mobilize more mental labor resources when they simply watch and understand the video content. For videos with computing tasks, the participants did not show similar differences when watching 3D and 2D videos. On the other hand, the intensity of video content changes will not affect the cognitive load difference of participants watching 3D and 2D versions of video as the task difficulty does.
Under specific circumstances, it is difficult for participants to express whether the 3D video has mobilized more spiritual resources through subjective feelings. As a sensitive and convenient monitoring method for various experimental scenarios, EEG’s theta and alpha oscillations are related to cognitive load. Therefore, it is very suitable to be used as a tool to explore the above issues. CLI takes both theta and alpha oscillation into account, so its value is quite convincing. In addition, as a specific number, CLI can facilitate the quantification of the use of mental resources.
Fig. 4 shows that 8 out of 11 participants showed higher theta oscillation power when watching 3D videos with simple observation tasks, although the difference is insignificant. In this respect, theta oscillation power shows the same characteristics as CLI. The difference between most participants’ power of theta oscillation is not as significant as that of CLI. However, one participant (D) showed much higher theta oscillation power than others. The difference in theta oscillation power between the 3D video and 2D video that he watched alone was even higher than the sum of other participants. Although the power of his theta oscillation is far greater than that of others, its value is still within the normal range.
According to our experimental results, alpha oscillation does not show a statistical law similar to CLI. That is, the number of people watching the 3D video with higher alpha oscillation power is almost the same as the number watching the 2D video with higher alpha oscillation power. This is the result in all four video scenarios. In addition, the difference in alpha oscillation power between samples is significant. Some participants’ alpha oscillation power is even 2 to 3 times that of others.
It can be seen from Fig. 6 that we cannot assert that all people will have a higher cognitive load when watching the 3D version of the video. Even when watching the first video and the third video, there are still a few participants who will show higher cognitive load when watching the 2D version of the video. In addition, there are obviously individual differences in participants’ CLI. Some participants had more than twice as many CLI as others. According to Table II, the average CLI value of the participants watching the 3D version of the video is larger for the first and third videos. This further confirms our conclusion from the side. In addition, the standard deviation of CLI in Table II almost exceeds 33% of the average value, which confirms that there are significant individual differences in the cognitive load of participants.
Although there are many unexpected factors, these do not affect us to get a convincing result. That is, for videos with simple observation tasks, most people will have a higher cognitive load when watching 3D versions of videos. Kalyuga et al. believe that when cognitive load is suitable for learners’ abilities and needs, it can enable participants to complete learning tasks efficiently to the greatest extent[30]. Based on the conclusion of this experiment, we can think that in a short time simple learning or experimental involving simple video, using 3D video as a stimulus can effectively improve cognitive load and thus improve work efficiency. Especially in the experiment of exploring cognitive situations through eye movement, their video stimulation time is short. In addition, the tasks of eye movement experiments are mostly simple observations and do not involve calculation. Therefore, for these experiments, using 3D video as a stimulus can more fully mobilize brain resources and explore the cognitive situation of participants more effectively.
VI Conclusion
This paper investigated the difference in cognitive load between 3D and 2D visual stimuli containing various scenarios. Our results showed that when the video was accompanied by a simple observation task, participants who watched the 3D version had a higher cognitive load than those who watched the 2D version. Cognitive load index (CLI) was calculated using the theta oscillation power of the parietal lobe and the alpha oscillation power of the frontal lobe, and the differences of the CLI indicated that 3D visual stimuli could induce more activities in the human brain.
Acknowledgments
This work is partly funded by the National Natural Science Foundation of China.
References
- [1] E. Galy, M. Cariou, and C. Mélan, “What is the relationship between mental workload factors and cognitive load types?” International Journal of Psychophysiology, vol. 83, no. 3, pp. 269–275, 2012. [Online]. Available: https://www.sciencedirect.com/science/article/pii/S016787601100300X
- [2] F. G. Paas, J. J. Van Merriënboer, and J. J. Adam, “Measurement of cognitive load in instructional research,” Perceptual and motor skills, vol. 79, no. 1, pp. 419–430, 1994.
- [3] F. Paas, A. Renkl, and J. Sweller, “Cognitive load theory and instructional design: Recent developments,” Educational psychologist, vol. 38, no. 1, pp. 1–4, 2003.
- [4] F. Paas, J. E. Tuovinen, H. Tabbers, and P. W. Van Gerven, “Cognitive load measurement as a means to advance cognitive load theory,” in Educational psychologist. Routledge, 2016, pp. 63–71.
- [5] F. G. Paas and J. J. Van Merriënboer, “Variability of worked examples and transfer of geometrical problem-solving skills: A cognitive-load approach.” Journal of educational psychology, vol. 86, no. 1, p. 122, 1994.
- [6] P. W. Van Gerven, F. Paas, J. J. Van Merriënboer, and H. G. Schmidt, “Memory load and the cognitive pupillary response in aging,” Psychophysiology, vol. 41, no. 2, pp. 167–174, 2004.
- [7] G. Y. E. WILSON, “Ft (1991). physiological measures of workload in multi-task environments,” Multiple-Task Performance, pp. 329–360, 1991.
- [8] W. Klimesch, “Eeg alpha and theta oscillations reflect cognitive and memory performance: a review and analysis,” Brain research reviews, vol. 29, no. 2-3, pp. 169–195, 1999.
- [9] C. W. Anderson and J. A. Bratman, “Translating thoughts into actions by finding patterns in brainwaves,” in Proceedings of the fourteenth Yale workshop on adaptive and learning systems, 2008, pp. 1–6.
- [10] C. Berka, D. J. Levendowski, M. M. Cvetinovic, M. M. Petrovic, G. Davis, M. N. Lumicao, V. T. Zivkovic, M. V. Popovic, and R. Olmstead, “Real-time analysis of eeg indexes of alertness, cognition, and memory acquired with a wireless eeg headset,” International Journal of Human-Computer Interaction, vol. 17, no. 2, pp. 151–170, 2004.
- [11] E. Basar, “Brain function and oscillations. ii. integrative brain function,” Neurophysiology and cognitive processes, 1999.
- [12] W. Klimesch, B. Schack, and P. Sauseng, “The functional significance of theta and upper alpha oscillations.” Experimental psychology, vol. 52, no. 2, p. 99, 2005.
- [13] W. Penfield and H. Jasper, “Epilepsy and the functional anatomy of the human brain.” Electroencephalography and Clinical Neurophysiology, 1954.
- [14] S. E. Kober, J. Kurzmann, and C. Neuper, “Cortical correlate of spatial presence in 2d and 3d interactive virtual reality: an eeg study,” International Journal of Psychophysiology, vol. 83, no. 3, pp. 365–374, 2012.
- [15] W. Klimesch, “Eeg-alpha rhythms and memory processes,” International Journal of psychophysiology, vol. 26, no. 1-3, pp. 319–340, 1997.
- [16] S. H. Kweon, H. J. Kweon, S.-j. Kim, X. Li, X. Liu, and H. L. Kweon, “A brain wave research on vr (virtual reality) usage: Comparison between vr and 2d video in eeg measurement,” in International Conference on Applied Human Factors and Ergonomics. Springer, 2017, pp. 194–203.
- [17] G. Buzsáki, A. Bragin, J. Chrobak, Z. Nádasdy, A. Sik, M. Hsu, and A. Ylinen, “Oscillatory and intermittent synchrony in the hippocampus: relevance to memory trace formation,” in Temporal coding in the brain. Springer, 1994, pp. 145–172.
- [18] R. Miller, “Cortico-hippocampal interaction: Theory, implications and predictions,” in Cortico-Hippocampal Interplay and the Representation of Contexts in the Brain. Springer, 1991, pp. 159–188.
- [19] C. Besthorn, R. Zerfass, C. Geiger-Kabisch, H. Sattel, S. Daniel, U. Schreiter-Gasser, and H. Förstl, “Discrimination of alzheimer’s disease and normal aging by eeg data,” Electroencephalography and clinical neurophysiology, vol. 103, no. 2, pp. 241–248, 1997.
- [20] R. Chiaramonti, G. Muscas, M. Paganini, T. J. Müller, A. Fallgatter, V. Versari, and W. Strik, “Correlations of topographical eeg features with clinical severity in mild and moderate dementia of alzheimer type,” Neuropsychobiology, vol. 36, no. 3, pp. 153–158, 1997.
- [21] L. A. Coben, W. Danziger, and M. Storandt, “A longitudinal eeg study of mild senile dementia of alzheimer type: changes at 1 year and at 2.5 years,” Electroencephalography and clinical neurophysiology, vol. 61, no. 2, pp. 101–112, 1985.
- [22] A. Dan and M. Reiner, “Eeg-based cognitive load of processing events in 3d virtual worlds is lower than processing events in 2d displays,” International Journal of Psychophysiology, vol. 122, pp. 75–84, 2017.
- [23] C. Chen, K. Li, Q. Wu, H. Wang, Z. Qian, and G. Sudlow, “Eeg-based detection and evaluation of fatigue caused by watching 3dtv,” Displays, vol. 34, no. 2, pp. 81–88, 2013.
- [24] N. Manshouri and T. Kayıkçıoğlu, “Classification of 2d and 3d videos based on eeg waves,” in 2016 24th Signal Processing and Communication Application Conference (SIU). IEEE, 2016, pp. 949–952.
- [25] A. Holm, K. Lukander, J. Korpela, M. Sallinen, and K. M. Müller, “Estimating brain load from the eeg,” TheScientificWorldJOURNAL, vol. 9, pp. 639–651, 2009.
- [26] J. Sun, Z. Wu, H. Wang, P. Jing, and Y. Liu, “A novel integrated eye-tracking system with stereo stimuli for 3d gaze estimation,” IEEE Transactions on Instrumentation and Measurement (Early Access), pp. 1–1, 2022.
- [27] A. Delorme and S. Makeig, “Eeglab: an open source toolbox for analysis of single-trial eeg dynamics including independent component analysis,” Journal of neuroscience methods, vol. 134, no. 1, pp. 9–21, 2004.
- [28] E. C. Lee, H. Heo, and K. R. Park, “The comparative measurements of eyestrain caused by 2d and 3d displays,” IEEE Transactions on Consumer Electronics, vol. 56, no. 3, pp. 1677–1683, 2010.
- [29] A. G. Solimini, “Are there side effects to watching 3d movies? a prospective crossover observational study on visually induced motion sickness,” PloS one, vol. 8, no. 2, p. e56160, 2013.
- [30] S. Kalyuga, “Instructional designs for the development of transferable knowledge and skills: A cognitive load perspective,” Computers in Human Behavior, vol. 25, no. 2, pp. 332–338, 2009.