The characteristic rupture height of the mediating air film beneath an impacting drop on atomically smooth mica
Abstract
Before a droplet can contact a surface during impact, it must first displace the air beneath it. Over a wide range of impact velocities, the droplet first compresses the air into a thin film, enhancing its resistance to drainage; this slows the progress of the liquid toward the surface. Indeed, below a critical impact velocity, the air film remains intact, and rebounds off of the air film without making contact. For impact velocities exceeding this critical impact velocity, the droplet always makes contact. The initiation of contact formation requires a topological transition, whereby the initially connected gas domain is ruptured, and a liquid capillary bridge forms, binding the droplet to the surface. Here we probe this transition in detail around the critical impact velocity using calibrated total internal reflection (TIR) microscopy to monitor the air film thickness and profile at high speed during the impact process. Two air film rupture modalities are observed: nucleated contacts, which are isolated and don’t correspond to the global minimum air film thickness, and spontaneous contacts, that occur always on a ring centered upon the impact axis where the air film reaches its global minimum. Our measurements show that for impact velocities exceeding the critical velocity for contact initiation, the air film ruptures at a nearly identical height nm, for two fluids - silicone oil and a water glycerol mixture. The height and time duration of the air film prior to contact, analyzed for over 180 droplet impact experiments, are consistent with a linear instability driven by van der Waals forces in the range of experimentally measured values of the Hamaker constant. Impact events of water solution droplets show different statistics for contact nucleation than the silicon oil; this suggests another mechanism may dominate contact nucleation during impact of the solution; nevertheless, a critical impact velocity above which contact always occurs is identifiable for both liquids.
I Introduction
The initial formation of contact between a liquid and a solid surface is typically mediated by a third medium - most often in our daily experience, air. Indeed, when a droplet of water impacts a solid, it makes contact imperceptibly quickly - a transition so rapid that it occurs much faster than we can observe with the unaided eye. However, from a continuum perspective, we know the gas must be punctured, or otherwise disrupted, for liquid-solid contact to form. The process of droplet impact is at the center not only of our daily experience, but also in myriad industrial settings such as heat transfer, fuel injection and inkjet printing [1]. The role of air in droplet impacts has been thoroughly studied, from its initial formation and evolution[2, 3, 4, 5, 6, 7, 8, 9], non-contact bouncing transition[10, 11, 12] to post-contact wetting[13, 14, 15]. It is clear that over a wide range of impact velocities, despite the ubiquity and applicability of droplet impact mechanics, the key phase of air film disruption and the formation of contact remains to be precisely quantified.
Although the air film formation and rupture phenomenon have been identified in prior work, and it is clear that the air film thickness evolves relatively slowly[8], there are striking discrepancies in the value of the air film thickness immediately prior to contact that are reported by different experimental studies [3, 16, 17, 18] ranging from nm to several hundred nm. With this large spread in the measured air film thickness prior to rupture, the mechanism responsible for the instability of the air film has not yet been conclusively determined. Indeed, various mechanisms ranging from spinodal dewetting[19, 20, 3] to gas kinetic effects [12] to electrostatics[21] or surface roughness[22, 23] have been identified as possible causes for air film rupture; however, the spread in the data of the measured air film thickness prior to rupture makes it impossible to distinguish between the various mechanisms that may dominate these dynamics. Thus, a fundamental and important question of what drives liquids into contact with solid surfaces through an intervening gas remains open, with implications for coating flows[24] and splashing[25].
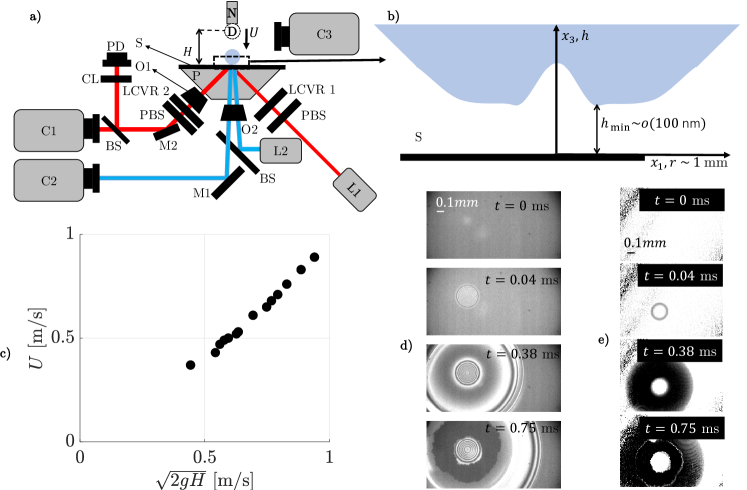
In this letter, we present measurements of the temporal evolution of the air film that are calibrated to nanometers. To achieve this calibration, we employ two optical methods that are used simultaneously to ensure rigorous calibration of the measurement - total internal reflection microscopy (TIR) [3, 26] and single-color interferometry (FIF)[27]. Once the simultaneous imaging yields a calibrated TIR measurement with a prescribed displacement of a precision piezo stage, we use the higher precision TIR measurement to image the liquid-air interface during droplet impact over a velocity range from to m/s on freshly-cleaved, atomically smooth mica substrates at high-speeds (80,000 fps, Photron Nova S12). This velocity range contains the rebound-to-wetting transition [10] for both water-glycerol and silicon oil droplets. To control the impact velocity precisely, droplets are released from a luer tip, with a diameter selected to yield identically sized droplets of either water-glycerol or silicon oil. To establish good statistics of the impact dynamics, multiple impacts were carried out at each impact velocity. Analysis of the recorded film profiles yields the height of closest approach prior to rebound, , obtained by azimuthally averaging the data for a single event, or the height of closest approach, obtained at each pixel where air film rupture is observed .
Despite the great care we take in preparing the mica surfaces, nucleation of contact is nevertheless occassionally observed, oftener for the water-glycerol solution than for the silicon oil; the time to wait between air film formation and eventual rupture, , is recorded for each event. The data are then analyzed using the prediction of linear stability analysis for the timescale for the development of the linear instability. A wave-number and Hamaker constant pair yield a line that cleanly separates the nucleated contacts from the spontaneous rupture events, highlighting the consistency of the observed air film destabilization events with the interfacial-forces driven instability via the spinodal dewetting of the air film. We comment on how this observation might prove useful in future numerical calculations, and its importance to liquid-solid contact formation more generally.
II Experimental Setup and Methods
The experimental setup consists of two distinct optical paths corresponding to the TIR and FIF experimental methods used to characterize the liquid-air interface beneath the impacting drops. The first path, dedicated to the TIR measurement, directs coherent laser light to strike the impact surface obliquely from below, whereas the second path, dedicated to the FIF measurement, directs light from a weakly coherent ( 2.5 m such that it is normally incident upon the impact surface from below; the key components for each optical path are depicted schematically in Fig. 1(a). Such simultaneous profilometry provides complementary data for interfacial mechanics [28, 29, 30, 31]. The liquid-air interface prior to contact initiation is depicted schematically in Fig. 1(b). To control the impact velocity , we vary the height from which the droplet is allowed to fall; due to the residual oscillations of the droplet prior to impact, a weak non-linearity of emerges as a function of , as shown in Fig. 1(c). Two example time-synchronized image series, recorded with the two respective optical paths, are depicted in Fig. 1(d) & (e).
To probe the stability of the air film, the defects commonly encountered on even carefully cleaned glass surfaces must be avoided. This requires a solid surface that will be devoid of material defects over an area of at least ca. 1 mm2. To obtain such ‘perfect’ surfaces, we cleave sheets of high-grade mica through their thickness, generating an atomically smooth surface over several mm2. Experiments are conducted with two different liquids: water-glycerol solution droplets with mm and silicon oil with mm. We used silicon oil with a viscosity of cSt and prepared the water-glycerol solution mixture to have the same kinematic viscosity. The density of the solution and oil are kg/m3 and kg/m3, respectively. The surface tension for the solution ( mPa.m) is greater than of the oil ( mPa.m) as measured by pendant drop method. Both liquids wet the mica surface with immeasurably small contact angles. The finite viscosity of the liquid is used to suppress high-frequency oscillations that can rupture the air film upon the center of the impact axis[32], and suppress droplet rebound.
Mica is a weakly birefringent solid, and can alter the polarization of the light used in TIR optical path. The birefringence of the mica can be pre- and post-compensated with liquid crystal variable retarder plates, ensuring strict control over the state of polarization at the reflecting surface, where the droplet will impact the surface. While prior studies suggest an analytical means of calibrating the transfer function from intensity to height [26, 15], we used complementary optical methods to perform a direct calibration using a precision piezo stage, as described in detail in Appendix A. The concurrent imaging with TIR and FIF provides complimentary information about the liquid-air-solid interface - TIR can resolve air layer thicknesses up to nm, whereas FIF can visualize the air film profile of up to several microns [33]. In FIF, the film profile is encoded in a two-dimensional fringe pattern, where the intensity of the fringes indicates the optical interference at a given spatial location within the image. While the FIF fringe patterns can be demodulated to provide absolute film measurements that are up to few microns thick, we only analyze the regions where the film thickness is less than half of the light wavelength, or approximately nm.
Our microscopy setup has a resolution of m in the plane. In the direction, the resolution of profilometry is as low as nm but the calibrated field of view has a ceiling at about nm. The threshold of unstable air gap thicknesses ( and ) fall within the calibrated range of our imaging modalities. As the dynamics of droplet rebound and air film rupture are very rapid, high-speed imaging is employed to attain relevant temporal information from our experiments. Light from the two optical paths is imaged onto the sensors of synchronized high-speed cameras (Photron Nova S12), and the sensor data is recorded at frames per second. The sequence of images in Fig. 1(d) & (e) shows the rapid nature of air film formation, its rupture, and surface wetting.
III Air Film Formation and Rupture
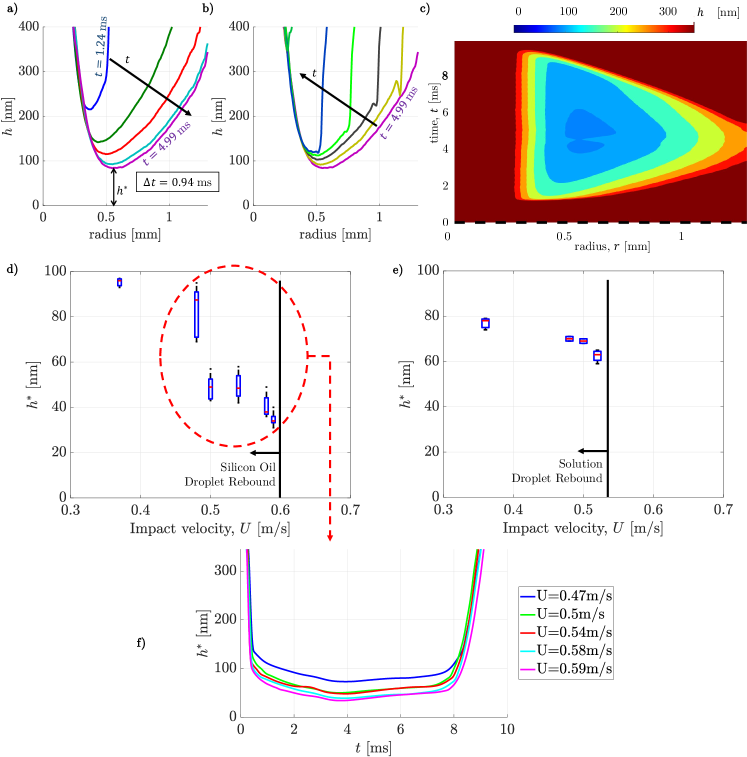
At the early stage of a low speed impact, the liquid skates over the air [3], increasing the lateral extent of the air film. In this regime, the droplet entrains the air at the leading edge of the drop, and depending on the liquid viscosity, can lift off away from the surface [8], generating the extended liquid-gas interface above the solid. The extended air film drains very slowly, and remains stable provided it doesn’t approach within a critical distance of the surface [10]. Indeed, for sufficiently slow impacts, the droplet will reliably rebound from the air film [10], as shown in Fig. 2(a) & (b) . This indicates a threshold height of closest approach, , that decreases as the impact speed increases (Fig. 2(c) & (d)). The bouncing to wetting transition velocity for the oil droplets ( m/s) is higher than that of the solution ( m/s). At the same time, the silicon oil droplet reliably approaches closer to the surface: nm for the oil, while nm for the solution.
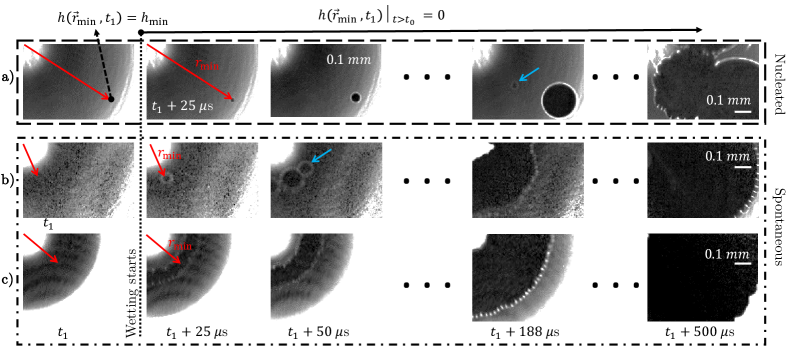
The initial formation of contact - via a topological transition from a coherent air film to a locally ruptured air film - is observed to occur in two distinct manifestations. First, and most commonly, the air film ruptures locally, at an isolated contact, independently of the relative location of the globally minimal air film thickness. Such events clearly nucleate at a surface imperfection, owing to the proximity of the liquid to the solid over the extent of the thin air film. The outward-advancing wetting front remains symmetrically centered upon the location of initial contact formation as previously described [15]; an example of such a nucleated contact is given in the time series shown in Fig. 3(a). The second mode of contact formation is typified by the near exact correspondence between the location of air film rupture and the globally minimum air film height. Due to the axisymmetry of the air film profile, such events are often clustered closely in time, and occur at a nearly identical radial distance from the impact axis. Two examples of this spontaneous mode of contact formation are shown in Fig. 3(b) & (c).
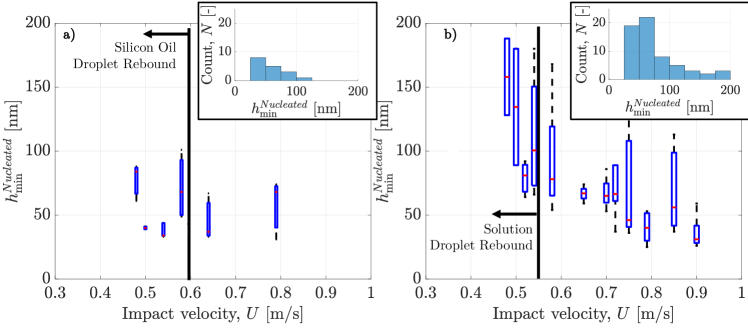
For all contacts, we measure the local height of the air film immediately prior to contact formation, , using the last frame recorded. is plotted as a function of impact velocity in Fig. 4. The distribution for nucleated contacts is uniform with respect to the impact velocity, as described in detail in Appendix B, where the distribution of contact heights is skewed slightly higher for the water-glycerol solution than for the silicon oil droplet impacts.
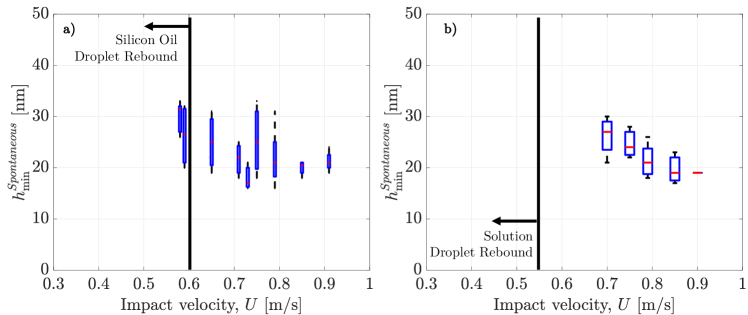
In the absence of nucleation, spontaneous contact formation was observed only for nm. Below this height, contact initiates suddenly, forming a capillary bridge that binds the liquid to the solid surface. Notably, for higher velocity impacts, the resolution of can be limited by the acquisition rate, as the drainage rate of the air film increases with larger ; thus, depending on the phase of the image acquisition and the contact formation, a different value of might be recorded. For each value of , we repeated experiments several times, and thus serendipitously capture lower values of , where the image recorded corresponds to the time immediately prior to contact. In this way, the lower bound of data is the relevant quantity. nm for both the silicone oil and the water-glycerol solution. Notably, spontaneous contact occurred much more frequently for the oil than for the water glycerol solution - this occurs because nucleation is sporadically observed to occur at larger for the water glycerol, as described in detail in Appendix B. For all spontaneous contacts, falls in a range of nm for both liquids. for spontaneous contact doesn’t change considerably with the impact speed. The changes observed are within the tolerance of our measurement accuracy, at ca. 7 nm.
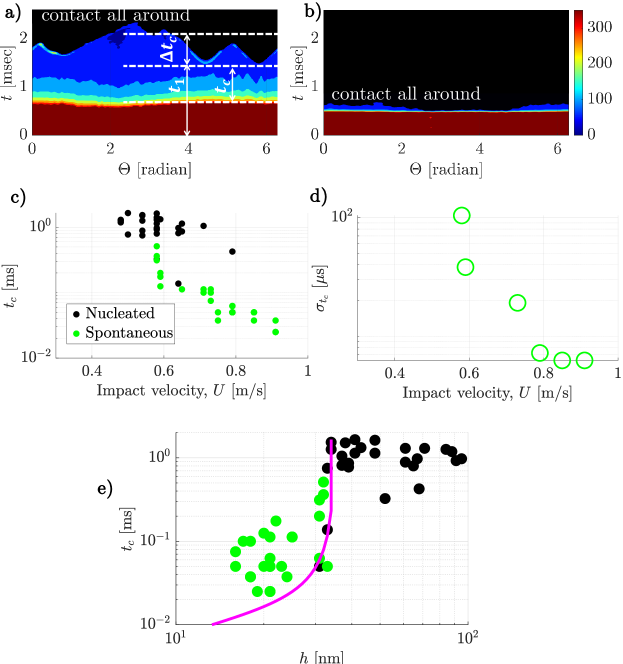
Analysis of the nucleated and spontaneously-formed contacts can provide insight into the mechanisms responsible for air film instability and the transition to contact. Following analysis of prior measurements [23] made without careful calibration as described in Appendix A, we evaluated the statistics of as well as the time from when the air film first forms to contact initiation, . The dynamics of air film rupture are depicted graphically for two impact velocities, = 0.58 and 0.91 m/sec, in Fig. 5(a) & (b). For slightly greater than the critical velocity for droplet rebound, the air film is perforated discretely, with capillary bridges formed from the liquid closest to the surface; however, there can be a significant delay between the first air film rupture event and the final air film rupture event, . For much higher velocity impacts, contacts appear to form much more quickly, so that the air film appears to rupture symmetrically from the liquid closest to the surface, within the time resolution of our imaging. As increases, we find that there is an initially steep drop-off in , and that continues to fall with until it reaches the limit set by our image acquisition rate, as shown in Fig. 5(c). The standard deviation of contact formation times, , similarly falls off rapidly as increases, as shown in Fig. 5(d).
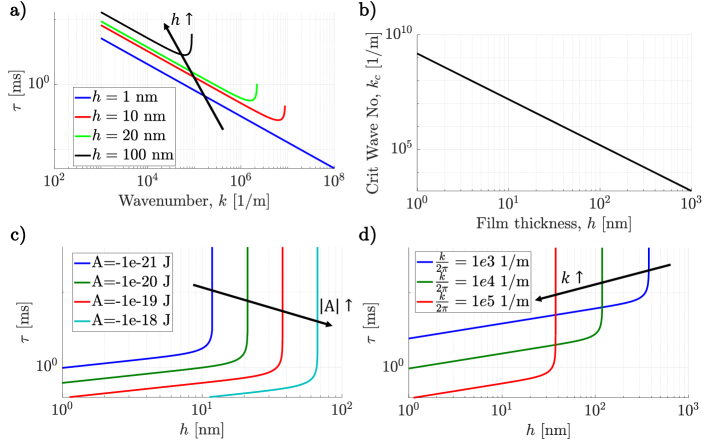
The linear stability of a viscous film between a liquid and a solid surface subject to destabilizing interfacial forces [34] and surface tension has been evaluated in prior work [19], and film stability has been probed experimentally for polymer films on silicon wafers[20]. In this analysis, a timescale for linear instability is given in terms of the interfacial force parameter given by the Hamaker constant and the wave-number of the instability as
| (1) |
Here, is the wave-number of the instability, where is the wavelength; is the air viscosity; is the liquid surface tension; and is the steady-state film thickness. In order to compare our measurements with the theory, we must postulate values for the Hamaker constant and the wave-number. In the absence of a directly measured Hamaker constant for silicon oil and mica across air, we take the measured value of the Hamaker constant for mica interacting with mica across air, calculated with Lifshitz theory to be J, and measured to be J [34]. The value of and that provide best agreement with the observed boundary between spontaneous and nucleated contacts is estimated to be J and m-1, where is within a factor of about 2 of the measured value of for mica-air-mica interfaces. Using these values, we compare as a function of , substituting for in the prediction of linear instability, as shown in Fig. 5(e).
IV Discussion
We present calibrated measurements of the nanometer-scale air film that forms prior to liquid solid contact during droplet impact. With our measurements, we identify two distinct forms of contact initiation - nucleated, and spontaneous - that are distinguished by the relative location of the localized wetting bridge and the location where the air film is most thin. For nucleated contacts, there is no correlation between these locations, whereas for spontaneous rupture events, there is nearly exact coincidence between the location of contact formation and the thinnest region of the air film. Experiments were conducted with silicon oil and water-glycerol mixtures, and the surface of impact is carefully cleaved atomically smooth mica. Water-glycerol solution droplets tend to nucleate contact from greater heights than silicon oil droplets; however, both form contact spontaneously from a narrow distribution of film thicknesses, ranging from a minimum of 18 to a maximum of approximately 30 nanometers, with a measurement error of less than 8 nm. The statistics of contact are consistent with a spinodal dewetting mechanism whereby the air film is destabilized by interfacial attraction of the liquid to the solid surface, as demonstrated by the timescale and height observed for spontaneous and nucleated contact formation.
A natural question arises in considering the stability of the air film - what possible mechanisms could cause the air film to rupture, and liquid-solid contact to form at a discrete point? Mechanical disruption of the air layer is the most common cause of contact initiation on glass surfaces, but for atomically smooth mica, this is no longer the case. When mechanical nucleation sites are not present, other mechanisms become dominant. A few candidate mechanisms include gas kinetics / finite Knudsen number effects, electrostatic charge, and dipole-dipole interactions typically called van der Waals forces. These have been analyzed or explored in prior works, both theoretically[12] and experimentally[21]; however, controlled experiments with calibrated measurement of the air film thickness have been lacking. With relatively small error bars, and repeated experiments, we identify the tightly-bound range of heights immediately prior to local destabilization of the air film, and furthermore identify parameter values that are consistent with van der Waals attraction as the dominant destabilizing mechanism. Gas kinetic parameters may be responsible for accelerating these dynamics [12], as we notably identified a larger estimated value of the Hamaker constant than has been measured for similar material systems[34] to obtain agreement with the observed boundary between spontaneous and nucleated contact formation. Interestingly, the wave length that generates the best agreement with our experimental data is 5 microns, as shown in Fig. 5(d); given the importance of viscosity in coalescence[35, 36, 37], it is possible that this wave length is somehow set by the viscosity of the liquid; however, to address this question requires further investigation, and is beyond the scope of the current work.
The transition from droplet rebound to spontaneous contact is immediate for silicon oil - at the critical rebound velocity, the oil drop may bounce or create a ring of contact, as shown in Fig. 4(c) . The water-glycerol droplets behave differently. There is a range of m/s, wherein no rebound or spontaneous contacts were observed - all the contacts were nucleated. Despite several tries with freshly made solutions, use of different mica sheets, and change of nozzle, we did not observe any spontaneous contact formation for this range of impact velocities of solution impact, as can be seen in Fig. 7(b). What could possibly cause the discrepancy between the silicon oil and the water-glycerol solution, given that the mica sheets are identically prepared, and great care was taken to ensure liquids were devoid of dust and dirt? One possibility is that the water-air interface became charged moreso than the silicon oil-air interface. Indeed, if one supposes that randomly fluctuating electromagnetic fields exist in the laboratory, generated by e.g. cameras, the laser, etc. that could not be isolated electrically from the impact surface, then the large dielectric constant of the water [38] may cause the water-air interface to charge more than the silicon oil-air interface. Indeed, pure silicone oil droplets (without water absorption) do not contain a sufficient concentration of any ions and counter-ions for the appearance of any Coulomb force or Maxwell pressure even in strong electrical fields [39]. As the mica was prepared in the same way for each experiment, we assume a similar static charge distribution on the mica surface [40]. Thus, it is possible that the water-air interface contained some static charges that trigger nucleated contact for an intermediate range of impact velocity, where the timescale for spontaneous rupture of the air film was too long to be observed before nucleation took over. This is supported by the large height values of nucleated contacts for the water-glycerol solution droplets, as described in detail in Appendix B.
Our results suggest a universal mechanism for spontaneous contact formation through intervening air - namely, spinodal dewetting of the air film once its thickness reduces to within approximately 20 nm. Electrostatics may disrupt this process. Such robustness of the thickness scale for silicon oil suggests that numerical calculations might simply assume contact at this distance, reducing the requisite resolution for accurate numerical modeling of contact phenomena. How this observation is affected by air pressure or applied fields remains to be determined.
Appendix A Microscopy Setup and Calibration
The air film thickness measurements are validated by calibration carried out with the simultaneous TIR and FIF microscopy methods. The optical configurations for both methods are depicted in Fig. 6(a). Solid substrates are optically coupled with immersion oil (Nikon) to top of a dove prism (Thor labs, BK-7 glass).
In the TIR method [41, 3, 8, 10], the impact surface is illuminated from below with a mW laser with wavelength nm (Arima lasers). The laser is mounted in a temperature controlled mount (model TCLDM9, Thorlabs). The collimated laser light is aligned to be incident at an angle greater than the critical angle for total internal reflection at a substrate-air interface, but smaller than the critical angle at the substrate-liquid interface. The reflected light is imaged by a long working distance objective (Mitutoyo) and tube lens (Thorlabs) onto the sensor of a high speed camera (Photron Fastcam Nova S12). After normalization by the background light intensity, the image intensity is directly related to the air layer thickness by a deterministic transfer function [26] provided the light at the substrate-air interface is linearly polarized. Because we often use mica as the substrate, and mica is weakly birefringent, we must pre- and post-compensate the polarization of the light. This is achieved using two polarizing beam splitters (Thorlabs), and two liquid-crystal variable retarders (LCVRs, Meadowlark), which can programmatically control the polarization state of the light.
Notably, the optical properties of mica sheets may differ from one experiment to the next; thus, we incorporate a photodiode (model S5792, Hamamatsu) aligned at the output of the second polarizing beam splitter. The intensity measurements made with this photodiode are used to determine the unknown parameters in our optical setup. We introduce , , , and , and as refractive indices of air (gas), solid (substrate), the light angle of incident ( deg), the retardance angles of the 2 LCVRs, and the light electric field, respectively. In TIR with linearly polarized light, for a given weakly birefringent substrate with an arbitrary optical axis (), extended Jones matrix algebra [42] gives the electric field vector () as the known functions:
| (2) |
| (3) |
where the superscripts ‘in’, ‘out’ and ‘SG’ specify the input, the output as measured at the photodiode, and the substrate-air interface, respectively; additionally, the subscripts and denote the s-polarized and p-polarized components of the light electric field, respectively. The two polarizing beam splitters in our setup ensure that the s-polarized portion of the electric field,
| (4) |
The photo diode measures theoretical , quantified by . The values of and are not known a-priori, and measuring them using a refractometer and polarimeter for each substrate is not feasible for repeated studies with freshly cleaved surfaces required of our study of droplet impacts.
To overcome the uncertainty of the orientation of the weakly birefringent mica surface in a given iteration of our experiment, we establish the following procedure to determine the LCVR settings that ensure , using the following in-situ measurement protocol:
Step 1: We introduce the space that is fully-determined by a system of four equations; however, to increase the accuracy and robustness of this procedure given the uncertainty of the measured data, we solve for in an optimization problem: instead of solving four equations, we minimize by sweeping a range of voltages on the LCVRs on 25 discrete points, where the retardations of LCVRs 1 and 2 are set independently among and .
Step 2: In this range of retardation values realized in the LCVRs, the function has the highest sensitivity to the values of and . The root of is solved for the desired value of using a non-linear least-squares optimization routine. To check whether the protocol ran successfully, we verify deg, as is set physically in the optical path. At the end of this step, and are known.
Step 3: We numerically solve Eq. (2) for that removes all the unwanted spill () at the substrate-air interface. From Eq. (3), the value of that maximizes is determined; this ensures we maximize the dynamic range captured on the camera’s imaging sensor.
Step 4: The values of and are recorded for each substrate, and the corresponding voltage amplitudes are applied to LCVRs.
Calibration of the microscopy techniques employed in this work is essential. To calibrate the measurements directly, we used the same optical elements of Fig. 1(a) to track a prescribed trajectory of a rigid glass lens surface in the field of view. To prescribe the trajectory with sufficient accuracy, a piezo stage with nm precision and position feedback via strain gauges (NPC3SG, Newport) was used, as shown in Fig. 6(a). A fixed reference geometry in the form of a spherical glass lens (Thorlabs, m) was affixed to the stage surface, and swept step-wise in the negative direction starting from nm with a step size of nm until the lowest points of the lens touched the substrate. At each step of piezo stage, the synchronized cameras record 250 FIF and 250 TIR images at FPS. Vibrational noise was reduced by rigid mounts and sorbothane sheets inserted between the stage and the optical surface. Despite these measures to control unwanted vibration, mechanical noise with amplitude of nm remained; to filter this noise, we took the median of the recorded images at each step of the piezo. The position of the stage at which contact occurs is evident from the lens profile recorded by the cameras (Fig. 6(b) & (c)). Upon contact initiation, mechanical vibrations are no longer measurable. For calibration redundancy, hundreds of control points on the glass lens surface were probed in each image.
The TIR images were re-sized in the direction, and the intensity was mapped to the gap as described elsewhere [26, 30]. The calibration procedure was repeated for different mica sheets and glass substrates; the maximum absolute error in profilometry was found to be less than nm for gaps from nm, as shown in Fig. 6(d).
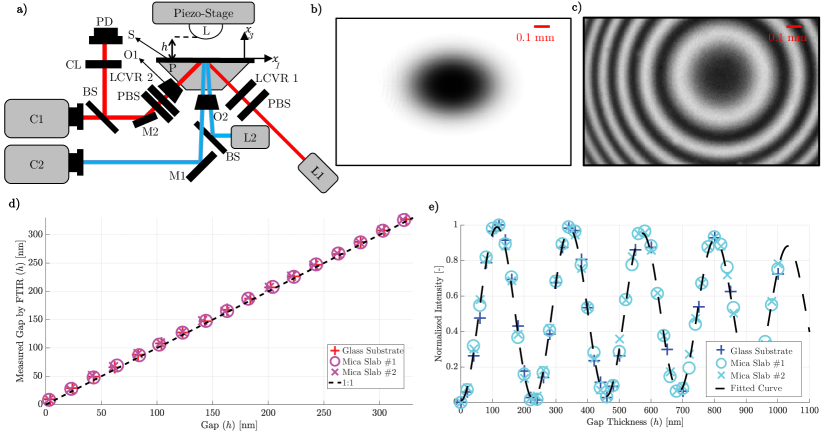
The FIF imaging [33] is conducted along a second optical path with a single color LED as shown in Fig. 6(a). The FIF optical path is oriented perpendicular to the substrate surface. Unpolarized light from from a high power blue LED (ILS Solutions) with a peak wavelength of nm is collimated and directed onto the optical path using a 50-50 beam splitter. The light is then and focused on the substrate surface by a long-working distance microscope objective (Mitutoyo 5X). The interference between the two reflected beams from the varying gap results in a pattern of fringes. The fringes are imaged onto the sensor of a second high-speed camera (Photron S12).
The FIF method can extend the depth-of-field of the gap profilometry to gaps approaching several microns [33]. The mapping function from intensity measurements carried out by the monochromatic FIF modality generates uncertainties in the interpretation of the interferogram due to a finite angle of incidence of the light, and the finite light source spectrum [33, 43, 44]. To address these sources of uncertainty, we recorded images of a known geometry attached to a nanometer-precise piezo driven stage, shown in Fig. 6(e) . The FIF images are normalized with respect to the dark and bright fields [33]. We found the mapping function to be universal, and fits any point trajectory on the calibration lens even by changing the substrate with an accuracy of + nm.
Appendix B Nucleation of Contact
Nucleated contacts are distinct from spontaneous contacts due to the random and isolated locations at which they form. This is all the more apparent in the uniformity of the distribution of nucleated contact heights as a function of impact velocity - rather than systematically decreasing, as the globally minimal film thickness does for impact velocities below the bouncing transition impact velocity, nucleated contacts can be observed at heights significantly larger than for a given impact event, even in cases where spontaneous contacts would otherwise form.
To characterize the nature of nucleated contacts, we plot for the silicon oil and the water-glycerol solution in Fig. 7(a) & (b), respectively. Whereas the distribution of nucleated contacts for the silicon oil is heavily weighted toward greater proximity to the surface, the same is not true of the contacts formed by impacting droplets of the water-glycerol solution, which are observed at a far greater mean height, with much greater spread, as can be seen in Fig. 7(a) & (b), inset. The difference is unlikely to be exclusively dominated by the different nature of mica surfaces, which for all experiments are prepared identically; rather, some other mechanism of contact formation may be at play for contacts between the water-glycerol solution and the mica. Electrostatic charges might be responsible for the observed difference, because of the different dielectric properties of the silicon oil and water-glycerol solution, but tests of droplet charging in the ambient environment were inconclusive.
Appendix C Stability of the Air Film
The liquid-air interface beneath the droplet, by nature of the interfacial attraction between the liquid and the solid, is inherently unstable. Indeed, there is a strong attraction between the liquid and the solid, driven by interfacial forces, which are in ‘competition’ with surface tension - that acts to keep the interface flat.
From Eq. (1), the stability of the air film can then be assessed for different values of and . The time constant for linear instability is seen to decrease strongly as a function of wave-number for several different values of , as shown in Fig. 8(a). For fixed and , the critical wave-number is a strong function of the film thickness, and scales as , as can be seen in Fig. 8(b).
The stability boundary presented in Fig. 5(e) was generated using estimated values of and . To establish the effect of and on the stability boundary in - space, we calculated first-passage time predictions for different values of and ; notably, increasing magnitude pushes the stability boundary toward the lower right of the graph, while increasing pushes the stability boundary toward the lower left of the graph, as can be seen in Fig. 8(c) & (d), respectively.
References
- Josserand and Thoroddsen [2016] C. Josserand and S. Thoroddsen, Drop impact on a solid surface, Annual Review of Fluid Mechanics 48, 365 (2016), https://doi.org/10.1146/annurev-fluid-122414-034401 .
- Mandre et al. [2009] S. Mandre, M. Mani, and M. P. Brenner, Precursors to splashing of liquid droplets on a solid surface, Physical Review Letters 102, 134502 (2009).
- Kolinski et al. [2012] J. M. Kolinski, S. M. Rubinstein, S. Mandre, M. P. Brenner, D. A. Weitz, and L. Mahadevan, Skating on a film of air: drops impacting on a surface, Physical Review Letters 108, 074503 (2012).
- van der Veen et al. [2012] R. C. A. van der Veen, T. Tran, D. Lohse, and C. Sun, Direct measurements of air layer profiles under impacting droplets using high-speed color interferometry, Physical Review E 85, 026315 (2012).
- Bouwhuis et al. [2012] W. Bouwhuis, R. C. A. van der Veen, T. Tran, D. L. Keij, K. G. Winkels, I. R. Peters, D. van der Meer, C. Sun, J. H. Snoeijer, and D. Lohse, Maximal air bubble entrainment at liquid-drop impact, Physical Review Letters 109, 264501 (2012).
- de Ruiter et al. [2012] J. de Ruiter, J. M. Oh, D. van den Ende, and F. Mugele, Dynamics of collapse of air films in drop impact, Physical Review Letters 108, 074505 (2012).
- Mandre and Brenner [2012] S. Mandre and M. P. Brenner, The mechanism of a splash on a dry solid surface, Journal of Fluid Mechanics 690, 148–172 (2012).
- Kolinski et al. [2014a] J. M. Kolinski, L. Mahadevan, and S. M. Rubinstein, Lift-off instability during the impact of a drop on a solid surface, Physical Review Letters 112, 134501 (2014a).
- Mishra et al. [2022] S. Mishra, S. M. Rubinstein, and C. H. Rycroft, Computing the viscous effect in early-time drop impact dynamics, Journal of Fluid Mechanics 945, A13 (2022).
- Kolinski et al. [2014b] J. M. Kolinski, L. Mahadevan, and S. Rubinstein, Drops can bounce from perfectly hydrophilic surfaces, Europhysics Letters 108, 24001 (2014b).
- de Ruiter et al. [2014] J. de Ruiter, R. Lagraauw, D. van den Ende, and F. Mugele, Wettability-independent bouncing on flat surfaces mediated by thin air films, Nature Physics 11, 48 (2014).
- Chubynsky et al. [2020] M. V. Chubynsky, K. I. Belousov, D. A. Lockerby, and J. E. Sprittles, Bouncing off the walls: The influence of gas-kinetic and van der waals effects in drop impact, Physical Review Letters 124, 084501 (2020).
- Thoroddsen et al. [2010] S. T. Thoroddsen, K. Takehara, and T. G. Etoh, Bubble entrapment through topological change, Physics of Fluids 22, 051701 (2010), https://doi.org/10.1063/1.3407654 .
- Lo et al. [2017a] H. Y. Lo, Y. Liu, and L. Xu, Mechanism of contact between a droplet and an atomically smooth substrate, Physical Review X 7, 021036 (2017a).
- Kolinski et al. [2019] J. M. Kolinski, R. Kaviani, D. Hade, and S. M. Rubinstein, Surfing the capillary wave: Wetting dynamics beneath an impacting drop, Physical Review Fluids 4, 123605 (2019).
- de Ruiter et al. [2015a] J. de Ruiter, D. van den Ende, and F. Mugele, Air cushioning in droplet impact. II. experimental characterization of the air film evolution, Physics of Fluids 27, 012105 (2015a), https://doi.org/10.1063/1.4906115 .
- Lo et al. [2017b] H. Y. Lo, Y. Liu, and L. Xu, Mechanism of contact between a droplet and an atomically smooth substrate, Physical Review X 7, 021036 (2017b).
- Gao et al. [2019a] Y. Gao, S. Jung, and L. Pan, Interaction forces between water droplets and solid surfaces across air films, ACS Omega 4, 16674 (2019a).
- Wyart and Daillant [1990] F. B. Wyart and J. Daillant, Drying of solids wetted by thin liquid films, Canadian Journal of Physics 68, 1084 (1990).
- Reiter et al. [1999] G. Reiter, A. Sharma, A. Casoli, M.-O. David, R. Khanna, and P. Auroy, Thin film instability induced by long-range forces, Langmuir 15, 2551 (1999).
- Gao et al. [2019b] F. Gao, H. Yi, L. Qi, R. Qiao, and W. Deng, Weakly charged droplets fundamentally change impact dynamics on flat surfaces, Soft Matter 15, 5548 (2019b).
- Latka et al. [2012] A. Latka, A. Strandburg-Peshkin, M. M. Driscoll, C. S. Stevens, and S. R. Nagel, Creation of prompt and thin-sheet splashing by varying surface roughness or increasing air pressure, Physical review letters 109, 054501 (2012).
- Kolinski [2015] J. M. Kolinski, The role of air in droplet impact on a smooth, solid surface, Ph.D. thesis (2015).
- Weinstein and Ruschak [2004] S. J. Weinstein and K. J. Ruschak, Coating flows, Annu. Rev. Fluid Mech. 36, 29 (2004).
- Xu et al. [2005] L. Xu, W. W. Zhang, and S. R. Nagel, Drop splashing on a dry smooth surface, Physical Review Letters 94, 184505 (2005).
- Shirota et al. [2017] M. Shirota, M. A. J. van Limbeek, D. Lohse, and C. Sun, Measuring thin films using quantitative frustrated total internal reflection (FTIR), The European Physical Journal E 40, 54 (2017).
- Driscoll and Nagel [2011] M. M. Driscoll and S. R. Nagel, Ultrafast interference imaging of air in splashing dynamics, Physical review letters 107, 154502 (2011).
- Pack et al. [2017] M. Pack, H. Hu, D. Kim, Z. Zheng, H. A. Stone, and Y. Sun, Failure mechanisms of air entrainment in drop impact on lubricated surfaces, Soft Matter 13, 2402 (2017).
- Pack et al. [2018] M. Pack, P. Kaneelil, H. Kim, and Y. Sun, Contact line instability caused by air rim formation under nonsplashing droplets, Langmuir 34, 4962 (2018), https://doi.org/10.1021/acs.langmuir.8b01082 .
- Chantelot and Lohse [2021] P. Chantelot and D. Lohse, Drop impact on superheated surfaces: short-time dynamics and transition to contact, Journal of Fluid Mechanics 928, 10.1017/jfm.2021.843 (2021).
- Kaviani and Kolinski [2023] R. Kaviani and J. M. Kolinski, High resolution interferometric imaging of liquid-solid interfaces with hotnnet, Experimental Mechanics 63, 309 (2023).
- Zhang et al. [2021] L. Zhang, T. Soori, A. Rokoni, A. Kaminski, and Y. Sun, Thin film instability driven dimple mode of air film failure during drop impact on smooth surfaces, Physical Review Fluids 6, 044002 (2021).
- Rädler and Sackmann [1992] J. O. Rädler and E. Sackmann, Imaging optical thicknesses and separation distances of phospholipid vesicles at solid surfaces, Journal de Physique II 3, 727 (1992).
- Israelachvili [2011] J. Israelachvili, Intermolecular and Surface Forces, 3rd Edition (Academic Press, 2011).
- Burton and Taborek [2007] J. Burton and P. Taborek, Role of dimensionality and axisymmetry in fluid pinch-off and coalescence, Physical review letters 98, 224502 (2007).
- Eggers et al. [1999] J. Eggers, J. R. Lister, and H. A. Stone, Coalescence of liquid drops, Journal of Fluid Mechanics 401, 293 (1999).
- Paulsen et al. [2011] J. D. Paulsen, J. C. Burton, and S. R. Nagel, Viscous to inertial crossover in liquid drop coalescence, Physical Review Letters 106, 114501 (2011).
- Behrends et al. [2006] R. Behrends, K. Fuchs, U. Kaatze, Y. Hayashi, and Y. Feldman, Dielectric properties of glycerol/water mixtures at temperatures between 10 and 50°c, The Journal of Chemical Physics 124, 144512 (2006).
- Granda et al. [2022] R. Granda, G. Li, V. Yurkiv, F. Mashayek, and A. L. Yarin, Dielectrophoretic stretching of drops of silicone oil: Experiments and multi-physical modeling, Physics of Fluids 34, 042108 (2022), https://doi.org/10.1063/5.0087219 .
- Christenson and Thomson [2016] H. K. Christenson and N. H. Thomson, The nature of the air-cleaved mica surface, Surface Science Reports 71, 367 (2016).
- Rubinstein et al. [2004] S. M. Rubinstein, G. Cohen, and J. Fineberg, Detachment fronts and the onset of dynamic friction, Nature 430, 1005 (2004).
- Gu and Yeh [1993] C. Gu and P. Yeh, Extended Jones matrix method II, Journal of the Optical Society of America A 10, 966 (1993).
- Schilling et al. [2004] J. Schilling, K. Sengupta, S. Goennenwein, A. Bausch, and E. Sackmann, Absolute interfacial distance measurements by dual-wavelength reflection interference contrast microscopy, Physical Review E 69, 021901 (2004).
- de Ruiter et al. [2015b] J. de Ruiter, F. Mugele, and D. van den Ende, Air cushioning in droplet impact. I. Dynamics of thin films studied by dual wavelength reflection interference microscopy, Physics of Fluids 27, 012104 (2015b), https://doi.org/10.1063/1.4906114 .