Enhancing Trace Visualizations for
Microservices Performance Analysis
Abstract.
Performance analysis of microservices can be a challenging task, as a typical request to these systems involves multiple Remote Procedure Calls (RPC) spanning across independent services and machines. Practitioners primarily rely on distributed tracing tools to closely monitor microservices performance. These tools enable practitioners to trace, collect, and visualize RPC workflows and associated events in the context of individual end-to-end requests. While effective for analyzing individual end-to-end requests, current distributed tracing visualizations often fall short in providing a comprehensive understanding of the system’s overall performance. To address this limitation, we propose a novel visualization approach that enables aggregate performance analysis of multiple end-to-end requests. Our approach builds on a previously developed technique for comparing structural differences of request pairs and extends it for aggregate performance analysis of sets of requests. This paper presents our proposal and discusses our preliminary ongoing progress in developing this innovative approach.
1. Introduction
Microservices have emerged as a paradigm shift in software development, enabling the efficient testing and deployment of new software features and improvements (Newman, 2015). Due to their modular nature, microservices are particularly well-suited for today’s software market, where the ability to rapidly release software updates and improvements is perceived as a key competitive advantage (Rubin and Rinard, 2016).
However, despite these advantages, adopting microservices also poses significant challenges. A main challenge, for example, is ensuring adequate software performance. Indeed, a proactive approach to performance assurance (e.g., pre-production performance testing (Jiang and Hassan, 2015; Laaber and Leitner, 2018; Traini et al., 2022)) is often impractical in these contexts, given the inherent complexity of these systems (Sridharan, 2017; Veeraraghavan et al., 2016), and the significant pressure to deliver fast-to-market (Rubin and Rinard, 2016; Traini, 2022). Performance behavior of microservices systems usually emerges in the field (Veeraraghavan et al., 2016) as a complex interaction of several RPCs that spans multiple independent services and machines. Furthermore, these systems are constantly undergoing software changes (e.g., multiple releases per day) and are exposed to highly varying workloads (Ardelean et al., 2018), which make them susceptible to unexpected performance regressions (Veeraraghavan et al., 2016; Traini et al., 2021).
To aid performance analysis, practitioners typically rely on distributed tracing (Parker et al., 2020) (e.g., Jaeger (Technologies, 2023), Dapper (Sigelman et al., 2010), Canopy(Kaldor et al., 2017)) as a means to monitor and inspect microservices performance in production. Distributed tracing tools capture the workflow of causally-related events (i.e., work done to process a request) within and among the components of a microservices system (Sambasivan et al., 2016), and provide visualizations to support performance analysis of individual end-to-end requests, e.g., swimlane visualizations (Davidson et al., 2023; Sigelman et al., 2010; Technologies, 2023).
Although these visualizations are particularly effective for analyzing individual requests, they are limited when it comes to provide a comprehensive picture of microservices performance. Understanding request performance in aggregate (Parker et al., 2020) often requires switching between various visualization tools, making the process cumbersome and time-consuming (Davidson et al., 2023). Current distributed tracing tools do not provide out-of-the-box support for aggregate performance analysis.
In this paper, we propose a novel visualization approach that facilitates comprehension of the relationship between request characteristics and end-to-end response time behavior. The proposed approach enables seamless performance analysis of multiple requests, eliminating the need to switch between multiple tools and visualizations. Our approach builds upon a previously developed visualization method for comparing request pairs (Farro, 2018) and extends it to accommodate various types of aggregate analysis on sets of requests. This new approach will empower engineers to swiftly identify significant and recurring request characteristics that are linked to specific end-to-end response time behavior, thereby enabling a more effective performance analysis of microservices. Here, we present our proposal and report on our preliminary ongoing progress in developing this novel visualization approach.
2. Motivation
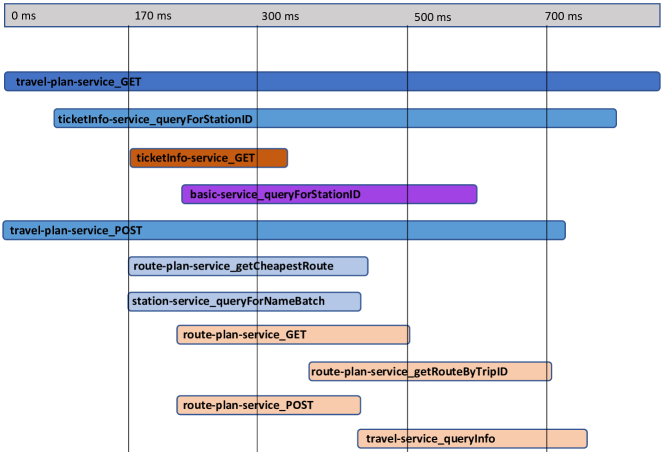
Distributed tracing tools provide swimlane visualizations (Kaldor et al., 2017; Sigelman et al., 2010; Technologies, 2023; Davidson and Mace, 2022) as a means to investigate end-to-end response time (refer to Fig. 1 for an illustration). These visualizations are particularly useful for performance analysis of individual requests. For example, they can be used to investigate how each RPC contributes to the end-to-end response time of a specific request, and pinpoint potential bottlenecks.
Despite their usefulness, swimlane visualizations have certain limitations when it comes to more complex performance analyses. For instance, analyzing the performance of individual end-to-end requests can be misleading without considering the appropriate context (Davidson et al., 2023). The response time of a request can only be considered anomalous when compared to other requests of the same type (Anand et al., 2020). Additionally, engineers are often more interested in investigating overall response time trends rather than the performance of individual requests (Parker et al., 2020). Different end-to-end response time behaviors can be associated with specific request characteristics, such as particular RPC execution paths and/or RPC performance behaviors, and engineers can be interested in identifying these characteristics to spot potential performance bugs and/or optimization opportunities (Parker et al., 2020; Krushevskaja and Sandler, 2013; Cortellessa and Traini, 2020).
Distributed tracing tools lack support for this type of analysis, which currently requires the use of multiple visualizations and tools in tandem (Davidson et al., 2023), e.g., Jaeger (Technologies, 2023) and Kibana (Elastic, 2023b). A common approach is to first recognize recurrent performance behaviors that warrant investigation, and then examine individual requests to characterize relevant performance behaviors. This is usually achieved by detecting “modes” of the end-to-end response time distribution (e.g., using Kibana), which indicate meaningful recurrent performance behaviors. Then, samples of requests associated with each mode can be extracted and individually examined (e.g., using Jaeger’s swimlanes) to identify unique characteristics that lead to specific performance behaviors, i.e., modes.
Unfortunately, this approach can be particularly tedious as it necessitates the manual examination and comparison of multiple requests across multiple visualizations and tools. Furthermore, even when successful, it falls short of providing a satisfactory level of confidence. Identifying specific characteristics of a particular mode requires verifying that these characteristics appear exclusively in requests belonging to that mode, which can be challenging using current tools.
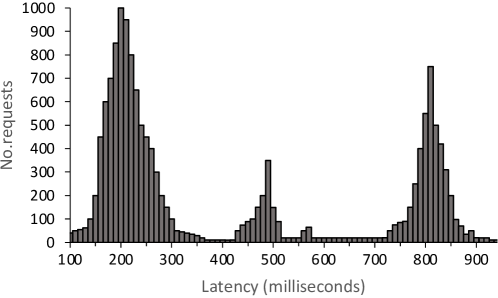
For instance, consider the scenario illustrated in Fig. 2, which depicts the distribution of the end-to-end response time for a specific type of request, such as loading the homepage of a website. As depicted in the figure, requests exhibit three distinct response time behaviors, i.e., modes. Suppose that the rightmost mode is characterized by a unique request characteristic, such as a specific RPC execution path. That is, a specific RPC is invoked in all requests belonging to the rightmost mode, but not in the others (e.g., due to a cache miss). Identifying patterns like this can be particularly challenging with current distributed tracing tools.
3. Proposal
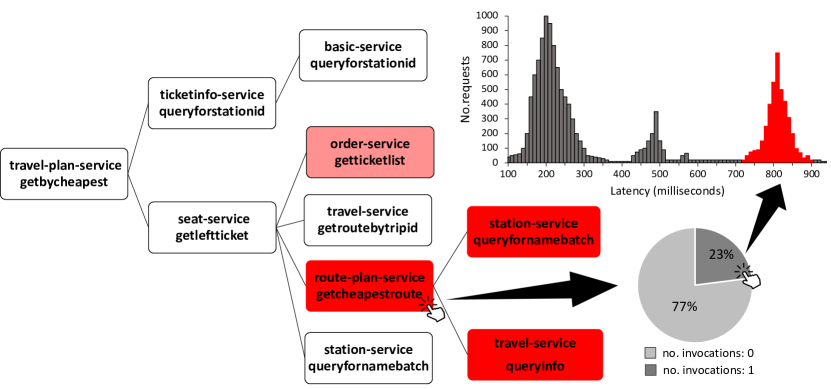
We present a novel interactive visualization approach for aggregate performance analysis of end-to-end requests. Our approach provides a dashboard comprising two main interactive components: a tree and a histogram (see Fig. 3). The interactive tree offers an overview of the requests’ workflows in terms of RPC execution paths, while the histogram illustrates the corresponding end-to-end response time distribution. The key insight behind this approach is to enable the simultaneous analysis of various aspects of requests and the relationship among these aspects through a unified dashboard.
The tree visualization proposed in our approach builds upon a previous visualization technique provided in Jaeger (Technologies, 2023), which enables the comparison of two requests in terms of RPC execution paths (Farro, 2018). We extend this technique by proposing a tree visualization that enables the analysis of an entire set of requests. Each node of the tree represents a RPC invocation within a specific execution path, where the leftmost node represents the root RPC, and edges indicate direct RPC invocation. For example, in Fig. 3, the red node labeled as getcheapestroute indicates the RPC execution path getbycheapest getleftticketgetcheapestroute. It is worth noting that when a particular RPC invokes the same RPC multiple times, this leads to a single node in the tree. In other words, if the RPC getbycheapest invokes the RPC getleftticket multiple times, there will be only one child node referring to getleftticket. The rationale behind this approach is to address the potential complexity of requests by providing a more concise visualization. An RPC execution path will appear in the tree only if it is present in at least one request within the set of requests being analyzed.
Similar to the trace comparison tool of Jaeger (Farro, 2018), we utilize color encoding to highlight variations within a set of requests. However, in contrast to this approach, our color encoding scheme denotes the degree of variance of a particular request characteristic within a group of requests, rather than the difference between two requests. Furthermore, we employ a continuous color scale, as opposed to the discrete one used by Jaeger (Farro, 2018). As an example, we can use color encoding to depict the variability in the number of invocations of a specific RPC execution path within a group of requests. A white node indicates that the corresponding RPC execution path appears the same number of times in all the requests under analysis. Conversely, a red node indicates a substantial change in the number of invocations of the corresponding RPC execution path from one request to another. We use standardized measures of dispersion, such as the Coefficient of Variation (CV) (Everitt, 1998), to encode these differences into colors. For instance, a CV of 0 results in a white node, while a CV 1 results in a red node. The shade of color gradually transitions from white to red as the CV value increases, with 0 CV 1.
This approach facilitates the rapid identification of RPC execution paths that exhibit divergent request characteristics. An engineer can delve deeper into a specific RPC execution path by interacting with its corresponding node, bringing up a new visualization such as the pie chart displayed in Fig. 3. This allows for a more in-depth examination of the divergent characteristics observed in that specific RPC execution path. The pie chart in Fig. 3 illustrates, for instance, two distinct behaviors, with 77% of requests not involving any invocations of the path getbycheapest getleftticketgetcheapestroute, and 23% of requests involving one invocation of such path. By interacting with the corresponding slice of the pie chart, the tool illustrates how this particular request characteristic affects end-to-end response time by highlighting the corresponding area of the histogram. For instance, Fig. 3 shows that the rightmost mode of the end-to-end response time distribution is characterized by the presence of the particular RPC execution path getbycheapest getleftticketgetcheapestroute.
Another advantage of this approach is its versatility in analyzing various request characteristics. This can be accomplished by changing the color encoding assigned to tree nodes. For instance, the method can be adapted to examine how different RPC execution times influence the distribution of end-to-end response time. Or, similarly, it can be utilized to investigate the impact of different HTTP header values on response time (in these situations, other statistical metrics such as the Gini index (Gini, 1936) or Entropy (Shannon, 1948) can be applied). Furthermore, we plan to make the analysis bidirectional, allowing the engineer to begin their investigation from either the tree or the histogram to understand response time behavior. If the engineer chooses to start from the response time distribution, they can select a specific range using a slider selector. This selection will result in an updated color scheme on the tree, where the colors will now indicate the divergence of the selected set of requests compared to all others (using statistical measures such as Kullback-Leibler divergence (Kullback and Leibler, 1951)). This approach will enable engineers to identify how certain modes of response time distribution correlate with specific request characteristics.
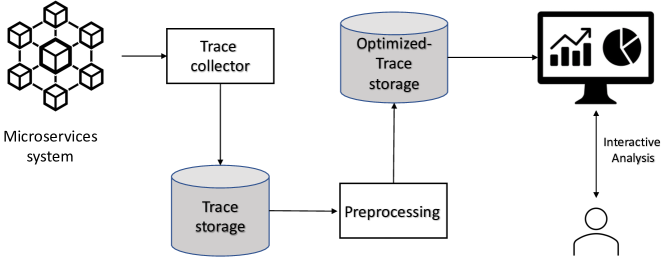
We envision two potential challenges for the development of our visualization approach. The first challenge concerns the efficiency of our tool. Modern distributed tracing tools collect huge volumes of traces per day (Kaldor et al., 2017), which can make the interaction with the proposed visualizations computationally intensive. In order to enable an efficient generation of visualizations, we plan to preprocess traces in an optimized format. Figure 4 depicts the workflow of our approach. The traces of the microservices system are continuously collected by the distributed tracing tool (i.e., Trace Collector) and persisted in a Trace Storage, such as ElasticSearch (Elastic, 2023a). The stored traces are then periodically preprocessed and persisted in dedicated storage in an optimized format. The visual dashboard application can then directly query the optimized trace storage to enable the efficient generation of visualizations.
The second challenge we envision is related to the user experience. When too much information is displayed on the screen, the user can become overwhelmed (Davidson et al., 2023). To mitigate this, we intend to keep our dashboard as minimalistic as possible to avoid placing an excessive burden on the user. For instance, certain request types may involve a large number of RPCs, which can result in an extremely large tree structure. To reduce the user’s cognitive load, we will allow the user to hide the RPCs invoked within a particular execution path by double-clicking on the corresponding node. This will enable the user to navigate the tree more easily.
4. Ongoing work
We are currently engaged in the development of a prototype for our visualization approach. For our pilot study, we are utilizing a dataset of traces that was generated in a previous work of the second author (Traini and Cortellessa, 2021). The dataset was created using the widely-used microservices benchmark system TrainTicket (Zhou et al., 2021; Li et al., 2021; Zhang et al., 2022; Guo et al., 2020; Zhou et al., 2019), and the load generator PPTAM (Avritzer et al., 2019). Our technology stack includes the use of Jaeger (Technologies, 2023) as the distributed tracing collector and Elasticsearch (Elastic, 2023a) for storing both common and optimized traces. The dashboard has been developed using D3.js (Bostock, 2023) for visualizations and Flask (Pallets, 2023) for the backend service.
At present, we have accomplished the implementation of the UI of our working prototype, along with its key visualization components, namely the interactive tree and histogram. However, we are still engaged in the ongoing development of the preprocessing engine and a portion of the server infrastructure. For this reason, we are unable to report an authentic screenshot of our working prototype, at this stage. Nonetheless, we do provide a mock-up of the expected outcome in Fig. 3.
Our next step entails the completion of the first version of our prototype. This first version will be centered exclusively on the analysis of the number of invocations of RPC execution paths and their relationship with end-to-end performance behavior. In subsequent stages, we plan to extend the capability of the prototype beyond this specific request characteristic by exploring other metrics such as RPC execution time. Additionally, we intend to enable bidirectional analyses by supporting investigations initiated from both the tree and the histogram (currently, our working prototype only supports a singular direction, i.e., starting from the tree).
It is noteworthy that our current design only supports the individual inspection of specific request characteristics and does not enable the simultaneous analysis of multiple request characteristics in tandem. This supplementary capability may become crucial for more elaborate performance analyses. Thus, as a long-term goal, we intend to broaden our approach by enabling the analysis of combined sets of multiple request characteristics and their interrelation with end-to-end performance.
Regarding the evaluation of our proposed approach, we plan to continue using TrainTicket as the reference case study, given its relevance in the software engineering community. To further enhance the assessment of our proposed approach, we will consider a variety of workload scenarios, including some that involve synthetically injected performance bugs (Traini and Cortellessa, 2021). Furthermore, we aim to experiment with real-world distributed traces from large microservices systems to facilitate the transition of our approach to practice. For instance, we plan to utilize the dataset of traces recently shared by Alibaba (Luo et al., 2021).
5. Related work
Previous research on visualization approaches for distributed systems has traditionally focused on the analysis of individual requests or comparison between two requests. ShiViz (Beschastnikh et al., 2020) visualizes a logged distributed execution as a time-space diagram. The study of Sambavisan et al. (Sambasivan et al., 2013) compares three well-known visualization approaches in the context of presenting the results of one automated performance root cause analysis approach (Sambasivan et al., 2011). TraVista (Anand et al., 2020) builds on the prevalent approach of visualizing a single request by augmenting this view with information to aid the user in contextualizing the performance of one request with respect to other requests. Jaeger (Technologies, 2023) enables the comparison of structural aspects of two requests (Farro, 2018). Commercial APM tools (Ahmed et al., 2016), such as Dynatrace (Inc., 2023b), AppDynamics (Inc., 2023a), or Instana (IBM, 2023), provide features that support aggregated analysis of end-to-end requests. For instance, Dynatrace’s Service Flow feature (Inc., 2023c) shows aggregate workflows of end-to-end requests along with their associated characteristics. As far as we know, current APM tools do not provide dedicated visualizations to analyze the relationship between requests’ characteristics and end-to-end performance behavior. Other studies have proposed automated methods to aid the detection of patterns in requests’ characteristics associated with anomalous end-to-end performance behavior (Traini and Cortellessa, 2021; Bansal et al., 2020; Cortellessa and Traini, 2020; Krushevskaja and Sandler, 2013).
Recent research by Davidson and Mace (Davidson and Mace, 2022) emphasizes the importance of visualization in the context of systems research and encourages further effort into this topic. Davidson et al. (Davidson et al., 2023) performed a qualitative interview study to identify shortcomings of existing distributed tracing tools, and expose various open research problems that involve several domains (including visualization research).
6. Conclusion
In this paper, we presented a novel visualization approach for microservices performance analysis. Our approach addresses the limitations of current distributed tracing visualizations by enabling aggregate performance analysis of multiple end-to-end requests. Further studies are required to evaluate the effectiveness of our proposal and gather feedback from practitioners.
Acknowledgements.
This work is supported by“Territori Aperti” (a project funded by Fondo Territori Lavoro e Conoscenza CGIL, CSIL and UIL), and by European Union - NextGenerationEU - National Recovery and Resilience Plan (Piano Nazionale di Ripresa e Resilienza, PNRR) - Project: “SoBigData.it - Strengthening the Italian RI for Social Mining and Big Data Analytics” - Prot. IR0000013 - Avviso n. 3264 del 28/12/2021. We would like to thank Antinisca Di Marco and Giovanni Stilo for the useful suggestions and comments that were helpful in improving the paper.References
- (1)
- Ahmed et al. (2016) Tarek M. Ahmed, Cor-Paul Bezemer, Tse-Hsun Chen, Ahmed E. Hassan, and Weiyi Shang. 2016. Studying the Effectiveness of Application Performance Management (APM) Tools for Detecting Performance Regressions for Web Applications: An Experience Report. In Proceedings of the 13th International Conference on Mining Software Repositories (Austin, Texas) (MSR ’16). Association for Computing Machinery, New York, NY, USA, 1–12. https://doi.org/10.1145/2901739.2901774
- Anand et al. (2020) Vaastav Anand, Matheus Stolet, Thomas Davidson, Ivan Beschastnikh, Tamara Munzner, and Jonathan Mace. 2020. Aggregate-Driven Trace Visualizations for Performance Debugging. arXiv: 2010.13681 [cs] Number: arXiv:2010.13681.
- Ardelean et al. (2018) Dan Ardelean, Amer Diwan, and Chandra Erdman. 2018. Performance Analysis of Cloud Applications. In Proceedings of the 15th USENIX Conference on Networked Systems Design and Implementation (NSDI’18). USENIX Association, USA, 405–417. event-place: Renton, WA, USA.
- Avritzer et al. (2019) Alberto Avritzer, Daniel Menasché, Vilc Rufino, Barbara Russo, Andrea Janes, Vincenzo Ferme, André van Hoorn, and Henning Schulz. 2019. PPTAM: Production and Performance Testing Based Application Monitoring. In Companion of the 2019 ACM/SPEC International Conference on Performance Engineering (Mumbai, India) (ICPE ’19). Association for Computing Machinery, New York, NY, USA, 39–40. https://doi.org/10.1145/3302541.3311961
- Bansal et al. (2020) Chetan Bansal, Sundararajan Renganathan, Ashima Asudani, Olivier Midy, and Mathru Janakiraman. 2020. DeCaf: Diagnosing and Triaging Performance Issues in Large-Scale Cloud Services. In Proceedings of the ACM/IEEE 42nd International Conference on Software Engineering: Software Engineering in Practice (Seoul, South Korea) (ICSE-SEIP ’20). Association for Computing Machinery, New York, NY, USA, 201–210. https://doi.org/10.1145/3377813.3381353
- Beschastnikh et al. (2020) Ivan Beschastnikh, Perry Liu, Albert Xing, Patty Wang, Yuriy Brun, and Michael D. Ernst. 2020. Visualizing Distributed System Executions. ACM Trans. Softw. Eng. Methodol. 29, 2 (March 2020). https://doi.org/10.1145/3375633 Place: New York, NY, USA Publisher: Association for Computing Machinery.
- Bostock (2023) Mike Bostock. 2023. D3: Data-Driven Documents. https://d3js.org ”Accessed 2023-01-21 19:45”.
- Cortellessa and Traini (2020) Vittorio Cortellessa and Luca Traini. 2020. Detecting Latency Degradation Patterns in Service-Based Systems. In Proceedings of the ACM/SPEC International Conference on Performance Engineering (ICPE ’20). Association for Computing Machinery, New York, NY, USA, 161–172. https://doi.org/10.1145/3358960.3379126
- Davidson and Mace (2022) Thomas Davidson and Jonathan Mace. 2022. See it to believe it? The role of visualisation in systems research. In Proceedings of the 13th Symposium on Cloud Computing (SoCC ’22). Association for Computing Machinery, New York, NY, USA, 419–428. https://doi.org/10.1145/3542929.3563488
- Davidson et al. (2023) Thomas Davidson, Emily Wall, and Jonathan Mace. 2023. A Qualitative Interview Study of Distributed Tracing Visualisation: A Characterisation of Challenges and Opportunities. IEEE Transactions on Visualization and Computer Graphics (2023), 1–12. https://doi.org/10.1109/TVCG.2023.3241596
- Elastic (2023a) Elastic. 2023a. Elasticsearch: The Official Distributed Search & Analytics Engine. https://www.elastic.co/elasticsearch/ ”Accessed 2023-01-15 18:38”.
- Elastic (2023b) Elastic. 2023b. Kibana: Explore, Visualize, Discover Data. https://www.elastic.co/kibana ”Accessed 2023-01-15 17:38”.
- Everitt (1998) Brian Everitt. 1998. The Cambridge Dictionary of Statistics. Cambridge University Press, Cambridge, UK.
- Farro (2018) Joe Farro. 2018. Trace comparisons arrive in Jaeger 1.7. https://medium.com/jaegertracing/trace-comparisons-arrive-in-jaeger-1-7-a97ad5e2d05d ”Accessed 2023-01-15 18:16”.
- Gini (1936) Corrado Gini. 1936. On the measure of concentration with special reference to income and statistics. Colorado College Publication, General Series.
- Guo et al. (2020) Xiaofeng Guo, Xin Peng, Hanzhang Wang, Wanxue Li, Huai Jiang, Dan Ding, Tao Xie, and Liangfei Su. 2020. Graph-Based Trace Analysis for Microservice Architecture Understanding and Problem Diagnosis. In Proceedings of the 28th ACM Joint Meeting on European Software Engineering Conference and Symposium on the Foundations of Software Engineering (Virtual Event, USA) (ESEC/FSE 2020). Association for Computing Machinery, New York, NY, USA, 1387–1397. https://doi.org/10.1145/3368089.3417066
- IBM (2023) IBM. 2023. Instana: Automated Observability. https://www.instana.com ”Accessed 2023-01-16 14:55”.
- Inc. (2023a) Cisco Systems Inc. 2023a. AppDynamics: Observability Platform. https://www.appdynamics.com ”Accessed 2023-01-16 14:53”.
- Inc. (2023b) Dynatrace Inc. 2023b. Dynatrace: Modern cloud done right. https://www.dynatrace.com ”Accessed 2023-01-16 14:50”.
- Inc. (2023c) Dynatrace Inc. 2023c. Dynatrace. Service Flow. https://www.dynatrace.com/platform/service-flow/ ”Accessed 2023-02-14 14:10:59”.
- Jiang and Hassan (2015) Zhen Ming Jiang and Ahmed E. Hassan. 2015. A Survey on Load Testing of Large-Scale Software Systems. IEEE Transactions on Software Engineering 41, 11 (2015), 1091–1118. https://doi.org/10.1109/TSE.2015.2445340
- Kaldor et al. (2017) Jonathan Kaldor, Jonathan Mace, Micha\l Bejda, Edison Gao, Wiktor Kuropatwa, Joe O’Neill, Kian Win Ong, Bill Schaller, Pingjia Shan, Brendan Viscomi, Vinod Venkataraman, Kaushik Veeraraghavan, and Yee Jiun Song. 2017. Canopy: An End-to-End Performance Tracing And Analysis System. In Proceedings of the 26th Symposium on Operating Systems Principles (SOSP ’17). Association for Computing Machinery, New York, NY, USA, 34–50. https://doi.org/10.1145/3132747.3132749
- Krushevskaja and Sandler (2013) Darja Krushevskaja and Mark Sandler. 2013. Understanding Latency Variations of Black Box Services. In Proceedings of the 22nd International Conference on World Wide Web (Rio de Janeiro, Brazil) (WWW ’13). Association for Computing Machinery, New York, NY, USA, 703–714. https://doi.org/10.1145/2488388.2488450
- Kullback and Leibler (1951) S. Kullback and R. A. Leibler. 1951. On Information and Sufficiency. The Annals of Mathematical Statistics 22, 1 (1951), 79 – 86. https://doi.org/10.1214/aoms/1177729694
- Laaber and Leitner (2018) Christoph Laaber and Philipp Leitner. 2018. An Evaluation of Open-Source Software Microbenchmark Suites for Continuous Performance Assessment. In Proceedings of the 15th International Conference on Mining Software Repositories (Gothenburg, Sweden) (MSR ’18). Association for Computing Machinery, New York, NY, USA, 119–130. https://doi.org/10.1145/3196398.3196407
- Li et al. (2021) Bowen Li, Xin Peng, Qilin Xiang, Hanzhang Wang, Tao Xie, Jun Sun, and Xuanzhe Liu. 2021. Enjoy your observability: an industrial survey of microservice tracing and analysis. Empirical Software Engineering 27, 1 (2021), 25. https://doi.org/10.1007/s10664-021-10063-9
- Luo et al. (2021) Shutian Luo, Huanle Xu, Chengzhi Lu, Kejiang Ye, Guoyao Xu, Liping Zhang, Yu Ding, Jian He, and Chengzhong Xu. 2021. Characterizing Microservice Dependency and Performance: Alibaba Trace Analysis. In Proceedings of the ACM Symposium on Cloud Computing. 412–426.
- Newman (2015) Sam Newman. 2015. Building Microservices (1st ed.). O’Reilly Media, Inc.
- Pallets (2023) Pallets. 2023. Web Development, one drop at time. https://flask.palletsprojects.com/ ”Accessed 2023-01-21 19:52”.
- Parker et al. (2020) Austin Parker, Daniel Spoonhower, Jonathan Mace, Ben Sigelman, and Rebecca Isaacs. 2020. Distributed Tracing in Practice: Instrumenting, Analyzing, and Debugging Microservices. O’Reilly Media, Incorporated. tex.googlebooks: fgfIyAEACAAJ.
- Rubin and Rinard (2016) Julia Rubin and Martin Rinard. 2016. The Challenges of Staying Together While Moving Fast: An Exploratory Study. In Proceedings of the 38th International Conference on Software Engineering (ICSE ’16). Association for Computing Machinery, New York, NY, USA, 982–993. https://doi.org/10.1145/2884781.2884871
- Sambasivan et al. (2016) Raja R. Sambasivan, Ilari Shafer, Jonathan Mace, Benjamin H. Sigelman, Rodrigo Fonseca, and Gregory R. Ganger. 2016. Principled Workflow-centric Tracing of Distributed Systems. In Proceedings of the Seventh ACM Symposium on Cloud Computing (SoCC ’16). ACM, New York, NY, USA, 401–414. https://doi.org/10.1145/2987550.2987568
- Sambasivan et al. (2013) R. R. Sambasivan, I. Shafer, M. L. Mazurek, and G. R. Ganger. 2013. Visualizing Request-Flow Comparison to Aid Performance Diagnosis in Distributed Systems. IEEE Transactions on Visualization and Computer Graphics 19, 12 (2013), 2466–2475. https://doi.org/10.1109/TVCG.2013.233
- Sambasivan et al. (2011) Raja R. Sambasivan, Alice X. Zheng, Michael De Rosa, Elie Krevat, Spencer Whitman, Michael Stroucken, William Wang, Lianghong Xu, and Gregory R. Ganger. 2011. Diagnosing Performance Changes by Comparing Request Flows. In Proceedings of the 8th USENIX Conference on Networked Systems Design and Implementation (Boston, MA) (NSDI’11). USENIX Association, USA, 43–56.
- Shannon (1948) C. E. Shannon. 1948. A mathematical theory of communication. The Bell System Technical Journal 27, 4 (1948), 623–656. https://doi.org/10.1002/j.1538-7305.1948.tb00917.x
- Sigelman et al. (2010) Benjamin H. Sigelman, Luiz André Barroso, Mike Burrows, Pat Stephenson, Manoj Plakal, Donald Beaver, Saul Jaspan, and Chandan Shanbhag. 2010. Dapper, a Large-Scale Distributed Systems Tracing Infrastructure. Technical Report. Google, Inc.
- Sridharan (2017) Cindy Sridharan. 2017. Testing Microservices, the sane way. https://copyconstruct.medium.com/testing-microservices-the-sane-way-9bb31d158c16 ”Accessed 2023-01-16 11:14”.
- Technologies (2023) Uber Technologies. 2023. Jaeger: Open source, end-to-end distributed tracing. https://www.jaegertracing.io/ ”Accessed 2023-01-15 14:10:59”.
- Traini (2022) Luca Traini. 2022. Exploring Performance Assurance Practices and Challenges in Agile Software Development: An Ethnographic Study. Empirical Software Engineering 27, 3 (2022), 74. https://doi.org/10.1007/s10664-021-10069-3 ISBN: 1573-7616.
- Traini and Cortellessa (2021) Luca Traini and Vittorio Cortellessa. 2021. DeLag: Using Multi-Objective Optimization to Enhance the Detection of Latency Degradation Patterns in Service-based Systems. https://doi.org/10.48550/ARXIV.2110.11155
- Traini et al. (2022) Luca Traini, Vittorio Cortellessa, Daniele Di Pompeo, and Michele Tucci. 2022. Towards effective assessment of steady state performance in Java software: are we there yet? Empirical Software Engineering 28, 1 (2022), 13. https://doi.org/10.1007/s10664-022-10247-x
- Traini et al. (2021) Luca Traini, Daniele Di Pompeo, Michele Tucci, Bin Lin, Simone Scalabrino, Gabriele Bavota, Michele Lanza, Rocco Oliveto, and Vittorio Cortellessa. 2021. How Software Refactoring Impacts Execution Time. ACM Trans. Softw. Eng. Methodol. 31, 2, Article 25 (dec 2021), 23 pages. https://doi.org/10.1145/3485136
- Veeraraghavan et al. (2016) Kaushik Veeraraghavan, Justin Meza, David Chou, Wonho Kim, Sonia Margulis, Scott Michelson, Rajesh Nishtala, Daniel Obenshain, Dmitri Perelman, and Yee Jiun Song. 2016. Kraken: Leveraging Live Traffic Tests to Identify and Resolve Resource Utilization Bottlenecks in Large Scale Web Services. In 12th USENIX Symposium on Operating Systems Design and Implementation (OSDI 16). USENIX Association, Savannah, GA, 635–651.
- Zhang et al. (2022) Chenxi Zhang, Xin Peng, Chaofeng Sha, Ke Zhang, Zhenqing Fu, Xiya Wu, Qingwei Lin, and Dongmei Zhang. 2022. DeepTraLog: Trace-Log Combined Microservice Anomaly Detection through Graph-based Deep Learning. In 2022 IEEE/ACM 44th International Conference on Software Engineering (ICSE). 623–634. https://doi.org/10.1145/3510003.3510180
- Zhou et al. (2021) Xiang Zhou, Xin Peng, Tao Xie, Jun Sun, Chao Ji, Wenhai Li, and Dan Ding. 2021. Fault Analysis and Debugging of Microservice Systems: Industrial Survey, Benchmark System, and Empirical Study. IEEE Transactions on Software Engineering 47, 2 (2021), 243–260. https://doi.org/10.1109/TSE.2018.2887384
- Zhou et al. (2019) Xiang Zhou, Xin Peng, Tao Xie, Jun Sun, Chao Ji, Dewei Liu, Qilin Xiang, and Chuan He. 2019. Latent Error Prediction and Fault Localization for Microservice Applications by Learning from System Trace Logs. In Proceedings of the 2019 27th ACM Joint Meeting on European Software Engineering Conference and Symposium on the Foundations of Software Engineering (Tallinn, Estonia) (ESEC/FSE 2019). Association for Computing Machinery, New York, NY, USA, 683–694. https://doi.org/10.1145/3338906.3338961