NCC: An R-package for analysis and simulation of platform trials with non-concurrent controls
Abstract
Platform trials evaluate the efficacy of multiple treatments, allowing for late entry of the experimental arms and enabling efficiency gains by sharing controls. The power of individual treatment-control comparisons in such trials can be improved by utilizing non-concurrent controls (NCC) in the analysis. We present the R-package NCC for the design and analysis of platform trials using non-concurrent controls. NCC allows for simulating platform trials and evaluating the properties of analysis methods that make use of non-concurrent controls in a variety of settings. We describe the main NCC functions and show how to use the package to simulate and analyse platform trials by means of specific examples.
1 Motivation and significance
In recent years, there has been an increasing interest in complex clinical trials to accelerate drug development [1, 2, 3, 4]. Platform trials evaluate the efficacy of several experimental treatments simultaneously, usually compared to a shared control group, while making the design even more flexible than multi-arm trials by allowing arms to enter the trial when this is ongoing. Such designs make it possible to incorporate late-emerging treatments into the study through the common infrastructure, thus speeding up the drug evaluation process. Sharing the control arm in platform trials gives rise to a particularity with respect to the control data. For a given experimental arm, the concurrent controls (CC) are trial participants allocated to the control group while the experimental treatment is active in the platform, hence with a strictly positive probability to be randomized to the respective treatment arm [5]. In contrast, the non-concurrent controls (NCC) are participants recruited prior to that treatment arm entering the platform. Over the last few years, there has been a lively discussion on whether and how to use the non-concurrent controls together with the concurrent controls in the analysis of platform trials [6]. On the one hand, it may be beneficial to use both CC and NCC as the efficiency of the trial can be increased and the total sample size reduced. On the other hand, using NCC can lead to biased estimates and loss of type I error control [7].
Recently, approaches to incorporate NCC while adjusting for potential time trends to control the type I error rate were proposed [8]. Frequentist methods adjust for temporal changes by adding time as a covariate to the regression model [9, 10]. Bayesian approaches proposed in the context of non-concurrent and historical controls include the Time Machine approach and the Meta-Analytic-Predictive (MAP) Prior approach. The Time Machine is based on a Bayesian generalized linear model that smooths the control response over time [11]. The MAP Prior approach, originally proposed in the context of historical controls [12, 13, 14], is a Bayesian down-weighting method that estimates the control effect in the trial by using a prior distribution derived from the non-concurrent data.
In complex designs, the use of software to design the trials and investigate their operating characteristics via simulations has become paramount [15]. Examples of commercial software are FACTS [16], EAST [17] and Solara [18], while open-source packages include OCTOPUS [19], SIMPLE [20], MAMS [21], gsDesign [22] and rpact [23]. However, to the best of our knowledge, no software, neither commercial nor open-source, is available that implements the proposed methodologies to incorporate NCC. Moreover, there is a need to provide statistical tools that allow for assessing the properties of the methods when utilising NCC and risks of bias in the estimates under a range of situations, including time trends.
We introduce the R package NCC [24] that implements existing methods from the literature to incorporate NCC in treatment-control comparisons of platform trials and enables simulation of flexible platform trials with customizable features, such as choosing the timepoints when arms enter and how many arms are planned to be evaluated. This helps users to assess trial characteristics and, particularly, to evaluate the performance of methods that include NCC across various scenarios.
2 Background
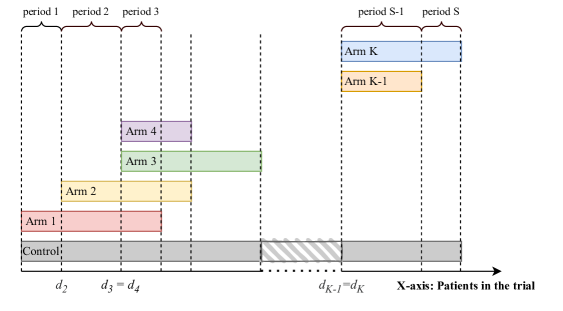
We consider a platform trial design with a flexible number of treatment arms allowed to enter the platform sequentially. The duration of the trial is divided into so-called periods, with a new period starting every time an arm joins or exits the trial (see Figure 1). In this package, we implemented the following methods:
-
•
Frequentist model-based approaches [9, 10], which adjust for time trends by adding time as a covariate into the respective linear or logistic regression model (in form of a fixed effect, random effect, polynomial spline or a piecewise polynomial). These approaches are based on fitting the model taking into account the data of all patients recruited until the arm under study leaves the platform to estimate the effect of time.
-
•
The Bayesian Time Machine [11], which uses a hierarchical Bayesian model and includes a covariate adjustment for time (separating the trial into buckets of pre-defined size). This method also takes into account the data of all patients recruited until recruitment to the investigated arm is completed and the arm leaves the trial. It provides a smoothed estimate of the control response rate over time using a second-order Bayesian normal dynamic linear model.
- •
For a detailed description of the methods, we refer the reader to the corresponding methodological articles cited above. Table 2 outlines the methods implemented together with the corresponding R-function and the main reference. Here, we focus on describing the usage of these methods employing the NCC package. In Section 3, we describe the software, distinguishing between functions for data simulation, functions for data analysis, functions for data visualisation and wrapper functions. In Section 4, we present examples to illustrate the usage of the main functions. We finish the article with conclusions in Section 5.
3 Software description
The NCC package is implemented in R [25] and provides functions to simulate and analyse platform trials with continuous or binary endpoints. For successful installation of the NCC package, the external JAGS library [26] needs to be downloaded and installed first. The NCC package can then be installed from either CRAN (Comprehensive R Archive Network) or GitHub using the following commands:
Ψ> # devtools::install_github("pavlakrotka/NCC")
Ψ> install.packages("NCC")
Ψ> library(NCC)
The package has an accompanying website with additional explanations and short tutorials: https://pavlakrotka.github.io/NCC/.
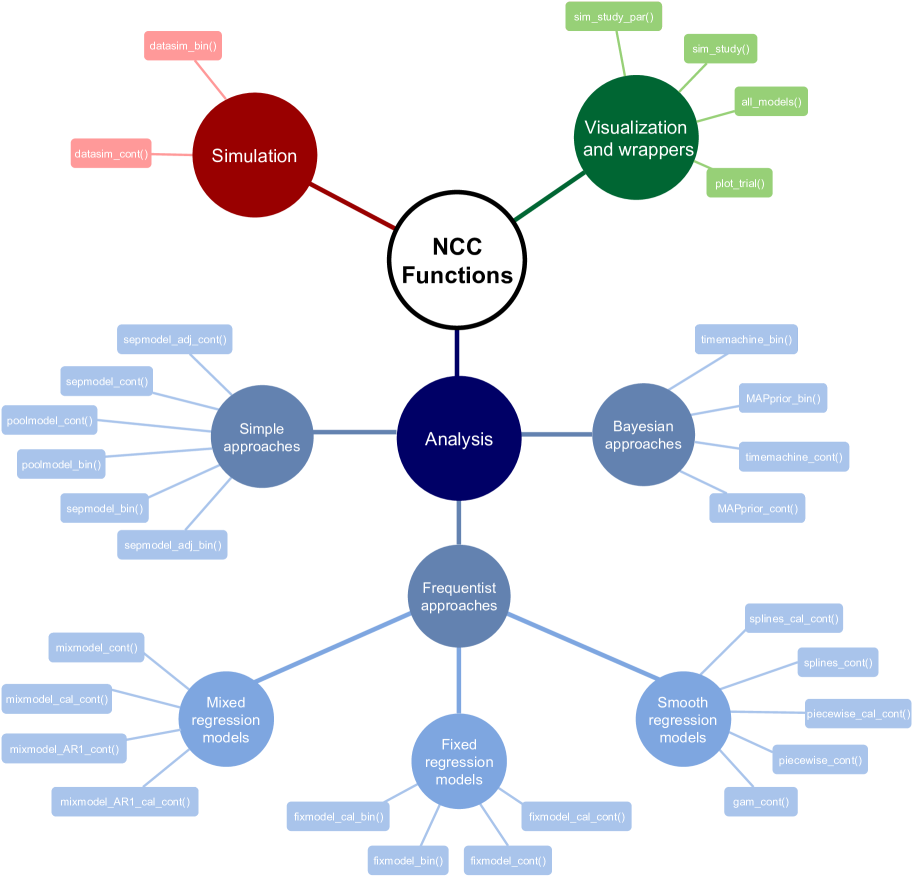
The NCC package can be applied in trials with continuous or binary endpoints, and consists of 34 functions. Functions with the suffix _cont are for simulation and analyses of trials with continuous endpoints, while functions with the suffix _bin are for binary endpoints. The NCC functions can be grouped into three main groups according to their functionality: data simulation, analysis, and visualization and wrappers. Figure 2 outlines the package structure.
The functions datasim_bin() and datasim_cont() simulate patient data from platform trials. The analysis functions include simple approaches (naive pooling or separate analysis [27]), frequentist model-based methods with adjustments for time using fixed or random effects or polynomial functions, and Bayesian approaches. This article focuses on the functions fixmodel_bin(), MAPprior_bin(), timemachine_bin() for testing treatment efficacy compared to a control using CC and NCC data in trials with binary endpoints, with analogous functions ending in _cont for continuous endpoints. Other functions such as plot_trial() and sim_study_par() visualise platform trial data and perform simulation studies, respectively.
In what follows, we describe the usage and features of such functions, including an example. Most functions in the NCC package use common arguments. Table 2 summarises the functions described in this article, and Table LABEL:tab:inputs provides a brief description of the main arguments of these functions and their expected form. We focus mainly on the functions for binary endpoints, but the package website also details the remaining functions. In addition, further explanations regarding the methods and underlying assumptions (e.g., prior distributions in Bayesian methods) can be found in the NCC package manual.
3.1 Data simulation
Platform trials with a binary outcome are simulated using datasim_bin(), as follows:
Ψ> datasim_bin(num_arms, n_arm, d,
Ψperiod_blocks = 2, p0, OR,
Ψlambda, trend, N_peak, n_wave,
Ψfull = FALSE, check = TRUE)
The function takes several arguments including the number of experimental treatment arms (num_arms), their sample size (n_arm), timings of arms entering the trial (d), treatment effects in terms of odds ratios (OR), and control response (p0). Sample sizes in each experimental arm are assumed to be equal. Participants are indexed by entry order, assuming that at each time unit exactly one participant is recruited and the time of recruitment and observation of the response are equal. Participants are assigned to the arms according to block randomization (with block of sizes equal to period_blocks times the number of active arms in that period) using an allocation ratio of 1:1: :1 in each period. The function simulates trial data in the presence of time trends. The time trend pattern can be specified by means of the argument trend, choosing from the options linear, stepwise, inverted-u (with a peak at time N_peak that then needs to be specified) and seasonal (with then the additional required argument n_wave cycles), while the strength of the trend is indicated by the argument lambda, e.g. in the case of the linear trend it would refer to the slope. For more details, see the description in the corresponding functions. The argument full specifies if the output is given solely in the form of a data frame (if full=FALSE) with the trial data, or if the full output is provided in the form of a list, including the trial data and additional information (full=TRUE). Finally, the input parameters can be checked for errors by check. If check=TRUE, the function returns helpful error messages in case of a wrong input.
By default, the function returns a data frame with the simulated trial data containing the columns:
-
•
j - participant recruitment index
-
•
response - response for participant j
-
•
treatment - indicator of the treatment participant j was allocated to
-
•
period - indicator of the period in which participant j was recruited
3.2 Analysis approaches
The main analysis approaches implemented in the NCC package are the frequentist model-based approach, the Time Machine, and the MAP prior approach. The arguments common to all analysis functions are data for providing the data frame with the trial data, consisting of columns named “response”, “treatment” and “period”; arm, the indicator of the experimental treatment arm to be compared to the control and alpha, the one-sided significance level for the frequentist methods or decision boundary for the Bayesian approaches.
To analyse the data using the frequentist model-based approach [10], one can use fixmodel_bin() as follows:
Ψ> fixmodel_bin(data, arm, alpha = 0.025)
The function MAPprior_bin() permits to analyse the data using the MAP prior approach [12, 28] by means of:
Ψ> MAPprior_bin(data, arm, alpha = 0.025, opt = 2,
Ψprior_prec_tau = 4, prior_prec_eta = 0.001,
Ψrobustify = TRUE, weight = 0.1)
To fit the Time Machine model[11], one can use the function timemachine_bin() with the following syntax:
Ψ> timemachine_bin(data, arm, alpha = 0.025, prec_theta = 0.001,
Ψprec_eta = 0.001, tau_a = 0.1, tau_b = 0.01, bucket_size = 25)
The functions for Bayesian approaches additionally enable the specification of the parameters for the prior distributions and other details regarding the estimation of the treatment effect.
The MAP approach requires further arguments to define the type of MAP approach to be used: opt (either 1 or 2) to specify whether the MAP prior treats the non-concurrent control data as if they are from one (if opt=1) or multiple sources (here periods) (if opt=2) for the hierarchical model, robustify to indicate whether the robustified MAP approach [12] is to be used, prior_prec_tau to specify the dispersion parameter for the half-normal prior for the between period heterogeneity, prior_prec_eta to specify the dispersion parameter of the normal prior for the log-odds of the controls; as well as some further arguments (not shown in the code example) to set up the underlying JAGS model [26].
In the Time Machine, the input arguments specify the precision parameters in the normal prior distributions for the control response (prec_eta) and the treatment effect (prec_theta), as well as the parameters and for the Gamma prior distribution regarding the time effect (tau_a and tau_b). Furthermore, the argument bucket_size allows defining the length of the time bucket to be used to adjust for the time effect.
The functions perform the respective analysis of the given dataset to compare the efficacy of a specific treatment against control, thus testing the null hypothesis for arm of against the one-sided alternative . To test , the frequentist model-based and the time machine approaches take into account all trial data until the treatment arm under study leaves the trial (i.e., including even data from unfinished arms that joined the platform up to the final analysis of the given treatment arm). The MAP approach uses all available control data and the evaluated treatment arm to make the comparison.
The output of the analysis functions is a list containing the one-sided p-value, estimated treatment effect and (1-2alpha)% confidence interval (posterior probability of , posterior mean of the effect and credible interval for the Bayesian approaches), and an indicator of whether the null hypothesis was rejected. Functions for frequentist model-based approaches additionally output the fitted model.
3.3 Trial data visualization and wrapper functions
The visualization function plot_trial() uses as an argument a vector with indicators of assigned arms for each participant, ordered by time (treatments) and outputs a plot of the trial progress over time.
The main wrapper function is sim_study_par(), which permits to efficiently run simulation studies using parallel computing. The code is parallelized on replication level, i.e. replications of one scenario are distributed over the available cores. Using this function requires creating a data frame with the desired simulation scenarios beforehand, which is then used as input to the function (argument scenarios) as follows:
Ψ> sim_study_par(nsim, scenarios, arms,
Ψmodels = c("fixmodel", "sepmodel", "poolmodel"),
Ψendpoint, perc_cores = 0.9)
The remaining arguments specify how many times each scenario is replicated (nsim), the treatment arms that will be evaluated (arms), the considered analysis approaches (models), the type of endpoint (endpoint) and the approximate percentage of available cores that to be used for the simulations (perc_cores). The output of sim_study_par() is a data frame with all considered scenarios and corresponding results, that is, the probability to reject the null hypothesis, the bias, and the mean squared error (MSE) of the treatment effect estimates for each evaluated treatment arm and each considered analysis method.
4 Illustrative Examples
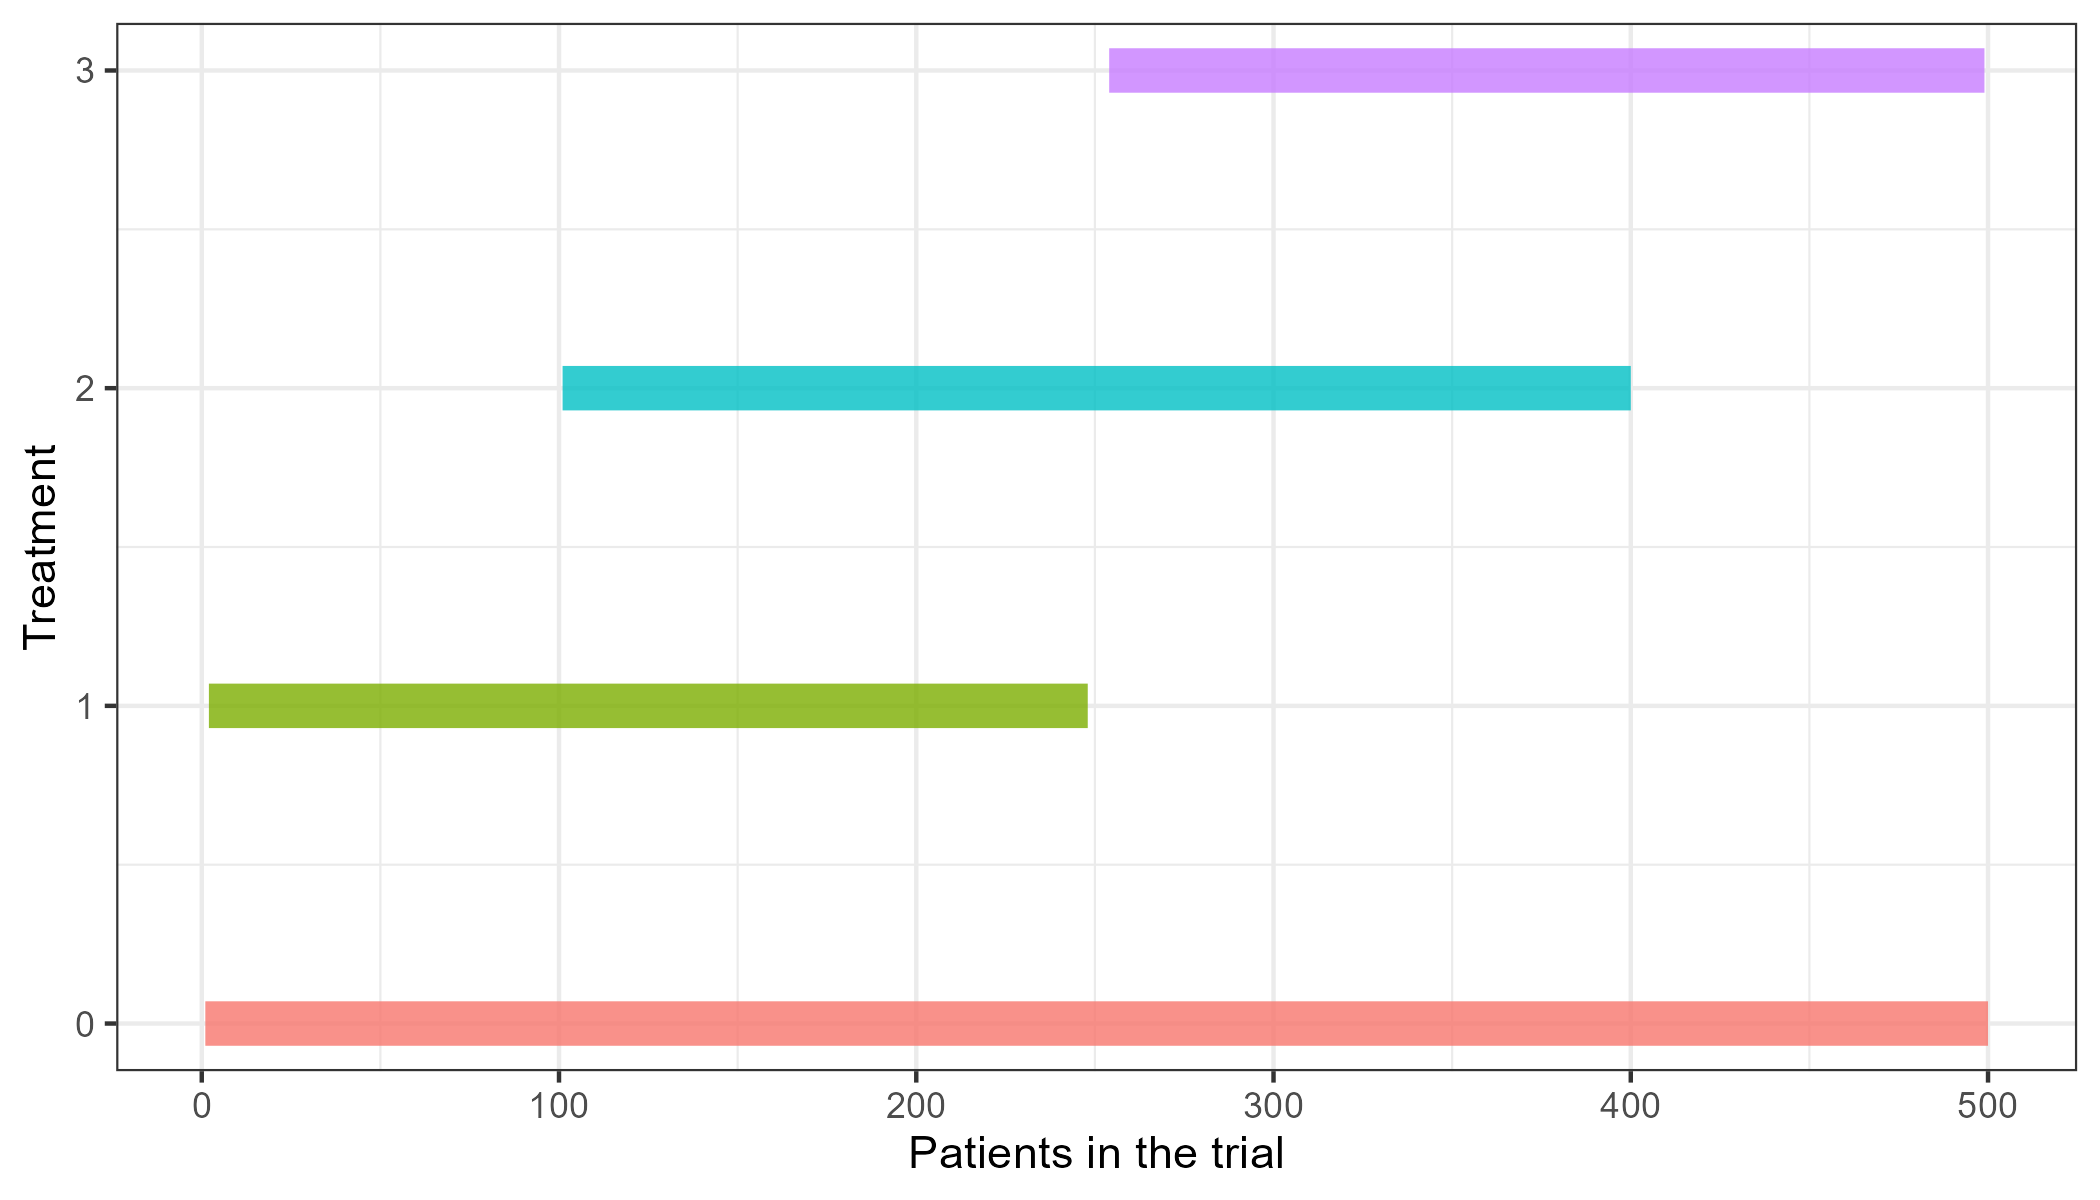
Assume a platform trial with a shared control and three experimental arms entering the trial sequentially. When arm 3 ends, we want to evaluate its efficacy compared to the control. To increase the precision of the treatment effect estimate, we want to make use of the NCC data. Suppose that the data of such a hypothetical trial is given by a data frame, trial_data,
Ψ> head(trial_data)
Ψj response treatment period
Ψ1 1        1         0      1
Ψ2 2        1         1      1
Ψ3 3        0         0      1
Ψ4 4        1         1      1
Ψ5 5        1         0      1
Ψ6 6        0         1      1
where the patient index is given in the first column, followed by the binary responses, the treatment arm indicator and finally the period allocation. We then run
Ψ> plot_trial(trial_data$treatment)
whose output is Figure 3 and visualises the entry and exit of arms over time as well as the overlaps between arms.
To compare the efficacy of treatment 3 against control, we first consider a frequentist model that adjusts for time trends. Using fixmodel_bin(), we fit a logistic regression that includes the period as a categorical covariate in the model to compare arm 3 against control, utilising NCC. To do so, the user can run
Ψ> fixmodel_bin(data=trial_data, arm=3, alpha=0.025)
Ψ$p_val
Ψ[1] 0.01034581
Ψ$treat_effect
Ψ[1] 0.9887792
Ψ$lower_ci
Ψ[1] 0.1812323
Ψ$upper_ci
Ψ[1] 1.873453
Ψ$reject_h0
Ψ[1] TRUE
The list contains the p-value (p_val) corresponding to testing the null hypothesis , the estimated treatment effect (treat_effect) on the log-scale (i.e., ) and the respective lower and upper limits of the (1-2alpha)% confidence interval (lower_ci, upper_ci). The list also includes a binary indicator of (p_val < alpha), i.e., whether the null hypothesis can be rejected on the specified significance level (reject_h0). In the considered case, the null hypothesis is rejected, implying that treatment arm 3 is efficacious. Furthermore, the output includes the fitted logistic regression model (model), here omitted for simplicity. However, the fitted model can be further analysed using the conventional R functions for generalized linear models, such as summary(fixmodel_bin(data=trial_data, arm=3)$model).
If, however, a Bayesian approach to down-weight the NCC over the CC data is under consideration, one could specify the prior for the control arm using the non-concurrent control data employing the MAP Prior approach. This analysis is performed with the NCC package as follows:
Ψ> MAPprior_bin(data=trial_data, arm=3, alpha=0.025)
Ψ$p_val
Ψ[1] 0.008
Ψ$treat_effect
Ψ[1] 1.007411
Ψ$lower_ci
Ψ[1] 0.1727606
Ψ$upper_ci
Ψ[1] 1.821909
Ψ$reject_h0
Ψ[1] TRUE
Modeling by means of the Time Machine is enabled through timemachine_bin():
Ψ> timemachine_bin(data=trial_data, arm=3, alpha=0.025)
Ψ$p_val
Ψ[1] 0.01066667
Ψ$treat_effect
Ψ[1] 0.9559603
Ψ$lower_ci
Ψ[1] 0.1380064
Ψ$upper_ci
Ψ[1] 1.807921
Ψ$reject_h0
Ψ[1] TRUE
In the outputs of the Bayesian approaches, the p-value (p_val) is given by the posterior probability that . The treatment effect (treat_effect) refers to the posterior mean of the and the lower and upper confidence limits (lower_ci, upper_ci) to the limits of the (1-2alpha)% credible interval for . Finally, reject_h0 indicates whether the posterior probability given by p_val is less than alpha.
An example of how to use the NCC package to perform a simulation study can be found in the supplementary material.
5 Impact and conclusions
The use of non-concurrent data has been a subject of discussions in recent years [7, 3, 6]. Modelling approaches have been proposed to include non-concurrent control (NCC) data in platform trials to deal with time trends [9, 10, 29, 11], and methods previously considered to incorporate historical controls have been suggested in this context [8, 12, 28, 27]. The NCC package provides the implementation of methods to incorporate non-concurrent controls in platform trials. Moreover, the user can simulate a large number of trials under different scenarios and evaluate the properties and robustness of the methods according to the assumptions. The package can help statisticians in industry or regulators to check the use of NCC and provide a basis for discussing the trial design under different scenarios.
In this article, we have described the functionalities of the NCC R package for the design and analysis of platform trials using NCC. To our knowledge, this is the only R package with tools for assessing the properties of methods that incorporate NCC and simulating platform trial data in the presence of time trends. The package is available on CRAN; examples and tutorials can be found on the website. In future work, we plan to implement allocation rates other than equal allocation and add interim analyses. Furthermore, we will consider extending the models to survival platform trials and their implementation in the package.
Acknowledgments
We thank the anonymous reviewers whose comments and suggestions helped to improve and clarify this manuscript.
EU-PEARL (EU Patient-cEntric clinicAl tRial pLatforms) project has received funding from the Innovative Medicines Initiative (IMI) 2 Joint Undertaking (JU) under grant agreement No 853966. This Joint Undertaking receives support from the European Union’s Horizon 2020 research and innovation programme and EFPIA and Children’s Tumor Foundation, Global Alliance for TB Drug Development non-profit organisation, Spring works Therapeutics Inc. This publication reflects the authors’ views. Neither IMI nor the European Union, EFPIA, or any Associated Partners are responsible for any use that may be made of the information contained herein.
References
- Woodcock and LaVange [2017] Janet Woodcock and Lisa M LaVange. Master Protocols to Study Multiple Therapies, Multiple Diseases, or Both. New England Journal of Medicine, 377(1):62–70, jul 2017. ISSN 0028-4793. doi: 10.1056/NEJMra1510062. URL http://www.nejm.org/doi/10.1056/NEJMra1510062.
- Collignon et al. [2020] Olivier Collignon, Christian Gartner, Anna Bettina Haidich, Robert James Hemmings, Benjamin Hofner, Frank Pétavy, Martin Posch, Khadija Rantell, Kit Roes, and Anja Schiel. Current Statistical Considerations and Regulatory Perspectives on the Planning of Confirmatory Basket, Umbrella, and Platform Trials. Clinical Pharmacology and Therapeutics, 107(5):1059–1067, 2020. ISSN 15326535. doi: 10.1002/cpt.1804.
- Meyer et al. [2021a] Elias Laurin Meyer, Peter Mesenbrink, Tobias Mielke, Tom Parke, Daniel Evans, and Franz König. Systematic review of available software for multi-arm multi-stage and platform clinical trial design. Trials, 22(1):183, dec 2021a. ISSN 1745-6215. doi: 10.1186/s13063-021-05130-x. URL https://trialsjournal.biomedcentral.com/articles/10.1186/s13063-021-05130-x.
- Saville and Berry [2016] Benjamin R. Saville and Scott M. Berry. Efficiencies of platform clinical trials: A vision of the future. Clinical Trials, 13(3):358–366, jun 2016. ISSN 1740-7745. doi: 10.1177/1740774515626362. URL http://journals.sagepub.com/doi/10.1177/1740774515626362.
- Collignon et al. [2022] Olivier Collignon, Anja Schiel, Carl‐Fredrik Burman, Kaspar Rufibach, Martin Posch, and Frank Bretz. Estimands and Complex Innovative Designs. Clinical Pharmacology & Therapeutics, 0(0), mar 2022. ISSN 0009-9236. doi: 10.1002/cpt.2575. URL https://onlinelibrary.wiley.com/doi/10.1002/cpt.2575.
- Sridhara et al. [2021] Rajeshwari Sridhara, Olga Marchenko, Qi Jiang, Richard Pazdur, Martin Posch, Scott Berry, Marc Theoret, Yuan Li Shen, Thomas Gwise, Lorenzo Hess, Andrew Raven, Khadija Rantell, Kit Roes, Richard Simon, Mary Redman, Yuan Ji, and Cindy Lu. Use of Nonconcurrent Common Control in Master Protocols in Oncology Trials: Report of an American Statistical Association Biopharmaceutical Section Open Forum Discussion. Statistics in Biopharmaceutical Research, 0(0):1–5, jul 2021. ISSN 1946-6315. doi: 10.1080/19466315.2021.1938204. URL https://doi.org/10.1080/19466315.2021.1938204.
- Dodd et al. [2021] Lori E. Dodd, Boris Freidlin, and Edward L. Korn. Platform Trials – Beware the Noncomparable Control Group. New England Journal of Medicine, 384(16):1572–1573, apr 2021. ISSN 0028-4793. doi: 10.1056/NEJMc2102446. URL http://www.nejm.org/doi/10.1056/NEJMc2102446.
- Bofill Roig et al. [2022] Marta Bofill Roig, Cora Burgwinkel, Ursula Garczarek, Franz Koenig, Martin Posch, Quynh Nguyen, and Katharina Hees. On the use of non-concurrent controls in platform trials: A scoping review. arXiv preprint arXiv:2211.09547, 2022.
- Lee and Wason [2020] Kim May Lee and James Wason. Including non-concurrent control patients in the analysis of platform trials: is it worth it? BMC Medical Research Methodology, 20(1):165, dec 2020. ISSN 1471-2288. doi: 10.1186/s12874-020-01043-6. URL https://bmcmedresmethodol.biomedcentral.com/articles/10.1186/s12874-020-01043-6.
- Bofill Roig et al. [2022a] Marta Bofill Roig, Pavla Krotka, Carl-Fredrik Burman, Ekkehard Glimm, Stefan M. Gold, Katharina Hees, Peter Jacko, Franz Koenig, Dominic Magirr, Peter Mesenbrink, Kert Viele, and Martin Posch. On model-based time trend adjustments in platform trials with non-concurrent controls. BMC Medical Research Methodology, 22(1):228, aug 2022a. ISSN 1471-2288. doi: 10.1186/s12874-022-01683-w. URL https://bmcmedresmethodol.biomedcentral.com/articles/10.1186/s12874-022-01683-w.
- Saville et al. [2022] Benjamin R Saville, Donald A Berry, Nicholas S Berry, Kert Viele, and Scott M Berry. The Bayesian Time Machine: Accounting for temporal drift in multi-arm platform trials. Clinical Trials, 19(5):490–501, oct 2022. ISSN 1740-7745. doi: 10.1177/17407745221112013. URL http://journals.sagepub.com/doi/10.1177/17407745221112013.
- Schmidli et al. [2014] Heinz Schmidli, Sandro Gsteiger, Satrajit Roychoudhury, Anthony O’Hagan, David Spiegelhalter, and Beat Neuenschwander. Robust meta-analytic-predictive priors in clinical trials with historical control information. Biometrics, 70(4):1023–1032, dec 2014. ISSN 0006341X. doi: 10.1111/biom.12242. URL https://onlinelibrary.wiley.com/doi/10.1111/biom.12242.
- Weber et al. [2021] Sebastian Weber, Yue Li, John W. Seaman III, Tomoyuki Kakizume, and Heinz Schmidli. Applying Meta-Analytic-Predictive Priors with the R Bayesian Evidence Synthesis Tools. Journal of Statistical Software, 100(19), 2021. ISSN 1548-7660. doi: 10.18637/jss.v100.i19. URL https://www.jstatsoft.org/v100/i19/.
- Wang et al. [2022] Chenguang Wang, Min Lin, Gary L Rosner, and Guoxing Soon. A bayesian model with application for adaptive platform trials having temporal changes. Biometrics, 2022.
- Meyer et al. [2021b] Elias Laurin Meyer, Peter Mesenbrink, Tobias Mielke, Tom Parke, Daniel Evans, and Franz König. Systematic review of available software for multi-arm multi-stage and platform clinical trial design. Trials, 22(1):183, dec 2021b. ISSN 1745-6215. doi: 10.1186/s13063-021-05130-x. URL https://trialsjournal.biomedcentral.com/articles/10.1186/s13063-021-05130-x.
- Consultants [2023] Berry Consultants. FACTS - Fixed and adaptive clinical trial simulator, 2023. https://www. berryconsultants.com/wp-content/uploads/2014/09/FACTS-Overview.pdf.
- Cytel [2023a] Cytel. East, 2023a. https://www.cytel.com/hubfs/0-2018/east/east.pdf.
- Cytel [2023b] Cytel. Solara, 2023b. https://www.cytel.com/software/solara/.
- JK [2020] Wathen JK. Octopus - optimize clinical trials on platforms using simulation, 2020. https://github.com/kwathen/OCTOPUS.
- Meyer et al. [2023] Elias Laurin Meyer, Tobias Mielke, Tom Parke, Peter Jacko, and Franz König. SIMPLE - A Modular Tool for Simulating Complex Platform Trials. SRRN preprint, 2023. doi: 10.2139/ssrn.4419138. URL https://ssrn.com/abstract=4419138.
- Jaki et al. [2019] Thomas Jaki, Philip Pallmann, and Dominic Magirr. The R package MAMS for designing multi-arm multi-stage clinical trials. Journal of Statistical Software, 88(4):1–25, 2019. doi: 10.18637/jss.v088.i04.
- Anderson [2022] Keaven Anderson. gsDesign: Group Sequential Design, 2022. https://CRAN.R-project.org/package=gsDesign.
- Gernot Wassmer [2022] Friedrich Pahlke Gernot Wassmer. rpact: Confirmatory Adaptive Clinical Trial Design and Analysis, 2022. URL https://www.rpact.com/products#r-package-rpact. https://CRAN.R-project.org/package=rpact.
- Krotka et al. [2023] Pavla Krotka, Marta Bofill Roig, Katharina Hees, Peter Jacko, and Dominic Magirr. NCC: Simulation and analysis of platform trials with non-concurrent controls, 2023. https://CRAN.R-project.org/package=NCC, https://pavlakrotka.github.io/NCC/.
- R Core Team [2023] R Core Team. R: A Language and Environment for Statistical Computing. R Foundation for Statistical Computing, Vienna, Austria, 2023. URL https://www.R-project.org/.
- Plummer [2022] Martyn Plummer. JAGS: Just Another Gibbs Sampler, 2022. https://mcmc-jags.sourceforge.io/.
- Jiao et al. [2019] Feiran Jiao, Wenda Tu, Sara Jimenez, Victor Crentsil, and Yeh Fong Chen. Utilizing shared internal control arms and historical information in small-sized platform clinical trials. Journal of Biopharmaceutical Statistics, 29(5):845–859, 2019. ISSN 15205711. doi: 10.1080/10543406.2019.1657132. URL https://doi.org/10.1080/10543406.2019.1657132.
- Viele et al. [2014] Kert Viele, Scott Berry, Beat Neuenschwander, Billy Amzal, Fang Chen, Nathan Enas, Brian Hobbs, Joseph G. Ibrahim, Nelson Kinnersley, Stacy Lindborg, Sandrine Micallef, Satrajit Roychoudhury, and Laura Thompson. Use of historical control data for assessing treatment effects in clinical trials. Pharmaceutical statistics, 13(1):41–54, 2014. ISSN 15391612. doi: 10.1002/pst.1589.
- Bofill Roig et al. [2022b] Marta Bofill Roig, Franz König, Elias Meyer, and Martin Posch. Commentary: Two approaches to analyze platform trials incorporating non-concurrent controls with a common assumption. Clinical Trials, 19(5):502–503, oct 2022b. ISSN 1740-7745. doi: 10.1177/17407745221112016. URL http://journals.sagepub.com/doi/10.1177/17407745221112016.
| Nr. | Code metadata description | Please fill in this column |
| C1 | Current code version | v1.0 |
| C2 | Permanent link to code/repository used for this code version | https://github.com/pavlakrotka/NCC |
| C3 | Permanent link to Reproducible Capsule | https://github.com/pavlakrotka/NCC/tree/main/paper |
| C4 | Legal Code License | MIT |
| C5 | Code versioning system used | Git |
| C6 | Software code languages, tools, and services used | R |
| C7 | Compilation requirements, operating environments & dependencies | R ( 4.1.3), JAGS (4.x.y) |
| C8 | If available Link to developer documentation/manual | https://pavlakrotka.github.io/NCC/ |
| C9 | Support email for questions | pavla.krotka@meduniwien.ac.at |
| Function | Description | Functionality | Reference |
| datasim_cont() | Simulates trials with continuous endpoints | Data simulation | [24] |
| datasim_bin() | Simulates trials with binary endpoints | Data simulation | [24] |
| linear_trend() | Generates a linear time trend | Data simulation | [24] |
| sw_trend() | Generates a step-wise time trend | Data simulation | [24] |
| inv_u_trend() | Generates a inverted-u time trend | Data simulation | [24] |
| seasonal_trend() | Generates a seasonal time trend | Data simulation | [24] |
| fixmodel_bin() | Performs analysis using a regression model adjusting for periods for binary data | Data analysis | [10], [24] |
| poolmodel_bin() | Performs pooled analysis for binary data | Data analysis | [27], [24] |
| sepmodel_bin() | Performs separate analysis for binary data | Data analysis | [27], [24] |
| MAPprior_bin() | Performs analysis using the MAP prior approach for binary data | Data analysis | [12], [24] |
| timemachine_bin() | Performs analysis using the time machine approach for binary data | Data analysis | [11], [24] |
| fixmodel_cont() | Performs analysis using a regression model adjusting for periods for continuous data | Data analysis | [10], [24] |
| poolmodel_cont() | Performs pooled analysis for continuous data | Data analysis | [27], [24] |
| sepmodel_cont() | Performs separate analysis for continuous data | Data analysis | [27], [24] |
| MAPprior_cont() | Performs analysis using the MAP prior approach for continuous data | Data analysis | [12], [24] |
| timemachine_cont() | Performs analysis using the time machine approach for continuous data | Data analysis | [24] |
| sim_study_par() | Performs a simulation study with given scenarios | Wrapper function | [24] |
| plot_trial() | Visualizes the simulated trial over time | Data visualization | [24] |
| Argument | Description | Functions |
| num_arms | Integer. Total number of treatment arms in the trial | datasim_bin(), datasim_cont() |
| n_arm | Integer. Sample size per experimental treatment arm | datasim_bin(), datasim_cont() |
| d | Integer vector with timings of adding new arms in terms of number of participants recruited to the trial so far | datasim_bin(), datasim_cont() |
| p0 | Double. Response rate in the control arm for platform trials with binary endpoints | datasim_bin() |
| mu0 | Double. Response in the control arm for platform trials with continuous endpoints | datasim_cont() |
| OR | Double vector with odds ratios for each experimental treatment arm compared to control | datasim_bin() |
| theta | Double vector with treatment effects in terms of difference of means for each experimental treatment arm compared to control | datasim_cont() |
| sigma | Double. Standard deviation of the continuous responses, common to all arms | datasim_cont() |
| lambda | Double vector with strengths of time trend in each arm | datasim_bin(), datasim_cont() |
| trend | String indicating the time trend pattern | datasim_bin(), datasim_cont() |
| data | Data frame with trial data, e.g. generated with the datasim_*() functions | fixmodel_bin(), fixmodel_cont(), MAPprior_bin(), MAPprior_cont(), timemachine_bin(), timemachine_cont(), sepmodel_bin(), sepmodel_cont(), poolmodel_bin(), poolmodel_cont() |
| arm | Integer. Index of the treatment arm under study to perform inference on | fixmodel_bin(), fixmodel_cont(), MAPprior_bin(), MAPprior_cont(), timemachine_bin(), timemachine_cont(), sepmodel_bin(), sepmodel_cont(), poolmodel_bin(), poolmodel_cont() |
| alpha | Double. One-sided significance level | fixmodel_bin(), fixmodel_cont(), MAPprior_bin(), MAPprior_cont(), timemachine_bin(), timemachine_cont(), sepmodel_bin(), sepmodel_cont(), poolmodel_bin(), poolmodel_cont() |
| ncc | Logical. Indicates whether to include NCC data into the analysis | fixmodel_bin(), fixmodel_cont() |
| prior_prec_tau | Double. Precision parameter of the half normal hyperprior, the prior for the between study heterogeneity | MAPprior_bin(), MAPprior_cont() |
| prior_prec_eta | Double. Precision parameter of the normal hyperprior, the prior for the hyperparameter mean of the control reponse | MAPprior_bin(), MAPprior_cont() |
| prec_theta | Double. Precision of the prior regarding the treatment effect | timemachine_bin(), timemachine_cont() |
| prec_eta | Double. Precision of the prior regarding the control response | timemachine_bin(), timemachine_cont() |
| tau_a | Double. Parameter of the Gamma distribution for the precision parameter in the model for the time trend | timemachine_bin(), timemachine_cont() |
| tau_b | Double. Parameter of the Gamma distribution for the precision parameter in the model for the time trend | timemachine_bin(), timemachine_cont() |
| prec_a | Double. Parameter of the Gamma distribution regarding the precision of the responses | timemachine_cont() |
| prec_b | Double. Parameter of the Gamma distribution regarding the precision of the responses | timemachine_cont() |
| bucket_size | Integer. Number of participants per time bucket | timemachine_bin(), timemachine_cont() |
See pages - of Suppmaterial.pdf