Yuki.Inoue.: E-mail: iyuki@ncu.edu.tw, Telephone: +886-3-422-7151
Development of Advanced Photon Calibrator for KAGRA
Abstract
The KAGRA cryogenic gravitational-wave observatory has begun joint observation with the worldwide gravitational waves detector network. Precise calibration of the detector response is essential for the parameter estimation of gravitational wave sources. The photon calibrator is the main calibrator in LIGO, Virgo and KAGRA, and we used this calibrator in joint observation 3 on 2020 April with GEO600 in Germany. KAGRA improved the system for joint observation 3 with three unique points: high laser power, power stabilization system, and remote beam position control. KAGRA employs the 20 W laser and divides it into two beams injected on the mirror surface. By using a high-power laser, we can calibrate the response at the kHz region. To control the power of each laser independently, we also installed an optical follower servo for each beam power stabilization. By controlling the optical path of the photon calibrater beam positions with pico-motors, we were able to characterize the rotation response of the detector. We also installed a telephoto camera and QPD to monitor beam position and controlled beam position to optimize mirror response. In this paper, we discussed the statistical error with the result of the relative power noise measurement. We also discussed systematic errors about the power calibration model of photon calibrator and simulation of elastic deformation effect with the finite element analysis.
1 Introduction
Detection of gravitational waves (GWs) has the potential to be the foundation for the future understanding of physics, such as general relativity, nuclear physics, cosmology, and astrophysics. [1] In particular, calibrated gravitational waveforms with low statistical and systematic errors are expected to give us significant information for new physics. Advanced LIGO [2] and Advanced Virgo [3] have measured some gravitational waves that are consistent with the simulation of numerical relativity [1]. In addition, the international joint observation with Advanced LIGO, Advanced Virgo, KAGRA, [4, 5, 6] and LIGO India are going to provide us with essential information, such as masses, spins, localization, red-shift, and polarizations of gravitational wave sources. KAGRA is a 3-km Large-Scale Cryogenic Gravitational Wave Telescope, which has been placed at Kamioka in Gifu prefecture, Japan. [4, 5, 6] KAGRA employs two unique approaches: underground site and cryogenic mirrors. The stable underground and cryogenic mirrors provide us with low seismic noise and low thermal noise, respectively.
GWs cause differential variations of the arm length and generate power modulations in the detector readout. The power fluctuations measured by a photodetector work as the GW readout signal and an error signal for controlling differential arm length. For the stable operation of the instruments, feedback control of the differential arm length is required. This control is achieved by taking a digitized readout signal, applying a set of digital filters, and sending the opposite phase signal of the filtered signal as a control signal to the test mass actuators. Therefore, the estimation of the equivalent GW strain sensed by the interferometer requires characterization and correction with calibration for the feedback control loop. [5, 7, 8, 9] By modeling differential arm length with parameter from calibration, the calibrated gravitational wave strain are reconstructed [9].
Calibration uncertainties are directly translated to the errors in the absolute GW signal. The primary impact of calibration uncertainties on the parameters appears to be in the determination of the distance to the source. Furthermore, since the estimation of the population of GW sources depends on the third power of the source distance, calibration uncertainties are also translated into uncertainties in the population estimation. [10, 11, 12] Calibration uncertainties also affect coordinate reconstruction, particularly in the case that only up to three detectors in the worldwide GW detector network can detect the GW signal. This phenomenon often occurs because the sensitivity of the interferometer has directional dependence. The effect of calibration uncertainties is visible in high signal-to-noise ratio events where the angular resolution is less affected by the detector noise. [13, 7, 14] The photon calibrator (Pcal) is used in LIGO, Virgo, and KAGRA to calibrate interferometer response.
The Pcal can give a modulation the mirror surface with photon pressure. In the joint observation run 3 (2020 April) with KAGRA and GEO600 (O3GK), [15, 6, 8, 16] KAGRA employs the photon calibrator as a primary calibrator. The summary of the calibration overview in O3GK is described in the summary paper. [8] The initial characterization of photon calibrator instruments are summarized elsewhere. [17, 18] Pcal can modulate the mirror displacement by injecting the power-stabilized laser with intensity modulation. The main applications of the photon calibrator are (i) calibration of an interferometer response, (ii) monitoring of time dependency of the interferometer response, and (iii) hardware injection to verify the analysis pipeline [19, 18]. The displacement of the mirror can be written as:
| (1) |
where is the absolute laser power, is the incident angle of the Pcal laser, and is the speed of light [20, 21, 22]. is the force-to-displacement transfer function of the suspended pendulum. The complete form can be defined as
| (2) |
where , and are the transfer functions of pendulums for displacement, rotation and elastic deformations of mirror, respectively. In our observation frequency, we assumed that the pendulum transfer function was free mass motion. The transfer function is obtained from the following equations:
| (3) |
and
| (4) |
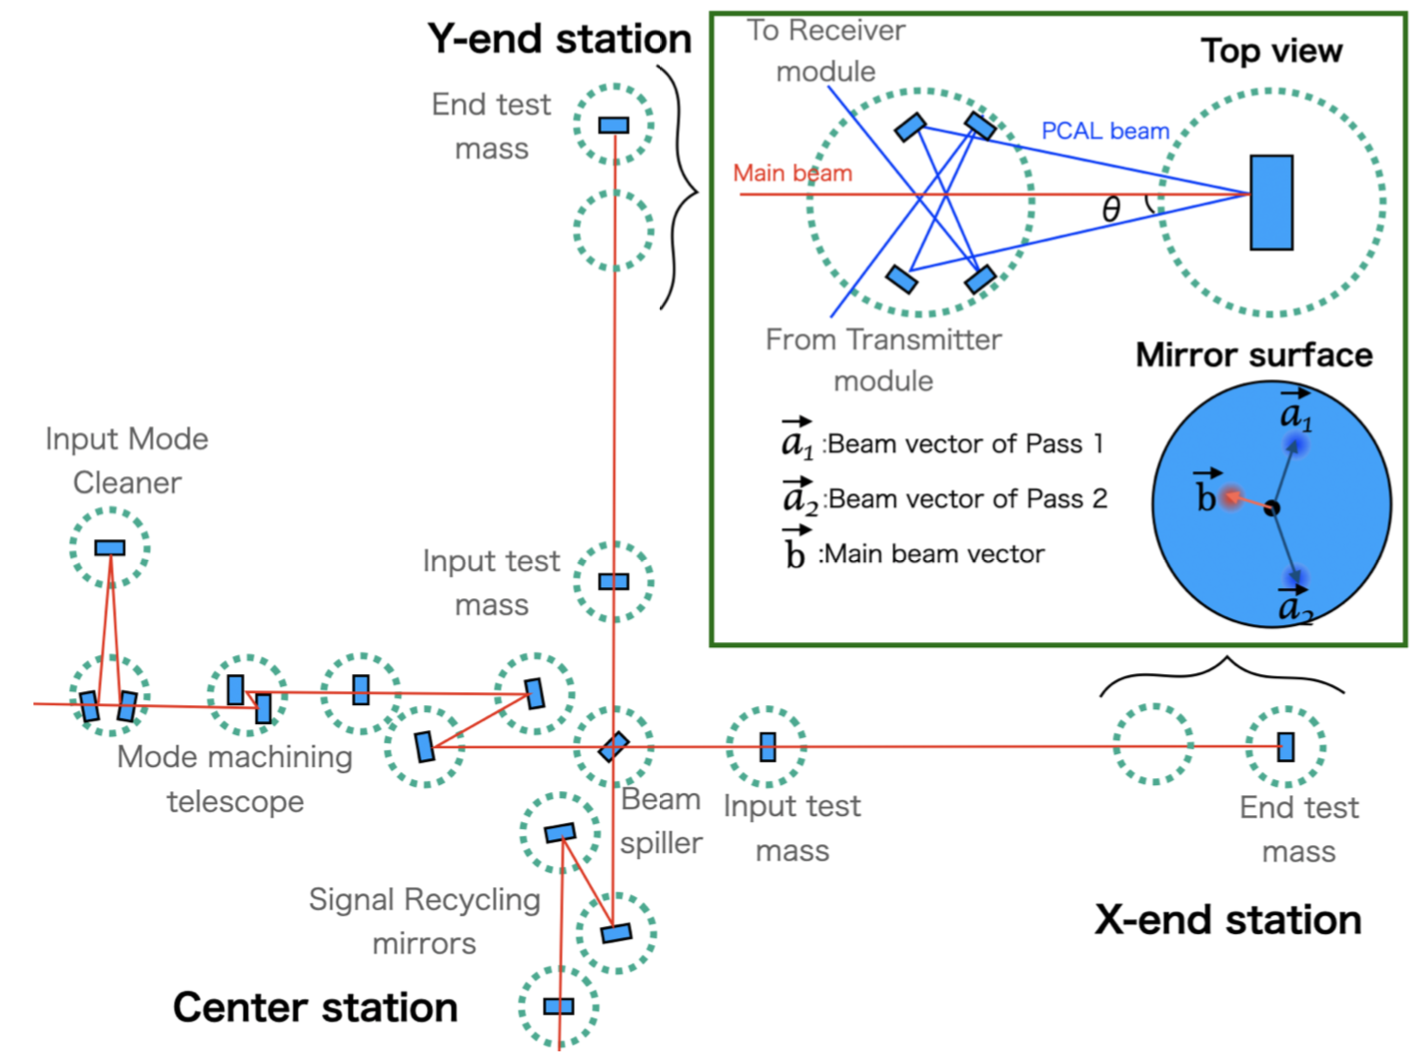
where and are the mass and moment of inertia of the test mass, and are the thickness and radius of the test mass, is the angular frequency of the laser power modulation, and and are the vectors pointing to the center of force of the Pcal beams and the main interferometer beam, respectively [20, 21, 22]. Figure 1 shows the schematic view of KAGRA interferometer and definition of beam vectors. The definition of beam position vectors are shown in Fig. 2. The transfer function with elastic deformation is described below. [23]
| (5) |
where is the deformation of test mass surface normalized by the injected power, and are coordinate parameters, is Gaussian beam profile of main laser beam.
The response to the excitation forces can be represented by the appropriate linear combination of normal modes. In particular, butterfly mode and drumhead mode ate main contribution of elastic deformation mode. However, these symmetric deformation effects can be mitigated by applying at least two beams that are diametrically opposed and sufficiently displaced from the center of the test mass. This trick erase and . Only , which is necessary for calibration, remains. This scheme was tested and implemented in LIGO with an Advanced LIGO photon calibrator. [20]
We monitored the time dependency of the transfer function using the calibration pipelines [8]. This method is also available for monitoring the time dependency of the response function, such as the time dependencies of the actuation response, optical gain, and cavity pole frequency. By using this informations, we can estimate the uncertainty of gravitational wave strain. This is because that the relative response function is proportional to relative gravitational wave strain.
The displacement of the mirror is proportional to absolute laser power. Therefore, we needed to calibrate the absolute Pcal laser power. LIGO’s power standard is calibrated by NIST every year, and the relative uncertainty of power standard is 0.32 %. On the other hand, NIST corresponds the absolute laser power response with several countries, whose absolute uncertainty is about 3 %. [24, 25] The Pcal power-stabilized laser also provided information on the consistency check of the response function. By using the Pcal read-back signal as a response of receiver module output, we were able to estimate the expected response of the end test mass. The definition of PCAL read-back signal is explained in Sec. 4. We can compare the expected from the read-back signal and the estimated from the reconstruction pipeline of KAGRA.
Recently, the gravity field calibrator and Newtonian Calibrator methods have been proposed for absolute calibration. [26, 27, 14] The gravity field calibrator has a rotating disk with quadrupole mass distribution, which changes a gravity gradient around the end test mass. The demonstration of this method will be carried out in a future gravitational wave experiment.
In this paper, we summarized the photon calibrator instruments of KAGRA with the measurement of relative intensity noise and relative harmonics noise. In particular, the characterization of Pcal with 20 W laser is first demonstration in the research field. In section 2, we explained the specifications and design of the system. In section 3, we discussed the measurement results of the relative power noise and the harmonic noise. In section 4, we obtained the systematic errors.
2 INSTRUMENTS
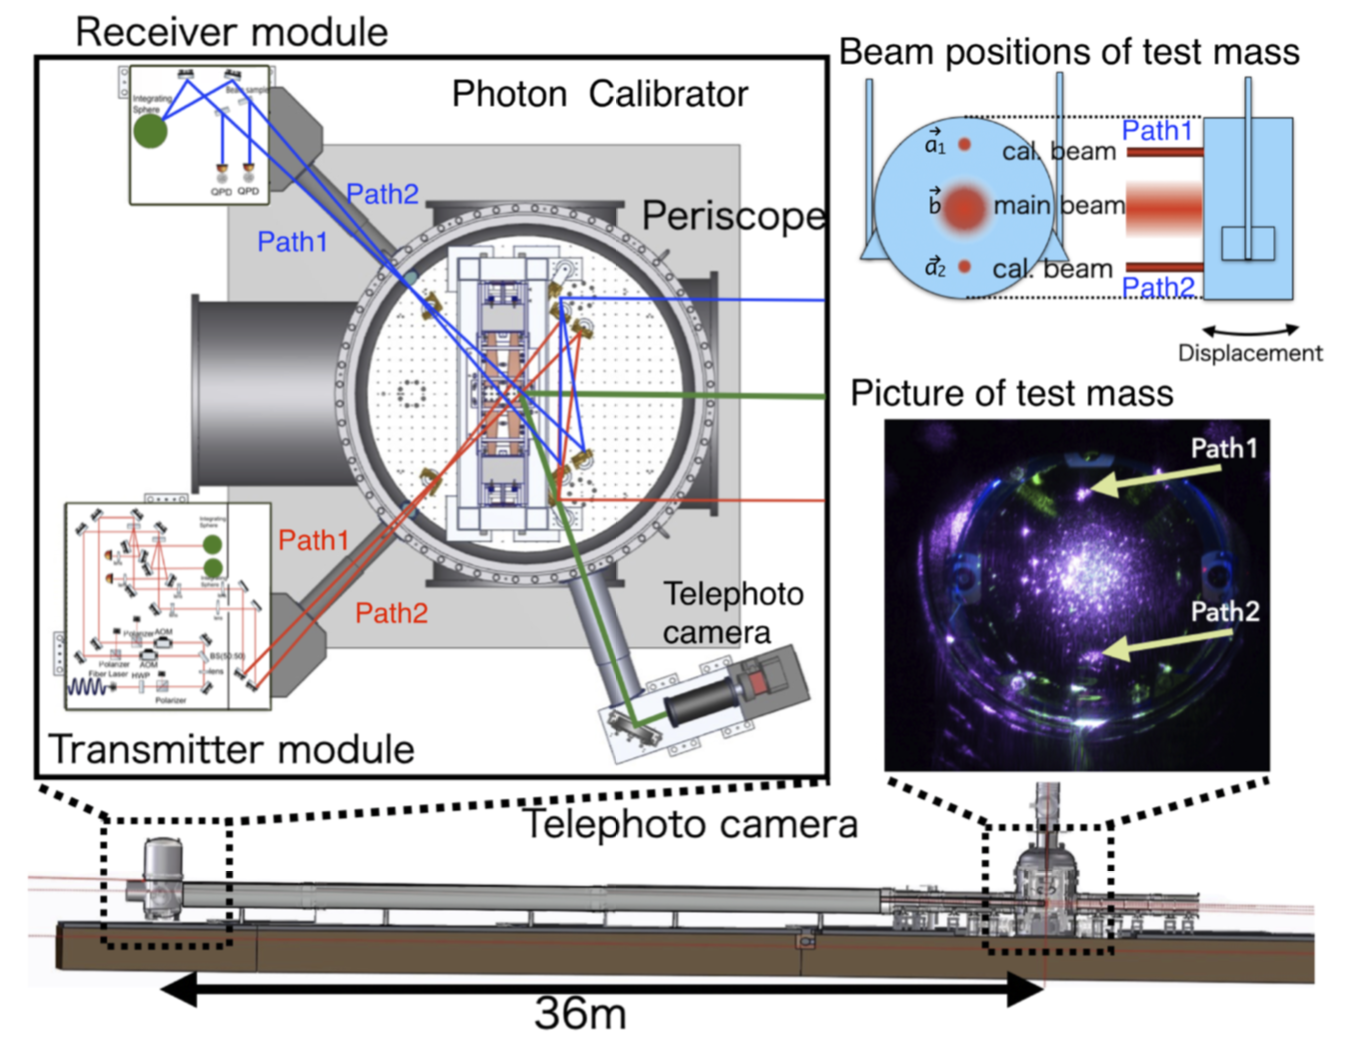
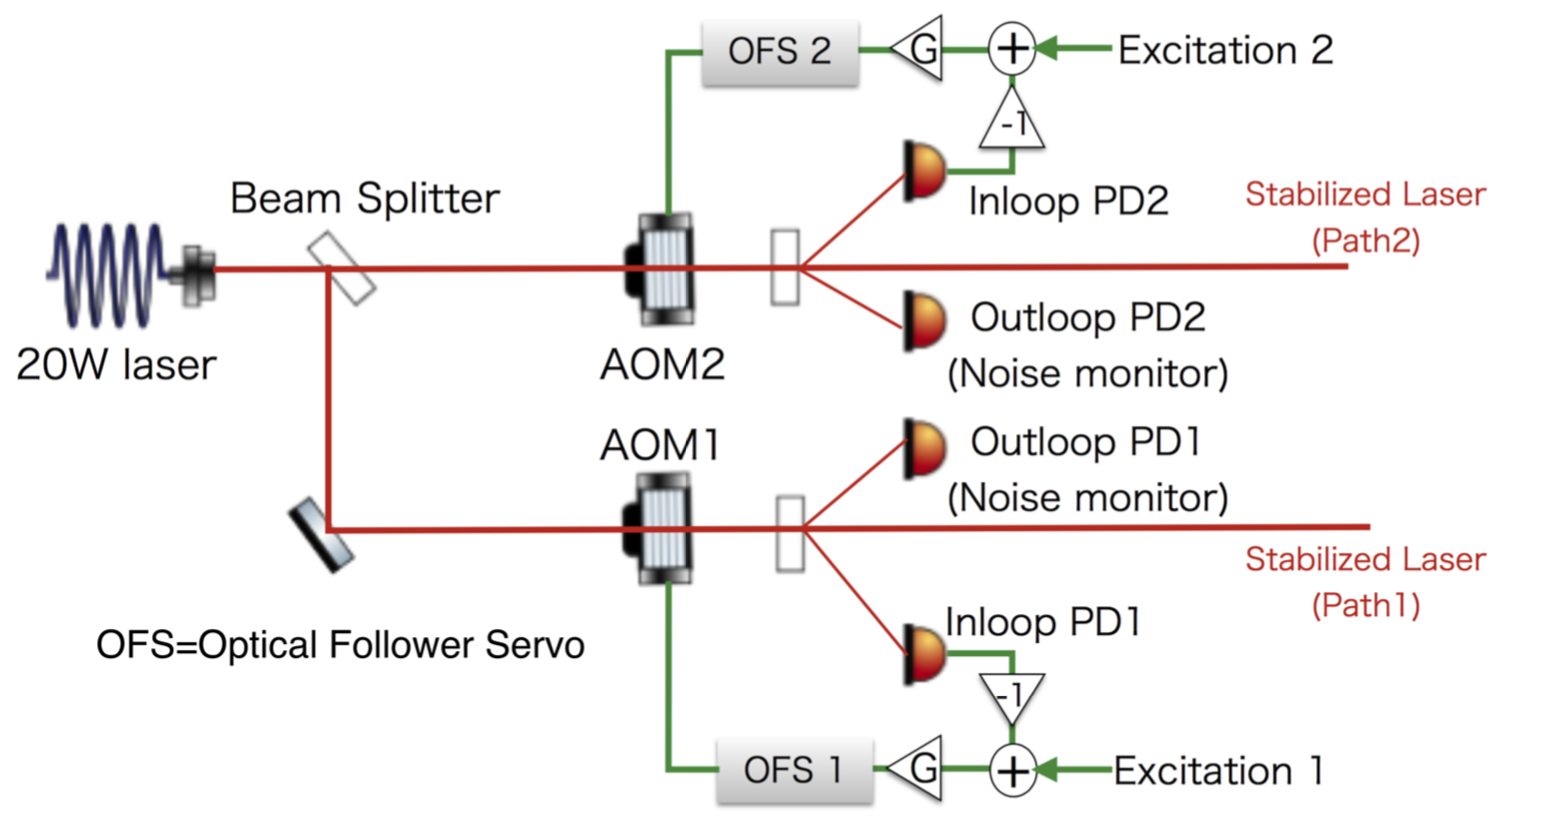
The KAGRA photon calibrator was placed at the X and Y end stations, which were placed 3 km from the beam splitter of the interferometer as shown in Fig. 2. We used the X-end system for calibration of interferometer and the Y-end system for hardware injection during observation [19]. The systems were installed 34.957 m from the end test mass (ETM) as shown in Fig. 2. We injected two laser beams, dubbed Path-1 and Path-2, into the ETM. Figure 2 shows the layout of the KAGRA photon calibrator. The photon calibrator consisted of a transmitter module (Tx module), a receiver module (Rx module), a periscope, and a telephoto camera module (TCam module). They provide intensity modulated laser beam, monitor the intensity, change the height of optical axis and observe beam spot position on mirror surface, respectively. We employed a CW fiber laser whose maximum power and wavelength were 20 W and 1047 nm, respectively. To avoid the coupling of main laser, we selected 1047nm laser for Pcal. To stabilize and modulate the laser’s power, we also installed an optical follower servo (OFS) in the Tx module. We split the beams in the Tx module to minimize the elastic deformation caused by pushing the ETM as shown in Fig. 3. Each beam position was measured with a telephoto camera (TCam). The specification summary of the KAGRA photon calibrator is shown in Table I.
| Mirror material | Sapphire |
|---|---|
| Mirror mass | 22.95 0.01 kg |
| Mirror diameter | 220 mm |
| Mirror thickness | 150 mm |
| Distance from Pcal to test mass | 34.957 0.01 m |
| Maximum laser power | 20 W |
| Pcal laser wavelength | 1047 nm |
| Incident angle | 0.839 0.023 deg |
| Beam waist of input laser | 265.57 0.04 [um] |
| Beam position (Top) | (0 mm, 76 mm) |
| Beam position (bottom) | (0 mm, 76 mm) |
2.1 Transmitter module
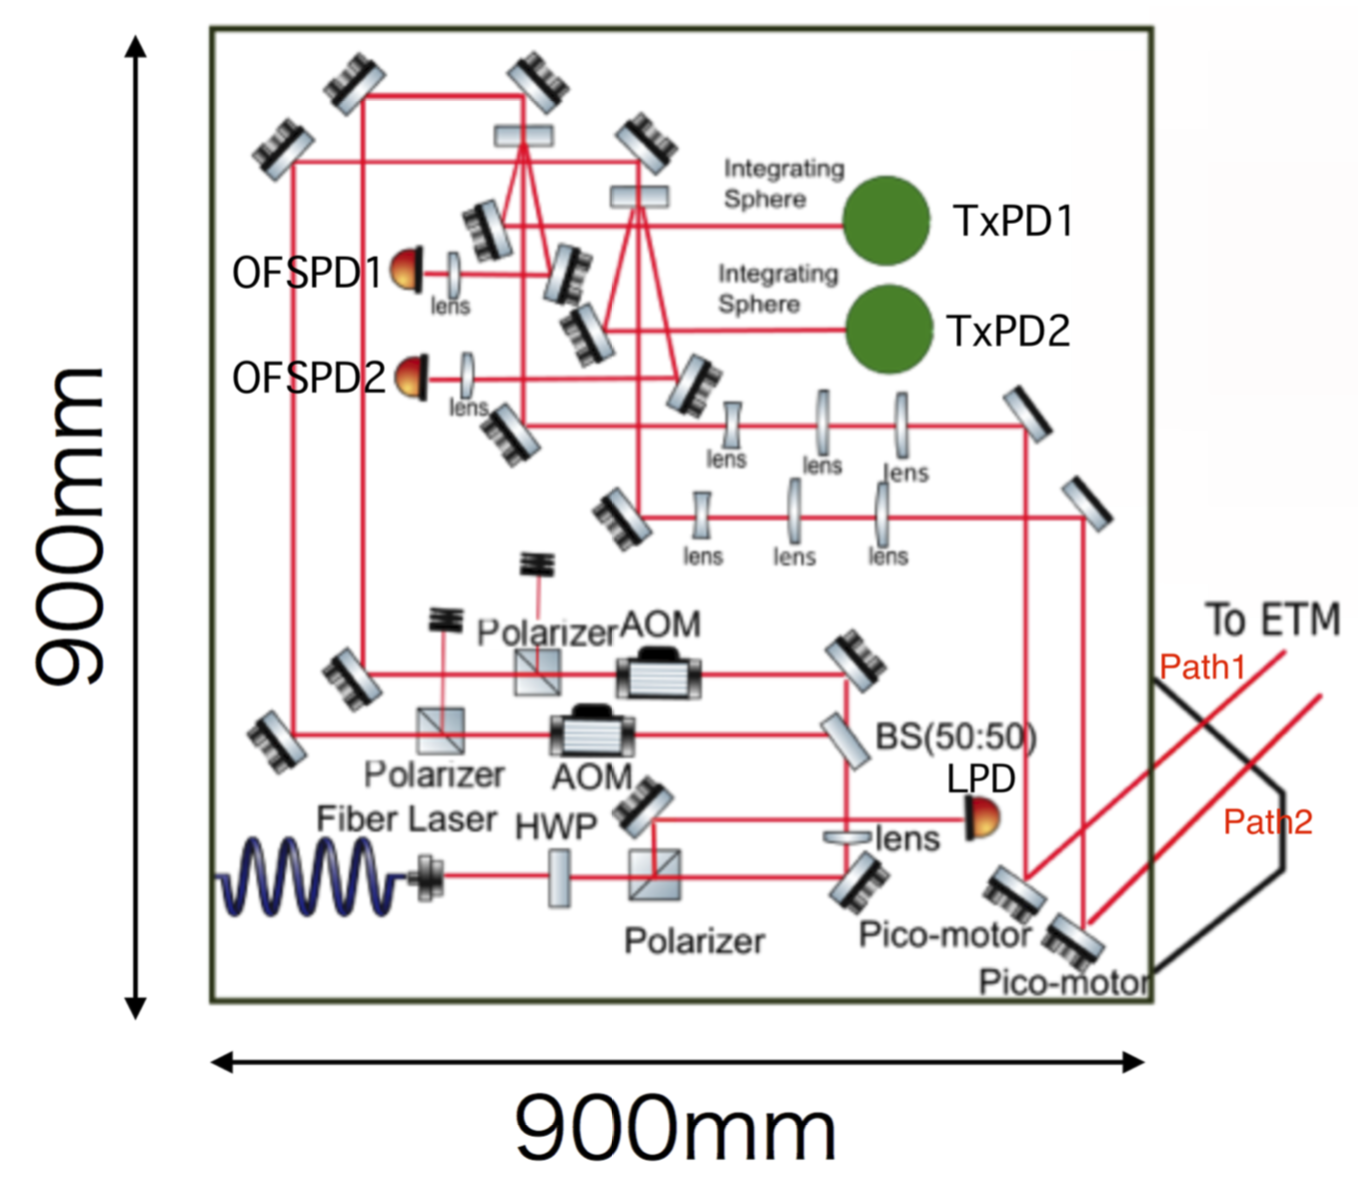
The transmitter module was used as an input optical system to modulate and stabilize the laser power. The optical components of the transmitter module were mounted on a 900 mm 900 mm optical table as shown in Fig. 3. To isolate the fluctuation of the atmosphere, we covered the system with aluminum plates around the optical system. The plates were coated with Tobika black to absorb the scattered light. We mounted a 20 W Yb CW laser manufactured by Keopsys, whose typical beam waist and beam quality factor are 265.6 0.04 m and 1.06 0.01. The model number of the laser is CYFL-TERA-20-LP-1047-AM1-RGO-OM1-T305-C1. We split the laser beams using a beam splitter and then modulated each laser beam with ISOMET Acousto-Optic modulators (AOM). The part number of the AOM is M1080-T80L-M. Using the AOM, we were able to control the laser power from 0 W to 10 W for each path. We adjusted the offset at half of the maximum response of AOM. The powers of beams were monitored using photodiodes. We employed InGaAs PIN photodiode with a diameter of 3.0 mm, made by Excelitas with part number C30665GH. We mounted five photodiodes with a trans-impedance amplifier unit in the transmitter module, referred to as OFSPD1, OFSPD2, TxPD1, TxPD2, and LPD, as shown in Fig. 3. OFSPD1 and OFSPD2 were used to obtain the feedback signal connected to the AOM for stabilizing the laser power. We attenuated the laser powers sensed by OFSPD1 and OFSPD2 to be 1 mW. The absolute shot noise of the sensor can be described as , where is detection power, is the responsivity of the photodiode, and is the elementary electric charge. The detected signals at OFSPD1 and OFSPD2 were sent to the optical follower servo. LPD is a photo detector for monitoring laser noise as out-of-loop. TxPD1 and TxPD2 were used to monitor absolute power, and their responses were calibrated by NIST standard laser. The beams were collimated by three lenses to reduce the spherical aberration. The beam radius on the ETM were 3.5 mm. We installed pico-motors to control the beam position on the mirror from the remote site.
2.2 Periscope
In order to control the beam position on the mirror surface, we installed the periscope into the vacuum chamber. We mounted a 100 mm fused silica view window on the vacuum chamber. Details of the periscope is as follows. The structure to put the mirrors and baffle to kill scattered light were mounted on the optical table. The 12 mirrors, whose diameters were 3 inches, were mounted in the chamber. The reflectance of each mirror at 1047 nm is 99.95 %. The mirrors were manufactured by the Opto-Sigma company. We set the incident angle of the beam at 0.839 degrees and also mounted the periscope for the telephoto camera on the structure.
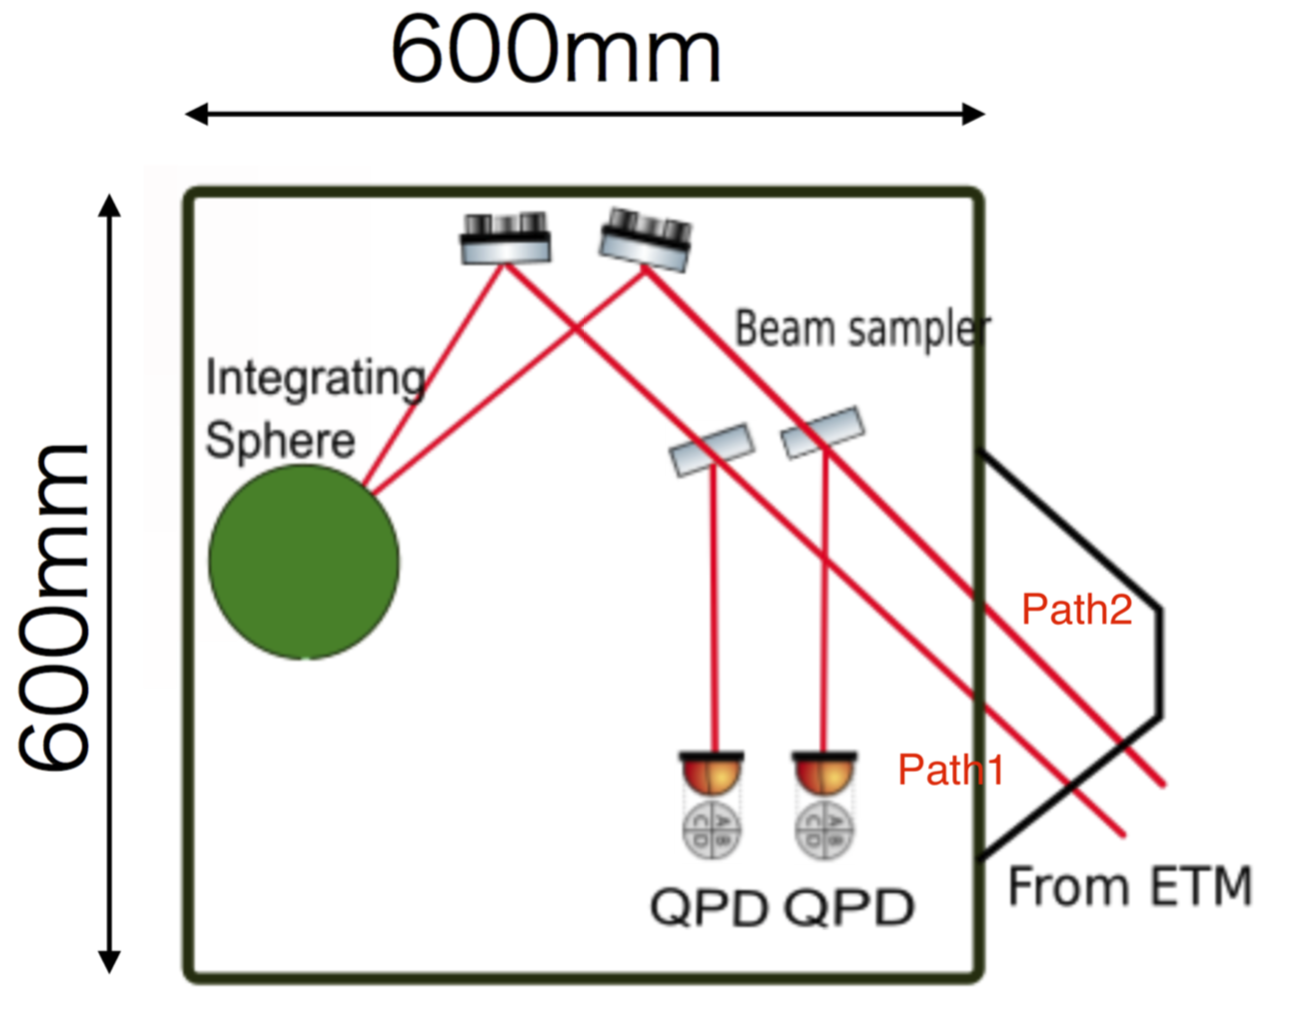
2.3 Receiver module
The purpose of the receiver module was to monitor the reflected absolute power and beam position, as shown in Fig. 4. The optical components of the receiver module were mounted on the 600 mm 600 mm optical table. The 6 inch integrating sphere was mounted with the photodetector, which had the same design as TxPD. The method for absolute power calibration is described in Section IV. We mounted a beam sampler and quadrant photodetectors (QPDs) (Thorlabs PDQ80A) to monitor the drift of beam positions. We applied the QPDs as a tilt sensing optical lever. The sensitivity was 10 nrad for each. With the pico-motors on the transmitter module and this QPD, we were able to control and monitor the beam positions.
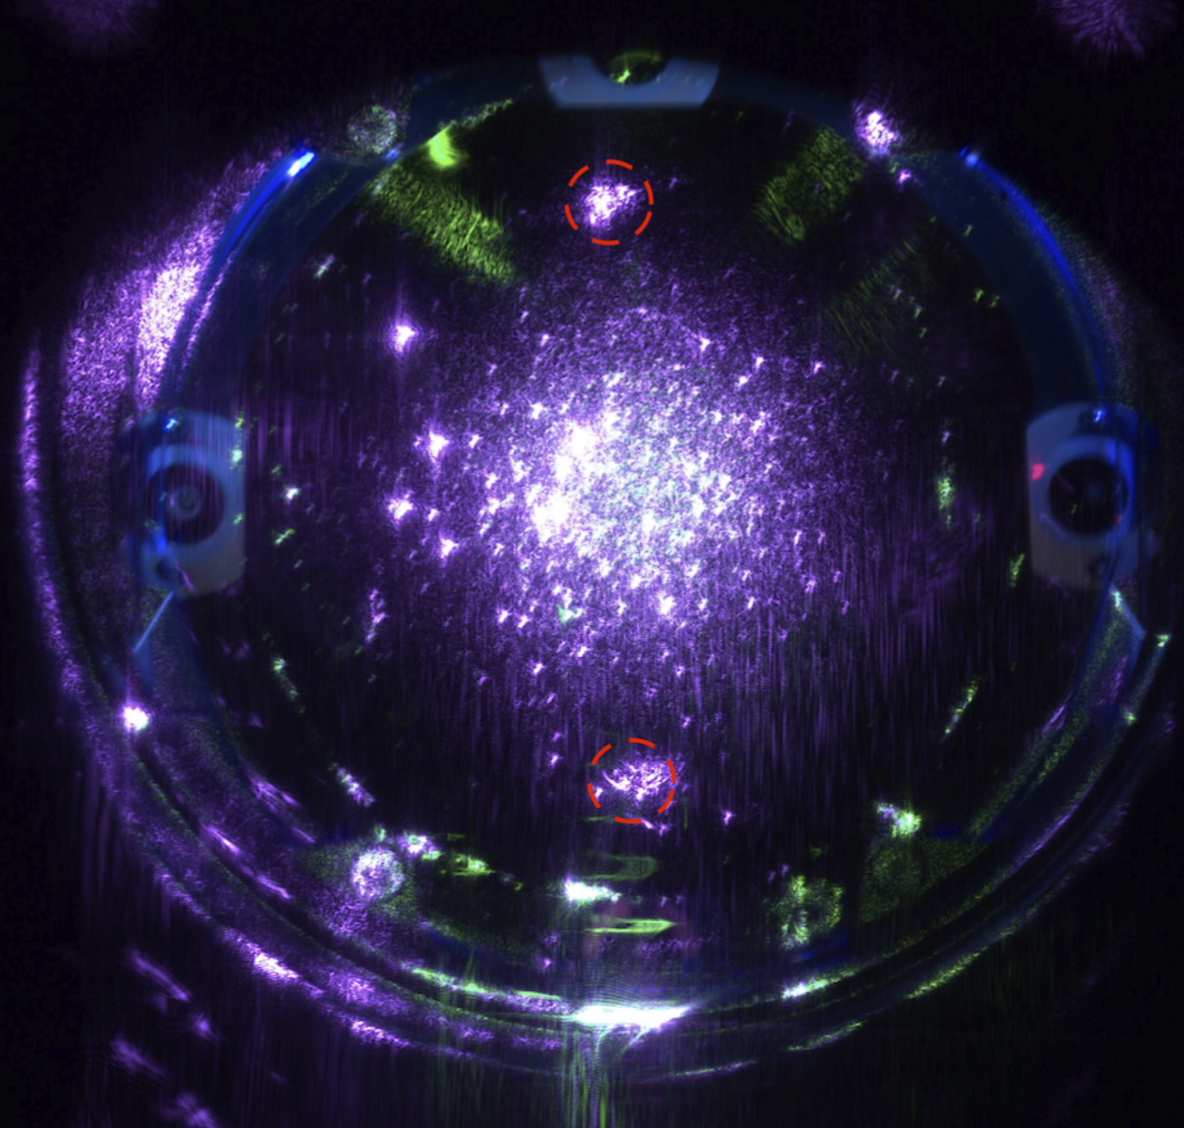
2.4 Telephoto camera
We measured the beam position using pictures. Figure 6 shows the injected beam for the ETMX. We injected the laser 76 mm above and below the center position. The positions of the laser induced rotation and elastic deformation effects, so to cancel these effects, we needed to inject two laser beams. The drift of the beam position on the ETM surface corresponded to the systematic error of the rotation and elastic deformation. To measure beam position, we monitored the mirror surface with a camera placed 34.957 m from the ETM. Thus, we employed a combination of telescope and high-resolution camera, a so-called telephoto camera (TCam). We tuned the focal point on the mirror surface using a Moonlight focuser. By using the high-resolution camera, we could measure the beam position within 1 mm accuracy. A Nikon D810 digital camera met our requirements. The D810 has a 36-megapixel resolution with 35.9 24.0 mm CMOS sensor. One pixel on the picture corresponds to 100 m. We removed the IR filter because the commercial camera is not sensitive to laser wavelength (1047 nm). We employed a Maksutov-Cassegrain type telescope to observe the ETM surface. The diameter of the primary mirror was 127 mm, and its focal length and focal ratio were 1500 mm and , respectively. We mounted an LED illuminator on the cryogenic stage near the ETM, which was controlled by the remote system. We can monitor the mirror surface at 36m far from ETM very clearly with the combination of LED and telescope. By potting far place, we can minimize the scattering effect by small solid angle form ETM.
3 Measurement
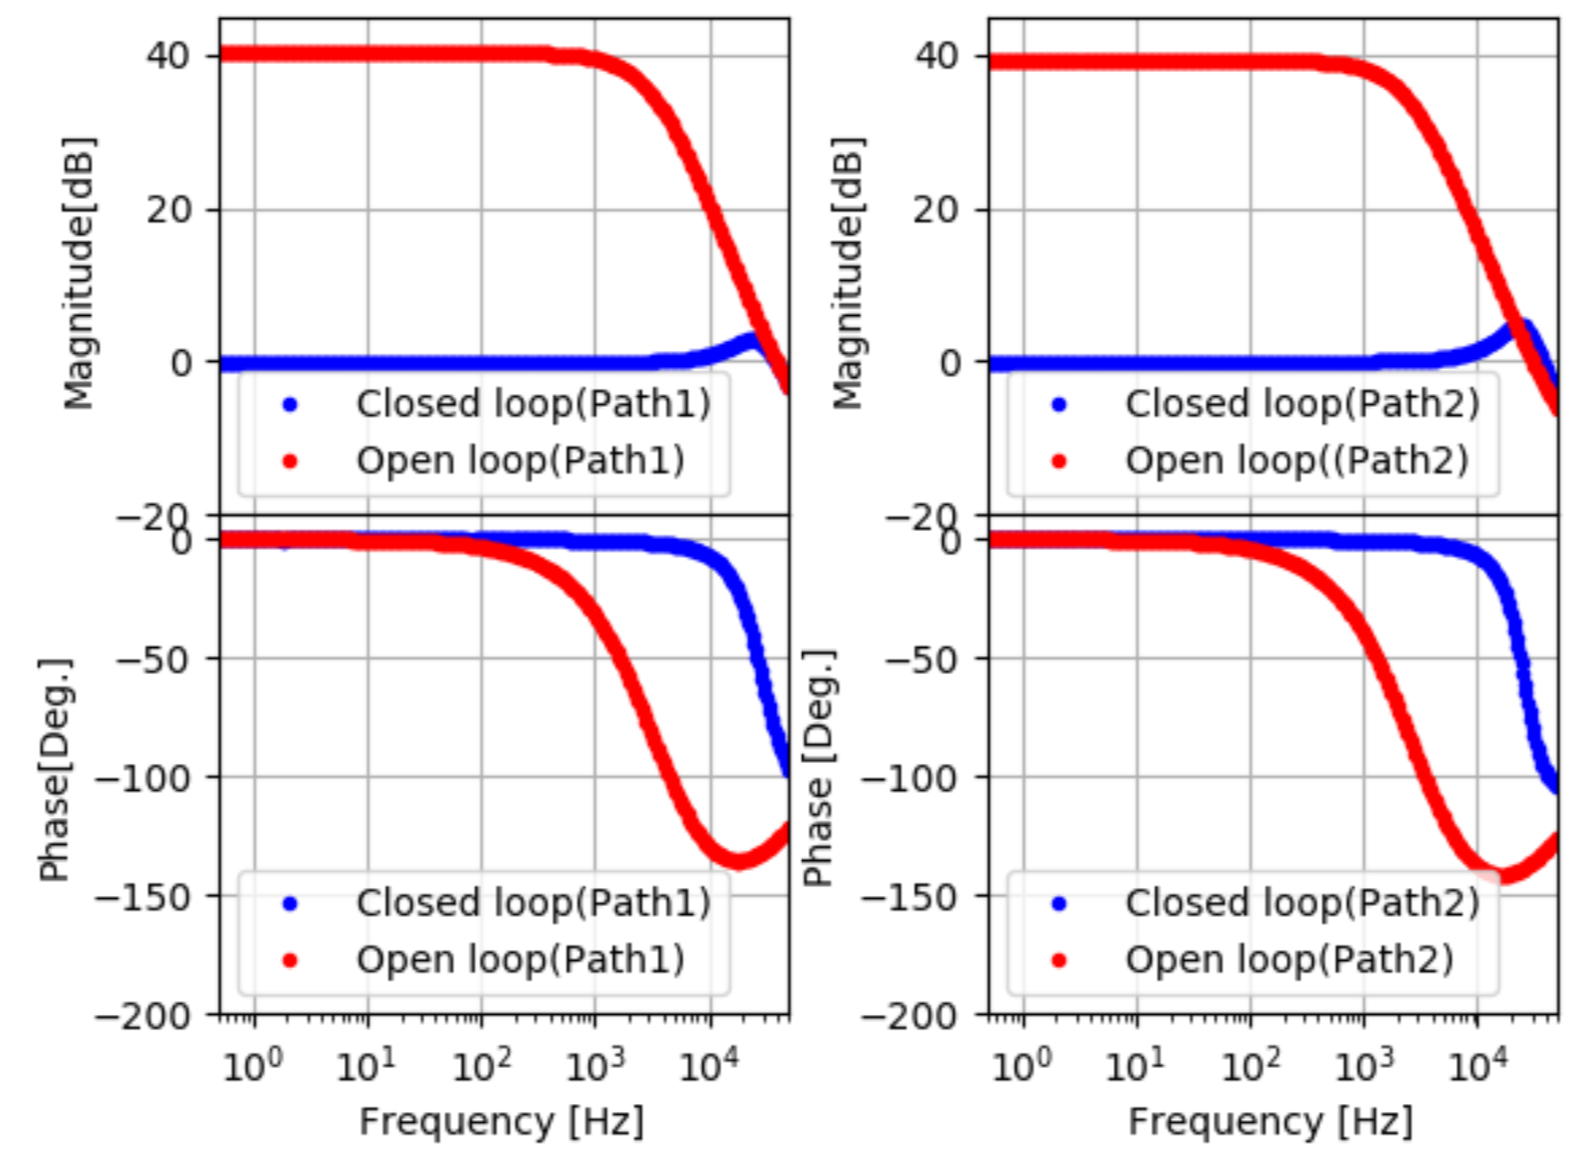
The noise of the Pcal laser was propagated directly to the displacement noise through the suspension response. The typical relative power noise of the laser was 120 dB/ for each path. This noise fluctuate mirror position more largely than KAGRA goal sensitivity. To reduce the laser noise, we needed to stabilize the laser power with the servo filters, referred to as the optical follower servo. Figure 5 shows the transfer function of the optical follower servo, which was set up to have two poles at 3 kHz and one at 30 kHz. The closed loop transfer function is defined as , where is open loop transfer function. The measured unity gain frequencies are set to 40 kHz with a 50 degree phase margin. The diagram of the feedback loop is shown in Fig 6. We separated the beams into two paths to independently stabilize them. The detected signal at the OFSPD was sent to the servo filter. To maximize the performance of the feedback loop, we had to characterize the relative power noise (RPN) and harmonic noise (HN). In the following subsections, we explain the measured noise sources based on the goal sensitivity of KAGRA, where the target frequency for scientific study was between 30 and 1500 Hz.
3.1 Relative power noise
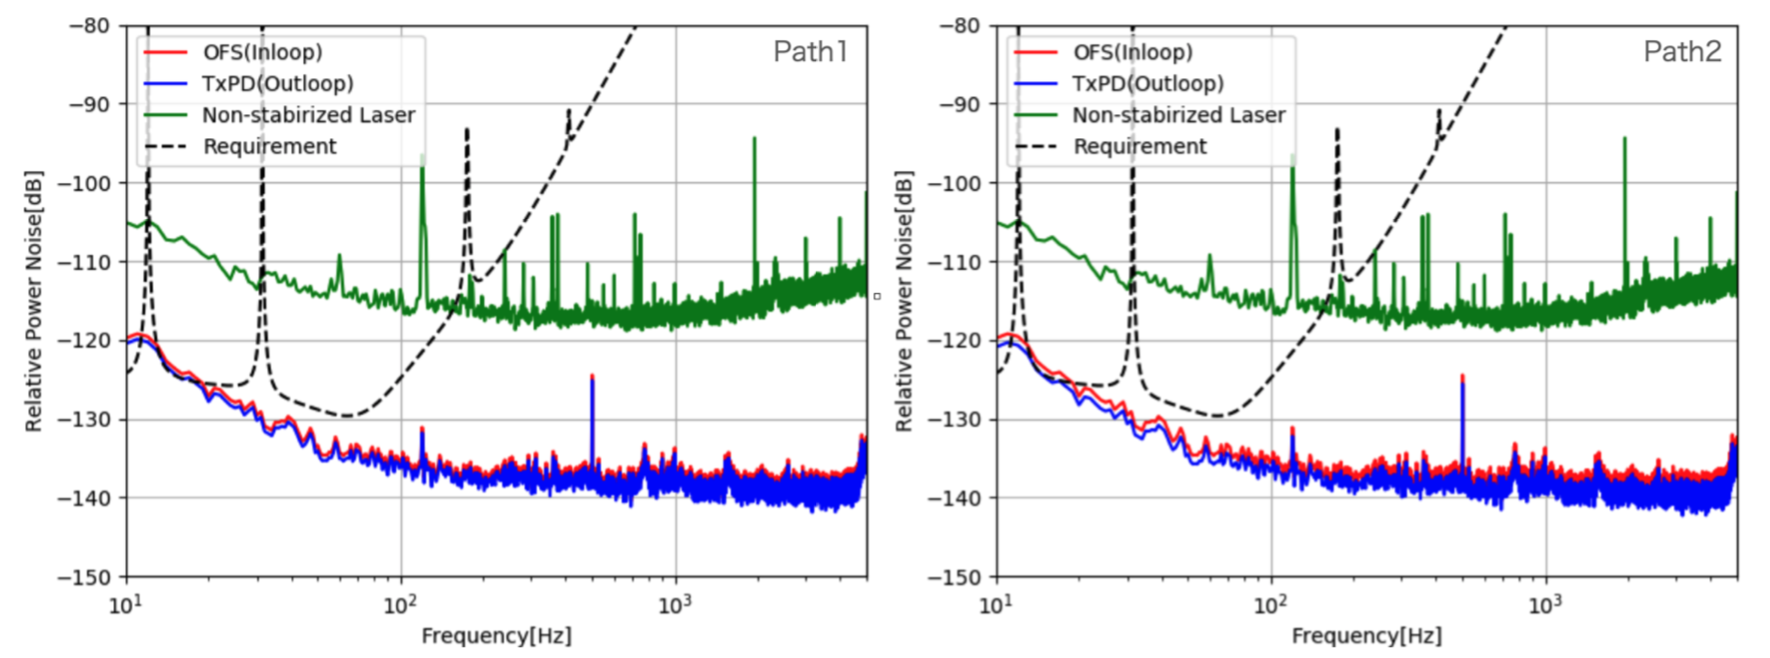
The optical follower servo suppressed the relative power noise of Pcal laser. The amplitude spectral density of each path, , must be suppressed as follow:
| (6) |
where is path 1 and path2, is the target sensitivity of KAGRA in Observation phase 3 (O3), is safety margin, and 3000 m is the arm length of the interferometer. The open-loop transfer function is shown in Fig. 5. Figure 8 shows the measured RPN of path-1 and path-2. The measured noise in out of loop met our requirements. The main noise under 100 Hz corresponds to the relative power noise of laser monitored by LPD. The noise floor above the 100 Hz is limited by the noise of a 16-bit DAC (General Standards Corporation, part number PCIe-16AO16-16-FO-DF). The noise floor at low frequency is limited by the noise of electrical circuit for offset control of AOM.
3.2 Harmonics noise
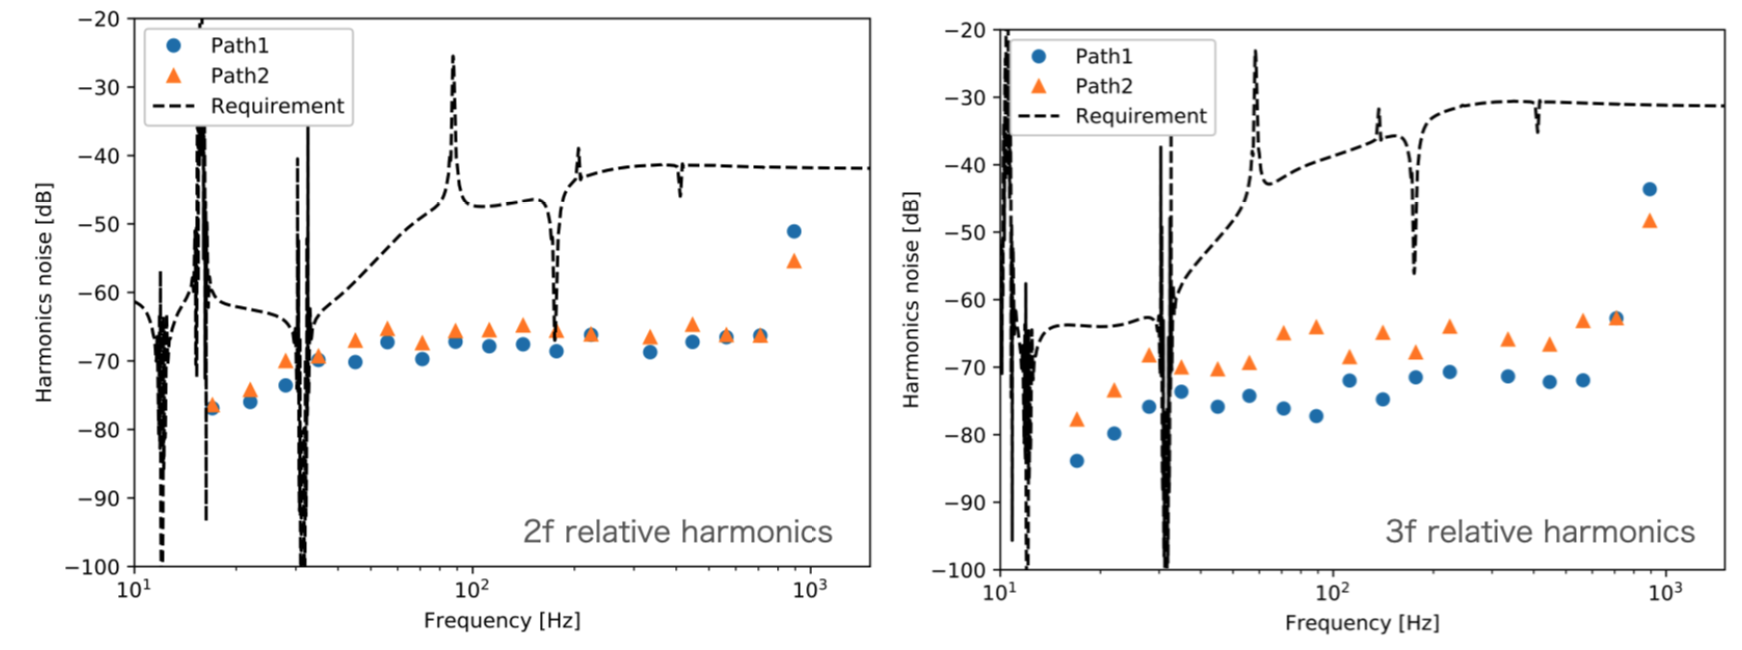
During the observation, we continuously injected sine wave excitation into the calibration line. Nonlinearity of Pcal modulation induce higher harmonics. Their amplitudes are required to be less than 10 % of the displacement sensitivity. However, the amplitude of the displacement by Pcal higher harmonics decreased with the square of the frequency due to the suspension system’s transfer function.Therefore, the requirement for the ratio of amplitude of n-th order harmonics to that of Pcal modulation is required to be less than
| (7) |
We assumed Signal to Noise Ratio (SNR) of injected Pcal modulation at frequency is 100 and safety margin is 10. Their product is 1000.We had to suppress the higher harmonics between 20 and 750 Hz for the signal and those between 30 Hz and 500 Hz for the signal because of observation frequency. By injecting sine curve with optical follower servo, we accumulate the data with 2 hours to suppress the noise floor. Figure 9 shows the measured relative modulation harmonics with the requirement curve. An optical follower servo was required to suppress both the power modulation at the harmonics of the Pcal fundamental frequencies and the inherent laser power fluctuations.
4 Model
The systematic errors of the photon calibrator are caused by the uncertainty of the measurements. According to a previous study [20], we included the efficiency of absolute power calibration, rotation, and elastic deformation in our model, as shown in Eq. 1. To fix the model, we needed to measure the parameter of the absolute laser power and beam position, and we discuss the estimation of these effects in this section.
The photon calibrator can provide us with information about absolute displacement through the absolute measurement of laser power.For calibration. KAGRA Pcal integral spheres at X and Y ends are compared with independent detectors calibrated by NIST laser power standard. [22] To compare the detector response of photon calibrator and the NIST standard, we tried the following four measurements:
-
•
Absolute calibration of laser power standard (Gold Standard which belongs to LIGO) with NIST [22]: [W/V].
-
•
Response ratio measurement at LIGO Hanford Observatory (LHO) between Working Standard KAGRA (4 inches) and Gold Standard (4 inches) : .
-
•
Response ratio measurement at University of Toyama between a 5.3-inch integrating sphere and Working Standard KAGRA (4 inches): .
-
•
Response ratio measurement of Pcal transmitter module and receiver module with a 5.3-inch integrating sphere: .
The excitation signal with the photon calibrator, , is defined to measure the transfer function of differential arm length:
| (8) |
where is a sum of components of displacement vector . is used as PCAL read-back signal. This is because that real time response of displacement from Pcal can be defined by only detector response. By using this value, we can calibrate the interferometer response by each frequency.
Each displacement is function of voltage at each integrating sphere, . In a usual case, we measure the sum of path-1 and path-2 response at RxPD. To determine the ratio of power at RxPD, we defines the separation efficiency, and . To estimate these factors, we measure the power of path1 and path2 independently. Therefore, each term can be defined as and .
| (9) |
where is a coefficient matrix that converts voltage to force, all of which we describe in detail later. is the transfer function matrix from the force to displacement defined as
| (10) |
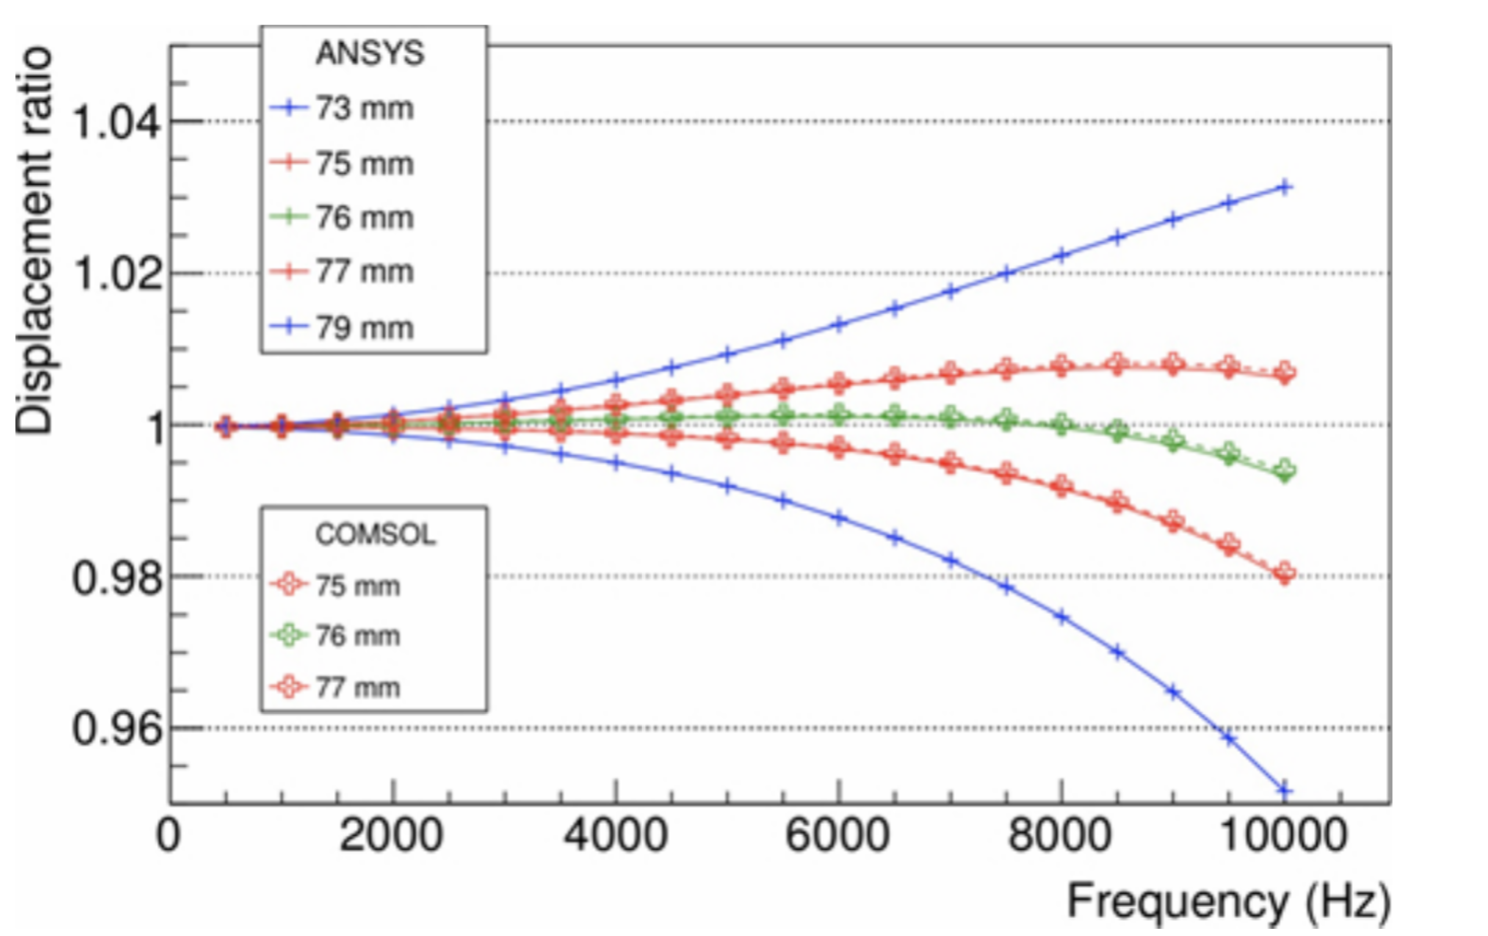
demonstrated that the calibration forces applied by a centered photon calibrator beam produced local elastic deformations that significantly altered the sensed displacement of the interferometer. Even stiff materials like fused silica or sapphire experienced small deformations when photon calibrator forces were applied. We performed modal analysis and simulation of the elastic deformation with the finite element analysis (FEA) software package, ANSYS and COMSOL. The real structure of KAGRA ETM is not a perfect cylinder. It has two flat cuts on both sides with two ears used to hang the mirror [28]. We made a FEA on the realistic KAGRA ETM structure based on CAD drawing. Two laser beams are reflected by mirror and two beam spots are above and under the mirror surface center. When the distance between the spot and center is 76 mm, the elastic deformation effect is the minimum. Figure 10 shows the ratio of displacement of elastic mirror motion to that in the case of rigid body as a function of frequency for optimally positioned beams on the KAGRA test mass, as well as 1 mm and 3 mm offsets from the optimal positions. The results of ANSYS and COMSOL are consistent. In O3GK, the systematic error of and terms are relatively negligible. We assumed in O3GK analysis. However, we need to include these effects in O4 due to the improvement of calibration uncertainty.
is the force coefficient matrix, which is transfer matrix from output voltage of photo detectors (integral spheres) to force by photons. The unit of components of force coefficient matrix is [N/V]. Each force coefficient can be written as
| (11) |
where is the incident angle of the photon calibrator as listed in Table 1, and is the speed of light. The incident angle is determined from CAD drawings, and the variance of is estimated by the accuracy of the vacuum chamber. The 1-sigma uncertainty is 0.839 0.023 degree. is a conversion matrix from photodetectors (integral spheres) output to power of incident Pcal power,
| (12) |
where is the diagonal detector matrix, and each diagonal element corresponds to the calibrated detector response with the 5.3 inch integrating sphere. In the terms of , are dimensionless.Thus, the dimension of is [W/V]. When we included optical cross talk in the diagonal detector matrix, the off-diagonal part in the efficiency matrix ought to have been obtained. In O3GK observation, the crosstalk of each detector was negligible. Thus, we assume .
The Gold Standard (GS) is a power sensor system comprised of a 4 inch integrating sphere and an InGaAs photodetector. NIST provides a summary of measurement of GS response to a 1047 nm laser. The estimated value is 8.0985 0.0259 [W/V] [22, 25]. The calibration of GS is transferred to a 4 inch integrating sphere with an InGaAs detector called Working Standard KAGRA (WSK). The cross-calibration setup between WSK and GS is placed in LHO. The estimated value is . The measured response ratio with University of Toyama system was . is the efficiency matrix describing the loss of path 1 and path 2 for the transmitter module side and receiver module side. The measured efficiencies of efficiency matrix are described as:
| (13) | |||
| (14) | |||
| (15) | |||
| (16) |
5 Discussion and conclusion
The development of new photon calibrator is expected to extend for the possibility of new technologies. In previous study, the laser power of photon calibrator in LIGO and Virgo are 2W and 3W, respectively. In this development, we achieve to increase the maximum power to be 20W. LIGO and Virgo have used photon calibrator for measurement of response function, monitoring of time dependent interferometer response, and hardware injection test. For the application of response function measurement, high power laser can measure the response of low frequency and high frequency region with enough SNR. It can be reduced the uncertainty of these region. For monitoring of time dependent interferometer response, LIGO and Virgo injected the sine curves during measurement. By monitoring of these amplitude, we can know the time dependent interferometer response. But, number of these line are limited by the maximum laser power of Pcal. By applying KAGRA Pcal, we can improve the maximum number of monitoring signal. For hardware injection, one of the application is verification of analysis pipeline. They inject the simulated signal and confirm the parameters of it.
A detailed understanding of waveform accuracy and gravitational wave detector responses is necessary for understanding physics of gravitational wave itself an astronomical and cosmological objects. The photon calibrator method is a modern way to obtain accurate calibration. To increase accuracy, KAGRA has employed new techniques: (i) 20 W CW laser to improve the signal-to-noise ratio of high-frequency responses; (ii) Independent control of upper beam and lower beam to verify the response of rotation response; and (iii) Beam position monitoring and controlling system with QPDs and pico-motors. These techniques gave us a better understanding of the accurate model. In this paper, we characterized the relative power noise and harmonic noises, and the measured results met our requirements for worldwide observation 3. In our observation, KAGRA exchanged the laser power standard detector with LIGO and VIRGO, which enabled us to calibrate the relative amplitude of each interferometer.
The accuracy of beam positions are not the dominant systematic error in current observation. However, we need to apply the cryogenic study. This is because that during the cooling process, position of the end test mass are moving due to the thermal expansion effect of suspension. The expected displacement of thermal expansion is about 5mm. To reduce the elastic deformation effect, we need to change the beam position in the cooling process. It will be demonstrated in future experiment.
Acknowledgements.
We would like to express our gratitude to Richard Savage, Evan Goetz, Jeff Kissel, and Peter King in LIGO for supporting us in developing a design for the KAGRA photon calibrator. We also would like to express Ayako Node, Ayako Ueda, Iwao Murakami, and Hirokazu Murakami to support this study. This work was supported by MEXT, JSPS Leading-edge Research Infrastructure Program, JSPS Grant-in-Aid for Specially Promoted Research 26000005, JSPS Grant-in-Aid for Scientific Research in Innovative Areas 2905: JP17H06358, JP17H06361, and JP17H06364, JSPS Core-to-Core Program A. Advanced Research Networks, JSPS Grant-in-Aid for Scientific Research (S) 17H06133, the Mitsubishi Foundation, the joint research program of the Institute for Cosmic Ray Research, University of Tokyo, National Research Foundation (NRF) and Computing Infrastructure Project of KISTI-GSDC in Korea, Academia Sinica (AS), AS Grid Center (ASGC), and the Ministry of Science and Technology (MoST) in Taiwan under the following grants: AS-CDA-105-M06, 110-2636-M-008-001, 110-2123-M-007-002, the KAGRA collaboration, the LIGO project, and the Virgo project.References
- [1] Abbott, B. P. et al., “Observation of gravitational waves from a binary black hole merger,” Phys. Rev. Lett. 116, 061102 (Feb 2016).
- [2] Aasi, J. et al., “Advanced LIGO,” Classical and Quantum Gravity 32(7), 074001 (2015).
- [3] Acernese, F. et al., “Advanced Virgo: a second-generation interferometric gravitational wave detector,” Classical and Quantum Gravity 32(2), 024001 (2015).
- [4] Somiya, K., “Detector configuration of KAGRA–the Japanese cryogenic gravitational-wave detector,” Classical and Quantum Gravity 29(12), 124007 (2012).
- [5] Aso, Y., Michimura, Y., Somiya, K., Ando, M., Miyakawa, O., Sekiguchi, T., Tatsumi, D., and Yamamoto, H., “Interferometer design of the KAGRA gravitational wave detector,” Phys. Rev. D 88, 043007 (Aug 2013).
- [6] Akutsu, T. et al., “Overview of KAGRA: Detector design and construction history,” Progress of Theoretical and Experimental Physics 2021 (08 2020). 05A101.
- [7] Michimura, Y. et al., “Mirror actuation design for the interferometer control of the KAGRA gravitational wave telescope,” Classical and Quantum Gravity 34(22), 225001 (2017).
- [8] Akutsu, T. et al., “Overview of KAGRA: Calibration, detector characterization, physical environmental monitors, and the geophysics interferometer,” Progress of Theoretical and Experimental Physics 2021 (02 2021). 05A102.
- [9] Sun, L. et al., “Characterization of systematic error in advanced LIGO calibration,” Classical and Quantum Gravity 37, 225008 (oct 2020).
- [10] Abbott, B. P. et al., “A gravitational-wave standard siren measurement of the Hubble constant,” Nature 551(7678), 85–88 (2017).
- [11] Schutz, B. F., “Determining the Hubble constant from gravitational wave observations,” Nature 323, 310–311 (Sep 1986).
- [12] Feeney, S. M. et al., “Prospects for resolving the Hubble constant tension with standard sirens,” (2018).
- [13] Abbott, B. P. et al., “Prospects for observing and localizing gravitational-wave transients with Advanced LIGO and Advanced Virgo,” Living Reviews in Relativity 19, 1 (Feb 2016).
- [14] Estevez, D. et al., “First tests of a newtonian calibrator on an interferometric gravitational wave detector,” Classical and Quantum Gravity 35, 235009 (nov 2018).
- [15] Akutsu, T. et al., “Overview of KAGRA: KAGRA science,” Progress of Theoretical and Experimental Physics 2021 (08 2020). 05A103.
- [16] Akutsu, T. et al., “Construction of KAGRA: an underground gravitational-wave observatory,” Progress of Theoretical and Experimental Physics 2018 (01 2018). 013F01.
- [17] Hsieh, B.-H., Development and characterization of KAGRA Photon Calibrator for the Accurate Calibration of Gravitational Wave Signals, Master’s thesis, The University of Tokyo (2018).
- [18] Chu, Y.-K., Development of KAGRA Photon Calibrator for Hardware Injection Test, Master’s thesis, National Taiwan Normal University (2018).
- [19] Biwer, C. et al., “Validating gravitational-wave detections: The advanced ligo hardware injection system,” Phys. Rev. D 95, 062002 (Mar 2017).
- [20] Karki, S. et al., “The Advanced LIGO photon calibrators,” Review of Scientific Instruments 87(11), 114503 (2016).
- [21] Goetz, E. et al., “Accurate calibration of test mass displacement in the ligo interferometers,” Classical and Quantum Gravity 27(8), 084024 (2010).
- [22] Goetz, E. et al., “Precise calibration of LIGO test mass actuators using photon radiation pressure,” Classical and Quantum Gravity 26(24), 245011 (2009).
- [23] Hild, S., Brinkmann, M., Danzmann, K., Grote, H., Hewitson, M., Hough, J., Luck, H., Martin, I., Mossavi, K., and Rainer, N., “Photon-pressure-induced test mass deformation in gravitational-wave detectors,” Classical and Quantum Gravity 24(22), 5681 (2007).
- [24] Kuck, S., “Responsively of detectors for radiant power of lasers, final report, edited by Stefan Kuck,” EUROMET Comparison Project 156, EUROMET.PR–S2 (2009).
- [25] Bhattacharjee, D., Lecoeuche, Y., Karki, S., Betzwieser, J., Bossilkov, V., Kandhasamy, S., Payne, E., and Savage, R. L., “Fiducial displacements with improved accuracy for the global network of gravitational wave detectors,” Classical and Quantum Gravity 38, 015009 (dec 2020).
- [26] Inoue, Y., Haino, S., Kanda, N., Ogawa, Y., Suzuki, T., Tomaru, T., Yamamoto, T., and Yokozawa, T., “Improving the absolute accuracy of the gravitational wave detectors by combining the photon pressure and gravity field calibrators,” Phys. Rev. D 98(2), 022005 (2018).
- [27] Estevez, D., Mours, B., and Pradier, T., “Newtonian calibrator tests during the virgo o3 data taking,” Classical and Quantum Gravity 38, 075012 (mar 2021).
- [28] Ushiba, T., Akutsu, T., Araki, S., Bajpai, R., Chen, D., Craig, K., Enomoto, Y., Hagiwara, A., Haino, S., Inoue, Y., Izumi, K., Kimura, N., Kumar, R., Michimura, Y., Miyoki, S., Murakami, I., Namai, Y., Nakano, M., Ohashi, M., Okutomi, K., Shishido, T., Shoda, A., Somiya, K., Suzuki, T., Takada, S., Takahashi, M., Takahashi, R., Terashima, S., Tomaru, T., Travasso, F., Ueda, A., Vocca, H., Yamada, T., Yamamoto, K., and Zeidler, S., “Cryogenic suspension design for a kilometer-scale gravitational-wave detector,” Classical and Quantum Gravity 38, 085013 (mar 2021).