A2S-NAS: ASYMMETRIC SPECTRAL-SPATIAL NEURAL ARCHITECTURE SEARCH FOR HYPERSPECTRAL IMAGE CLASSIFICATION
Abstract
Existing deep learning-based hyperspectral image (HSI) classification works still suffer from the limitation of the fixed-sized receptive field, leading to difficulties in distinctive spectral-spatial features for ground objects with various sizes and arbitrary shapes. Meanwhile, plenty of previous works ignore asymmetric spectral-spatial dimensions in HSI. To address the above issues, we propose a multi-stage search architecture in order to overcome asymmetric spectral-spatial dimensions and capture significant features. First, the asymmetric pooling on the spectral-spatial dimension maximally retains the essential features of HSI. Then, the 3D convolution with a selectable range of receptive fields overcomes the constraints of fixed-sized convolution kernels. Finally, we extend these two searchable operations to different layers of each stage to build the final architecture. Extensive experiments are conducted on two challenging HSI benchmarks including Indian Pines and Houston University, and results demonstrate the effectiveness of the proposed method with superior performance compared with the related works.
Index Terms— Hyperspectral image classification, neural architecture search, asymmetric spectral-spatial
1 Introduction
Hyperspectral image classification is an advanced task within the field of remote sensing, which categorizes each pixel into predefined classes by analyzing its spectral and spatial characteristics. This valuable mission is the basis for practical applications such as vegetation research, fine agriculture, ocean exploration, and defense and security [1, 2]. HSI data has the characteristic of spectral-spatial integration, consisting of hundreds of continuous narrow spectral channels, which preserve a large amount of spectral information. However, the high-dimensional spectral data also poses a great challenge to the HSI classification task - the classification accuracy increases first as the dimensions of the input data increase. After reaching a certain extreme value, decreases as the dimensions of the input data increase, which is also known as the Hughes phenomena [3].
To solve this issue, several traditional feature extraction methods based on principal component analysis (PCA) [4], independent component analysis (ICA) [5], and linear discriminant analysis (LDA) [6] are proposed. Additionally, support vector machines (SVM) [7, 8] are also a popular way to handle HSI classification. With the continuous development of deep learning, neural network based methods such as convolutional neural networks (CNN) have attracted the interest of HSI researchers due to their superior performance in solving computer vision problems [9, 10]. Compared with the traditional methods, the deep learning-based method can automatically obtain high-level features of the HSI data through the training process without feature engineering for classification feature selection, which enables classification models to represent the features of datasets better and simultaneously improve classification accuracy. Nonetheless, the current deep learning-based HSI classification methods still have some unsolved challenges.
Most existing neural networks are too fixed to handle HSI classification problems. On the one hand, the ground objects in the HSI data with various sizes and arbitrary shapes require variable and flexible receptive fields. Also, asymmetric spectral-spatial dimensions in HSI need to be regarded seriously. On the other hand, the existing HSI datasets have different physical characteristics, such as spatial resolution, spectral range, and the number of bands. Expert-designed neural networks are not well-equipped to handle these differences. Neural architecture search (NAS) is a way to automate the design process of neural network architecture [11], reducing the required effort and expert knowledge compared to designing the architecture artificially for each dataset. The mainstream search strategies of early NAS approaches are evolutionary algorithm [12] based and reinforcement learning [11] based approaches, which usually require hundreds of GPU days or large amount of computational resources to be consumed. Differentiable Architecture Search (DARTS) [13] approach is proposed to relax the search space to a continuous domain so that it can be optimized by gradient descent, effectively reducing the complexity of NAS tasks. In recent years, some NAS-based HSI classification methods have been proposed [14, 15], but the alternative operations of these methods are adapted from classical algorithms and are not specifically designed for HSI data characteristics.
To this end, we propose a novel asymmetric spectral-spatial NAS algorithm (A2S-NAS) for the HSI classification task. First, we propose a novel asymmetric spectral-spatial operator called A2SConv, including an outer search space and an inner search space. Second, a hierarchical spectral-spatial search structure is dominated by the proposed A2SConv. Specifically, outer search space contains searching for the appropriate asymmetric pooling operation and upsampling. The inner search space is responsible for designing the receptive field of the 3D convolution, respectively. Finally, we extend A2SConv to different layers of each stage in the overall network consisting of three stages. The contributions of this paper are summarized as follows:
-
1)
A2S-NAS is proposed considering the asymmetric physical resolution in spectral-spatial dimensions of HSI data. A gradient-based NAS algorithm is used to search the final network in order that different layers are able to perform suitable asymmetric pooling in spectral-spatial dimensions.
-
2)
We further develop a flexible and hierarchical search that is composed of certain A2SConv blocks. The joint outer search space and inner search space of A2SConv allows simultaneous search of asymmetric spectral-spatial feature pooling and feature extraction that contains multiple receptive fields for objects with various shapes and sizes.
-
3)
The proposed A2S-NAS has been verified on two challenging HSI benchmarks including Indian Pines and Houston University through extensive experiments, outperforming the related works with superior performance.
2 Method
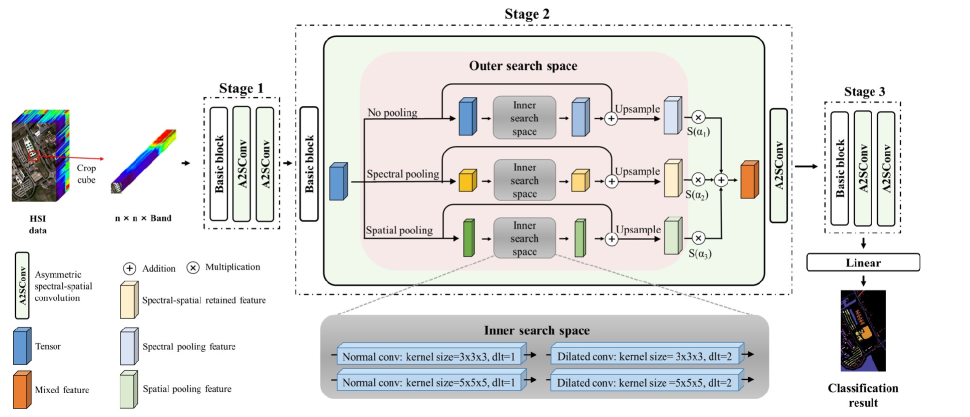
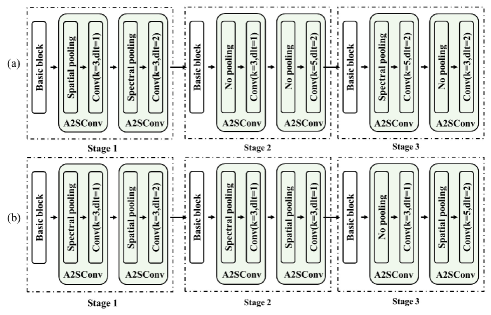
The flowchart of the proposed A2S-NAS is shown in Fig. 1. First, we randomly cut regular-sized (, which is set based on the experimental results) cubes on the HSI dataset and send these cubes into a multi-stage search architecture, which consists of three stages. In detail, Stage 1 contains a Basicblock and two A2SConv blocks. Stage 2 and Stage 3 both contain a Downsample block and two A2SConv blocks where A2SConv is the designed novel space to be searched. Second, A2SConv modules that have an outer search space and an inner search space are used to conduct hierarchical spectral-spatial search. Finally, the feature map produced by the last layer of the search part is fed into a pre-defined classifier composed of a linear layer to obtain the final classification result.
2.1 Asymmetric Spectral-Spatial Convolution
As illustrated in Fig. 1, the outer search space of A2SConv (pink zone in Fig. 1) searches for an asymmetric pooling operation. The inner search space of A2SConv (gray zone in Fig. 1) searches for a proper receptive field of 3D convolution for the final HSI classification network.
Outer Search Settings.
The outer search space includes asymmetric pooling and upsampling operation, aiming to reduce the high computational cost of processing high-dimensional HSI images while ensuring no loss of spectral and spatial features. In this work, we provide three different operations: no pooling, spectral pooling utilizing average pooling with stride (2,1,1), and spatial pooling utilizing average pooling with stride (1,2,2), respectively. In contrast to traditional methods, we are searching for the corresponding pooling method (i.e., pooling dimension) for each layer of the network, rather than simply pooling on a fixed dimension or the whole dimension, which is proved to play an important role in HSI classification network.
Inner Search Settings.
The physical characteristics of the HSI dataset introduced above inspire us that networks with multi-receptive fields can extract features of ground objects with various sizes and shapes. To this end, the proposed inner search space consists of 3D convolutions with multi-receptive fields. In this work, we provide four different operations depending on the kernel size and dilatation rate, including 3D convolution with kernel size 3 or 5 and dilatation rate, which are chosen from 1 and 2, equal to normal convolution and dilated convolution.
2.2 Multi-Stage Search Strategy
In contrast to the gradient-based 3D-ANAS [16], the basic block of our search space is the proposed A2SConv itself, rather than a directed acyclic cell. In addition, we adopt a gradient-based search strategy with Beta-Decay regularization loss, which is an improving DARTS-based method without extra changes or cost [17]. The A2SConv block for searching contains all candidate operations mentioned above, each of which has a corresponding learnable parameter . When placing all layers of the three stages together, the output of the i-th A2SConv block to be searched is defined as
| (1) | |||
where is the input of the i-th A2SConv block, is the candidate operation set, denotes the softmax activation of the corresponding learnable parameter and is the mixed output of the i-th A2SConv block.
Note that architecture parameters between different layers are not shared in our search strategy. Therefore, the task of differentiable architecture search is to learn a set of architecture parameters for each A2SConv block that makes the search process achieve optimal performance. During the search process, the architecture parameters can be optimized by the gradient descent algorithm. After the search, a compact network is obtained by keeping only the operators corresponding to the largest activated parameter in each block. In this way, neural architecture search has evolved into the optimization process of a set of continuous variables.
The architecture parameters and network weights are jointly optimized following bi-level optimization objective on the training and validation sets according to Eq. (2),
| (2) | ||||
where denotes the weight of beta decay regularization loss proposed in [17]. Based on the performance of the validation set, the optimal network architecture parameters is selected. Then the specific operator corresponding to each block is chosen according to the optimal parameters.
3 Experiment
3.1 Experimental Setup
We use two challenging HSI benchmarks to evaluate the proposed A2S-NAS, including Indian Pines (IP) and Houston University (HU) . The IP dataset consists of 16 vegetation classes with pixels and 200 hyperspectral bands. The HU dataset consists of 15 ground object classes with pixels and 144 hyperspectral bands.
For the IP dataset and the HU dataset, we use 610 and 450 randomly selected samples for the architectural search, respectively. The SGD optimizer is used to optimize the network architecture parameters. The Adam optimizer and exponentially decaying learning rate strategy are used for the optimization of the network parameters.
To compare our searched model with other advanced models, we randomly select 50 samples in each category as the training set, 30 as the validation set, and the rest as the test set on the IP dataset. For the HU dataset, we randomly select 30 samples in each category as the training set, 30 as the validation set, and the rest as the test set.
3.2 Experimental Results
We compare the proposed A2S-NAS with the NAS-based approach 3DAutoCNN [14], SSTN [18] and 3D-ANAS [16], which were published recently, as well as CNN based methods, such as 3DCNN [19] and SSRN [20].
The classification results implemented on the IP dataset based on the six models are listed in Table 1. Fig. 2 shows the corresponding visualization results. The best results of each row are highlighted in bold.

(a)
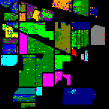
(b)

(c)
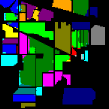
(d)
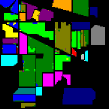
(e)
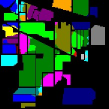
(f)

(g)
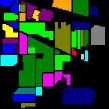
(h)
The classification results implemented on the HU dataset based on the six models are listed in Table 2. The best results of each row are highlighted in bold.
As can be seen in Tables 1 and 2, our proposed method A2S-NAS achieves the best classification results under all three evaluation metrics (OA for Overall Accuracy, AA for Average Accuracy, and Kappa for Kappa coefficient) among the six models on two HSI datasets. In particular, the classification results on class 11 Soybean-mintill and class 12 Soybean-clean of the IP dataset and class 4 Trees and class 9 Road of the HU dataset show a significant improvement of 3.55%, 2.37%, 2.61% and 3.14% , respectively.
| Class | 3DCNN | SSRN | 3D Auto CNN | 3D- ANAS | SSTN | A2S- NAS |
| OA(%) | 71.65 | 94.51 | 94.09 | 95.91 | 92.45 | 97.17 |
| AA(%) | 83.28 | 93.01 | 96.66 | 95.35 | 93.68 | 97.05 |
| Kappa | 67.70 | 93.66 | 93.28 | 95.26 | 91.29 | 96.73 |
| 1 | 97.83 | 100.00 | 97.83 | 89.47 | 97.22 | 94.44 |
| 2 | 50.00 | 84.26 | 89.92 | 90.96 | 80.12 | 92.17 |
| 3 | 53.15 | 97.95 | 95.66 | 93.84 | 95.48 | 98.22 |
| 4 | 89.78 | 100.00 | 100.00 | 100.00 | 100.00 | 97.81 |
| 5 | 91.64 | 97.13 | 97.31 | 98.69 | 90.86 | 94.52 |
| 6 | 93.81 | 99.52 | 98.90 | 99.68 | 93.49 | 98.89 |
| 7 | 92.86 | 68.18 | 100.00 | 99.68 | 100.00 | 100.00 |
| 8 | 96.56 | 100.00 | 100.00 | 91.67 | 100.00 | 100.00 |
| 9 | 85.00 | 81.25 | 100.00 | 100.00 | 93.75 | 87.50 |
| 10 | 70.64 | 97.82 | 91.67 | 81.25 | 89.45 | 94.27 |
| 11 | 62.12 | 93.38 | 90.88 | 94.84 | 94.52 | 98.39 |
| 12 | 66.53 | 92.29 | 86.68 | 94.99 | 89.45 | 97.36 |
| 13 | 100.00 | 100.00 | 100.00 | 96.75 | 100.00 | 100.00 |
| 14 | 89.53 | 98.71 | 98.74 | 100.00 | 98.88 | 100.00 |
| 15 | 93.01 | 98.95 | 98.96 | 99.91 | 99.65 | 99.30 |
| 16 | 100.00 | 78.67 | 100.00 | 98.25 | 76.00 | 100.00 |
| Class | 3DCNN | SSRN | 3D Auto CNN | 3D- ANAS | SSTN | A2S- NAS |
| OA(%) | 81.67 | 90.95 | 84.45 | 87.82 | 89.42 | 92.20 |
| AA(%) | 83.58 | 92.33 | 85.22 | 88.32 | 90.34 | 93.30 |
| Kappa | 80.19 | 90.21 | 83.25 | 86.83 | 88.56 | 91.56 |
| 1 | 95.43 | 91.78 | 87.50 | 87.22 | 87.14 | 96.35 |
| 2 | 95.70 | 95.55 | 77.91 | 87.75 | 89.38 | 94.48 |
| 3 | 97.55 | 96.60 | 92.74 | 84.26 | 98.91 | 96.10 |
| 4 | 96.26 | 94.10 | 72.65 | 81.30 | 92.86 | 98.87 |
| 5 | 98.06 | 98.47 | 96.14 | 97.19 | 99.11 | 95.34 |
| 6 | 92.11 | 98.21 | 84.86 | 88.81 | 90.68 | 97.49 |
| 7 | 70.27 | 95.41 | 73.03 | 80.45 | 84.89 | 89.76 |
| 8 | 70.87 | 77.51 | 76.64 | 79.32 | 84.31 | 68.93 |
| 9 | 68.47 | 84.61 | 71.10 | 75.45 | 77.58 | 87.75 |
| 10 | 58.58 | 62.17 | 96.67 | 95.99 | 96.48 | 92.38 |
| 11 | 78.35 | 96.75 | 92.31 | 95.77 | 99.47 | 96.75 |
| 12 | 72.53 | 99.42 | 91.48 | 89.86 | 73.56 | 88.02 |
| 13 | 68.88 | 94.41 | 85.80 | 94.08 | 83.39 | 95.63 |
| 14 | 95.58 | 100.00 | 90.65 | 99.25 | 99.78 | 100.00 |
| 15 | 94.99 | 100.00 | 88.85 | 95.71 | 97.56 | 99.59 |
3.3 Architecture Analysis
We analyze the search results on two datasets presented in Fig. 4, focusing on finding the effectiveness of hierarchical spectral-spatial search for asymmetric pooling methods in outer search space. First, different layers in the final network are able to perform 3D convolutions with different receptive fields, indicating that our method is flexible in terms of feature extraction. Second, the layers containing asymmetric pooling operations account for 50% and 83.3% of the two models, respectively. We believe that this consideration of asymmetric spectral-spatial feature pooling is promising.
4 Conclusion
Most deep learning-based HSI classification methods are too fixed to cope with the ground objects in the HSI data with various sizes and arbitrary shapes. In this paper, we propose the A2S-NAS for HSI classification, taking a more flexible way of overcoming asymmetric spectral-spatial dimensions and capturing significant features. Specifically, the proposed A2SConv helps to construct a joint outer search space and inner search space, which was experimentally demonstrated to have superior classification ability. We believe this concern for asymmetric pooling operations and multi-receptive fields will have an impact on HSI classification research.
References
- [1] Mustafa Teke, Hüsne Seda Deveci, Onur Haliloğlu, Sevgi Zübeyde Gürbüz, and Ufuk Sakarya, “A short survey of hyperspectral remote sensing applications in agriculture,” in 2013 6th international conference on recent advances in space technologies (RAST). IEEE, 2013, pp. 171–176.
- [2] Yingcheng Lu, Qingjiu Tian, Xinyuan Wang, Guang Zheng, and Xiang Li, “Determining oil slick thickness using hyperspectral remote sensing in the bohai sea of china,” International Journal of Digital Earth, vol. 6, no. 1, pp. 76–93, 2013.
- [3] Gordon Hughes, “On the mean accuracy of statistical pattern recognizers,” IEEE transactions on information theory, vol. 14, no. 1, pp. 55–63, 1968.
- [4] Saurabh Prasad and Lori Mann Bruce, “Limitations of principal components analysis for hyperspectral target recognition,” IEEE Geoscience and Remote Sensing Letters, vol. 5, no. 4, pp. 625–629, 2008.
- [5] Wei Li, Saurabh Prasad, James E Fowler, and Lori Mann Bruce, “Locality-preserving dimensionality reduction and classification for hyperspectral image analysis,” IEEE Transactions on Geoscience and Remote Sensing, vol. 50, no. 4, pp. 1185–1198, 2011.
- [6] Tatyana V Bandos, Lorenzo Bruzzone, and Gustavo Camps-Valls, “Classification of hyperspectral images with regularized linear discriminant analysis,” IEEE Transactions on Geoscience and Remote Sensing, vol. 47, no. 3, pp. 862–873, 2009.
- [7] Gustavo Camps-Valls and Lorenzo Bruzzone, “Kernel-based methods for hyperspectral image classification,” IEEE Transactions on Geoscience and Remote Sensing, vol. 43, no. 6, pp. 1351–1362, 2005.
- [8] Le Sun, Zebin Wu, Jianjun Liu, Liang Xiao, and Zhihui Wei, “Supervised spectral–spatial hyperspectral image classification with weighted markov random fields,” IEEE Transactions on Geoscience and Remote Sensing, vol. 53, no. 3, pp. 1490–1503, 2014.
- [9] Tong Li, Junping Zhang, and Ye Zhang, “Classification of hyperspectral image based on deep belief networks,” in IEEE international conference on image processing (ICIP), 2014, pp. 5132–5136.
- [10] Erting Pan, Yong Ma, Xiaoguang Mei, Fan Fan, and Jiayi Ma, “Unsupervised stacked capsule autoencoder for hyperspectral image classification,” in ICASSP 2021-2021 IEEE International Conference on Acoustics, Speech and Signal Processing (ICASSP). IEEE, 2021, pp. 1825–1829.
- [11] Barret Zoph and Quoc V Le, “Neural architecture search with reinforcement learning,” arXiv preprint arXiv:1611.01578, 2016.
- [12] Lingxi Xie and Alan Yuille, “Genetic cnn,” in Proceedings of the IEEE international conference on computer vision, 2017, pp. 1379–1388.
- [13] Hanxiao Liu, Karen Simonyan, and Yiming Yang, “Darts: Differentiable architecture search,” arXiv preprint arXiv:1806.09055, 2018.
- [14] Yushi Chen, Kaiqiang Zhu, Lin Zhu, Xin He, Pedram Ghamisi, and Jón Atli Benediktsson, “Automatic design of convolutional neural network for hyperspectral image classification,” IEEE Transactions on Geoscience and Remote Sensing, vol. 57, no. 9, pp. 7048–7066, 2019.
- [15] Xue Wang, Kun Tan, Peijun Du, Chen Pan, and Jianwei Ding, “A unified multiscale learning framework for hyperspectral image classification,” IEEE Transactions on Geoscience and Remote Sensing, vol. 60, pp. 1–19, 2022.
- [16] Haokui Zhang, Chengrong Gong, Yunpeng Bai, Zongwen Bai, and Ying Li, “3-d-anas: 3-d asymmetric neural architecture search for fast hyperspectral image classification,” IEEE Transactions on Geoscience and Remote Sensing, vol. 60, pp. 1–19, 2021.
- [17] Peng Ye, Baopu Li, Yikang Li, Tao Chen, Jiayuan Fan, and Wanli Ouyang, “-darts: Beta-decay regularization for differentiable architecture search,” in Proceedings of the IEEE/CVF Conference on Computer Vision and Pattern Recognition, 2022, pp. 10874–10883.
- [18] Zilong Zhong, Ying Li, Lingfei Ma, Jonathan Li, and Wei-Shi Zheng, “Spectral–spatial transformer network for hyperspectral image classification: A factorized architecture search framework,” IEEE Transactions on Geoscience and Remote Sensing, vol. 60, pp. 1–15, 2021.
- [19] Ying Li, Haokui Zhang, and Qiang Shen, “Spectral–spatial classification of hyperspectral imagery with 3d convolutional neural network,” Remote Sensing, vol. 9, no. 1, pp. 67, 2017.
- [20] Zilong Zhong, Jonathan Li, Zhiming Luo, and Michael Chapman, “Spectral–spatial residual network for hyperspectral image classification: A 3-d deep learning framework,” IEEE Transactions on Geoscience and Remote Sensing, vol. 56, no. 2, pp. 847–858, 2017.