Department of Materials Science and Engineering, Massachusetts Institute of Technology, Cambridge, MA, 02139
Mapping the space of photoswitchable ligands and photodruggable proteins with computational modeling
Abstract
Light-activated drugs are a promising way to localize biological activity and minimize side effects. However, their development is complicated by the numerous photophysical and biological properties that must be simultaneously optimized. To accelerate the design of photoactive drugs, we describe a procedure that combines ligand-protein docking with chemical property prediction based on machine learning (ML). We apply this procedure to 58 proteins and 9,000 photo-drug candidates based on azobenzene cis–trans isomerism. We find that most proteins display a preference for trans isomers over cis, and that the binding affinities of nominally active/inactive pairs are in fact highly correlated. These findings have significant value for photopharmacology research, and reinforce the need for virtual screening to identify compounds with rare desirable properties. Further, we combine our procedure with quantum chemical validation to identify promising candidates for the photoactive inhibition of PARP1, an enzyme that is over-expressed in cancer cells. The top compounds are predicted to have long-lived active forms, differential bioactivity, and absorption in the near-infrared therapeutic window.
Introduction
Photopharmacology is an emerging field that uses light to control the activity of drugs 1, 2. The goal of light-controlled bioactivity is to minimize side effects. By activating the drug only at specific locations or times, one can minimize off-target effects, thereby improving quality of life and increasing the maximum deliverable dose 1. Such therapeutics have been hypothesized as a path for the treatment of cancer 3, neurodegenerative diseases 4, bacterial infections 5, diabetes 6, and blindness 7.
Photoactive drugs are built around photoswitches, which are molecules that change their properties in response to light. A popular choice is azobenzene 2, which exhibits trans cis isomerism in response to light. Since bioactivity depends strongly on the shape of the ligand, the large structural change upon illumination of azobenzene can change the effect of the drug.
Photoactive drug development is complicated by the number of properties that must be optimized. In addition to regular drug properties, photoactive compounds must absorb light in a narrow range of the near-infrared (IR), since human tissue is only transparent to light in this region 8. They must also have a high density of the active isomer under steady-state illumination, and display differential bioactivity between the two isomers. Lastly, they must thermally revert to the stable isomer in a specific time frame. For photoactive drugs one typically wants the unstable isomer to be active for as long as possible, while for ion channel blockers, the target lifetime is usually milliseconds 9. Optimizing these properties through trial-and-error experimentation is both slow and costly 10.
To accelerate the development of photoactive drugs, we 11, 12 and others 13, 14, 15 have developed computational tools to predict the photophysical properties of azobenzene derivatives. In Ref. 11 we developed a machine learning (ML) force field to predict the quantum yield and absorption spectrum of photoswitches. In Ref. 12 we refined this force field and developed an automated workflow to predict the thermal half-lives of cis isomers.
In this work, we combine our models with computational docking to predict the chemical properties and bioactivity of photoactive drug candidates across a broad space of ligands and protein targets. We first use docking to predict the cis and trans binding free energy of 9,000 ligands to 58 different proteins. The results demonstrate the extent to which cis or trans isomers are systematically favored to bind a given target, and the correlation between cis and trans docking scores. The scores and poses are available at https://doi.org/10.18126/41tz-igf4 through the Materials Data Facility 16, 17. We then combine these results with photophysical properties to virtually screen the 9,000 compounds for photoactive inhibition of the PARP1 cancer target. We identify three hits with predicted differential activity, redshifted absorption, and long thermal half-lives. The photophysical properties are validated for two candidates with quantum chemistry. Full molecular dynamics (MD) simulations of the absorption spectra suggest that both absorb in the near-IR. Lastly, we show that both docking and ML-accelerated simulations can be further sped up with graph-to-property ML models. This paves the way for rapid virtual screening of large photoactive drug libraries.
Methods
Ligands were selected from the 19,000 azobenzene derivatives generated in Ref. 12. They were created through combinatorial substitution of azobenzene with common literature substituents and patterns. We previously computed their absorption wavelengths and thermal half-lives using a machine learning (ML) force field trained on quantum chemistry data 12. We also argued that thermal isomerization proceeds through intersystem crossing for unsubstituted azobenzene. We therefore computed rates with both intersystem crossing and standard transition state (TS) theory for all derivatives.
We performed ligand-protein docking using the recently developed dockstring package 18. Dockstring performs automated docking for 58 different proteins of medical interest, using only the ligand SMILES string as input. All proteins and docking search boxes were manually prepared by the dockstring authors. The program performs automatic ligand protonation and partial charge generation with Open Babel 19, initial structure generation with RDKit 20, and docking with AutoDock Vina 21. We added hydrogens to the exported poses with the AddHs function in RDKit, using the argument addCoords=True. We used RDKit version 2020.09.1 for all calculations.
Dockstring’s 58 proteins span a variety of functions: they contain 22 kinases, twelve enzymes, nine nuclear receptors, seven proteases, five G-protein coupled receptors, two cytochromes, and one chaperone 18. The accuracy of the dockstring procedure was tested through a comparison to experimental binding affinities from the ExCAPE database 22. Results were of high quality for 24 targets, with enrichment factors between 4 and 6 for each target 18. High-quality targets discussed below include JAK2, PARP1, NR3C1, and HSD11B1. Medium-quality targets include EGFR, MAOB, AR, BACE1, MAPK1 and ADRB1.
We removed all ligands that were protonated or de-protonated by Open Babel, since their chemical properties were computed without this step in Ref. 12. This left approximately 9,000 compounds in total. We docked both the cis and trans isomers for each compound for all 58 protein targets, yielding over one million docking scores in total. We removed all molecules with docked poses that did not respect the cis/trans isomerism of the input SMILES.
As discussed in the Results section, we validated ML predictions of photophysical properties for a number of hits. As in the ML training set 12, we used spin-flip time-dependent density functional theory (SF-TDDFT) with the BHHLYP functional 23, the 6-31G* basis 24, and the C-PCM implicit solvent model of water 25, 26, 27. Calculations were performed in Q-Chem 5.3 28.
We also simulated the full absorption spectrum for these species. To do so we performed TDDFT with the PBE0 functional 29 on geometries sampled from MD. PBE0 is among the most reliable functionals for TDDFT vertical excitation energies of organic molecules when compared to high-accuracy theoretical methods 30. Further, as discussed in the Results section, it yields excellent agreement with the absorption spectrum of azobenzene when combined with MD. The range-separated hybrid CAM-B3LYP 31 has similar errors to PBE0 30, and has been used to simulate the spectrum of azobenzene 32, but we found that PBE0 gave slightly better agreement with experiment.
We used our ML force field from Ref. 11 to perform 300 ps of MD in the canonical ensemble at room temperature. We used the Nosé-Hoover thermostat 33, 34 with the parameters of Ref. 11. We then sampled 2,000 frames from each simulation and performed TDDFT calculations on each. We used the large def2-TZVP basis set 35 and the SMD model for water 36. Calculations were performed with Orca 4.1.1 37. The spectrum was computed as the weighted histogram of excitation energies, with weights given by the square of the transition dipole moment, following Fermi’s Golden Rule 38.
Results
Differential affinity
General trends
Large-scale docking allows us to discover trends in photo-druggability. For example, we can learn whether the binding affinities of the two isomers tend to be correlated or not. Since the aim of photopharmacology is to develop drugs that are potent in one form and harmless in another, we can learn whether this goal is easy or hard. This, in turn, tells us about the size of the photoswitchable chemical space that contains promising photo-drug candidates.
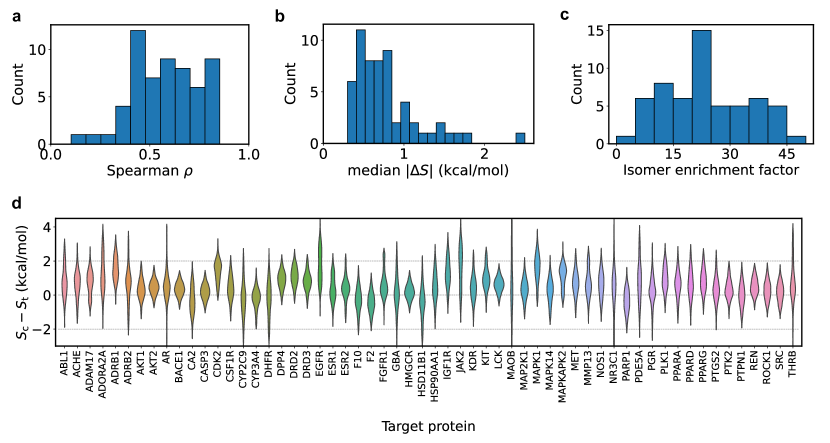
Figure 1(a) shows the distribution of cis minus trans docking scores for different proteins. Since a lower docking score means better binding, a positive value of means that trans binds better than cis. These differences are summarized in panel (b), which shows the Spearman rank correlation coefficients between cis and trans docking scores. Each data point is the correlation of isomer scores for a different target. The rank coefficient measures the extent to which the ordering of scores is correlated. We see that the scores are moderately to strongly correlated. The mean value of is 0.58; the correlation is above 0.5 for 66% of targets, and above 0.75 for 21% of them. Panel (c) shows the median absolute difference in cis/trans docking scores for the different targets. The majority of median differences are under 1 kcal/mol; the mean of medians is 0.8 kcal/mol, while the average standard deviation of scores is 1.2 kcal/mol. This again reflects the correlation of the cis/trans scores.
A more informative metric for score similarity is the enrichment factor (EF). The goal of virtual screening is to find the small proportion of ligands that tightly bind the target. Hence the Spearman correlation among ligands that do not tightly bind in either conformation, which is most of them, is not of much interest. The EF is more related to the problem of virtual screening. It is defined as the ratio of true hit percentage in a model’s top-ranked subset to the hit percentage in the whole dataset. Here we ask what the enrichment factor is from using cis scores to predict trans scores. Defining a hit as a molecule in the lowest (best) 1% of all trans scores, the EF is then the true hit percentage in the lowest 1% of cis scores, divided by the true hit percentage in the dataset (equal to 1). We see in panel (d) that enrichment factors are quite high for most targets, with a mean value of 23.6. Hence the likelihood of a trans hit also being a cis hit is rather high. This means that finding a molecule with a large score difference is a needle-in-a-haystack problem, rather than a trivial one.
Thus we are able to map the space of photodruggable targets and photoactive ligands for the first time, and find that most isomers are too similar to be good candidates for photopharmacology. Indeed, taking the docking score as an estimate of the binding free energy, we require a score difference of 4.1 kcal/mol to achieve a 1000-fold difference in dissociation constant . This is 5.1 times higher than the average difference in cis and trans scores (Fig. 1(c)). Only 0.79% of all ligand-target pairs have cis/trans score differences above 4.1 kcal/mol. Of the ligands in the top percentile of all scores, only 4% have the requisite score difference. This finding is significant because it suggests that most azobenzene-based inhibitors do not have strong differential activity. However, this prediction should be taken with caution, since docking has several well-known limitations that can affect accuracy 39.
Target-specific trends
We also find that some targets are more easily photodruggable than others. In Fig. 1(a), we see that is positive for most targets, and hence that trans tends to bind better on average. The mean value of over all targets is kcal/mol. The targets with a large value of are more easily photodruggable, because trans ligands with strong affinities are more likely to have cis counterparts with weak affinities.
There are several targets for which trans is particularly favored over cis. For example, the mean value of is over 1.5 kcal/mol for EGFR, JAK2, MAPK1 and ADRB1. EGFR shows the strongest difference in scores, with kcal/mol. For context, this is the difference between the mean and the percentile EGFR scores in the dockstring dataset. It therefore represents a significant difference. The high differential affinity in EGFR comes from both high trans affinity and low cis affinity. For example, the mean EGFR score is kcal/mol in the dockstring dataset, while the mean cis and trans scores in our library are and kcal/mol, respectively.
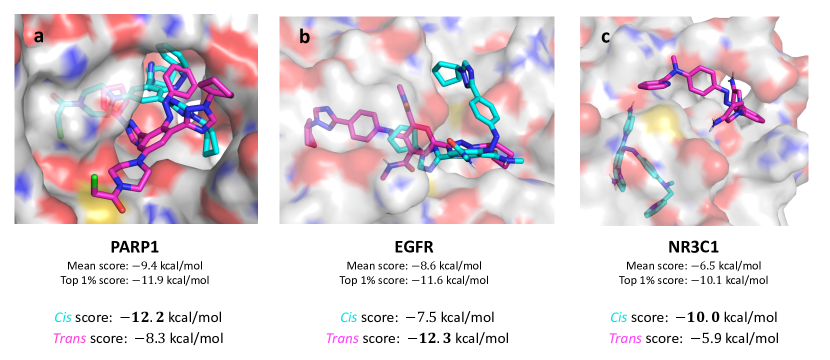
We can understand these differences by visualizing the docked poses. The poses of ligands docked in three different targets are shown in Fig. 2. Panel (b) shows the ligands with the highest differential activity in EGFR. We see that the trans isomer fills a long and narrow binding pocket. The cis isomer is kinked, giving it two arms that extend only half the length of the pocket. Hence the trans isomer binds much more strongly than cis. The shape of the binding pocket thus explains the strong preference for trans ligands in EGFR.
While less common, there are also some targets with a preference for cis isomers. For example, the mean value of is less than kcal/mol for HSD11B1, MAOB and PARP1. The lowest value is kcal/mol for HSD11B1, which should be contrasted with the highest value of kcal/mol for EGFR. Figure 2(a) shows the tight four-pronged fit of a cis ligand in PARP1, and the lack of space for the trans isomer.
Since some targets have a strong preference for trans, but only a few have a moderate preference for cis, it is easier to design trans-active drugs in general. This is a significant finding for photopharmacology, since it informs the community about the ease of designing active drugs in different isomeric forms. It is also not ideal, since one usually wants to deliver an inactive drug and activate it locally, and it is easier to deliver the thermodynamically more stable trans isomer. (Trans is more stable than cis in over 99% of the molecules in our dataset 12.) Hence one usually wants the trans isomer to be inactive and the cis isomer to be active. Docking of bridged azobenzenes, in which cis is more stable than trans 40, may therefore be of interest in the future. Nevertheless, one can still find ligand-target pairs in which cis binds much more strongly than trans, as shown in Figs. 2 and 4 and discussed further below.
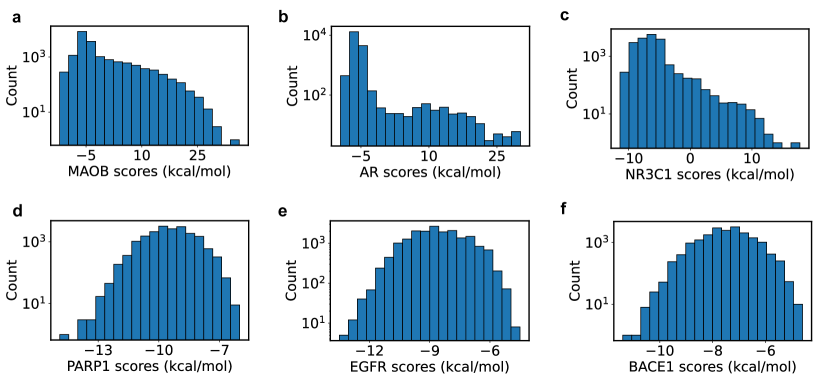
Some targets have a very wide range of score differences, which makes them particularly amenable to photopharmacology. For example, the score differences for MAOB, AR, and NR3C1 extend past the plot limits in Fig. 1(a). Indeed, the standard deviations in cis-trans score differences are 6.6 kcal/mol for MAOB, 3.4 kcal/mol for AR, and 2.4 kcal/mol for NR3C1, compared to only 0.7 kcal/mol for PARP1. The and percentile of score differences for MAOB are and kcal/mol, respectively, which represent an enormous range.
Figure 3 shows docking scores for targets with wide and normal ranges of differential affinity. We see that many ligands docked in MAOB, AR, and NR3C1 have positive scores, while those docked in PARP1, EGFR and BACE1 do not. Hence for many ligands, it is thermodynamically unfavorable to be bound to MAOB, AR or NR3C1 at all. This can also be seen in the original dockstring dataset. The reason is that the binding pockets of these proteins are quite small, meaning that many ligands have clashes with the target. Indeed, Fig. 2(c) shows a trans ligand that has a better score when docked outside the pocket than within it. Hence these targets are difficult to drug, which makes them good candidates for photopharmacology.
Virtual screening
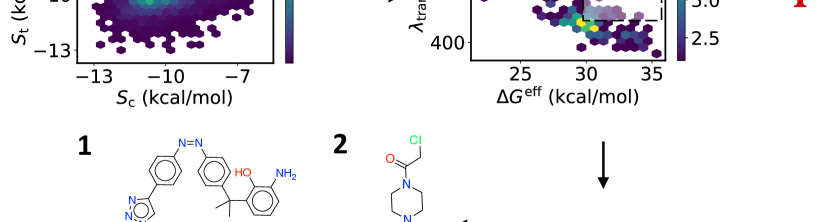
With access to docking scores and photophysical properties computed in Ref. 12, we can also perform virtual screening to identify photo-drug hits. Figure 4 shows our screening workflow. We first identify ligands with strong cis binding affinities and weak trans affinities. This is the ideal case for photopharmacology, but, as mentioned above, is generally difficult because of the correlation between cis and trans scores, and the preference of most proteins for trans isomers. Here we retain compounds for which and , where is the mean docking score of all ligands for the given target, and is the associated standard deviation. More extreme cutoffs can be used when screening larger ligand libraries.
From these compounds, we retain only species with longer cis thermal half-lives than unsubstitued azobenzene. The experimental half-life of azobenzene is 1.4 days in benzene solution at C 41; hence this cutoff should select for lifetimes that are at least several hours. We keep all compounds with . We use the effective activation free energy, , which measures the barrier to triplet-mediated thermal isomerization 12, and which is analogous to in Eyring transition state theory. Lastly, we select the remaining compounds with the highest trans absorption wavelengths, and validate their photophysical properties with quantum chemistry.
Table 1 shows docking scores and chemical properties for three promising photoactive inhibitors of PARP1. For reference, the second last row shows results for azobenzene, and the last row shows median values of all molecules. The promising candidates are shown in Fig. 5. The cis docking scores of the hits are all 2 kcal/mol or more below the median. The trans docking scores are no more than kcal/mol below the median. The score differences are all at least 2.1 kcal/mol. The largest difference is for compound 2, which also has the lowest cis docking score (0.4 percentile among all compounds).
| Compound | |||||||||||
|---|---|---|---|---|---|---|---|---|---|---|---|
| 1 | 511 | 420 | 518 | 30.2 | – | 31.2 | 31.9 | ||||
| 2 | 502 | – | 482 | 29.2 | 30.0 | 30.2 | 30.9 | ||||
| 3 | 11.6 | 9.5 | 456 | 467 | 532 | 30.0 | – | 31.0 | 31.8 | ||
| Azobenzene | 410 | 411 | 457 | 28.9 | 28.8 | 30.3 | 30.2 | ||||
|
426 | – | – | 29.5 | – | 29.5 | – | ||||
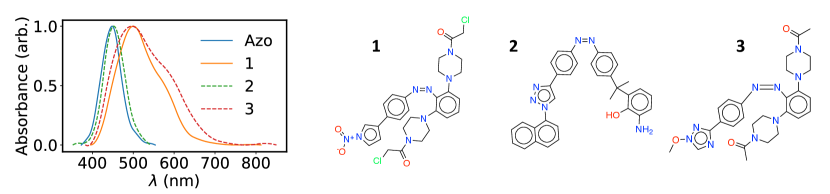
ML calculations predict that compounds 1 and 2 have trans absorption wavelengths () over 500 nm. This is a redshift of over 90 nm relative to azobenzene. The predicted absorption wavelength of compound 3 is only 456 nm. To test these predictions, we performed quantum chemistry calculations with SF-TDDFT using the BHHLYP functional and an implicit model of water, which was the method used for training. Interestingly, these calculations yielded nm for 1 and nm for 3. Hence the extreme redshift predicted for 1 was significantly overestimated by the ML model. Reliable results could not be obtained for 2 due to spin contamination in SF-TDDFT. Both spin contamination and overestimated redshifting in high- species were previously noted in Ref. 12.
SF-TDDFT was used in Ref. 12 because of its ability to handle multireference effects in azobenezene transition states. However, it has not been thoroughly benchmarked for absorption wavelengths, and its predicted absorption maximum for azobenzene is 30 nm lower than experiment 11. Further, vertical excitation energies with any functional do not account for the redshift 32 or blueshift 11 that can occur at nonzero temperatures. They also do not account for the width of the absorption spectrum. Since one is usually interested in the high-wavelength tail of the spectrum, predicting its width is critical.
Therefore, we also computed the full absorption spectrum of each hit, using MD combined with TDDFT with the PBE0 functional (see Methods). The computed absorption spectrum for each hit is shown in Fig. 5. Both 1 and 3 are predicted to absorb in the therapeutic window of 700-900 nm 8, which is a major goal for photopharmacology. The spectrum of azobenzene is also shown for reference. It is in excellent agreement with experiment: the predicted peak wavelength for azobenzene is 448 nm, and the absorption extends to 553 nm; the experimental maximum is 444 nm in acetonitrile, and the extent is also around 550 nm 42. This validates our approach and provides some confidence in the spectra of 1-3.
The predicted near-IR absorption comes from a significantly widened, redshift-skewed spectrum and a redshifted maximum. The maxima of 1 and 3 are 501 and 496 nm, which are 53 and 48 nm higher than azobenzene, respectively. However, if these compounds had the same spectrum shape as azobenzene, then their maximum absorption would only extend to 600 nm. It is the long tail of redshifted absorption that enables near-IR absorption. The large ortho groups lead to twisting around the central nitrogen double bond, and hence to sampling of low-gap geometries. We reported similar effects from bulky substitution in Ref. 11. Redshift-skewed absorption has been measured experimentally in tetra-ortho halogenated azobenzenes 43, and reproduced with MD simulations in Ref. 32.
For comparison, we also re-optimized the equilibrium trans geometries with PBE0 and D3 dispersion 44, and then performed single-point PBE0 TDDFT calculations. The results are shown in Table 1 under the heading . Some of the vertical excitation wavelengths match the MD means, but all are blueshifted with respect to the MD maxima. This reinforces the need for a full MD simulation of the spectrum.
Each hit also has a longer predicted thermal half-life than azobenzene. is 28.9 kcal/mol for azobenzene 12, and over 29.2 kcal/mol for compounds 1-3. Note that the experimental value for azobenzene is 25.4 kcal/mol 45, and that the overestimate comes from systematic errors in SF-TDDFT, though experimental trends are well-reproduced 12. We also computed , the activation free energy from Eyring TS theory, since isomerization can occur through a singlet TS if . The TS barrier of each hit is comparable to or higher than that of azobenzene.
We further performed quantum chemistry calculations to estimate and , the free energies from SF-TDDFT. In particular, we performed single-point calculations on the ML-optimized singlet-triplet crossing geometries and TSs. We then used the ML estimates of the remaining contributions to to approximate and . Spin contamination led to unreliable estimates for in 1 and 3. However, the reliable estimate for 2 and all estimates for were within 0.8 kcal/mol of the predicted values. Hence the quantum chemical calculations also indicate long thermal half-lives for these species.
Interestingly, our screen produced two very similar molecules in 1 and 3. The ortho functional groups are identical, except that chlorine is removed in 3, yielding a ketone instead of a chloroacetate. The nitro-substituted pyrrole in 1 is replaced with a methoxy-substituted triazole in the same position. The compounds have similar absorption spectra, thermal isomerization barriers, and differential affinities. Compound 3 is preferrable to 1, since chloroacetates are hazardous alkylating agents that can be toxic to cells, and nitro groups can be toxic as well. Removing chlorine and replacing the nitro group with a methoxy group thus makes 3 a more promising candidate. Automatic pre-filtering to remove problematic motifs is of interest for future work.
Accelerated screening with graph-based models
Using ML potentials to compute thermal half-lives and absorption wavelengths is significantly faster than using quantum chemistry. However, the calculations are still rather slow, because they involve multiple conformer searches and optimizations, which take several minutes for each compound. Hence only 25,000 molecules could be screened in Ref. 12. This falls well short of the millions of compounds routinely screened in computational drug discovery 46. Therefore, we propose accelerating future virtual screening efforts with graph-to-property models trained on ML-accelerated simulations. These models are quite fast, and can therefore be used to screen hundreds of millions of compounds for a desired property 47. Further, while ML-accelerated calculations are too slow for such large-scale screening, they are fast enough to generate tens of thousands of training points to train high-accuracy graph-based models. Such models can also be trained on docking scores, yielding smaller but still significant savings.
Graph-to-property models take the chemical graph as input and yield a property as output. Unlike models that take one or many 3D structures as input 48, 49, graph-based models do not require expensive generation and refinement of 3D coordinates. They are therefore ideal for rapid virtual screening of large libraries.
Among the many models developed in the literature, the Attentive FP architecture is one of the most successful 50. It combines an attention mechanism 51 with neural network message-passing 52 to generate an embedding for each atom. These node embeddings are then converted to graph embeddings with attention-based pooling, before being mapped to the final property with a neural network. This model substantially improves on previous state-of-the-art results for nearly all properties in standard benchmarks 50. Further, it has the highest accuracy of all models trained on the dockstring dataset for each protein target 18. We therefore used the Attentive FP model in this work.
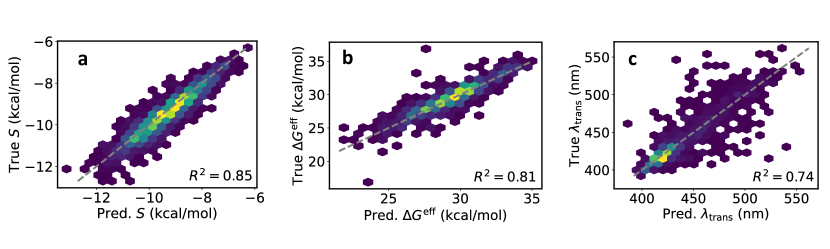
We used the DeepChem library 53 to train separate Attentive FP models on PARP1 docking scores, effective activation free energies, and trans absorption wavelengths. We trained each model for 500 epochs using a batch size of 16 and a learning rate of 0.001. Absorption wavelengths were first standardized to have zero mean and unit variance, which accelerated training. 10% of the compounds were randomly selected as a test set.
The results are shown in Fig. 6. We see that all models are highly predictive, and hence can be used to accelerate virtual screening. The models for and are particularly good, with coefficients of determination . The mean absolute error (MAE) of the docking model is 0.31 kcal/mol, and the enrichment factor is 44 when defining a hit as the lowest 1% of all scores. The MAE is 0.68 kcal/mol for and 9.9 nm for . is only 0.74 for , and more outliers are clearly visible for this model than for the others. This may be because the ML force field, which generated data for the graph model, is less accurate for than for 12. This may lead to artificial activity cliffs that are hard for the graph model to predict. Nevertheless, the model is still accurate enough to be useful in virtual screening.
Conclusion
We have used computational docking to predict the cis and trans binding affinities of 9,000 azobenzene derivatives for 58 different proteins. This revealed substantial differences in the photo-druggability of different targets. We then combined these docking scores with previous calculations of the absorption wavelength and thermal stability to identify photoactive hits for the PARP1 cancer target. Lastly, we showed that this data enables training of fast graph-to-property models that can significantly accelerate future virtual screening efforts.
Our virtual screening results show that docking and ML can be used to identify promising photoactive drug candidates. Our large-scale docking results also yield important insights for photopharmacology. First, most proteins tend to prefer trans isomers over cis, which is problematic if one wants to deliver a thermodynamically stable and inactive compound. Second, the binding affinities of cis and trans ligands tend to be highly correlated. This means that even if one designs a potent drug based on azobenzene, it is likely that the other isomer is also potent. Third, while these trends are discouraging for photopharmacology, they do not apply to every protein and every ligand. Indeed, some proteins prefer cis isomers over trans, and for each protein there are ligand outliers that have strong differential activity. Further, proteins with small binding pockets, such as MAOB and NR3C1, show large differences in isomeric affinity. These insights will be crucial for the future design of photoactive drugs.
Acknowledgements
We thank Professor Zlatko Janeba (IOCB Prague) for enlightening discussions. Harvard Cannon cluster, MIT Engaging cluster, and MIT Lincoln Lab Supercloud cluster at MGHPCC are gratefully acknowledged for computational resources and support. Financial support from DARPA (Award HR00111920025) is acknowledged.
References
- Lerch et al. 2016 Lerch, M. M.; Hansen, M. J.; van Dam, G. M.; Szymanski, W.; Feringa, B. L. Emerging targets in photopharmacology. Angewandte Chemie International Edition 2016, 55, 10978–10999
- Broichhagen et al. 2015 Broichhagen, J.; Frank, J. A.; Trauner, D. A roadmap to success in photopharmacology. Accounts of chemical research 2015, 48, 1947–1960
- Szymanski et al. 2015 Szymanski, W.; Ourailidou, M. E.; Velema, W. A.; Dekker, F. J.; Feringa, B. L. Light-controlled histone deacetylase (HDAC) inhibitors: towards photopharmacological chemotherapy. Chemistry–A European Journal 2015, 21, 16517–16524
- Broichhagen et al. 2014 Broichhagen, J.; Jurastow, I.; Iwan, K.; Kummer, W.; Trauner, D. Optical control of acetylcholinesterase with a tacrine switch. Angewandte Chemie International Edition 2014, 53, 7657–7660
- Velema et al. 2013 Velema, W. A.; Van Der Berg, J. P.; Hansen, M. J.; Szymanski, W.; Driessen, A. J.; Feringa, B. L. Optical control of antibacterial activity. Nature chemistry 2013, 5, 924–928
- Broichhagen et al. 2014 Broichhagen, J.; Schönberger, M.; Cork, S. C.; Frank, J. A.; Marchetti, P.; Bugliani, M.; Shapiro, A.; Trapp, S.; Rutter, G. A.; Hodson, D. J., et al. Optical control of insulin release using a photoswitchable sulfonylurea. Nature communications 2014, 5, 1–11
- Bonardi et al. 2010 Bonardi, F.; London, G.; Nouwen, N.; Feringa, B. L.; Driessen, A. J. Light-Induced Control of Protein Translocation by the SecYEG Complex. Angewandte Chemie International Edition 2010, 49, 7234–7238
- Dong et al. 2017 Dong, M.; Babalhavaeji, A.; Collins, C. V.; Jarrah, K.; Sadovski, O.; Dai, Q.; Woolley, G. A. Near-infrared photoswitching of azobenzenes under physiological conditions. Journal of the American Chemical Society 2017, 139, 13483–13486
- Mourot et al. 2011 Mourot, A.; Kienzler, M. A.; Banghart, M. R.; Fehrentz, T.; Huber, F. M.; Stein, M.; Kramer, R. H.; Trauner, D. Tuning photochromic ion channel blockers. ACS chemical neuroscience 2011, 2, 536–543
- Axelrod et al. 2022 Axelrod, S.; Schwalbe-Koda, D.; Mohapatra, S.; Damewood, J.; Greenman, K. P.; Gómez-Bombarelli, R. Learning matter: Materials design with machine learning and atomistic simulations. Accounts of Materials Research 2022, 3, 343–357
- Axelrod et al. 2022 Axelrod, S.; Shakhnovich, E.; Gómez-Bombarelli, R. Excited state non-adiabatic dynamics of large photoswitchable molecules using a chemically transferable machine learning potential. Nature Communications 2022, 13, 3440
- Axelrod et al. 2022 Axelrod, S.; Shakhnovich, E.; Gomez-Bombarelli, R. Thermal half-lives of azobenzene derivatives: virtual screening based on intersystem crossing using a machine learning potential. arXiv preprint arXiv:2207.11592 2022,
- Adrion et al. 2021 Adrion, D. M.; Kaliakin, D. S.; Neal, P.; Lopez, S. A. Benchmarking of density functionals for Z-azoarene half-lives via automated transition state search. The Journal of Physical Chemistry A 2021, 125, 6474–6485
- Mukadum et al. 2021 Mukadum, F.; Nguyen, Q.; Adrion, D. M.; Appleby, G.; Chen, R.; Dang, H.; Chang, R.; Garnett, R.; Lopez, S. A. Efficient discovery of visible light-activated azoarene photoswitches with long half-lives using active search. Journal of Chemical Information and Modeling 2021, 61, 5524–5534
- Griffiths et al. 2022 Griffiths, R.-R.; Greenfield, J. L.; Thawani, A. R.; Jamasb, A. R.; Moss, H. B.; Bourached, A.; Jones, P.; McCorkindale, W.; Aldrick, A. A.; Fuchter, M. J.; Lee, A. A. Data-Driven Discovery of Molecular Photoswitches with Multioutput Gaussian Processes. arXiv preprint arXiv:2008.03226 2022,
- Blaiszik et al. 2016 Blaiszik, B.; Chard, K.; Pruyne, J.; Ananthakrishnan, R.; Tuecke, S.; Foster, I. The materials data facility: data services to advance materials science research. Jom 2016, 68, 2045–2052
- Blaiszik et al. 2019 Blaiszik, B.; Ward, L.; Schwarting, M.; Gaff, J.; Chard, R.; Pike, D.; Chard, K.; Foster, I. A data ecosystem to support machine learning in materials science. MRS Communications 2019, 9, 1125–1133
- García-Ortegón et al. 2022 García-Ortegón, M.; Simm, G. N.; Tripp, A. J.; Hernández-Lobato, J. M.; Bender, A.; Bacallado, S. DOCKSTRING: easy molecular docking yields better benchmarks for ligand design. Journal of chemical information and modeling 2022, 62, 3486–3502
- O’Boyle et al. 2011 O’Boyle, N. M.; Banck, M.; James, C. A.; Morley, C.; Vandermeersch, T.; Hutchison, G. R. Open Babel: An open chemical toolbox. Journal of cheminformatics 2011, 3, 1–14
- 20 RDKit: Open-source cheminformatics. http://www.rdkit.org
- Trott and Olson 2010 Trott, O.; Olson, A. J. AutoDock Vina: improving the speed and accuracy of docking with a new scoring function, efficient optimization, and multithreading. Journal of computational chemistry 2010, 31, 455–461
- Sun et al. 2017 Sun, J.; Jeliazkova, N.; Chupakhin, V.; Golib-Dzib, J.-F.; Engkvist, O.; Carlsson, L.; Wegner, J.; Ceulemans, H.; Georgiev, I.; Jeliazkov, V., et al. ExCAPE-DB: an integrated large scale dataset facilitating Big Data analysis in chemogenomics. Journal of cheminformatics 2017, 9, 1–9
- Becke 1993 Becke, A. D. A new mixing of Hartree–Fock and local density-functional theories. The Journal of chemical physics 1993, 98, 1372–1377
- Francl et al. 1982 Francl, M. M.; Pietro, W. J.; Hehre, W. J.; Binkley, J. S.; Gordon, M. S.; DeFrees, D. J.; Pople, J. A. Self-consistent molecular orbital methods. XXIII. A polarization-type basis set for second-row elements. The Journal of Chemical Physics 1982, 77, 3654–3665
- Truong and Stefanovich 1995 Truong, T. N.; Stefanovich, E. V. A new method for incorporating solvent effect into the classical, ab initio molecular orbital and density functional theory frameworks for arbitrary shape cavity. Chemical Physics Letters 1995, 240, 253–260
- Barone and Cossi 1998 Barone, V.; Cossi, M. Quantum calculation of molecular energies and energy gradients in solution by a conductor solvent model. The Journal of Physical Chemistry A 1998, 102, 1995–2001
- Cossi et al. 2003 Cossi, M.; Rega, N.; Scalmani, G.; Barone, V. Energies, structures, and electronic properties of molecules in solution with the C-PCM solvation model. Journal of computational chemistry 2003, 24, 669–681
- Epifanovsky et al. 2021 Epifanovsky, E.; Gilbert, A. T.; Feng, X.; Lee, J.; Mao, Y.; Mardirossian, N.; Pokhilko, P.; White, A. F.; Coons, M. P.; Dempwolff, A. L., et al. Software for the frontiers of quantum chemistry: An overview of developments in the Q-Chem 5 package. The Journal of chemical physics 2021, 155, 084801
- Adamo and Barone 1999 Adamo, C.; Barone, V. Toward reliable density functional methods without adjustable parameters: The PBE0 model. The Journal of chemical physics 1999, 110, 6158–6170
- Jacquemin et al. 2009 Jacquemin, D.; Wathelet, V.; Perpete, E. A.; Adamo, C. Extensive TD-DFT benchmark: singlet-excited states of organic molecules. Journal of Chemical Theory and Computation 2009, 5, 2420–2435
- Yanai et al. 2004 Yanai, T.; Tew, D. P.; Handy, N. C. A new hybrid exchange–correlation functional using the Coulomb-attenuating method (CAM-B3LYP). Chemical physics letters 2004, 393, 51–57
- Gelabert et al. 2023 Gelabert, R.; Moreno, M.; Lluch, J. M. Predicting the Electronic Absorption Band Shape of Azobenzene Photoswitches. International Journal of Molecular Sciences 2023, 24, 25
- Nosé 1984 Nosé, S. A unified formulation of the constant temperature molecular dynamics methods. The Journal of chemical physics 1984, 81, 511–519
- Hoover 1985 Hoover, W. G. Canonical dynamics: Equilibrium phase-space distributions. Physical review A 1985, 31, 1695
- Weigend and Ahlrichs 2005 Weigend, F.; Ahlrichs, R. Balanced basis sets of split valence, triple zeta valence and quadruple zeta valence quality for H to Rn: Design and assessment of accuracy. Physical Chemistry Chemical Physics 2005, 7, 3297–3305
- Marenich et al. 2009 Marenich, A. V.; Cramer, C. J.; Truhlar, D. G. Universal solvation model based on solute electron density and on a continuum model of the solvent defined by the bulk dielectric constant and atomic surface tensions. The Journal of Physical Chemistry B 2009, 113, 6378–6396
- Neese 2012 Neese, F. The ORCA program system. Wiley Interdisciplinary Reviews: Computational Molecular Science 2012, 2, 73–78
- Fermi 1995 Fermi, E. Notes on quantum mechanics; University of Chicago Press, 1995
- Du et al. 2016 Du, X.; Li, Y.; Xia, Y.-L.; Ai, S.-M.; Liang, J.; Sang, P.; Ji, X.-L.; Liu, S.-Q. Insights into protein–ligand interactions: mechanisms, models, and methods. International journal of molecular sciences 2016, 17, 144
- Siewertsen et al. 2009 Siewertsen, R.; Neumann, H.; Buchheim-Stehn, B.; Herges, R.; Nather, C.; Renth, F.; Temps, F. Highly efficient reversible Z-E photoisomerization of a bridged azobenzene with visible light through resolved (n) absorption bands. Journal of the American Chemical Society 2009, 131, 15594–15595
- Talaty and Fargo 1967 Talaty, E. R.; Fargo, J. C. Thermal cis–trans-isomerization of substituted azobenzenes: a correction of the literature. Chemical Communications (London) 1967, 65–66
- Knie et al. 2014 Knie, C.; Utecht, M.; Zhao, F.; Kulla, H.; Kovalenko, S.; Brouwer, A. M.; Saalfrank, P.; Hecht, S.; Bléger, D. ortho‐Fluoroazobenzenes: Visible light switches with very long‐lived Z isomers. Chemistry–A European Journal 2014, 20, 16492–16501
- Konrad et al. 2020 Konrad, D. B.; Savasci, G.; Allmendinger, L.; Trauner, D.; Ochsenfeld, C.; Ali, A. M. Computational design and synthesis of a deeply red-shifted and bistable azobenzene. Journal of the American Chemical Society 2020, 142, 6538–6547
- Grimme et al. 2010 Grimme, S.; Antony, J.; Ehrlich, S.; Krieg, H. A consistent and accurate ab initio parametrization of density functional dispersion correction (DFT-D) for the 94 elements H-Pu. The Journal of chemical physics 2010, 132, 154104
- Rietze et al. 2017 Rietze, C.; Titov, E.; Lindner, S.; Saalfrank, P. Thermal isomerization of azobenzenes: on the performance of Eyring transition state theory. Journal of Physics: Condensed Matter 2017, 29, 314002
- Zhang et al. 2021 Zhang, Y.; Chowdhury, S.; Rodrigues, J. V.; Shakhnovich, E. Development of antibacterial compounds that constrain evolutionary pathways to resistance. Elife 2021, 10, e64518
- Stokes et al. 2020 Stokes, J. M.; Yang, K.; Swanson, K.; Jin, W.; Cubillos-Ruiz, A.; Donghia, N. M.; MacNair, C. R.; French, S.; Carfrae, L. A.; Bloom-Ackermann, Z., et al. A deep learning approach to antibiotic discovery. Cell 2020, 180, 688–702
- Axelrod and Gomez-Bombarelli 2020 Axelrod, S.; Gomez-Bombarelli, R. Molecular machine learning with conformer ensembles. arXiv preprint arXiv:2012.08452 2020,
- Axelrod and Gomez-Bombarelli 2022 Axelrod, S.; Gomez-Bombarelli, R. GEOM, energy-annotated molecular conformations for property prediction and molecular generation. Scientific Data 2022, 9, 1–14
- Xiong et al. 2019 Xiong, Z.; Wang, D.; Liu, X.; Zhong, F.; Wan, X.; Li, X.; Li, Z.; Luo, X.; Chen, K.; Jiang, H., et al. Pushing the boundaries of molecular representation for drug discovery with the graph attention mechanism. Journal of medicinal chemistry 2019, 63, 8749–8760
- Vaswani et al. 2017 Vaswani, A.; Shazeer, N.; Parmar, N.; Uszkoreit, J.; Jones, L.; Gomez, A. N.; Kaiser, Ł.; Polosukhin, I. Attention is all you need. Advances in neural information processing systems. 2017; pp 5998–6008
- Gilmer et al. 2017 Gilmer, J.; Schoenholz, S. S.; Riley, P. F.; Vinyals, O.; Dahl, G. E. Neural message passing for quantum chemistry. International conference on machine learning. 2017; pp 1263–1272
- Ramsundar et al. 2019 Ramsundar, B.; Eastman, P.; Walters, P.; Pande, V.; Leswing, K.; Wu, Z. Deep Learning for the Life Sciences; O’Reilly Media, 2019; https://www.amazon.com/Deep-Learning-Life-Sciences-Microscopy/dp/1492039837