Attosecond Transient Absorption Spectroscopy of Strongly Correlated Mott Insulators: Signature of the Creation and Annihilation of Double Occupancy
Abstract
We applied the time-resolved attosecond transient absorption spectroscopy to systematically investigate ultrafast optical responses of condensed matter systems. Under an intense pump pulse, absorption spectra indicate that the non-interacting electrons of band insulators produce a field-induced redshift, known as the dynamical Franz-Keldysh effect, as commonly expected. In contrast to the band insulators, in Mott insulators, unconventional spectra are observed which do not fully reflect the dynamical Franz-Keldysh effect. While it still exhibits the fishbone-like structures mimicking the dynamical Franz-Keldysh effect, the spectra show a negative difference absorption below the band edge, rendering a blueshift. In addition, the decomposed difference absorption reveals the creation and the annihilation of double occupancy mainly contribute to the negative signal, implying that the unconventional spectra are purely driven by the electron-correlations. These demonstrations of unconventional responses would guide us to the correlation-embedded attosecond electron dynamics in condensed matter systems.
Since ultrashort laser technologies have grown over the past decades it has reached the attosecond (as) temporal resolution (1 as s), which allows access to new insights in the time domain of 10 100 as shorter than the typical time scale of electron dynamicsKienberger1 ; Cavalieri1 ; Krausz1 ; Lucchini0 . As a result, attosecond transient absorption spectroscopy (ATAS) has been enabled to naturally capture the electron dynamics in matters and has become an essential technique to investigate highly nonlinear responses and their transient spectral properties at extreme time scales within sub-cycle laser pulsesHoller1 ; Wang1 ; Goulielmakis1 . In its early stage, ATAS has been widely used to demonstrate the dynamics of atomistic systemsWang1 ; Goulielmakis1 ; Michael1 ; Drescher1 , and now it has been extended to condensed matter systems, to explorer crystal symmetriesSato1 , electronic structures renormalizationsSchultze1 , dipole responsesMashiko1 , measuring photocarriersSchlaepfer1 ; Zurch1 , and the dynamical Franz-Keldysh effect (DFKE)Yacoby ; Jauho ; Novelli1 ; Otobe1 ; Du1 ; Lucchini1 ; Lucchini2 .
Among these studies, one of the essential achievements would be the control of fundamental properties to establish electronic responses directly by using an external electric field. When a condensed matter is exposed to an external intense electric field, the resulting absorption spectra are modified because of field-induced additional channels leading to a redshift below the band edge, referred to as the Franz-Keldysh effect (FKE)Franz ; Keldysh ; Tharmalingam ; Nahory .
Recent studies on a temporally extended scheme of the FKE under an alternating electric field, known as the DFKE, has been evolved with pump-induced intraband transitions to give an intriguing feature of real time phase oscillations, the fishbone structures, in addition to the redshift of the FKELucchini2 ; Sato1 . It also has been observed that the dynamical nature of the DFKE can be characterized in the crossover regime of the adiabatic parameter, , the center of competition between the pump photon energy () and the pondoromotive energy (). Then the FKE begins to appear in the adiabatic regime, i.e., Novelli1 ; Otobe1 ; Gordon1 . Several studies on the DFKE in condensed matters have been reported from the experiments on a diamond where the absorption modified by the intense pump pulse was directly captured by probe (XUV)Lucchini1 . The results were also supported by the theoretical approach of time-dependent density functional theory (TDDFT) to show the oscillating property of absorption as well as the phase delay.
More recently, nontrivial natures found in the attosecond transient reflectivity have been deeply resolved to incorporate the excitonic dynamics being an atomistic attribute into condensed matter systemsLucchini0 , which implies that the combined natures could have a significant role to provide unexpected insight of attosecond dynamics. In addition, a study of the ATAS of multi-band charge transfer insulators within the framework of TDDFT+U pointed out that screening would affect the DFKE to be changedDejean1 . However, the responses of ATAS combined with pure Mott phase still remains unclear. Considering the preceding results, it would be timely to suggest an exquisite signature from the ATAS if the dynamics of condensed matter systems are purely associated with rather strong electron-correlation.
In this study, by employing the real-time exact diagonalization method, we shall demonstrate the ATAS to explorer unbiased results of attosecond dynamics from band insulators and Mott insulators. In the band insulators, an intense pump pulse induces a conventional modification of absorption corresponding to the DFKE, which trivially accompanies the redshift below the band edge and the fishbone structures as a result of the intraband electron motion. In contrast to the DFKE, however, in the Mott insulator where the insulating band structures purely originated from the electron-correlation, it is observed from the ATAS that unconventional modification in their spectra appears to show a blueshift below the band edge violating the DFKE, but the fishbone-like structures still exist to mimic the DFKE. Furthermore, we investigate the decomposed difference spectra of the ATAS from the Mott insulators, and reveal that the transition pathways associated with creation and annihilation of double occupancy, the special state due to on-site repulsions, evidently contributes to the blueshift. Understanding of the unconventional ATAS for the Mott insulator provides insight on dynamical linking between the electron-correlation and the attosecond responses, which guides us to the correlation-embedded attosecond dynamics in condensed matters.
We write model HamiltoniansMaeshima to describe the one-dimensional periodic solids with finite size , which reads,
| (1) |
for band insulators where the fully non-interacting electrons are considered and corresponds to the staggered crystal potential. And,
| (2) |
for Mott insulators where the electrons are strongly correlated via the Hubbard for the on-site repulsion. The () is the creation (annihilation) operator for an electron with spin at site , the hopping , and the number operator .
After the half-filled ground state is obtained, we perform the time-dependent calculation under a given light-wave by solving the time-dependent Schrödinger equation, , within the 4th-order Runge-Kutta algorithmLee1 . The time-dependence in the Hamiltonian is evolved from the Peierls phaseKaneko , , with a vector potential and the speed of light . To evaluate the absorption spectra, we carry out a real time current densityKaneko ; Sato2 with a current operator . Then, one can obtain the real part of the absorption as,
| (3) |
from the current and electric field with the relation of and the smear parameter . The probe is defined as with to guarantee a linear response.
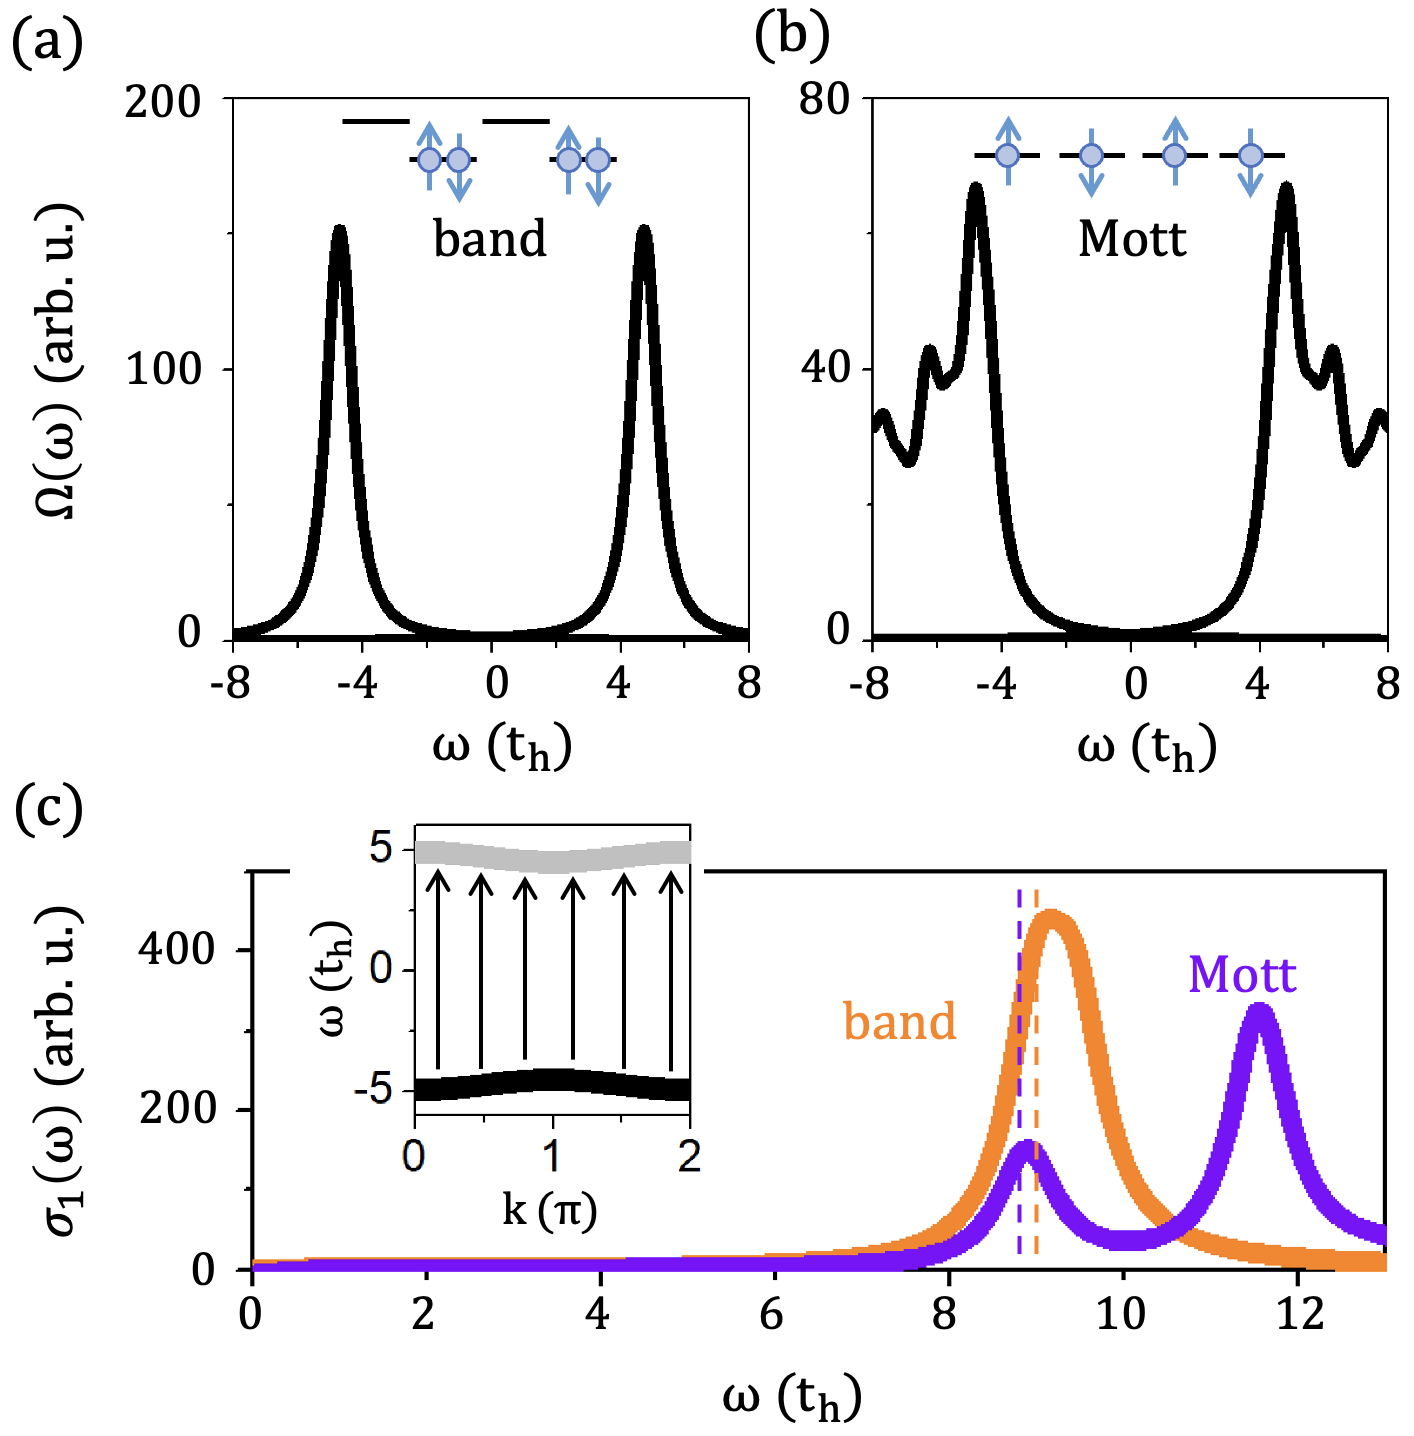
In the Fig.1, we display the ground state properties of the band insulator and the Mott insulator. Under given parameters and , the energy scales represented by the spectral weights have a similar insulating phase to each other as seen from the Fig.1(a),(b). The spectral weights are extracted by the Lehmann representationGora , , and the denotes the ground state eigenvalue corresponding to the ground eigenstate . Strong correlations in the Mott insulator lead to slightly wider bandwidths than that of the band insulator. In the Fig.1(c), the absorptions are found to have the lowest transitions at similar frequencies of band edges, for the band insulator and for the Mott insulator, respectively. Hence the energy scales for ATAS on both systems would be similar to each other.
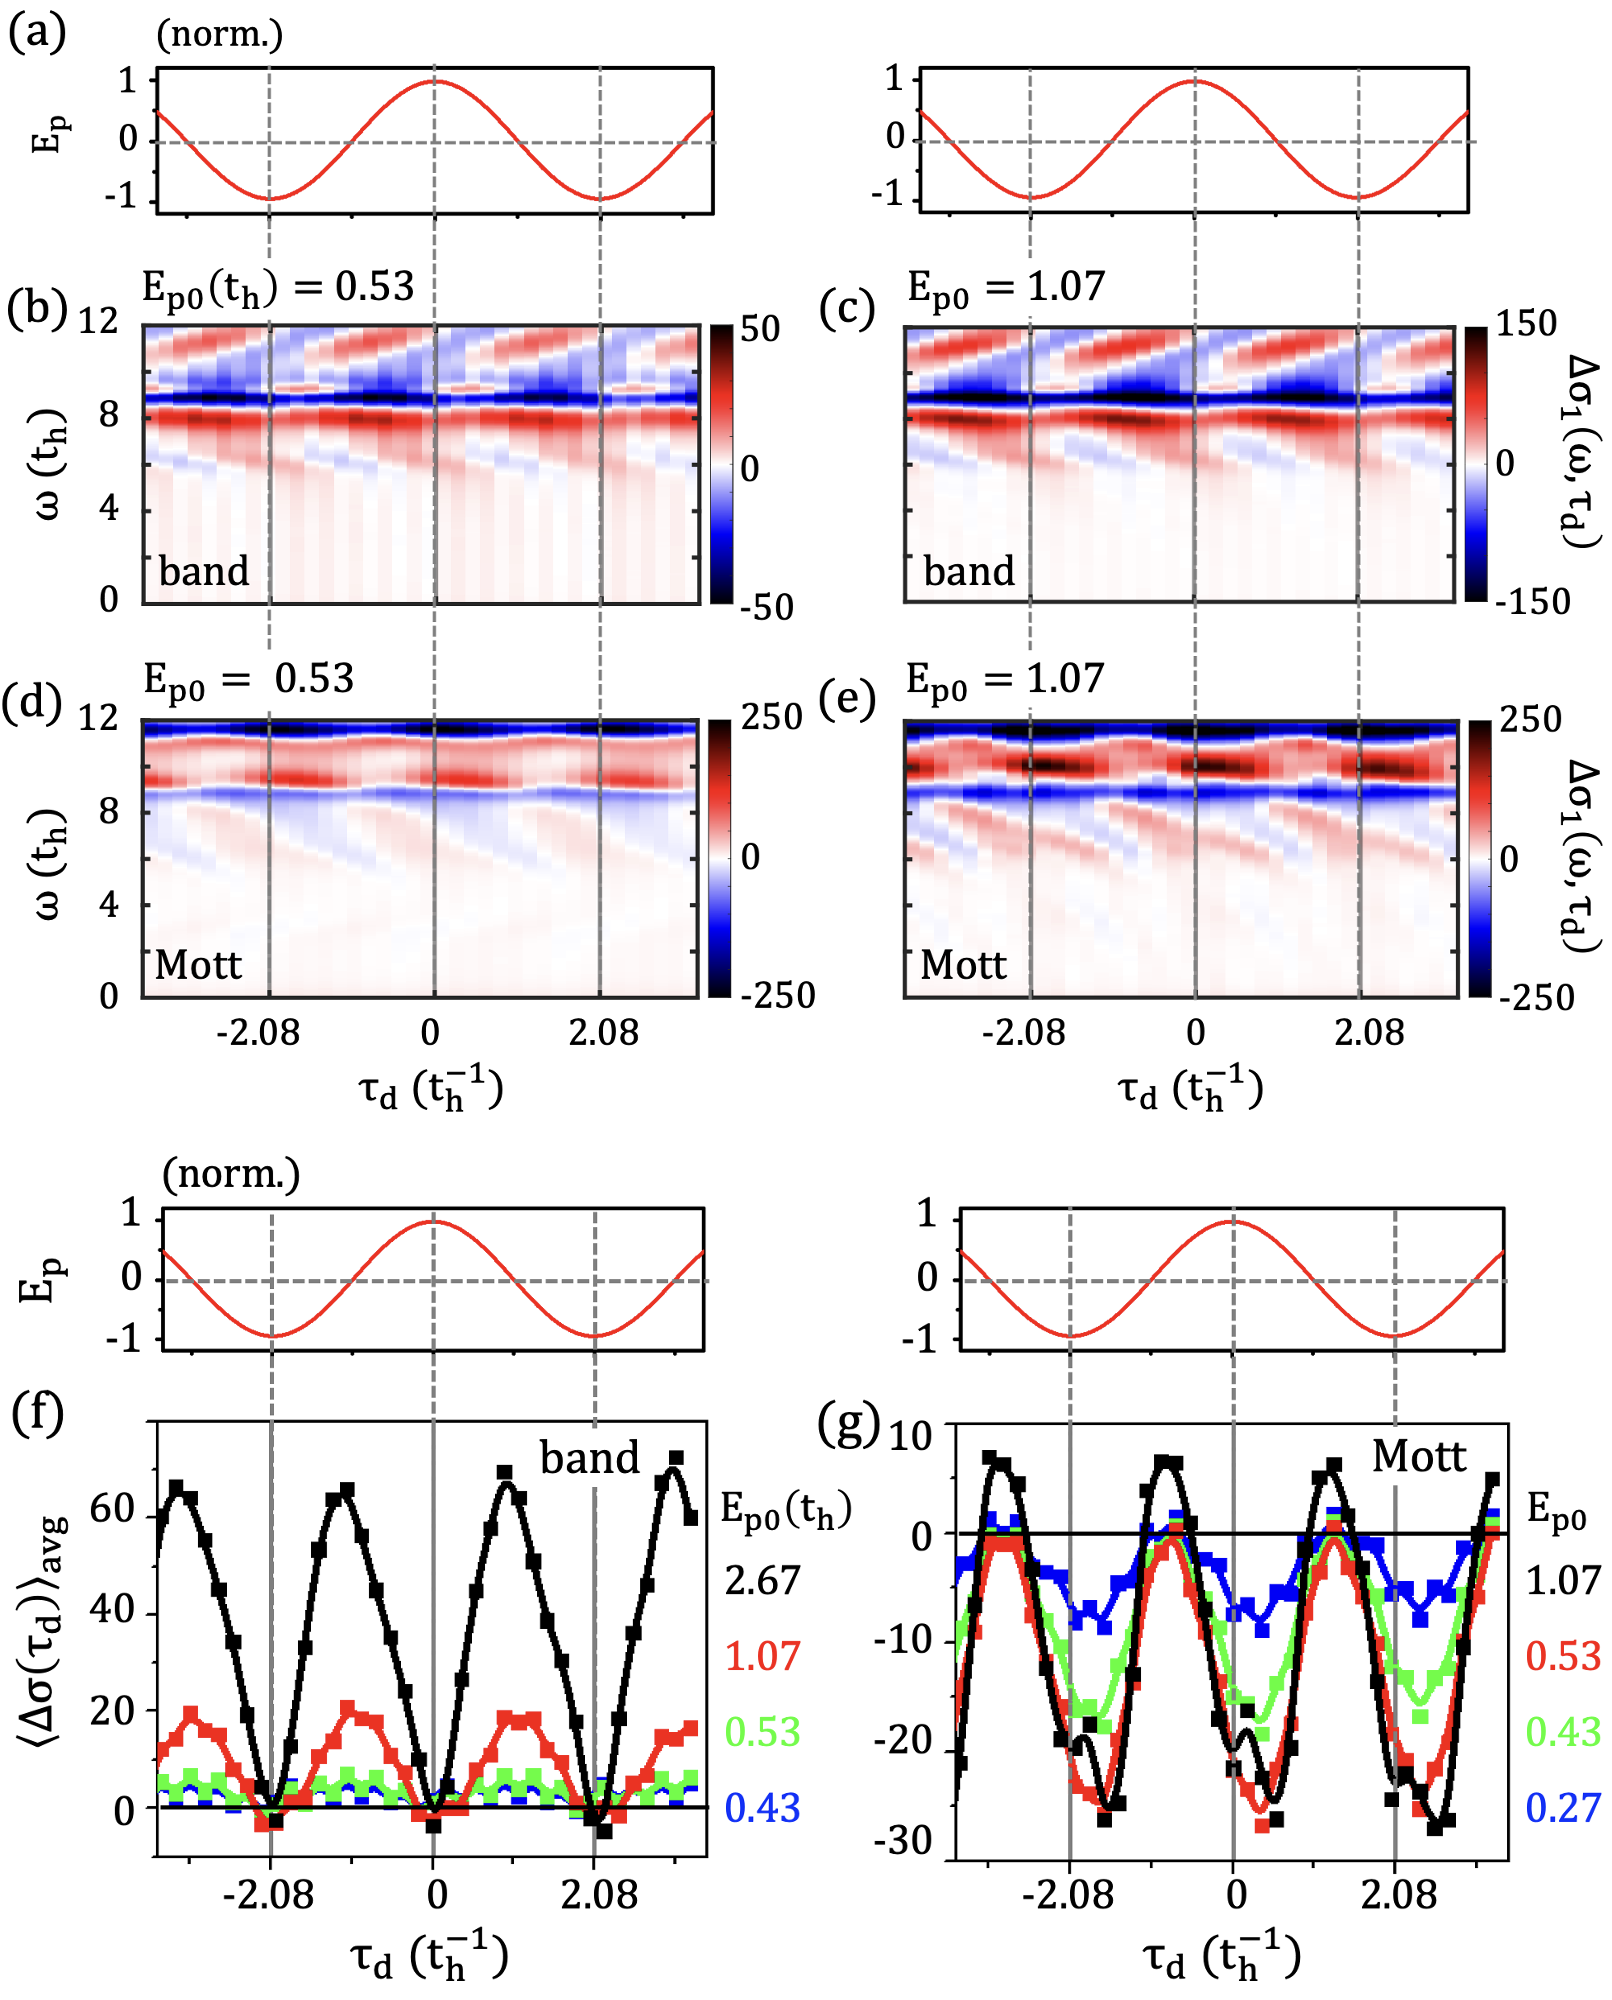
Next, we applied the ATAS to explorer a real time modification in the transient spectra shown in the Fig.2. In the calculation, the vector potential contains both pump and probe fieldSato1 , i.e., with the pump-probe time-delay . The first term describes the single packet of the pump pulse as for and for otherwise. The pump length parameter for an ultrashort pulse is fixed as to include periods of optical cycles in a single packet. The transient current becomes . The should be the current density when the is evolved by the vector potential and similarly, under of the . Finally, the difference spectra of ATAS, which we shall call just ATAS hearafter, is practically obtained asSato1 ,
| (4) |
and the probe electric field is . In Fig.2(a), the time-profile of the pump electric field is shown with a relation . In the Fig.2(b),(c), the ATAS from the band insulator exhibits two properties; (i) the redshift below the band edge and (ii) the fishbone structures, these results typically represent the fingerprint of DFKELucchini2 ; Sato1 ; Otobe1 . In the Fig.2(d),(e), for the Mott insulator, however, the distinctively nontrivial ATAS compared to the band insulator is captured. It is interesting to note that while the fishbone-like structure still appears mimicking the DFKE, a blueshift bearing the negative difference absorption below the band edge is observed. In addition, the responses of the phase oscillations are robust regardless of the field strength of the pump pulse.
In order to deeply understand the dynamics recorded by the ATAS from the Mott insulator in comparison with the band insulator, we show the averaged ATAS below the band edge in the Fig.2(f),(g). In both systems, the results of the averaged ATAS commonly exhibit the -oscillations of its phases in the Mott insulator as does in the band insulator. Furthermore, the phase delays between the ATAS and the pump electric field are found to be out-of-phase, meaning the current responses are primarily governed by the dynamical natureOtobe1 (see the FIGS.1 and 2SM ).
On the other hand, in terms of the sign of spectra, the results clearly distinguish the band insulator and the Mott insulator. The averaged ATAS from the band insulator completely shows a positive sign corresponding to the DFKE, since there are allowed probe channels assisted by the pump, as shown in the Fig.2(f). In contrast, in the Mott insulator in the Fig.2(g), it is remarkable that the averaged ATAS has a mostly negative sign, which does not obey the DFKE. Therefore, we would emphasize the unconventional ATAS found in the Mott insulator is observed to be nontrivial and thus, it is necessary to establish the underlying physics when the pure electron-correlation is incorporated into the ATAS.
When the electric field strength is more strongly enhanced, the phase delay of the band insulator gradually decreases and becomes in-phase, which is featured in the adiabatic regime (see the FIGS.2SM ). In the Mott insulator, however, the phase delay in this regime () cannot be simply defined. Since the structureless signals are introduced by the strong electron-correlations, the adiabatic responses of the FKE would not be monitored in the Mott insulator(see the FIGS.2 and 3SM ).
As seen from the Figs.2, the important feature separating the band insulator and the Mott insulator is the sign of the ATAS below the band edge. Thus we establish the relevant dynamical links between the sign of ATAS and the electron-correlation. We apply the decomposed calculation of the ATAS for the Mott insulator shown in the Fig.3. In the Fig.3(a), the eigenvalues of th index, , with corresponding eigenstates following the are depicted. As the index increases, the eigenvalue also continuously increases. As seen in the previous studyLee1 , one can see some discontinuous points dividing the groups of eigenstates with respect to the number of double occupancies. Therefore, the , , , and so on correspond to the groups containing the eigenstates with a given number of double occupancies; , , , and so on, respectively. To investigate the main transition pathways related to the number of double occupancies, we compute the transition rate between decomposed eigenstates, with indicating each group, i.e., , , and , as shown in the Fig.3(b). From the results, the significant transition pathways are observed to mostly include the and . The pathways containing the or higher terms should be rarely important in the present dynamics. Therefore, we will mainly focus on the transition pathways made of and as displayed in the Fig.3(c). The transition between the and should accompany the change in number of double occupancies, while the others conserve their numbers. One can consequently decompose the ATAS into the three transition groups: first, transitions comprising the number-conserved double occupancy (- and -), and second, transitions comprising the number-changed double occupancy (-), respectively.
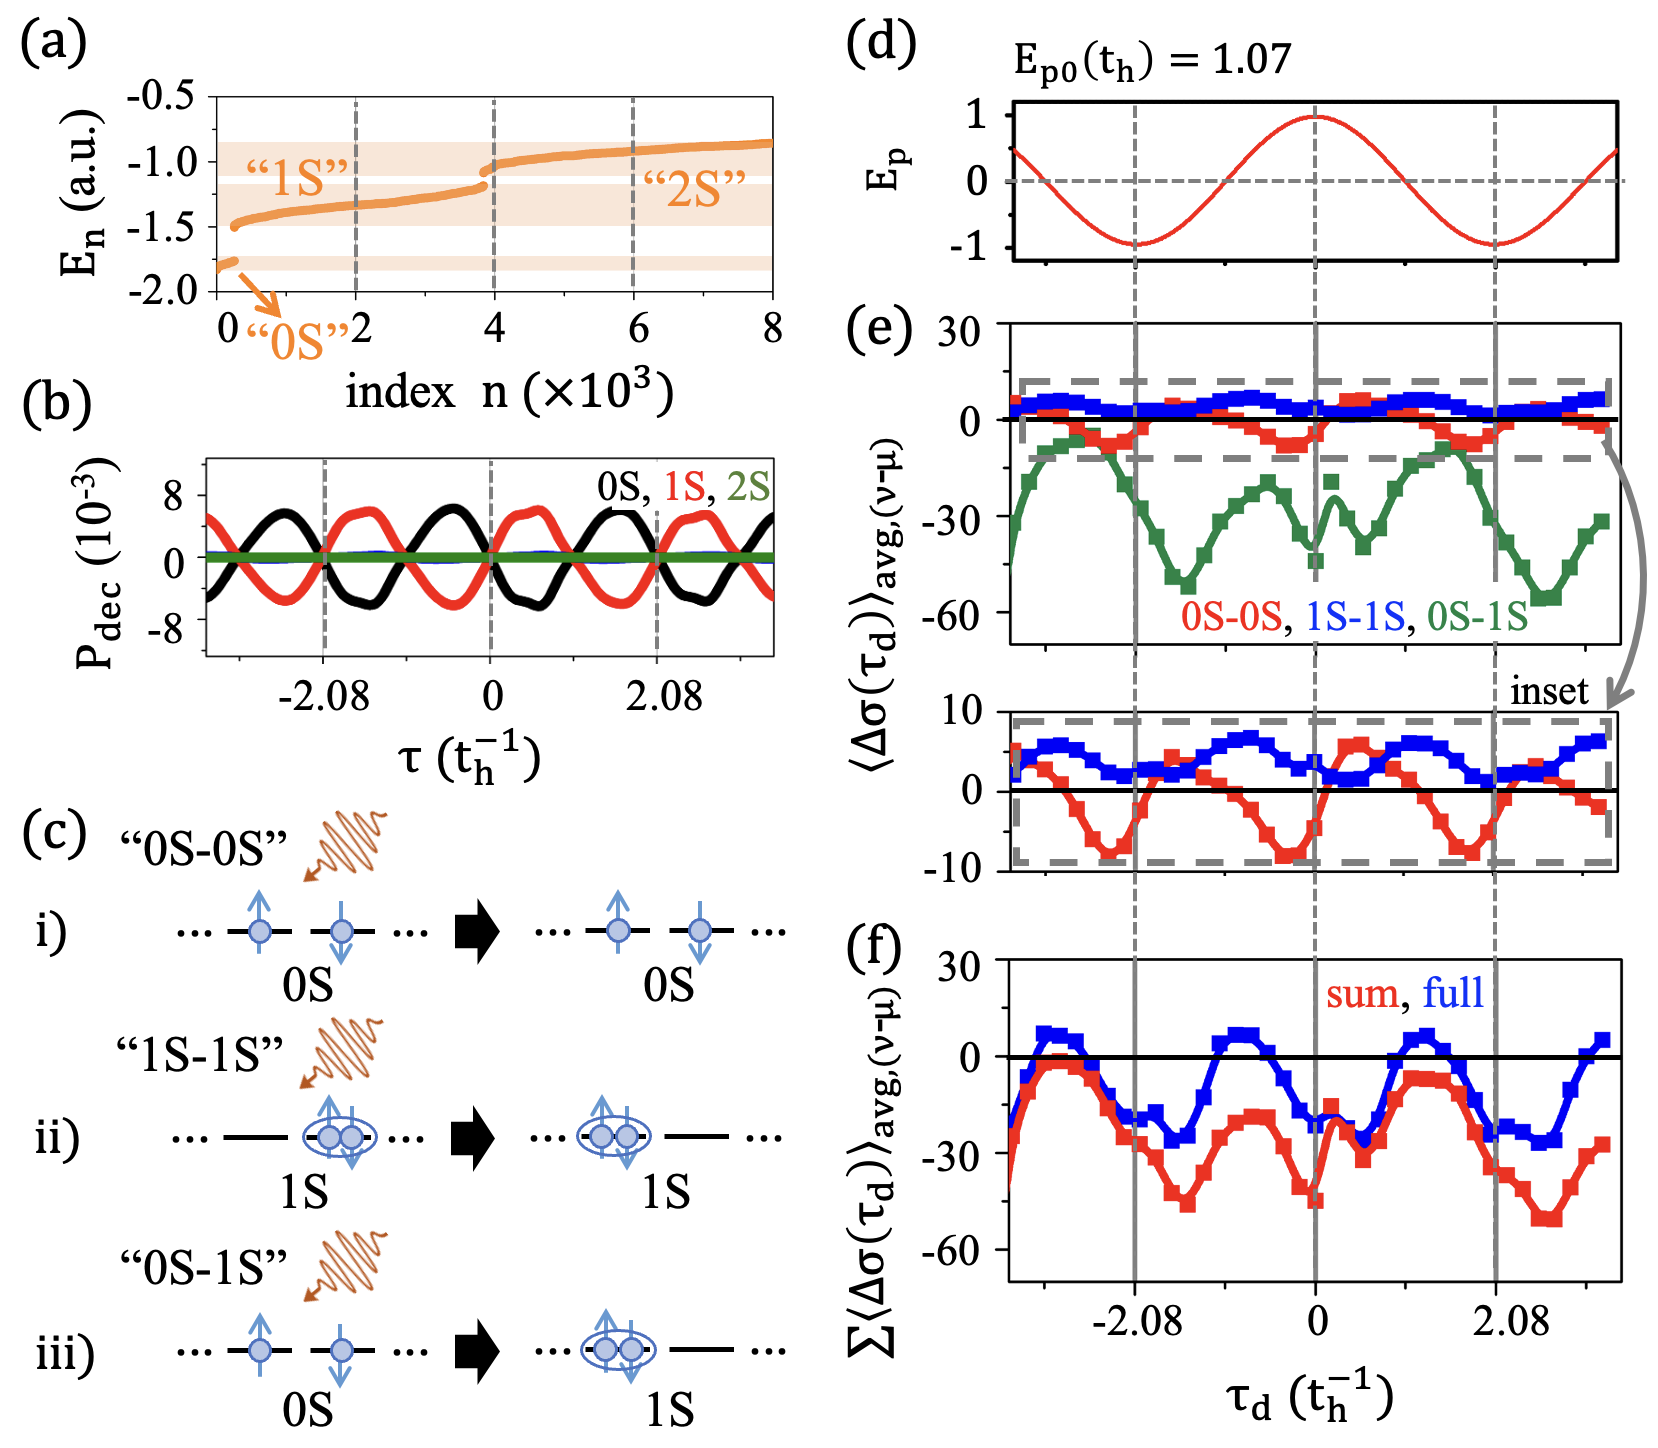
From the above discussion, one can define the decomposed ATAS by following the new current operator on the basis of , we have
| (5) |
with and belonging to the groups; and , that is, the number-conserved parts will be and , and the number-changed part . From the results of , the decomposed ATAS can be rewritten as follows, and eventually, the averaged decomposed ATAS can be computed. In the Fig.3(e), we represent the of - for -, -, and -. It is worth noting that the ATAS induced from the - and - are found to show partially positive and fully positive signs. In contrast, the transitions for - become special pathways since the strong electron-correlation brings about change in many-body energies equivalent to forming a double occupancy. It is discovered that the difference spectra of - dominantly represent the negative sign, which entirely reproduces the full calculation (see the Fig.3(f)). As a result, we note that these pathways including - mainly give rise to the negative sign to be the signature of the creation and the annihilation of double occupancy, clearly measured by ATAS.
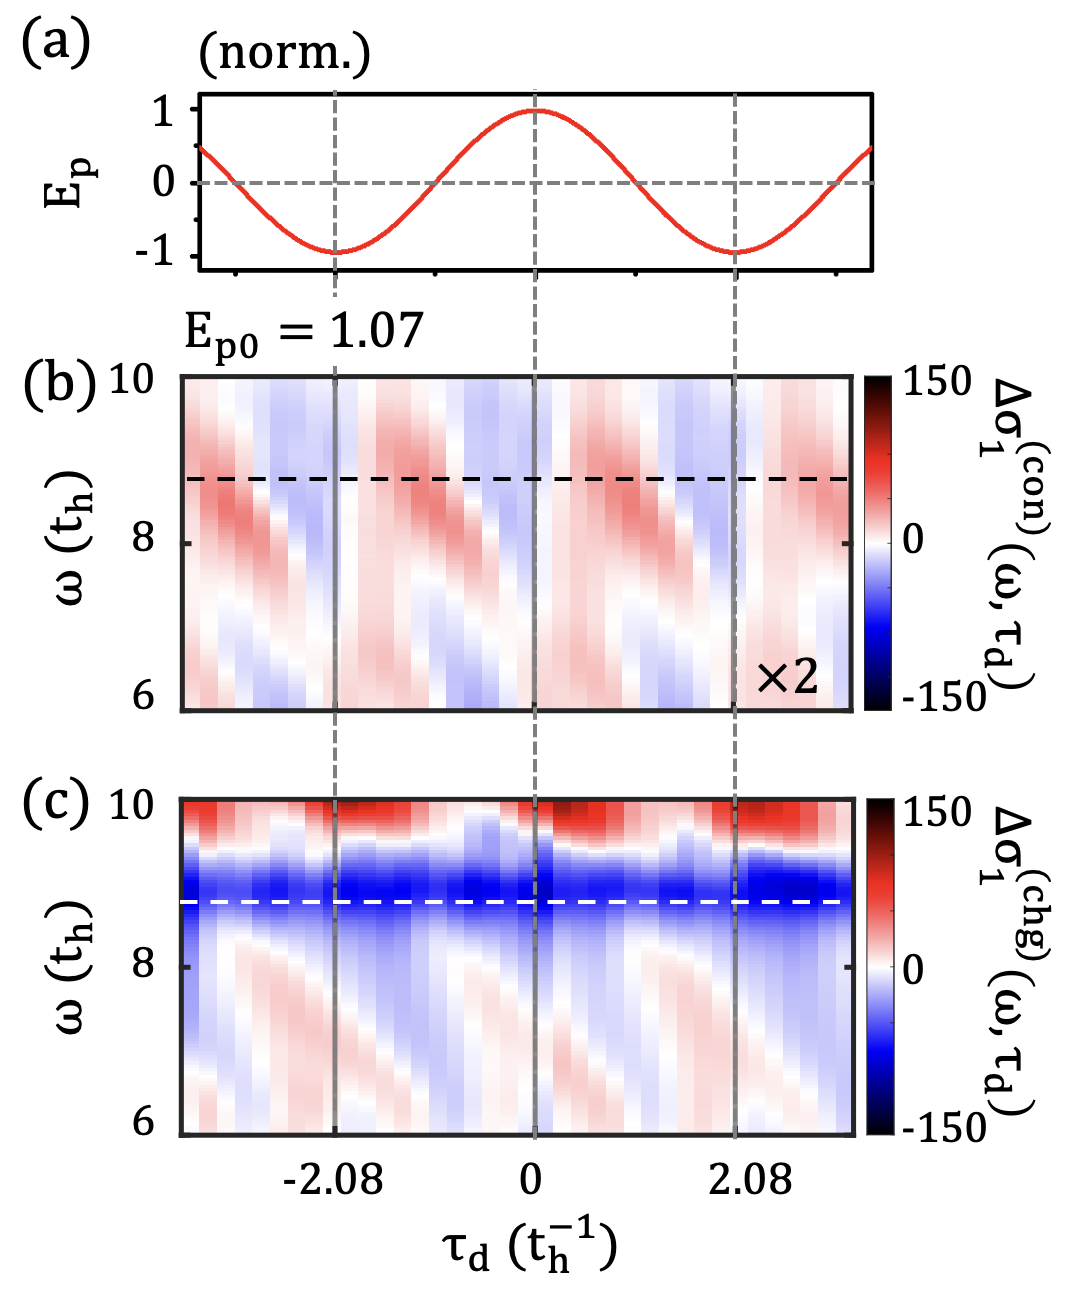
Finally, to support our claims, we plot the decomposed ATAS in the plane as depicted in the Fig.4. In the Fig.4(b), the ATAS of number-conserved transitions is found to have the positive signals below the band edge and the out-of-phase, which partially represents a feature of the DFKE as given in the Fig.2(b),(c). In the Fig.4(c), however, the ATAS of the number-changed transitions exhibits the highly negative signals below the band edge which quantitatively overwhelms the due to the nontrivial excitations for strong electron-correlationsMeinders ; Kim (see the FIGS.4SM ). In addition, the silhouette of the Fig.4(c) also qualitatively reproduces the result of the full calculation.
In summary, we report the ATAS from band insulators and Mott insulators. In the band insulators, as commonly expected, the trivial responses are found accompanying the redshift below the band edge and the fishbone structures. In the Mott insulator, however, where the system is associated with pure electron-correlation, the unconventional ATAS are observed to show the blueshift below band edge which violates the DFKE, but the fishbone-like structures still exist. It is also found that the transitions for the creation and the annihilation of double occupancy evidently contribute to the unconventional difference spectra leading to the blueshift. Our study to establish the unconventional ATAS, incorporating the pure electron-correlation, guides us to a novel insight about correlation-embedded attosecond electron dynamics in condensed matters.
Acknowledgement
We are grateful to J. D. Lee for the fruitful discussion.
The authors thank the computational support from the Center for Advanced Computation (CAC) at Korea Institute for Advanced Study (KIAS).
In this study, Y.K. supported by a KIAS Individual Grant (PG088601) at Korea Institute for Advanced Study (KIAS).
∗ Corresponding author: ykim.email@gmail.com
References
- (1) R. Kienberger, E. Goulielmakis, M. Uiberacker, A. Baltuska, V. Yakovlev, F. Bammer, A. Scrinzi, Th. Westerwalbesloh, U. Kleineberg, U. Heinzmann, M. Drescher, and F. Krausz, Nature 427, 817–821 (2004).
- (2) A. L. Cavalieri, N. Müller, Th. Uphues, V. S. Yakovlev, A. Baltuška, B. Horvath, B. Schmidt, L. Blümel, R. Holzwarth, S. Hendel, M. Drescher, U. Kleineberg, P. M. Echenique, R. Kienberger, F. Krausz, and U. Heinzmann, Nature 449, 1029–1032 (2007).
- (3) F. Krausz and M. Ivanov, Rev. Mod. Phys. 81, 163 (2009).
- (4) M. Lucchini, S. A. Sato, G. D. Lucarelli, B. Moio, G. Inzani, R. Borrego-Varillas, F. Frassetto, L. Poletto, H. Hübener, U. D. Giovannini, A. Rubio, and M. Nisoli, Nat. Commun. 12, 1021 (2021).
- (5) M. Holler, F. Schapper, L. Gallmann, and U. Keller, Phys. Rev. Lett. 106, 123601 (2011).
- (6) H. Wang, M. Chini, S. Chen, C.H. Zhang, F. He, Y. Cheng, Y. Wu, U. Thumm, and Z. Chang, Z. Phys. Rev. Lett. 105, 143002 (2010).
- (7) E. Goulielmakis, Z.-H. Loh, A. Wirth, R. Santra, N. Rohringer, V.S. Yakovlev, S. Zherebtsov, T. Pfeifer, A. M. Azzeer, M. F. Kling, S. R. Leone, and F. Krausz, Nature 466, 739–743 (2010).
- (8) M. Chini, B. Zhao, H. Wang, Y. Cheng, S. X. Hu, and Z. Chang, Phys. Rev. Lett. 109, 073601 (2012).
- (9) L. Drescher, M. J. J. Vrakking, and J. Mikosch, J. Phys. B: At. Mol. Opt. Phys. 53 164005, 9 (2020).
- (10) S. A. Sato, H. Hübener, U. D. Giovannini, and A. Rubio, Appl. Sci. 8(10), 1777 (2018).
- (11) M. Schultze, K. Ramasesha, C.D. Pemmaraju, S.A. Sato, D. Whitmore, A. Gandman, J. S. Prell, L. J. Borja, D. Prendergast, K. Yabana, D. M. Neumark, S. R. Leone, Science 346, 1348-1352 (2014).
- (12) H. Mashiko, K. Oguri, T. Yamaguchi, A. Suda, and H. Gotoh Nat. Phys. 12, 741–745 (2016).
- (13) F. Schlaepfer, M. Lucchini, S. A. Sato, M. Volkov, L. Kasmi, N. Hartmann, A. Rubio, L. Gallmann, U. Keller, Nat. Phys. 14, 560–564 (2018).
- (14) M. Zürch, H.-T. Chang, L. J. Borja, P. M. Kraus, S. K. Cushing, A. Gandman, C. J. Kaplan, M. H. Oh, J. S. Prell, D. Prendergast, C. D. Pemmaraju, D. M. Neumark, and S. R. Leone, Nat. Commun. 8, 15734 (2017).
- (15) Y. Yacoby, Phys. Rev. 169, 610–619 (1968).
- (16) A. P. Jauho and K. Johnsen, Phys. Rev. Lett. 76, 4576–4579 (1996).
- (17) F. Novelli, D. Fausti, F. Giusti, F. Parmigiani, and M. Hoffmann, Sci. Rep. 3, 1227 (2013).
- (18) T. Otobe, Y. Shinohara, S. A. Sato, and K. Yabana, Phys. Rev. B 93, 045124 (2016).
- (19) D. Goldhaber-Gordon, J. Göres, M. A. Kastner, H. Shtrikman, D. Mahalu, and U. Meirav, Phys. Rev. Lett. 81, 5225 (1998).
- (20) M. Du, C. Liu, Y. Zheng, Z. Zeng, and R. Li, Phys. Rev. A 100, 043840 (2019).
- (21) M. Lucchini, S. A. Sato, A. Ludwig, J. Herrmann, M. Volkov, L. Kasmi, Y. Shinohara, K. Yabana, L. Gallmann, U. Keller, Science 353, 6302 (2016).
- (22) M. Lucchini, S. A. Sato, F. Schlaepfer, K. Yabana, L. Gallmann, A. Rubio, and U. Keller, J. Phys.: Photonics 2 025001 (2020).
- (23) W. Franz, Z. Naturforschung 13a, 484 (1958).
- (24) L. Keldysh, J. Exptl. Theoret. Phys. 33, 994 (1957).
- (25) R. E. Nahory and J. L. Shay, Phys. Rev. Lett. 21, 1569 (1968).
- (26) K. Tharmalingam, Phys. Rev. 130, 2204 (1963).
- (27) N. Tancogne-Dejean, M. A. Sentef, and A. Rubio, Phys. Rev. B 102, 115106 (2020).
- (28) N. Maeshima and K. Yonemitsu, Journal of Physics: Conference Series 21, 183–188 (2005).
- (29) J. D. Lee and J. Inoue, Phys. Rev. B 76, 205121 (2007).
- (30) T. Kaneko, T. Shirakawa, S. Sorella, and S. Yunoki, Phys. Rev. Lett. 122, 077002 (2019).
- (31) S. A. Sato, H. Hirori, Y. Sanari, Y. Kanemitsu, and A. Rubio, Phys. Rev. B 103, L041408 (2021).
- (32) D. Góra and K. Rosciszewski, J. Phys.: Condens. Matter 8, 8995 (1996).
- (33) See Supplemental Material at http://link.aps.org/ for more details.
- (34) M. B. J. Meinders, H. Eskes, and G. A. Sawatzky, Phys. Rev. B 48, 3916 (1993).
- (35) Y. Kim and J. D. Lee, npj Comp. Mater. 6, 132 (2020).