75282
Pitfalls of AI classification of rare objects††thanks: Adapted from Pearson et al. (2022)
Abstract
Galaxy mergers are hugely important in our current dark matter cosmology. These powerful events cause the disruption of the merging galaxies, pushing the gas, stars and dust of the galaxies resulting in changes to morphologies. This disruption can also cause more extreme events inside the galaxies: periods of extreme star formation rates and the rapid increase in active galactic nuclei activity. Hence, to better understand what goes on in these rare events, we need to be able to identify statistically large samples.
In the last few years, the growth of artificial intelligence techniques has seen application to identifying galaxy mergers. These techniques have shown to be highly accurate and their application has grown beyond academic studies of “can we?” to deeper scientific use. However, these classifications are not without their problems.
In this proceedings, we will explore how galaxy merger classification can be improved by adding pre-extracted galaxy morphologies alongside the traditional imaging data. This demonstrates that current neural networks are not extracting all the information from the images they are given. It will also explore how the resulting samples of rare objects could be highly contaminated. This has a knock on impact on the upcoming large scale surveys like Euclid and Rubin-LSST.
keywords:
Galaxies: interactions – Galaxies: evolution – Methods: data analysis – Galaxies: statistics1 Introduction
Galaxy mergers underpin out current understanding of how galaxies grow and evolve. In the current dark matter paradigm, dark matter halos grow hierarchically. These halo mergers result in the galaxies in their centres also merging. This results in a single, larger dark matter halo containing a single, larger galaxy.
These interactions cause changes to the galaxy. Tidal forces involved cause material to move in the interacting galaxies. This results in morphology changes, including the creating of tidal tails or bridges. The tidal forces can also move material to the centre, triggering active galactic nuclei activity (e.g Keel et al., 1985; Silverman et al., 2011; Gao et al., 2020) or shock the gas and trigger extreme star-formation (e.g. Joseph & Wright, 1985; Ellison et al., 2013; Pearson et al., 2019).
Merger rates are not constant in the Universe, with more mergers found in the younger Universe. This is seen both in observations and in simulations, although there are disagreements in how the merger rate evolves (e.g. Kartaltepe et al., 2007; Conselice et al., 2008; Lotz et al., 2008; Conselice et al., 2011; Bluck et al., 2012; Cotini et al., 2013; Rodriguez-Gomez et al., 2015; Qu et al., 2017; Pearson et al., 2019; O’Leary et al., 2021). These disagreements may be a result of using a fixed merger timescale when a variable timescale is more applicable (Snyder et al., 2017).
To better understand galaxy mergers, large samples are required. Visual identification, often considered the most reliable method, is slow and time consuming. Mergers can also be identified with morphological parameters, such as Gini or M20 or identifying galaxies close on the sky and in redshift. With the huge volumes of data expected from upcoming surveys, such as Euclid or Rubin-LSST, machine learning has become an area of interest for merger identification.
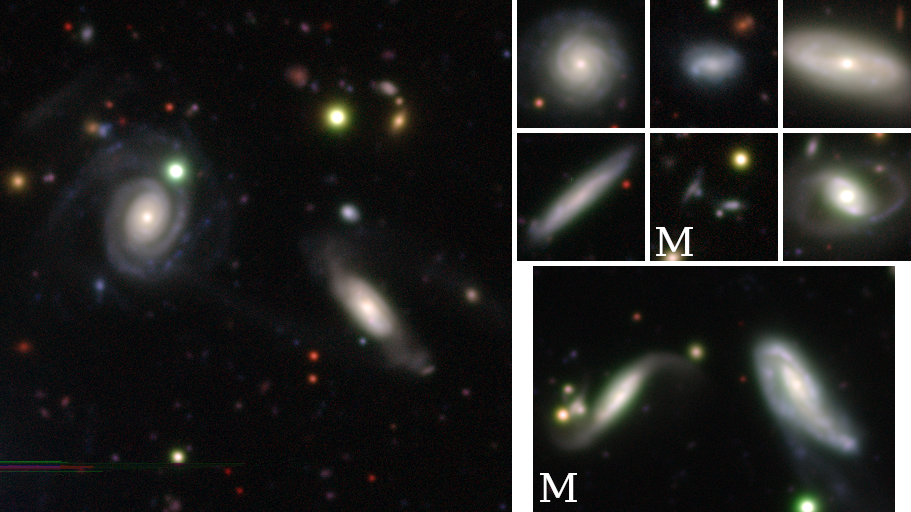
In this proceedings, we will explore how deep learning can be used to identify galaxy mergers in Hyper Suprime-Cam (HSC) Subaru Strategic Program (SSP) and North Ecliptic Pole (NEP) imaging, such as the images in Fig. 1. It will look at how combining visual-like classification with galaxy morphologies can improve classification. It will also discuss how excellently performing neural networks can have highly contaminated samples of rare objects. As galaxy mergers are a minor class of galaxy in the universe, this misclassification problem has implications for merger studies with these upcoming surveys.
2 Merger identification
We aimed to identify galaxy mergers from HSC data in NEP. This was done using deep learning trained on HSC-SSP images of merging and non-merging galaxies. These were identified in the GAMA-KiDS Galaxy Zoo project and the worst miss-classifications were removed with an asymmetry-smoothness cut. This provided 1683 merging systems at and a further 1683 non-mergers were collected.
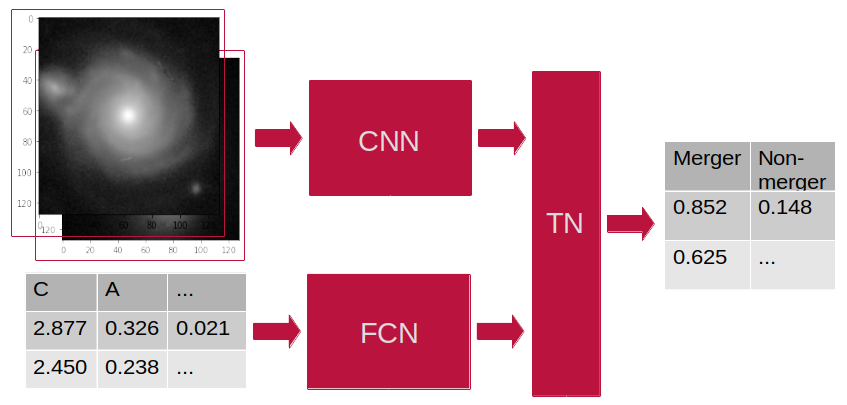
We trained a convolutional neural network (CNN) on the r-band HSC images. This network achieved a loss of 0.473 and accuracy of 79.3% at validation. We further trained a fully connected network (FCN) on the morphologies of the galaxies, extracted from the same r-band images used to train the CNN. The FCN achieved a loss of 0.301 and an accuracy of 88.8% at validation. Full details of the CNN and FCN architectures can be found in Pearson et al. (2022).
As the morphologies can be considered a compression of the images, the better FCN results imply that the CNN cannot extract all the information from the images. It is also possible that the CNN is also finding information that is lost in the compression to morphological parameters. Thus, we join the CNN and FCN together, as shown in Fig. 2 and explained in detail in Pearson et al. (2022), and pass the concatenated CNN-FCN layer into a discriminator (TN). The CNN and FCN were trained before concatenation and the TN was trained without continuing to train the CNN and FCN. This combined network resulted in a loss of 0.260 and accuracy of 91.7% at validation, an improvement over the individual CNN and FCN.
As can be seen from these result, the CNN was unable to extract all the information from the images. The FCN lost information in the compression of the images to morphological parameters, or could not fully exploit the morphologies, or both. The combined CNN-FCN allowed at least some of this lost information to be recovered. At test, the CNN-FCN-TN network achieved an accuracy of 88.4%.
3 Merger misclassification
As well as the network trained at , we also trained a network for galaxies at , using the galaxies, edited to appear as higher redshift galaxies. The statistics for these networks is shown in Table 1.
| Accuracy | 0.884 | 0.850 |
|---|---|---|
| Recall | 0.863 | 0.890 |
| Precision | 0.901 | 0.899 |
| Specificity | 0.905 | 0.911 |
| NPV | 0.869 | 0.812 |
| Total Galaxies | 6965 | 27 299 |
| Non-merger | 5488 | 18 518 |
| Merger-candidate | 1477 | 8718 |
| Confirmed merger | 251 | 1858 |
We apply these networks to 34 264 galaxies in NEP and present the classifications in Table 1 (lower). 10 195 (29.8%) of the galaxies were identified as mergers (merger candidates). These were then visually checked, due to the known imperfect nature of the networks. Of the 10 195 merger candidates, 2109 (20.7%) were identified as true mergers. This misclassification is worse at (1858 of 8718 or 21.3% were true mergers) than at (251 of 1447 or 17.0% were true mergers). As the negative predictive value (NPV) and recall are worse in the higher redshift network, it was expected the higher redshift merger candidate sample would be more contaminated.
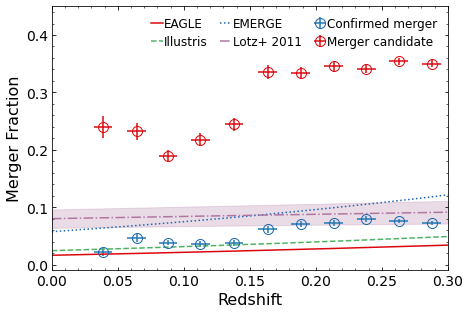
As a simple example of the impact of misclassification, we consider the redshift evolution of the merger fraction in Fig. 3. The merger-candidate merger fraction shows a rapid evolution with redshift which is much higher than the simulation work from EAGLE (Qu et al., 2017), Illustris (Rodriguez-Gomez et al., 2015) and EMERGE (O’Leary et al., 2021). It is also much higher than the Lotz et al. (2011) using mergers selected with traditional methods. The merger fraction for the visually confirmed mergers is inline with other works.
As shown, well trained networks can still produce highly contaminated samples of uncommon or rare astronomical objects. If the classification and contamination rates for galaxy mergers was also found for a sample of galaxies, roughly the expected number of galaxies from Euclid or Rubin-LSST, then galaxies would be identified as mergers of which only would be true mergers. It is impractical to check the merger candidates so care must be taken in the future large scale surveys with how we use the rare object classifications.
4 Conclusions
In this work, we have shown that using both images and morphologies in neural networks improves merger classification. We also demonstrated that networks good at identifying rare classes potentially create highly contaminated samples, which has implications for upcoming large area surveys.
Acknowledgements.
We would like to thank the referee for their thoughtful comments that helped improve the quality and clarity of this proceedings. W.J.P. has been supported by the Polish National Science Center project UMO-2020/37/B/ST9/00466 and by the Foundation for Polish Science (FNP).References
- Bluck et al. (2012) Bluck, A. F. L., Conselice, C. J., Buitrago, F., et al. 2012, ApJ, 747, 34
- Conselice et al. (2011) Conselice, C. J., Bluck, A. F. L., Ravindranath, S., et al. 2011, MNRAS, 417, 2770
- Conselice et al. (2008) Conselice, C. J., Rajgor, S., & Myers, R. 2008, MNRAS, 386, 909
- Cotini et al. (2013) Cotini, S., Ripamonti, E., Caccianiga, A., et al. 2013, MNRAS, 431, 2661
- Ellison et al. (2013) Ellison, S. L., Mendel, J. T., Patton, D. R., & Scudder, J. M. 2013, MNRAS, 435, 3627
- Gao et al. (2020) Gao, F., Wang, L., Pearson, W. J., et al. 2020, A&A, 637, A94
- Joseph & Wright (1985) Joseph, R. D. & Wright, G. S. 1985, MNRAS, 214, 87
- Kartaltepe et al. (2007) Kartaltepe, J. S., Sanders, D. B., Scoville, N. Z., et al. 2007, ApJS, 172, 320
- Keel et al. (1985) Keel, W. C., Kennicutt, R. C., J., Hummel, E., & van der Hulst, J. M. 1985, AJ, 90, 708
- Lotz et al. (2008) Lotz, J. M., Davis, M., Faber, S. M., et al. 2008, ApJ, 672, 177
- Lotz et al. (2011) Lotz, J. M., Jonsson, P., Cox, T. J., et al. 2011, ApJ, 742, 103
- O’Leary et al. (2021) O’Leary, J. A., Moster, B. P., Naab, T., & Somerville, R. S. 2021, MNRAS, 501, 3215
- Pearson et al. (2022) Pearson, W. J., Suelves, L. E., Ho, S. C. C., et al. 2022, A&A, 661, A52
- Pearson et al. (2019) Pearson, W. J., Wang, L., Alpaslan, M., et al. 2019, A&A, 631, A51
- Qu et al. (2017) Qu, Y., Helly, J. C., Bower, R. G., et al. 2017, MNRAS, 464, 1659
- Rodriguez-Gomez et al. (2015) Rodriguez-Gomez, V., Genel, S., Vogelsberger, M., et al. 2015, MNRAS, 449, 49
- Silverman et al. (2011) Silverman, J. D., Kampczyk, P., Jahnke, K., et al. 2011, ApJ, 743, 2
- Snyder et al. (2017) Snyder, G. F., Lotz, J. M., Rodriguez-Gomez, V., et al. 2017, MNRAS, 468, 207