Inverse Magnus Effect Induced by Dilute Water Fog
Abstract
The inverse Magnus effect is a phenomenon in which a spinning sphere experiences a lift force opposite to the conventional Magnus effect. This effect is typically observed in the flow higher than a critical Reynolds number or spin ratio. We experimentally studied the inverse Magnus effect on a spinning sphere in a flow containing suspended micrometer size droplets. The lift force was measured by injecting droplets into a closed return wind tunnel. We investigated the threshold of the inverse Magnus effect for several types of dispersed droplets. Our results indicate that the flow with suspended water droplets significantly affects the onset of the inverse Magnus effect, causing a decrease in the critical Reynolds number and spin ratio.
I Introduction
It is well known that a sphere or cylinder spins in a uniform flow about an axis perpendicular to the flow subjected to the Magnus effectmagnus . When the fluid flows from left to right and the rotation of a sphere is clockwise (hereafter, we refer to the rotation of this direction as backspin and the opposite rotation as topspin.), the effect gives a lift force.
Understanding the motion of a spinning projectile is very important for ball gamesDavies ; nathan ; Mehta as well as for aeronautics 10.1115/1.4023434 ; swanson ; SEIFERT201217 , particle saltationwhite_schulz_1977 , and passing time on a riverbank rosellini_hersen_clanet_bocquet_2005 ; PhysRevLett.94.174501 ; Hurd:2019aa . The Magnus effect has therefore attracted much interest and it is still an active area of researchdoi:10.1119/10.0004981 ; PhysRevE.99.012902 . However, less known is that, at a certain condition, the direction of the force is reversed relative to the conventional Magnus effect. This counter-intuitive phenomenon is referred as the inverse/negative Magnus effectlafay ; maccoll_1928 ; taneda , and occurs only at Reynolds number (, where is the flow velocity, is the sphere diameter, is density of air and is viscosity) and spin ratio (, where is the angular velocity). It is experimentallykim_choi_park_yoo_2014 and numericallydoi:10.1063/1.3673571 revealed that the inverse Magnus effect is associated with a displacement of separation line towards the rear of the sphere, which occurs differently along the advancing and retreating sides. Therefore, the onset of inverse Magnus effects is strongly influenced by several factors such as the surface roughness or material of the sphereLyu:2020aa ; Sakib:2020aa .

In the present paper, we focus on the effect of suspensions dispersed in the flow to the lift force on the spinning sphere and report that the distribution of micro-meter size water droplets significantly alters the onset of inverse Magnus effect. Although, to the best of our knowledge, this has not been reported in the literature, soft tennis players empirically know that the lift force tends to reverse in a thick fog environment. Players call this phenomenon “Fuku” in Japanesemaeda . We perform a wind tunnel experiment on a spinning sphere in a flow with various micrometer sized droplets. Our result revealed that the negative Magnus effect occurs at a smaller Reynolds number and spin ratio exclusively when the flow contains dispersed water droplets, i.e., fog. Comparative experiments involving fogs composed of different liquids suggest that droplet charging may contribute to inducing the inverse Magnus effect. We present a new phase diagram for the inverse Magnus effect in the presence of fog. We also discuss how the electric charge of water droplets affect flow around the separation line.
II Apparatus and methods
II.1 Experimental setup and lift force measurement
Figure 1 depicts the experimental setup utilized in this study. The experiments were conducted within a test section [Fig.1(a)] composed of acrylic glass in a closed return wind tunnel [Fig.1(b)]. The maximum wind speed in the test section was 30 m/s, and the turbulence level was less than 1.0%. A foaming polystyrene sphere with a diameter of 60 mm and weight of 2.1 g was employed as the test ball. The ball was affixed in the test section using a stainless shaft with a diameter of 5 mm supported by a pair of pillars on an steel plate. A brushless DC motor (Oriental motor, BLM230HP-ACS) was mounted on the plate and connected to the shaft by a coupling. The motor driver (Oriental motor, BMUD30-A2) regulated the angular velocity of the ball within the range of 50-4000 rpm. The vibration of the ball due to the rotation was suppressed to less than 1% of the ball’s diameter. The stainless shaft penetrated through the ball and the test section without contacting the wind tunnel’s walls. Thus, the lift force on the ball was measured by monitoring the change of the load under the base plate.

The base plate was supported by three load cells (Kyowa, LMB-A-10N), enabling us to measure the weight of the equipment. The load was sampled at a frequency of 10 Hz, and the resolution is approximately 0.05 N for the typical experimental condition ( and ). The magnitude of the steady-state load was measured by averaging the time series data over 60 seconds to remove the influence of the vibration due to the rotation of the sphere. We measured the lift force without the sphere and confirmed that the influence of the shaft on the lift force is negligible.
The flow velocity was measured from the pressure difference before and after the contraction of the wind tunnel. Our experiments covered the range of Reynolds numbers () and spin ratios () of – and – , respectively.

II.2 Droplet diameter, density and electric charge measurements
In the experiment, we dispersed micrometer sized distilled water droplets into the wind tunnel using a spray nozzle (AKIMist® “E”, Ikeuchi Co.,Ltd.). For comparison, we also employed polyethylene glycol (PG) from a smoke machine (ANTARI Z-1000II), and dioctyl sebacate (DOS) oil from a Laskin nozzle (Seika). We determined the size distributions of these droplets directly from microscopy images of droplets trapped in silicon oil on a glass plate. Fig. 2 shows size distribution and microscopy image of droplets. The average diameters of water and PG droplets are 12 m and 28 m, respectively. Although we could not measure the distribution of DOS droplets due to their small size, the average size of droplets generated by a Laskin nozzle is mlaskin_dis .
The droplets introduced into the wind tunnel are agitated by the rotation of the wind tunnel fan before it reaches the test section as shown in Fig.1(b). Hence, the dispersion of the fog is uniform around the sphere. The number density of droplets, denoted by , was estimated from the intensity of the laser light scattered by the droplets. A green laser with a wavelength of nm and intensity mW was injected into the test section. The side scattering intensity was captured by a CMOS camera (Player-one, Apollo-M). Since the size of droplets is significantly larger than the wave length, the light undergoes Mie scattering. Neglecting quadratic scattering, the luminance of the laser trajectory in the image, , is proportional to both and . To calibrate the relationship between and , we used a laser pulse of duration s to photograph droplets within a volume under a microscope, and directly counted the droplets.
The estimation obtained from light scattering data indicates that the number density, , reaches a steady-state value within several tens of seconds after injecting the fog. Figure 3 illustrates the relationship between the terminal value of and wind speed. It should be noted that we cannot control the density in this experiment. It decreases with increasing flow speed. This is because the water droplets get trapped and lost as they pass through the fan in the wind tunnel. The plot in Fig. 3 shows decreases proportionally with , as the number of droplets that vanish is proportional to the product of the number of times a droplet passes through the fan per unit time and the rotation speed of the fan.
We evaluated the electric charge of droplets by analysing their movement in an oscillating electric field. A schematic view of the experimental setup is depicted in Fig. 4(a). We employed parallel aluminum plates, spaced apart by a distance of cm for electrodes, on which we applied a sinusoidal voltage with a frequency of Hz and the peak-to-peak amplitude of volts. The fog was introduced between the electrodes, and the droplet’s trajectories were recorded by capturing the light scattered with a microscope. The depth of field of our imaging optics is about 1 mm. Figs. 4(b-d) are the trajectories of Water, DOS, and PG droplets, respectively. The water droplets displayed oscillations, whereas the motion of DOS and PG droplets remained unaffected by the electric field. The average amplitude of the motion of water droplets was measured to be µm. Assuming Stokes’ formula, we could determine the electric charge based on the amplitude and the droplets’ mass. Our observations indicated that the water droplets generated from the spray nozzle had an average charge of roughly C, while no charge was detected in the PG and DOS droplets.
We summarise the typical parameters in our experiments in Table 1.
| Reynolds number | Re | [-] | |||
| Spin ratio | [-] | to | |||
| Stokes number | St | [-] | |||
| Droplet number density | [cm-3] | ||||
| Droplet volume fraction | [-] | ||||
|
[m] | ||||
|
[C] |

III Results and discussion
III.1 Transition to the inverse Magnus effect
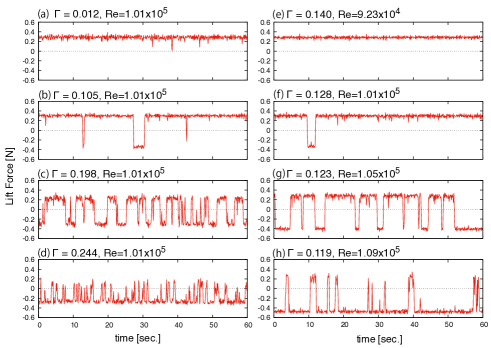
Figure 5 displays the lift force acting on the sphere in steady flow without fog injection for various Re and . The sphere is subjected to topspin, where a positive/negative lift value corresponds to the conventional/inverse Magnus effect, respectively. We observe a discontinuous change in the lift force, indicating a transition between the conventional and inverse Magnus effects. This transition occurs intermittently without characteristic periods, and its frequency increases with higher values of Re and . These result suggest the presence of a bistable regime within a specific range of the Re- plane, where the lift force exhibits both positive and negative values under the same conditions.

Figure 6 shows velocity contours and vectors on the advancing side of a sphere in topspin. These images were obtained by averaging the flow over a 30-second duration using the particle image velocimetry (PIV) method. When the sphere experiences the conventional Magnus effect [Fig. 6(a)], an upward wake is observed, which is consistent with the downward lift force acting on the sphere. In Fig. 6(b), the flow at a higher Reynolds number is depicted, clearly demonstrating the stable occurrence of the inverse Magnus effect. The distinct downward wake suggests the presence of an upward lift force. The change in the wake’s orientation is accompanied by a sharp increase in the separation angle . Our PIV analysis showed that the increase in approximately form to . These observations are consistent with Refs. doi:10.1063/1.3673571 and kim_choi_park_yoo_2014

III.2 The effect of fog
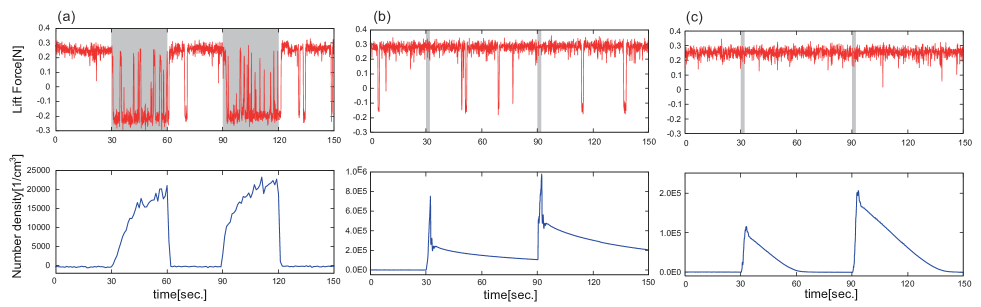
Figure LABEL:fig:magnanimousness displays the time series of lift force measurements over a period of 150 seconds. The various fogs were injected into the wind tunnel starting at and (the injection period is different for each fogs and is indicated by the gray background in the figure). We note that the behaviour of density decay varies for each droplet due to their distinct wetting properties against the fan and inner walls of the wind tunnel. The simultaneous plot of the density is given in the lower row of the Fig. LABEL:fig:magnanimousness. The Reynolds number and spin ratio were and , respectively. In the absence of injected fog, these conditions ensure the stability of the conventional Magnus effect. Fig. LABEL:fig:magnanimousness(a) demonstrates that the inverse Magnus effect is only stable when water fog is injected. In this case, the lift force value turns negative within a second after injecting water fog and returns to a positive value a few seconds after the injection stops. In figs. LABEL:fig:magnanimousness(b,c), the injection of DOS or PG smoke has no effect on the lift force.
Figure 8 shows the lift force as a function of spin rate for various Reynolds numbers, with and without water fog injection. The data points represent the mean lift force over a period of 60 seconds of measurement, while the error bars indicate the standard deviation. We mention that the gradual decrease in the lift force with respect to is attributed to the intermittent occurrence of the transition to the inverse Magnus effect during the measurements. At , the plots under fog injection exhibit a slightly smaller value than those under ”dry” condition for . The difference becomes more pronounced as the Reynolds number increases. For , the lift force under fog injection is clearly less than in the ”dry” condition. For , the inverse Magnus effect is stable at , leading to the convergence of both plots into the same curve. In Figs.8, the average lift force varies continuously from positive to negative values, indicating that the transition from the conventional to the inverse Magnus effect is intermittent, and the transition occurs more frequently with increasing and .
Figure 9 displays the region of the inverse Magnus effect obtained from measurements of the lift force, both with and without water fog injection 111 In Fig. 9, the region of the inverse Magnus effect in the Re- plane is found at the lower value of compared to that reported by Kim et al. This is probably because the foaming polystyrene sphere we used in the present experiment has a rougher surface than the sphere used in the previous study. On rough surfaces, the separation lines tend to recede more, which can lead to the appearance of the inverse Magnus effect at smaller values of the spin ratio. . The horizontal axis is the spin ratio and the vertical axis is the Reynolds number. Below , the region of the inverse Magnus effect with fog injection expands towards the low-spin-ratio side. In the experiments conducted without fog, the lower limit of Reynolds number at which the inverse Magnus effect occurs is about , however, when fog is present, this lower limit decreases to .

III.3 Discussions
We found that the onset of the inverse Magnus effect was affected solely by the presence of water droplets in the flow. Prior to discussing the possible reasons for this, it is worth noting that the density of the droplets are so dilute that effective viscosity and density of the fog are nearly indistinguishable from those of dry air. The typical volume fraction of water droplets in the experiment is up to , with an effective density increase of about 1%. For viscosity, the Einstein equation gives that the effective viscosity is only 0.0025% larger than that of dry air.
PIV analysis clearly illustrates the simultaneous occurrence of the inverse Magnus effect and the retraction of the separation line on the advancing side, confirming previous findings as reported by Kim et al. kim_choi_park_yoo_2014 . According to their explanation, the inverse Magnus effect emerges from the fact that the advancing side experiences a higher effective Reynolds number, which leads to an earlier onset of turbulent transitions in the boundary layer than the retreating side. This vertically asymmetrical separation line leads to an inversion of the lift force. Now, the question is how the charged droplets, despite their low density, can modulate the flow in the boundary layer.
It has been reported that fog exhibits non-Newtonian behavior, which is due to the structure of charged droplets within the flow generating additional stress when deformed by shearShavlov_2014 . They assumed a one-dimensional equation of oscillations for a charged droplet in equilibrium, and claimed that the effective viscosity of fog could increase when the characteristic shear rate of the flow has the same order of magnitude as the inverse of the relaxation time,
| (1) |
where is the dielectric constant of air and . However, in our experiment, is estimated to be of the order of unity, which is much smaller than the shear rate near the surface of the sphere. Hence, in our experiments, an increase in viscosity in the boundary layer cannot be expected within the framework described in Ref. shavlov_2022 .
More recently, Y. Zhao et al. conducted a large-eddy simulation of pipe flow, investigating the influence of dispersed charged particles on turbulence modulationYZhao . They studied electrostatic effect within the viscous sublayer and the buffer layer. Through direct comparisons between the cases with and without particle charging, they showed that the long ranged electrostatic interaction enhances the kinetic energy of particles within these layers. As a result, a greater amount of energy is transferred from the particles to the local flow, leading to an increase in turbulence intensity near the wall.
It is well known that the separation line moves downstream as a result of the increased momentum transport from the mainstream towards the wall in a boundary layer. Thus, we could anticipate that the distribution of charged liquid droplets increases the turbulent intensity in the boundary layer and enhances the momentum transport. Then the separation line moves downward leading inverse Magnus effect.
Let us conclude the discussions with some open questions. Firstly, the long ranged Coulomb interaction might explain why the low density droplets affect flow in the boundary layer. What is the threshold density at which droplets start to affect the flow? Secondly, in the simulation by Y. Zhai et al., they assume a uniform charge distribution with the same sign resulting from collisions with walls. On the contrary, in our experiment, the overall charge is neutral. Then, it remains to be seen if the neutral charge distribution can also alter the flow in the boundary layer. Further research, involving both experimental and simulation studies, is necessary to address these questions.
IV Summary
In this paper, we conducted experiments to measure the lift force on a rotating sphere in a wind tunnel. Our results demonstrate that the threshold values of Reynolds number and spin ratio, at which the inverse Magnus effect occurs, are substantially reduced when water fog is suspended in the flow. We did not observe a similar phenomenon with PG and DOS fog, implying that the electrostatic interaction between the droplets is a contributing factor to the retraction the separation line at the wall.
We would like to thank helpful discussions with Masaki Matsubara, Shuta Noro, Takashi Watanabe and Yasufumi Konishi. The author S. N. also thanks Sokichi Hiratsuka and Shojiro Sato for their supports in performing experiments. This work was supported by JSPS KAKENHI Grant Number 19K04201.
References
- (1) G. Magnus. Über die abweichung der geschosse, und: Über eine abfallende erscheinung bei rotierenden körpern. Annalen der Physik und Chemie, Vol. 164, pp. 1–29, 1853.
- (2) John M. Davies. The aerodynamics of golf balls. Journal of Applied Physics, Vol. 20, No. 9, p. 821, September 1949.
- (3) Alan M. Nathan. The effect of spin on the flight of a baseball. Am. J. Phys., Vol. 76, No. 2, pp. 119–124, 2008.
- (4) R D Mehta. Aerodynamics of sports balls. Annual Review of Fluid Mechanics, Vol. 17, No. 1, pp. 151–189, 1985.
- (5) D. Klatt, R. Hruschka, and F. Leopold. Investigation of the Magnus Effect of a Generic Projectile at Mach 3 Up to 16 Degrees Angle of Attack. Journal of Applied Mechanics, Vol. 80, No. 3, 04 2013. 031603.
- (6) W. M. Swanson. The Magnus Effect: A Summary of Investigations to Date. Journal of Basic Engineering, Vol. 83, No. 3, pp. 461–470, 09 1961.
- (7) Jost Seifert. A review of the magnus effect in aeronautics. Progress in Aerospace Sciences, Vol. 55, pp. 17–45, 2012.
- (8) Bruce R. White and Jan C. Schulz. Magnus effect in saltation. Journal of Fluid Mechanics, Vol. 81, No. 3, pp. 497–512, 1977.
- (9) LIONEL ROSELLINI, FABIEN HERSEN, CHRISTOPHE CLANET, and LYDÉRIC BOCQUET. Skipping stones. Journal of Fluid Mechanics, Vol. 543, pp. 137–146, 2005.
- (10) Shin-ichiro Nagahiro and Yoshinori Hayakawa. Theoretical and numerical approach to “magic angle” of stone skipping. Phys. Rev. Lett., Vol. 94, p. 174501, May 2005.
- (11) Randy C. Hurd, Jesse Belden, Allan F. Bower, Sean Holekamp, Michael A. Jandron, and Tadd T. Truscott. Water walking as a new mode of free surface skipping. Scientific Reports, Vol. 9, No. 1, p. 6042, 2019.
- (12) Nicolas Plihon, Gauthier Legrand, Francis Pagaud, Arsène Chemin, Jérémy Ferrand, and Nicolas Taberlet. The physics of magnus gliders. American Journal of Physics, Vol. 89, No. 9, pp. 843–850, 2021.
- (13) Sonu Kumar, Manish Dhiman, and K. Anki Reddy. Magnus effect in granular media. Phys. Rev. E, Vol. 99, p. 012902, Jan 2019.
- (14) M. A. Lafay. Sur línversion du phénoméne de magnus. Academie des Sciences, Vol. 151, p. 867, 1910.
- (15) John W. Maccoll. Aerodynamics of a spinning sphere. The Journal of the Royal Aeronautical Society, Vol. 32, No. 213, pp. 777–798, 1928.
- (16) Sadatoshi Tanada. Negative magnus effect. Rep. Res. Inst. Appl. Mech., Vol. 5, No. 20, p. 123, 1957.
- (17) Jooha Kim, Haecheon Choi, Hyungmin Park, and Jung Yul Yoo. Inverse magnus effect on a rotating sphere: when and why. Journal of Fluid Mechanics, Vol. 754, p. R2, 2014.
- (18) Masaya Muto, Makoto Tsubokura, and Nobuyuki Oshima. Negative magnus lift on a rotating sphere at around the critical reynolds number. Physics of Fluids, Vol. 24, No. 1, p. 014102, 2012.
- (19) Bin Lyu, Jeffery Kensrud, and Lloyd Smith. The reverse magnus effect in golf balls. Sports Engineering, Vol. 23, No. 1, p. 3, 2020.
- (20) Nazmus Sakib and Barton L. Smith. Study of the reverse magnus effect on a golf ball and a smooth ball moving through still air. Experiments in Fluids, Vol. 61, No. 5, p. 115, 2020.
- (21) Masato Maeda. A study on the abnormal flight behavior of the soft tennis ball. J. Jpn. Soc. Sports Ind. (Japanese), Vol. 15, No. 2, p. 33, 2005.
- (22) W.C. HINDS, J.M. MACHER, and M.W. FIRST. Size distribution of aerosols produced by the laskin aerosol generator using substitute materials for dop. American Industrial Hygiene Association Journal, Vol. 44, No. 7, pp. 495–500, 1983.
- (23) In Fig. 9, the region of the inverse Magnus effect in the Re- plane is found at the lower value of compared to that reported by Kim et al. This is probably because the foaming polystyrene sphere we used in the present experiment has a rougher surface than the sphere used in the previous study. On rough surfaces, the separation lines tend to recede more, which can lead to the appearance of the inverse Magnus effect at smaller values of the spin ratio.
- (24) A V Shavlov, I V Sokolov, V L Khazan, and S N Romanyuk. Viscosity of water fog. Physica Scripta, Vol. 89, No. 12, p. 125402, dec 2014.
- (25) A.V. Shavlov, I.V. Sokolov, and V.A. Dzhumandzhi. Non-newtonian viscosity of water fog. Physics Letters A, Vol. 450, p. 128394, 2022.
- (26) Jinzhui Li Yudong Yan Yanlin Zhao, Min Liu and Jun Yao. Modulation of turbulence by dispersed charged particles in pipe flow. Physics of Fluids, Vol. 1, No. 34, p. 123315, 2022.