MVMTnet: A Multi-variate Multi-modal Transformer for Multi-class Classification of Cardiac Irregularities Using ECG Waveforms and Clinical Notes
Abstract
Deep learning provides an excellent avenue for optimizing diagnosis and patient monitoring for clinical-based applications, which can critically enhance the response time to the onset of various conditions. For cardiovascular disease, one such condition where the rising number of patients increasingly outweighs the availability of medical resources in different parts of the world, a core challenge is the automated classification of various cardiac abnormalities. Existing deep learning approaches have largely been limited to detecting the existence of an irregularity, as in binary classification, which has been achieved using networks such as CNNs and RNN/LSTMs. The next step is to accurately perform multi-class classification and determine the specific condition(s) from the inherently noisy multi-variate waveform, which is a difficult task that could benefit from (1) a more powerful sequential network, and (2) the integration of clinical notes, which provide valuable semantic and clinical context from human doctors. Recently, Transformers have emerged as the state-of-the-art architecture for forecasting and prediction using time-series data, with their multi-headed attention mechanism, and ability to process whole sequences and learn both long and short-range dependencies. The proposed novel multi-modal Transformer architecture would be able to accurately perform this task while demonstrating the cross-domain effectiveness of Transformers, establishing a method for incorporating multiple data modalities within a Transformer for classification tasks, and laying the groundwork for automating real-time patient condition monitoring in clinical and ER settings.
Keywords: Transformer, Multi-class, Multi-modal, Cardiac abnormality classification, Transfer learning, ECG waveforms, Clinical notes, MVMTnet111Codebase: bit.ly/MVMTnet-Transformer_ECGClassification
1 University of Toronto: 27 King’s College Cir, Toronto, ON M5S, Canada
2 Advanced Drug Delivery and Regenerative Biomaterials Laboratory, Stanford Cardiovascular Institute - Pulmonary and Critical Care: 1050 Arastradero Rd, Palo Alto, CA 94304
3 Corresponding author contact: ankur.samanta@mail.utoronto.ca
4 Equal contributions
1 Introduction
Deep learning has revolutionized medical signal processing and is able to outperform traditional Electrocardiogram (ECG) analysis for cardiac diagnostics (Smith et al., 2019). ECG waveforms, which depict the electrical activity of the heart, are a time series representation of the heart’s voltage. Different ECG machines can have multiple leads, each representing different directions of cardiac activation (Park et al., 2022). Additionally, deep learning is shown to be the most effective strategy for analyzing clinical notes, which are unstructured text annotations that contain contextual information about the patient, such as diagnoses, symptoms, and treatments, for efficient patient diagnosis (S & K, 2022). Automating the analysis of ECG signals and clinical notes is both cost-effective and allows for earlier identification of cardiovascular diseases, streamlining the diagnostic process at hospitals and enabling faster response times to changes in cardiac conditions.
Prior works tackling similar problems have used a variety of legacy networks, such as Convolutional Neural Networks (CNN) (Ebrahimi et al., 2020), which have the disadvantage of losing positional and sequential features of the data that are critical for analyzing sequential data such as time-series waveforms. On the other hand, approaches using sequential models such as Recurrent Neural Networks (RNN) and Long Short-Term Memory networks (LSTM) have the disadvantage of only being able to process a single token at a time with hidden states for memory, capturing limited historic representations, being bound by a particular sequence length, and being recursive and non-parallelizable, meaning relatively inefficient and require longer training times (Sherstinsky, 2018). In contrast, Transformers have proven to be highly effective at analyzing sequential data, being able to process entire sequences of variable lengths at once (they are length invariant and treat the sequence as a whole unit), and use positional encodings and attention to generate and prioritize relevant variable-length connections throughout the sequence (Vaswani et al., 2017).
As such, this paper proposes the use of a novel multi-variate multi-modal Transformer to combine textual data from clinical notes with time-series electrocardiogram (ECG) waveform data to perform multi-class classification of observed cardiac abnormalities, a task which has not been accomplished to this extent with such an architecture before. Our multi-variate model is compatible with any number of ECG leads and is sequence length-invariant, but for this work, we focus on 12-lead waveforms (each sample has 12 distinct waveforms, which contain more information than otherwise uni-variate single-lead ECGs). The creation of a multi-modal architecture through the addition of a correspondent data source (clinical notes, analyzed with Clinical BERT, meaning our model inherits its pre-trained text processing capabilities for clinical settings) exhibits the potential to improve classification through valuable semantic contextual information about the medical practitioner’s observations (Alsentzer et al., 2019). Ultimately, this will corroborate the automated diagnosis provided by the Transformer, which originally would have only considered historic ECG waveform data (the waveform Transformer takes inspiration from core features of the seminal Transformer architecture by (Vaswani et al., 2017), inheriting its architectural benefits for sequential data analysis).
Thus, the MVMTnet architecture produces an overall more accurate model and lays the groundwork for developing multi-modal neural networks for clinical applications that are effectively able to harness both medical-condition monitoring devices as well as a clinician’s own insights in its analysis.
2 Background & Related Work
2.1 Multi-class classification of time series
The use of artificial neural networks for the classification of time series data is not a novel idea, and a considerable amount of literature has been published on machine learning-based techniques to classify cardiac irregularities in ECG waveforms (Adams & Choi, 2012; Bizopoulos & Koutsouris, 2018; Chamatidis et al., 2017; Isin & Ozdalili, 2017; Hatami et al., 2022). An example of an approach to ECG multi-class classification was using a pre-trained CNN structure like AlexNet, which showed that CNN classifiers yield high accuracy (Eltrass et al., 2022). To build upon this, Lui & Chow present a CNN-LSTM stack decoding classifier that detects MI in patients with pre-existing heart conditions. While this method was able to achieve over performance metric, it is limited to identifying only MI against a pool of “other” CVD types (Lui & Chow, 2018). Likewise, the state-of-the-art for ECG waveform classification models is generally constrained to binary classification models (Ebrahimi et al., 2020).
2.2 Multi-modal neural networks
Similarly, the concept of combining multiple modes of data to aid classification has been explored and documented well in literature, specifically with a combination of CNN and RNN architectures (Tan et al., 2017; Jo et al., 2019; Ahmad et al., 2021).
Recent papers show that combining time series data and clinical notes is possible and effective for forecasting (Khadanga et al., 2019; Deznabi et al., 2021). CNN-LSTM networks are predominantly employed for such tasks, such as when the two modalities of magnetic resonance images and clinical data were used to predict outcomes in stroke patients (Hatami et al., 2022). Similar medical applications are explored in Khadanga and Aggarwal’s paper with ICU data and clinical notes in predicting in-hospital mortality rates. Their approach shows how to interpret time series data, such as ECG waveforms, as data with time stamps and demonstrates how to tokenize and analyze data (Khadanga et al., 2019).
2.3 Multi-variate Transformers for time series
Transformers are not constrained by recursive sequential processing, and thus outperform RNNs, LSTMs, and other models at forecasting time-series data such as ECG waveforms (Vaswani et al., 2017). A recent paper provided the first instance of using a generalized multi-variate Transformer for time series classification on various multi-class datasets (Zerveas et al., 2020). The model provided superior results over ROCKET, XGBoost, LSTM, and DTW_D; however, the paper does not explore the use of another modality (Zerveas et al., 2020).
The state-of-the-art analysis shows that the multi-class classification of ECG waveforms as well as the introduction of multiple modes to a multi-variate Transformer when integrated are a novel concept, and points to effective time-series classification through the combination of these ideas. Therefore, the proposed model requires the ability to classify each heart condition available in the PTB-XL dataset, combined with the use of clinical notes for increased accuracy. A multi-variate Transformer was chosen to implement this novel multi-modal multi-class framework.
3 Data Processing Methods
The main source of data is the PTB-XL ECG dataset (Wagner et al., 2020). This is a well-known electrocardiography (ECG) dataset that is publicly available and contains clinical 12-lead ECGs from patients. This dataset was selected due to its size, quality of organization, and detailed annotations. Additionally, all records were validated once by a technical expert, and most were validated another time by a cardiologist (Wagner et al., 2020). However, the raw data must be pre-processed for it to be compatible with the proposed model and useful for analysis (Mishra et al., 2016).
3.1 Processing clinical notes:
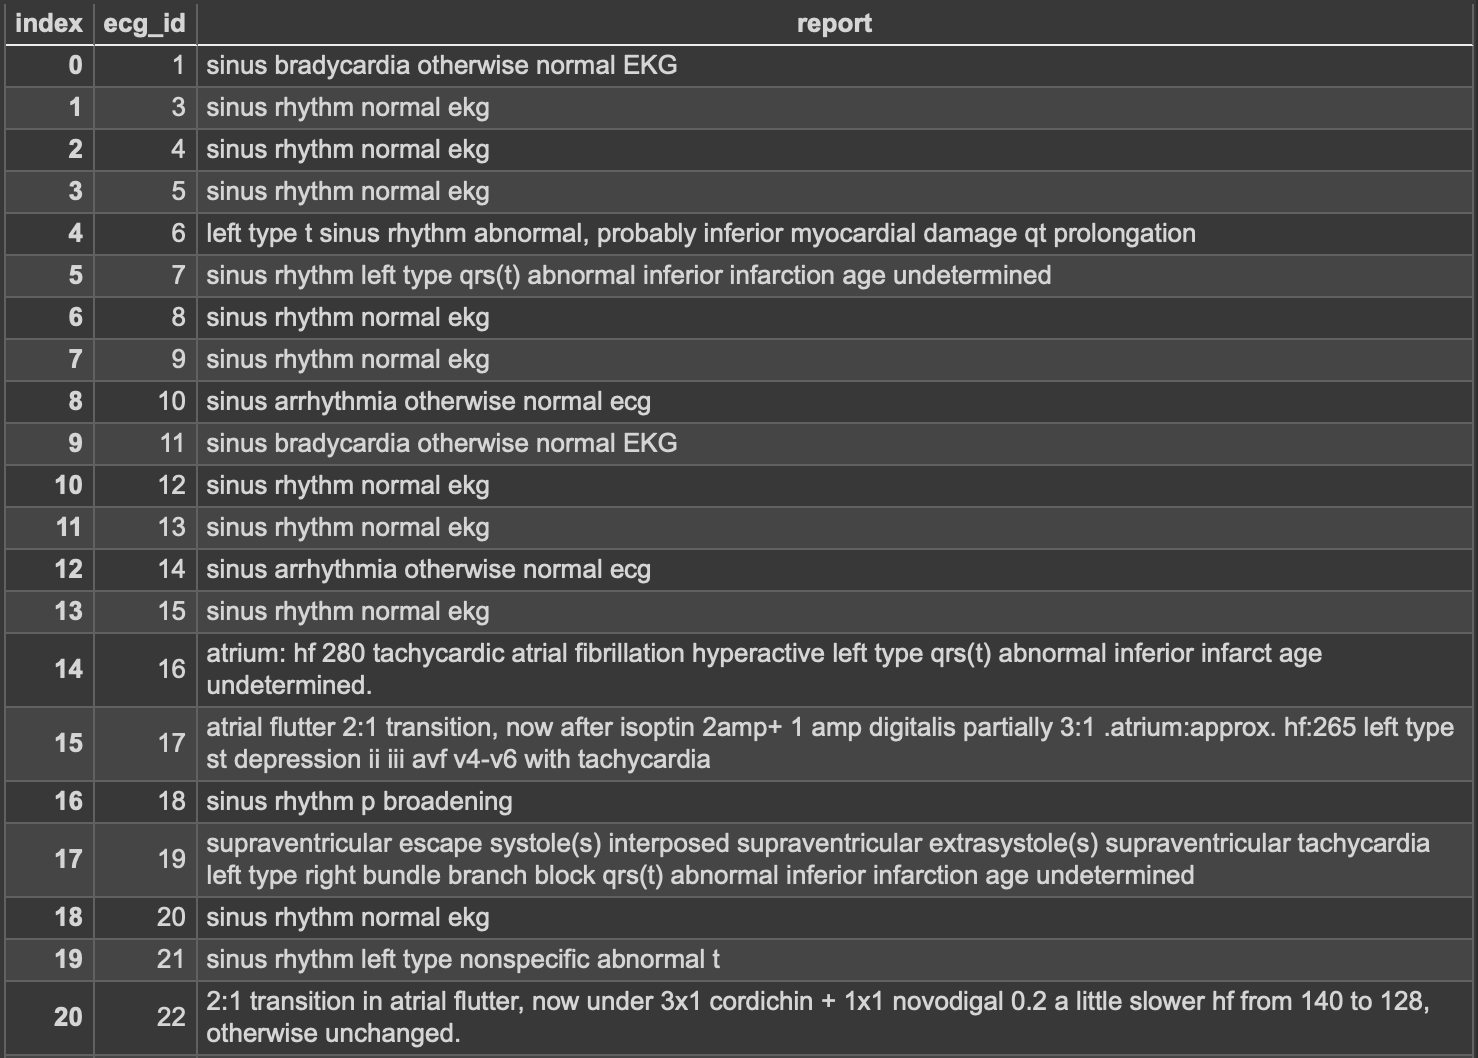
In order to process this data, the raw data first needs to be loaded and sorted into clinical notes metadata and waveform data. The clinical notes metadata is comprised of information about a patient (age, sex, weight, etc.), as well as two important columns for classification: diagnostic super-classes and report. The diagnostic super-class of a 12-Lead ECG waveform refers to the heart condition(s) which are identified in this patient. The report of each patient is the set of notes written by a doctor documenting the doctor’s physical analysis of the patient which is referred to as clinical notes. This metadata can be stored in a pandas data frame so that it is easier to reformat and extract relevant patient information, making sure to include a column for diagnostic super-classes which will contain the labels of the five classes. In examining this column, two problems arise. Firstly, the dataset is skewed, containing roughly of class NORM and multiple labels are assigned to a single ECG. The first issue was solved by under-sampling the data to obtain about of each of the five classes effectively cutting the dataset to samples. Now that the classes are evenly distributed it made sense to examine the column which contained the clinical notes (reports). This was the main focus for the processing of this metadata and thus all ECGs with a blank report were omitted, cutting the data by a further samples. While examining this column, it was observed that of notes were in German. As such, the Google Trans API is used in order to translate the notes to English so that the model can use them to learn. To address the problem of multiple labels, the labels were stored in a list, meaning that a custom dataset class needed to be implemented to allow for multi-hot encoding along with a custom loss function to assess the model’s predictions (see Figure 2).
3.2 Processing ECG waveforms:
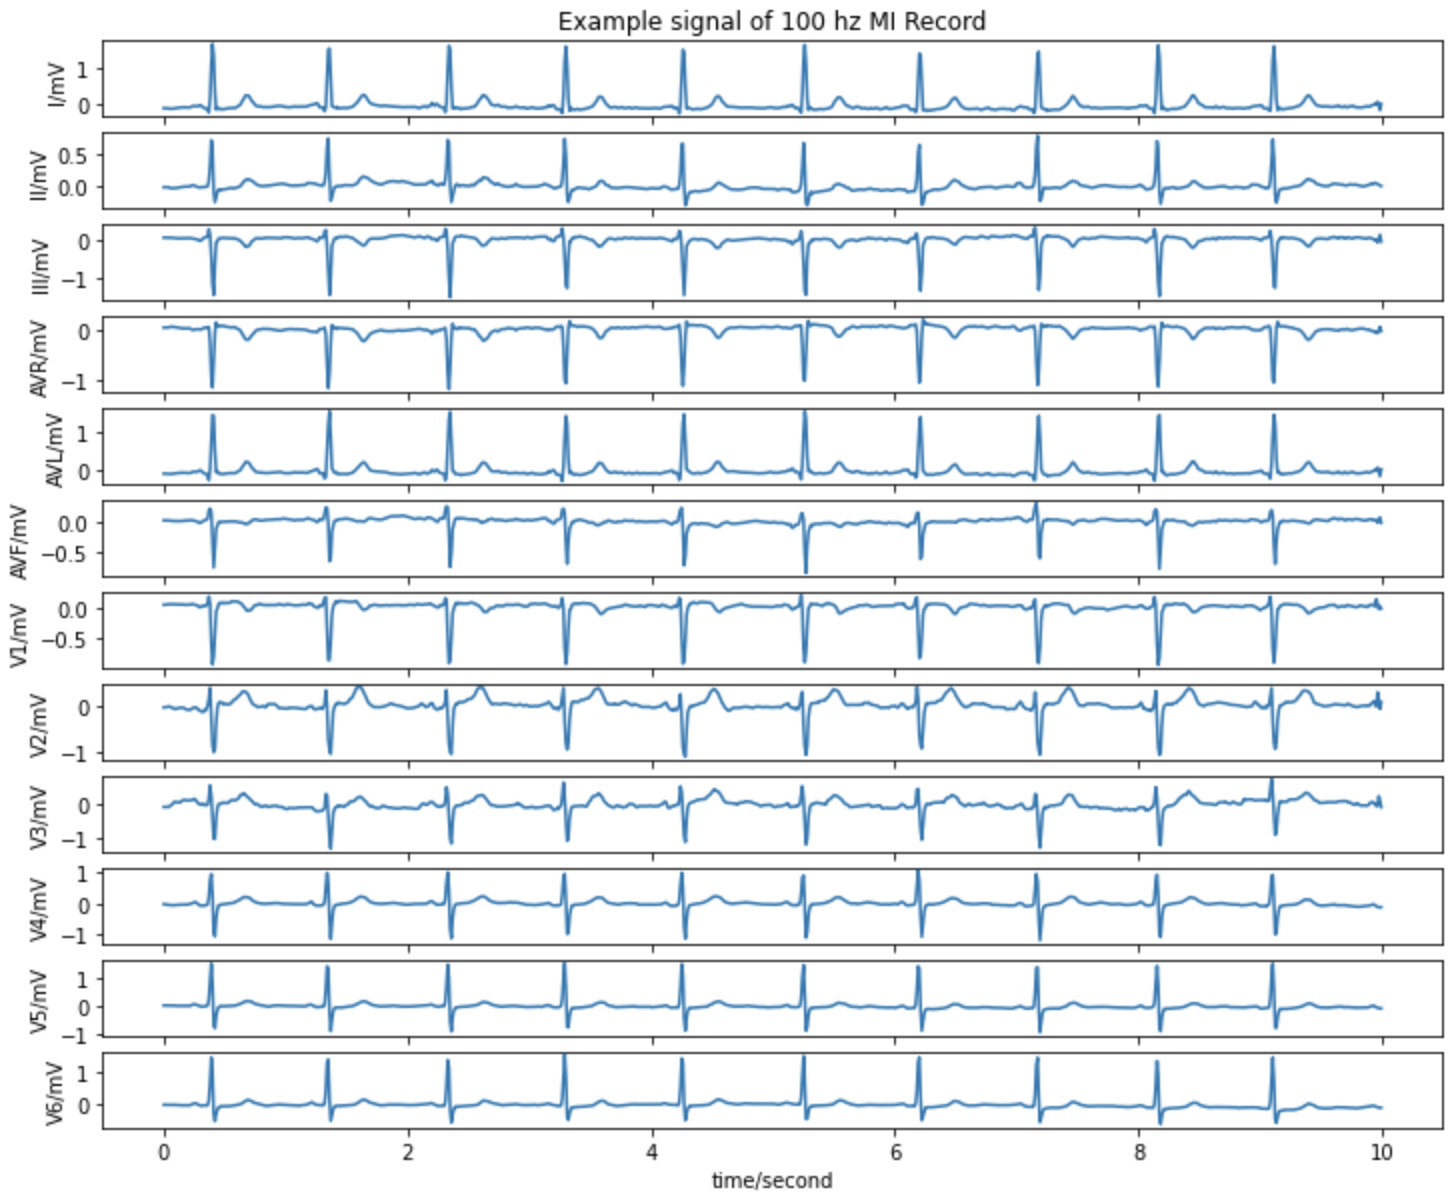
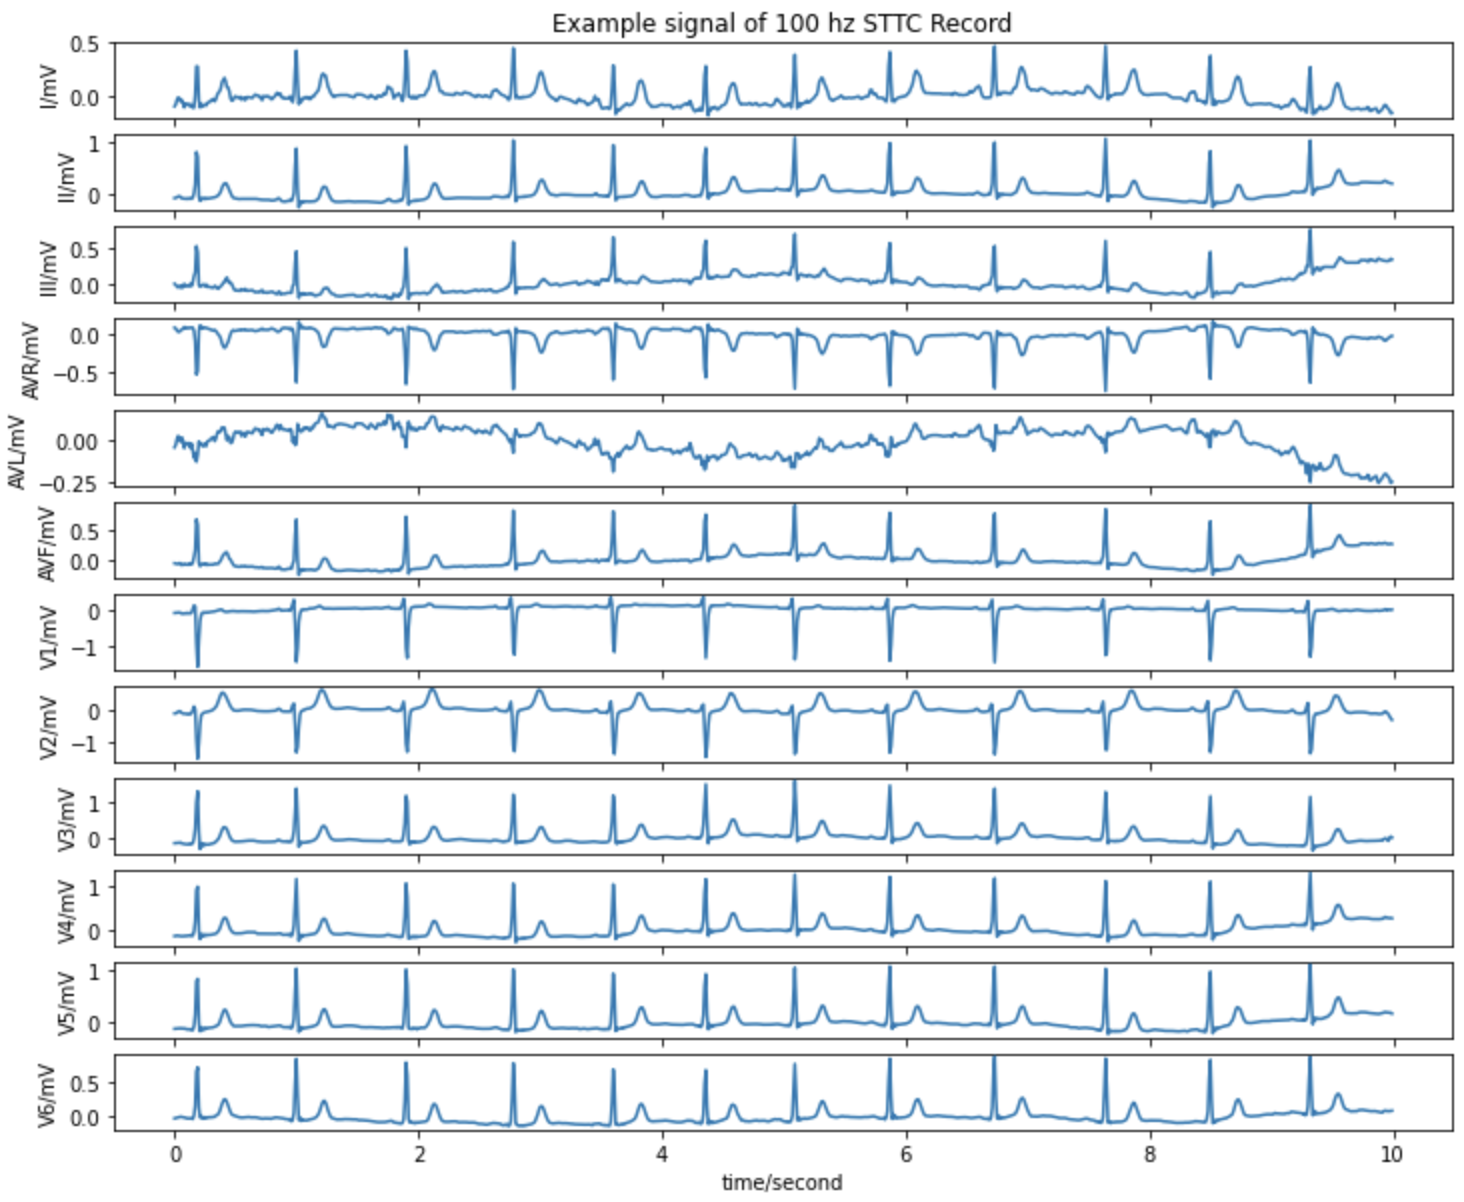
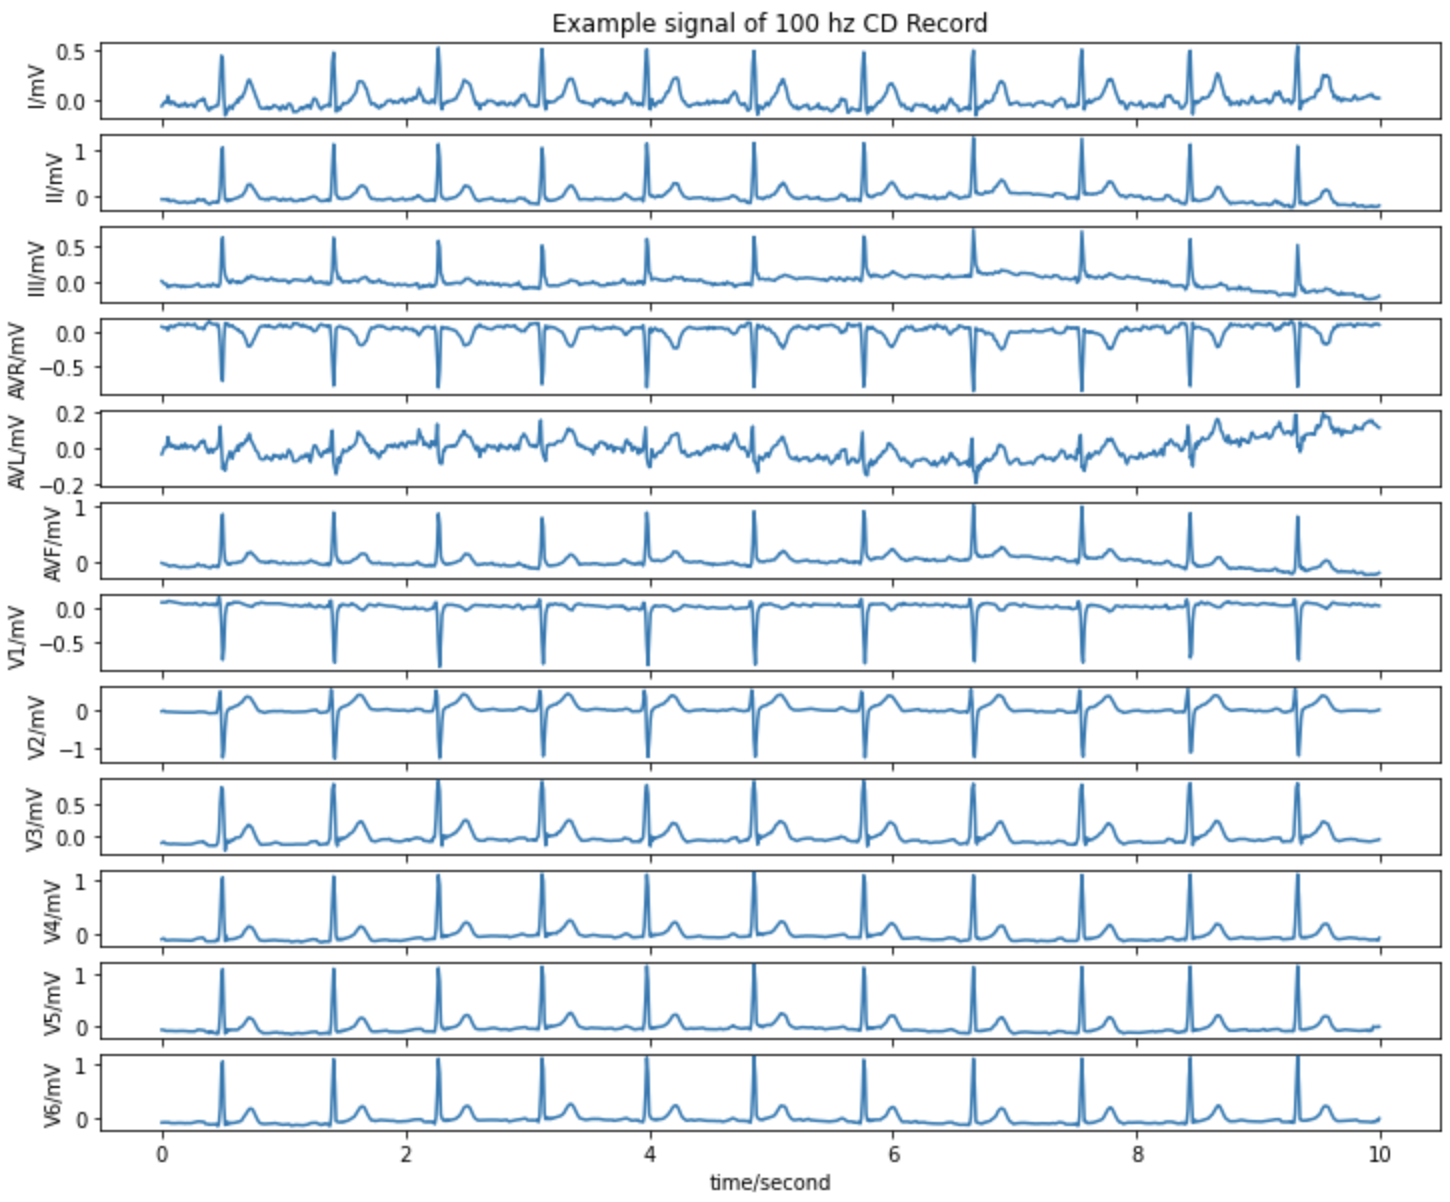
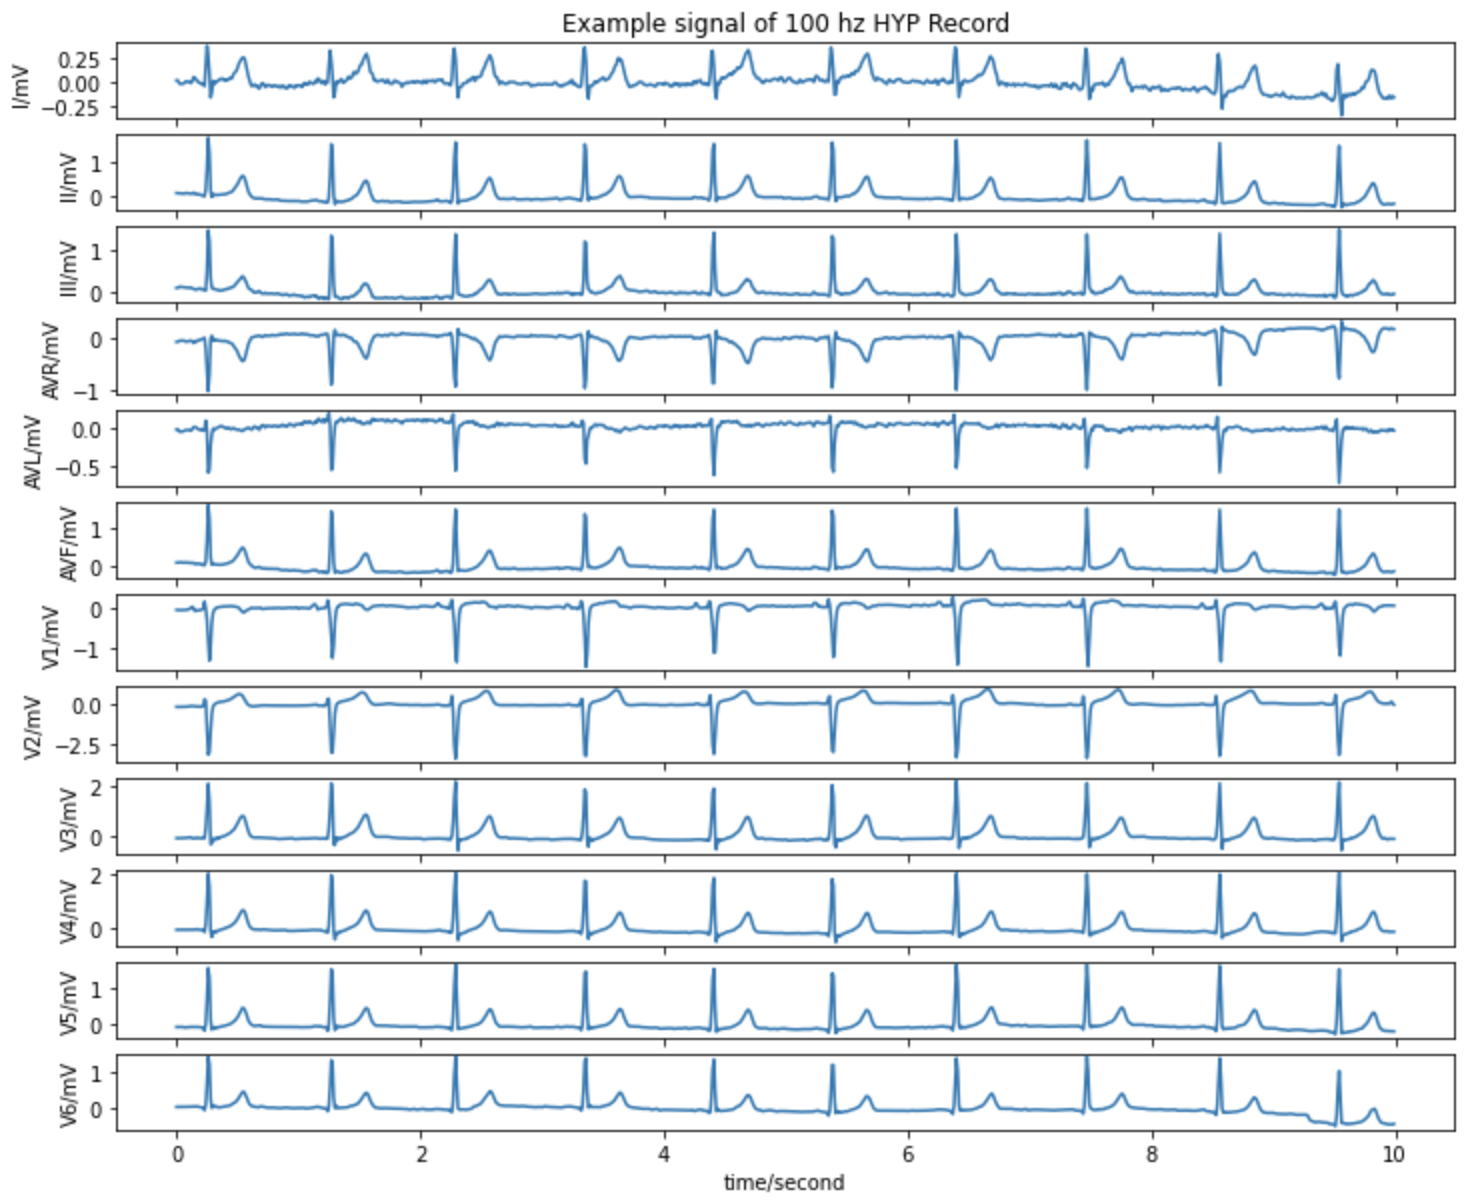
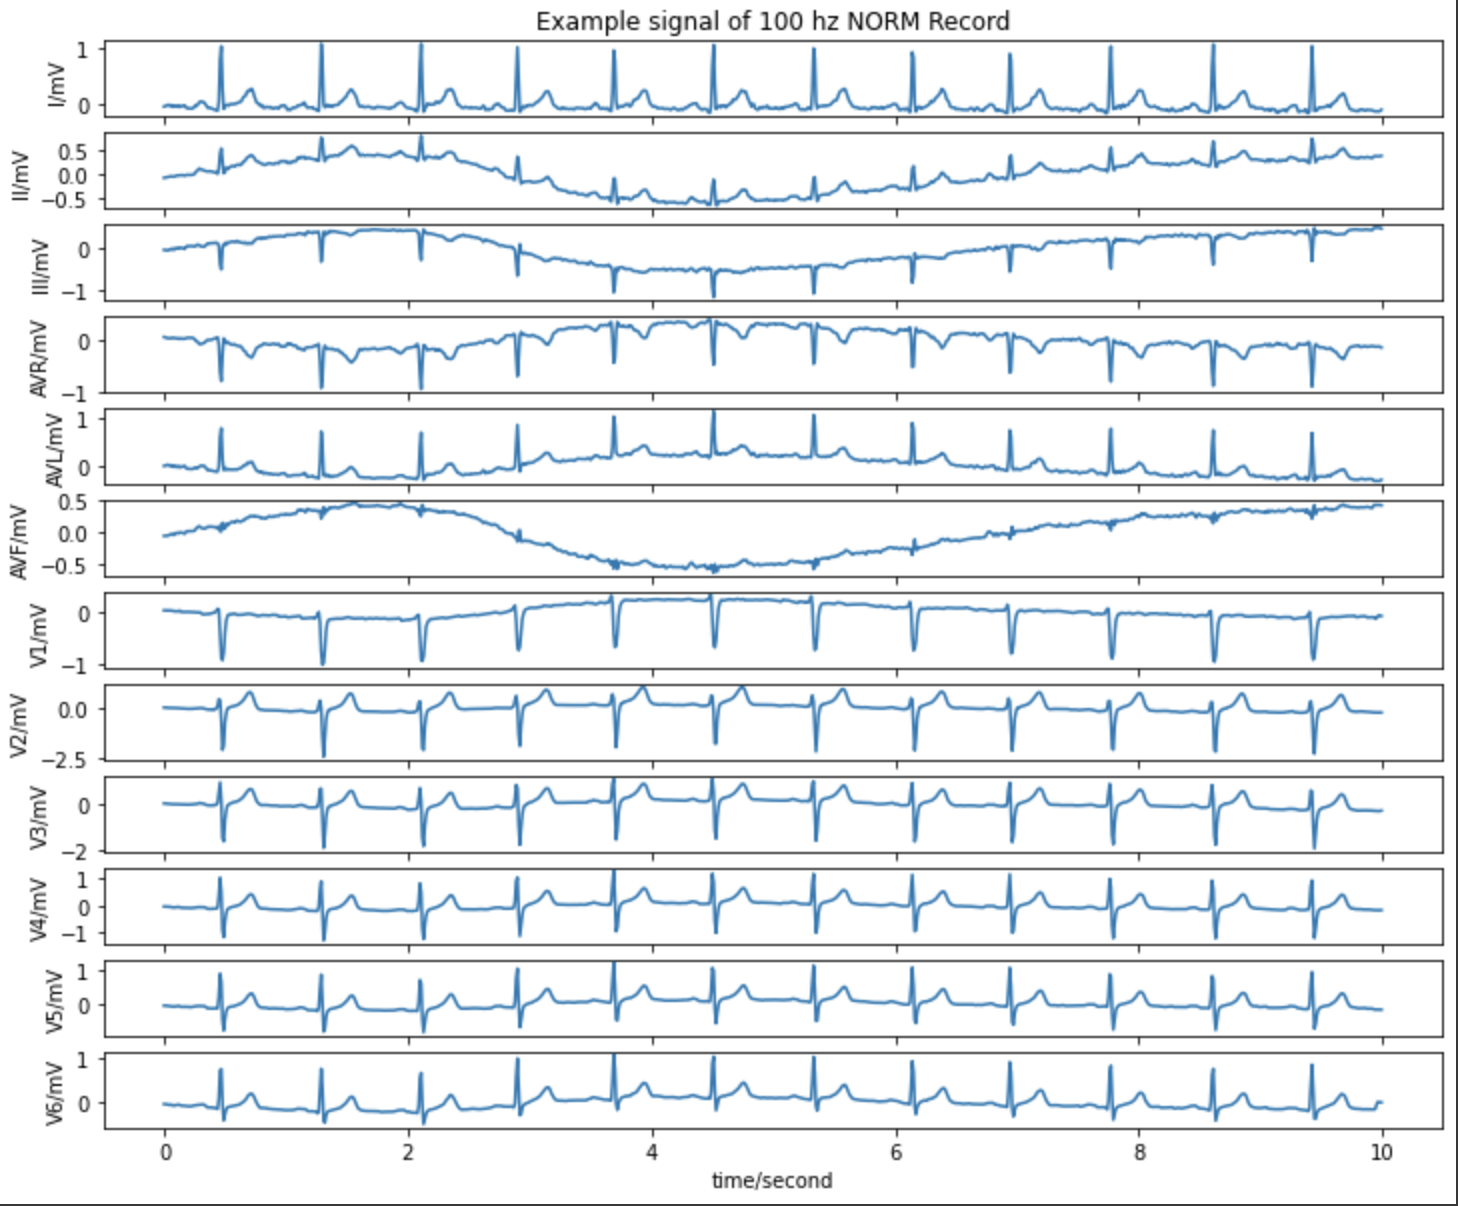
There are 12 ECG leads recorded for each patient, each with data points, sampled at a rate of Hz; 10 shows a normal ECG record. Since the waveforms are highly periodic, the first quarter of the waveform can be used without significant loss of new information. This reduces the number of data points per patient from to , which is computationally favorable.
An important finding from the examination of ECG graphs is their noisy nature. Significant noise impacts amplitudes and time intervals, which is detrimental to the model’s ability to diagnose correctly. Accordingly, a denoising algorithm based on time-frequency filtering was implemented according to Mishra’s paper (Mishra et al., 2016). A Daubechies wavelet with 4 vanishing moments was applied to the ECGs, resulting in wavelet coefficients (Addison, 2005). The threshold, calculated as a linear function of the wavelet coefficient median, determined whether to discard or keep specific coefficients. Following soft thresholding on the wavelet coefficients, the inverse wavelet transformation was then applied to reconstruct the denoised ECGs. This process effectively filtered out the high-frequency noise from ECGs while preserving the low-frequency signals (Mishra et al., 2016).
4 Model Architecture
This novel multi-variate multi-modal Transformer architecture takes inspiration from the core Transformer architecture from the seminal Attention-Is-All-You-Need paper (largely used for NLP tasks), modifying and building around it to incorporate multiple modalities and different embedding types (using transfer learning for clinical notes), and retooling it to handle multi-class classification tasks on time-series signal data Vaswani et al. (2017).
4.1 ECG time-series data handler
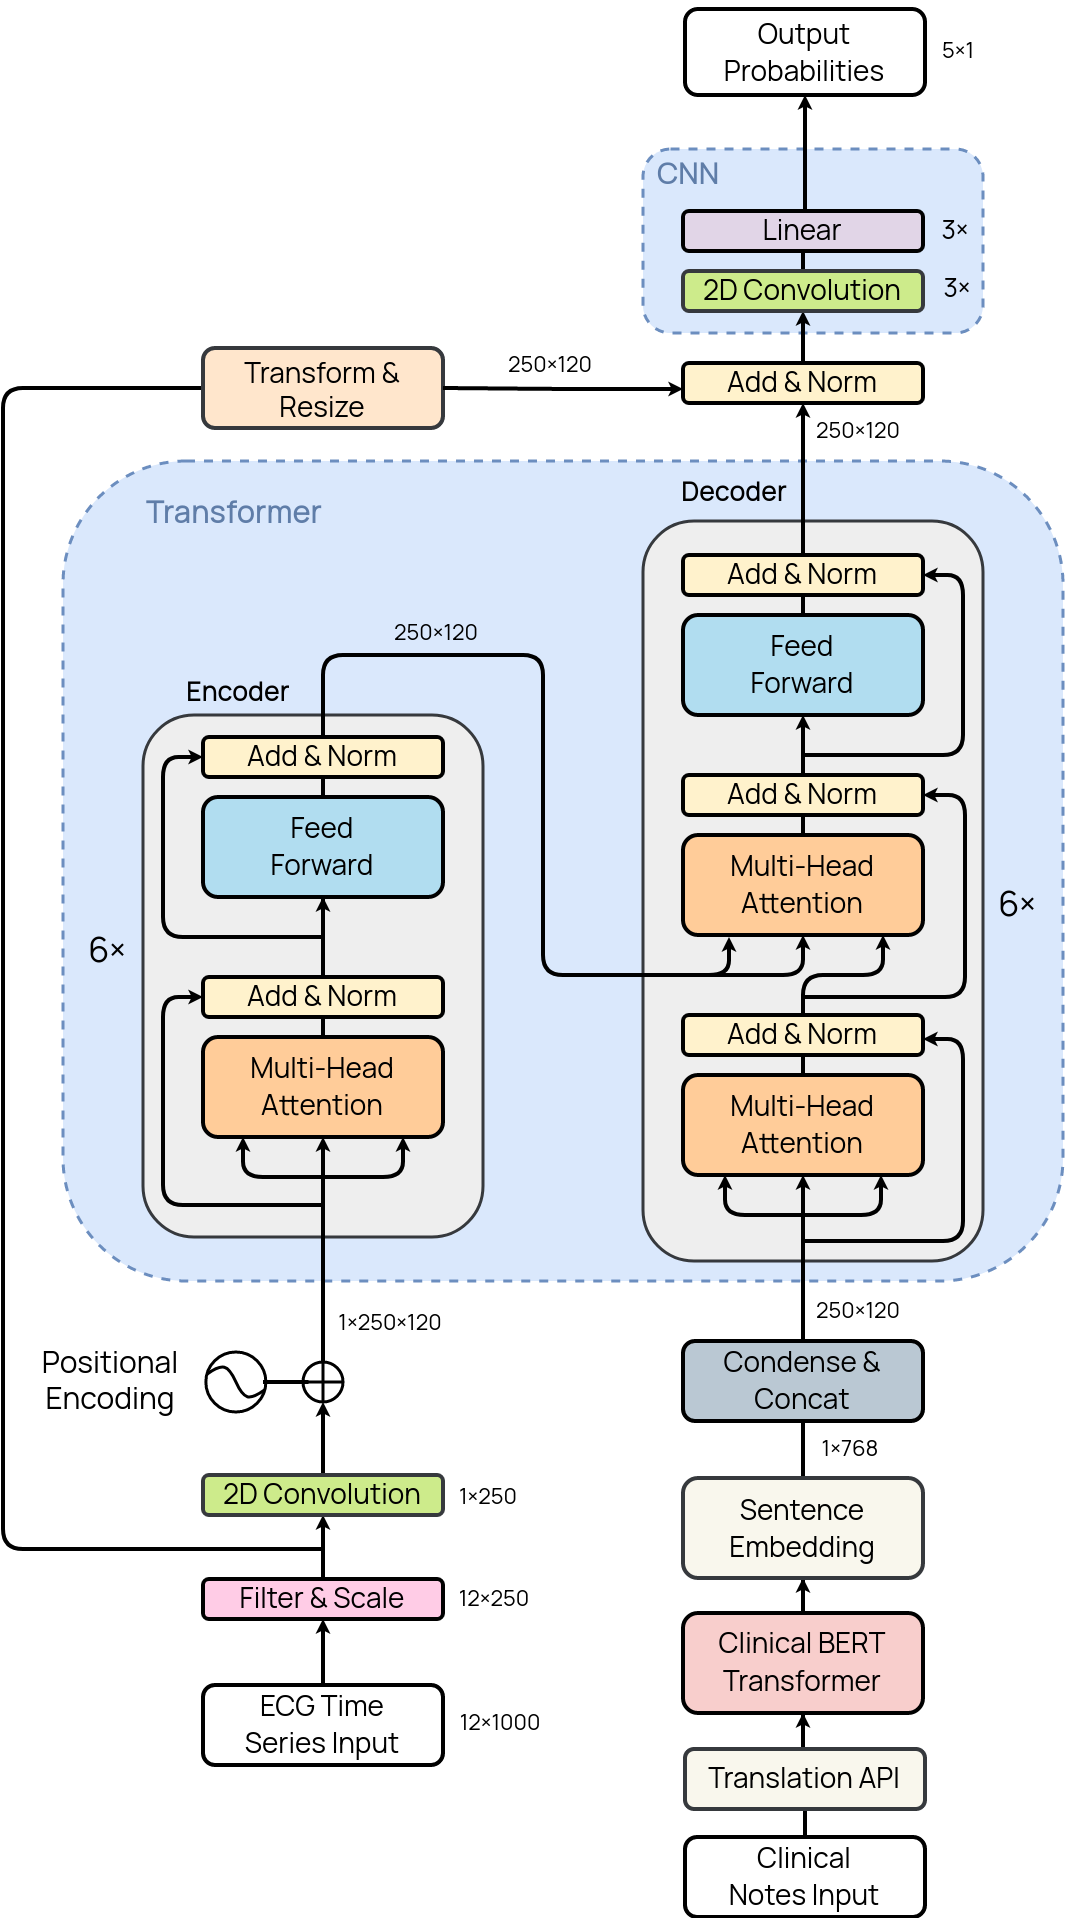
The network begins with the block of time-series data passed into the input, which is scaled and filtered for less noise and better interpretability within the model. A 2D convolutional layer is then used to condense the 12 leads into a higher dimension representation (on a per-token basis) of all the leads, to generate a single sequence to be propagated throughout the rest of the network.
4.2 Positional encoding
When learning features from sequential (time-series) data, it is critical to be able to maintain information about previous time steps and be aware of a single token’s relative position in the context of the whole sequence. Legacy neural networks such as CNNs treat a sequence of tokens as distinct segments, losing any sequential information by doing so. RNNs and LSTMs utilize ‘memory (hidden states)’ in the model to keep track of historic tokens and induce sequential feature learning, but they are recursive and slow. Transformers are very effective in modeling time-series data due to their usage of positional encodings, enabling the passage of an entire sequence as a single unit of multiple tokens. The positional encoding layer generates embedding vectors for each ms ECG waveform token, facilitating the learning of longer-range trends from how the waveform changes over time, instead of relying on short-range trends from a distinct set of voltage values. As such, the positional encoding layer outputs a embeddings representation block for the sequence.
4.3 Self-attention
Self-attention relates different segments in a larger sequence with a degree of ”attention” (importance), which helps compute both long and short-range sequential connections. For time-series data, different fluctuations in the sequence may have different ”attentions” computed based on which fluctuations have a more out-sized influence on the classification, and these interactions between all the input tokens along with the attention scores are aggregated and passed forward.
Multi-headed attention is utilized, which independently runs multiple attention mechanisms in parallel, uses scaled-dot-product attention to pool them, and concatenates and transforms them into the next dimension. Each head takes in three parameters: query, key, and value, which are generally the input passed in three times. Having multiple heads ( heads for the ECG leads) allows the model to assess different aspects of the sequence differently, just as using leads of an ECG instead of just a single lead provides much more information about the patient’s overall condition due to the larger ‘surface area’ of signal data (Ribeiro et al., 2020).
4.4 Encoder block
Following the generation of positional embeddings, the data is passed into an encoder block consisting of 6 encoder segments. Each of these encoder segments includes a multi-headed attention block, an Add & Normalize block, followed by a feed-forward (linear) network layer with a final Add & Normalize block. The encoder stages also use dropout after each layer. These segments are implemented sequentially, with the output of one feeding into the input of the next. The output of the overall encoder is a block, having attention and positional information embedded in the vectors for each token.
4.5 Clinical notes modality (Clinical BERT)
Clinical BERT places English language constraints on the input text. Incidentally, German data, in particular German clinical notes, made up of the full dataset. Since this represented a significant chunk of data, translation APIs (GoogleTrans API) were utilized to translate all the German clinical notes to English. Although some semantic context was potentially lost through translation, this approach was determined to be more beneficial for the model than simply discarding all the German data.
Transfer learning with Clinical BERT is used to generate sentence embeddings on the clinical notes. All notes were tokenized with Clinical BERT-specific separators, and passed into a pre-trained Clinical BERT model (trained on large datasets of clinical notes for task-specific contextual relevance) (Alsentzer et al., 2019). The output of this Transformer stage is a sentence embedding vector, which applies to the entire ECG sequence. Since the clinical notes are not time-variant, the vector is condensed and concatenated over the tokens to generate a block of those embeddings. This is then passed into the decoder stage along with the outputs of the encoder block.
4.6 Decoder
Similar to the encoder block, the decoder block consists of six sequential decoder stages. The clinical notes data modality is processed at the beginning of each of these stages, where the sentence embeddings are taken from the aforementioned clinical notes handler and passed into a multi-head attention and Add & Normalize layer. Next, for the encoder-decoder attention mechanism, we want to incorporate the attention scores from both the waveform as well as the clinical notes (ensuring the determined influence of each token via attention from both data modalities is considered). So, for the next multi-head attention layer, instead of passing three copies of the ECG encoding outputs into the , , and parameters, the reshaped sentence embeddings from the clinical notes are passed in as the query parameter. This then goes through the next attention and Add & Normalize layers. Finally, this passes into a feed-forward (linear) network, and another Add & Normalize layer. Note that like the encoder, the decoder stages also use dropout after each layer. This sequence is repeated six times with those decoder inputs being passed in at every stage to maintain the positional embeddings throughout the process and ensure that that information is not lost. The output of the decoder is a sequence—essentially, the input ECG sequence has been reconstructed and re-represented, but now with embedded attention from both the time-series ECG waveform and clinical notes data modalities, and positional information propagated throughout the Transformer.
4.7 Output CNN
After the decoder, a residual connection is utilized to add and normalize the original 12-lead input sequences (these are transformed to a dimension for the Add & Normalize stage) as well as the output of the Transformer decoder (both in identical formats but representing different qualities of the sequence). This is important since it is necessary to ensure that any ECG signal or attention/positional information that was passed into or generated in the model architecture is not lost and that all the required information is available to pass into the output CNN classification layer. As this is a classification task, the network uses a CNN with 2D convolutional layers and linear layers with max-pooling and ReLU. The output of the CNN classifier is a vector of five probabilities (each corresponding to a single cardiac abnormality classification).
5 Training
5.1 Optimizer
An Adam optimizer is used, as studies have found that for attention-based techniques, Adam is preferred over stochastic gradient descent (SGD) approaches due to the heavy-tailed distribution of noise present in stochastic gradients from SGD (Zhang et al., 2020).
5.2 Loss
From the set of five classes, 30 unique subsets can be formed, which contain all the possible condition states. This is important, as a patient may exhibit more than one condition, and the model should strive to predict multiple conditions correctly. If a patient exhibits multiple conditions, then these conditions are independent of one another. Therefore, a multi-condition prediction has probabilities of each condition that are independent of one another. In order to produce a logical prediction, the output of every neural network has to be put through a sigmoid function, which follows the rule of independent probability, unlike softmax. A loss function that is compatible with multi-label classification is binary cross entropy with logits. The labels are vectors of five classes, where multi-hot encoding represents multiple conditions. Fundamentally, the loss function ‘rewards’ the model when its outputs correctly produce either high probabilities for existing conditions or low probabilities for non-existing conditions.
5.3 Interpreting accuracy
Accuracy is the cross-reference between the output’s singular condition of highest probability and truth labels. If this condition is matched within the labels, then the model produced an accurate prediction. Otherwise, the prediction was inaccurate. This was the most logical approach to understanding accuracy within the model for several reasons. Although the data is under-sampled to ensure that there is an equivalent class distribution, there were significantly more datasets with singular conditions than with multiple conditions. Therefore, selecting the singular condition of highest probability is sensible for accuracy, which in essence is a binary classifier of an incorrect prediction versus a correct prediction. Additionally, if the model’s strongest prediction is an element of the multi-class labels, then the model is technically accurate. Lastly, the loss function streams the model in the direction of predicting all correspondent classes correctly. In summary, accuracy and loss are representations that differ in one-hot encoding versus multi-hot encoding, respectively.
6 Results
6.1 Quantitative Results
The best model was observed to perform most accurately under hyperparameter values from Table 1. The model’s performance can be quantitatively evaluated using the training curves that compare training loss and validation loss, and training error and validation error.
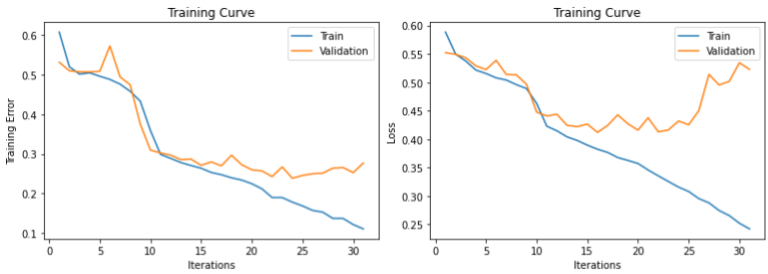
From these graphs, the early stopping point before the model starts to overfit is identified as the th epoch with a validation accuracy of , a notable improvement over all baselines.
6.1.1 Optimized MVMTnet Model
The tuneable hyperparameter values of the best MVMTnet model are presented in Table 1.
| Tuneable Hyperparameters | Learning Rate | Batch Size | Model Dimension | Multi-Head Attention Heads | Encoder Layers | Dropout |
|---|---|---|---|---|---|---|
| Best Model | 0.0001 | 4 | 120 | 12 | 6 | 0.2 |
6.1.2 Performance on unseen data
The test dataset was obtained during the data procession when the original dataset was being under-sampled. The method which was taken was to find the complement of the under-sampled set, which was an unbalanced set of samples. This was then under-sampled further to produce a balanced set of samples containing around samples of each of the five classes with no empty reports.
For the MVMTnet model, the obtained test accuracy was 76.03%, which was within the expected range of the validation accuracy. As such, even on independent test data, our model outperforms all other baseline architectures, rendering it the state-of-the-Art model for this task.
6.2 Qualitative Results
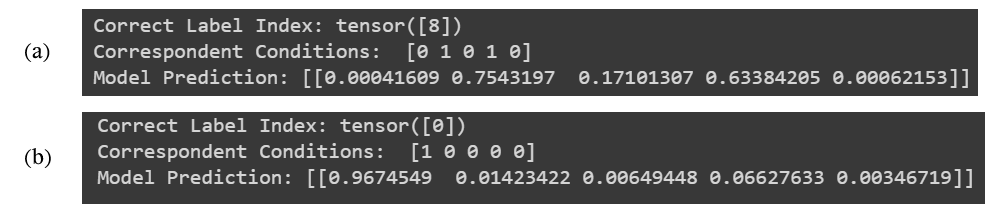
Figure 11 demonstrates the model’s output in regard to two cases within the independent, previously unused test set. The label index is an identifier of the condition subsets, which directly corresponds to a multi-hot encoding vector of existing conditions. Within (a) of Figure 11, the patient exhibits Myocardial Infarction (MI) and Conduction Disturbance (CD). The model’s prediction is a vector of class values corresponding to independent probabilities.
In the case of (a), the model’s confidence score is for Myocardial Infarction (value at an index of one), and for Conduction Disturbance (value at an index of three). More significantly, the confidence scores for non-existing conditions are extremely low with respect to the confidence scores of existing conditions. In the case of (b), the patient exhibits a normal ECG (NORM), as marked by one-hot encoding the condition’s label at the index of zero. The confidence score for a normal ECG is (value at the index of zero), with negligible confidence scores for other conditions.
For model outputs that illustrate the model’s ability to predict singular conditions as well as multiple conditions with independent confidence scores, refer to 11
6.3 Model Variations and Ablation Analysis
As MVMTnet is the first multi-variate multi-modal Transformer architecture for multi-class classification, to effectively benchmark its performance and understand the impact of certain core architectural components, we must perform an ablation study and benchmark against variations of MVMTnet (some with components purposely removed, and others with legacy approaches substituted in). Overall, we aim to address the following objectives: (1) the impact of a Transformer architecture in comparison to alternatives like RNN/LSTMs and CNNs, and (2) the benefits of a multi-modality (whether adding an additional data modality such as clinical notes actually improves the performance of the model). As such, we perform an ablation study for MVMTnet to isolate and evaluate the impact of each modular component, using the following uni-modal time-series and multi-modal baseline models as benchmarks: (a) CNN (TS-CNN) (b) time-series RNN (TS-RNN) (c) time-series Transformer (TST) (d) multi-modal CNN (M-CNN) (e) multi-modal RNN (M-RNN).
Among them, TS-CNN, TS-RNN, and TST are stripped down, classical deep learning architectures with the clinical notes modality removed. These can only process a single type of data modality and are intended to help benchmark the addition of the clinical notes modality across multiple neural network architectures, as well as the performance of the Transformer itself over other models in similar conditions, addressing objective 1.
The M-CNN and M-RNN baselines build on the TS-CNN and TS-RNN models by adding the clinical notes BERT component to generate sentence embeddings. They require varying multi-modal data fusion approaches to still perform the same task as MVMTnet, but without the time-series Transformer in the case of M-CNN, and with a time-series RNN swapped in for the Transformer in the case of M-RNN. To do this, M-CNN uses the early concatenation approach, in which the model concatenates the incoming heterogeneous features from different modalities prior to making classifications (Liang et al., 2022). On the other hand, M-RNN takes the early summation approach, where the model takes modality features and weighs them together to merge the data (Liang et al., 2022). This part of the ablation analysis aims to demonstrate the impact of architecture types in a multi-modal setting, addressing objective 1 in the context of objective 2.
6.3.1 Benchmarking
To demonstrate the effectiveness of the MVMTnet, we conduct a series of experiments with the baseline models against the optimal model in Section 6.1.1. The results are given in Table 2. Note that since the model is trained on a balanced, high-quality, representative dataset with real-world data, the model’s purpose is to make accurate predictions of classifications, and this is a multi-class classification problem, accuracy is a sufficient metric to evaluate the performance of the deep learning models.
| Model | TS-CNN | TS-RNN | TST | M-CNN | M-RNN | MVMTnet | |
|---|---|---|---|---|---|---|---|
|
67.34 | 62.77 | 59.26 | 70.39 | 67.81 | 76.03 | |
|
75.60 | 83.32 | 88.27 | 73.32 | 74.47 | 82.17 | |
|
69.22 | 63.87 | 58.92 | 71.11 | 64.41 | 76.16 | |
|
0.455 | 0.607 | 0.559 | 0.430 | 0.526 | 0.416 |
The training, validation, and test accuracies from Table 2 indicate the performance of all uni-modal and multi-modal models. The TS-CNN was the strongest time-series model in comparison to the TS-RNN & TST models, which appeared to overfit quickly (lack of regularization). Interestingly, the TS-RNN had a higher test accuracy, yet a higher validation loss than the TST; ultimately, the TS-RNN made more correct predictions, but with weaker confidence scores. Conversely, the multi-modal models exhibited improvements in accuracies from their uni-modal counterparts; this was rather expected. Referencing the test accuracies: the M-CNN & M-RNN experienced 3-5% boosts from their time-series counterparts, while the MVMTnet model saw a 16.77% increase from the TST. The explanation lies in modality fusion. The M-RNN & M-CNN models fused modalities through early concatenation, while the MVMTnet used cross-attention from a Transformer layer.
7 Discussion
7.1 Sensitivity of ECG signal data
The interference of noisy data must be considered as a potential cause of misclassification errors. The variability induced by such artifacts makes ECG signal classification an inherently difficult task and requires denoising via a Daubechies wavelet during data pre-processing as shown in Section 3. Despite undertaking this step, there exists a possibility that there is still a non-negligible amount of undesirable signals left in the ECG signal data, which can create an obstacle to making a true diagnostic prediction. This further supports the case that the additional modality of the clinical notes is needed to corroborate such predictions.
7.2 Learning observations
7.2.1 Error and loss inverse correlation
As defined in Section 5, calculating loss consisted of performing cross entropy with logits against multi-hot encoded labels. Oppositely, calculating accuracy consisted of selecting a singular condition of highest probability and cross-referencing it to the labels. Within the model, certain epoch intervals exhibited an increasing validation loss with a decrease in training error. In most models, this is observed as overfitting. However, due to the nature of this model’s aforementioned definitions of loss and accuracy, a more relevant measure of overfitting is the trend in validation error, cross-referenced with the loss trends, where as long as the validation error continues to decrease, there is no need to define an early stopping point to prevent overfitting.
7.2.2 Impact of learning rate on updating weights
The learning rate impacts the scale of the model’s response to error, which is directly proportional to how drastically the weights are changed. A very small learning rate () was used in this model because it was observed that the model was beginning to memorize a large dataset very quickly. This learning rate allowed for validation loss and error to decrease at smaller steps, ultimately resulting in the model neither over-fitting nor under-fitting within the desired range of epochs. However, lowering the learning rate slowed training, which negatively impacted the resource limitations and GPU constraints.
7.3 Multi-variate multi-headed attention
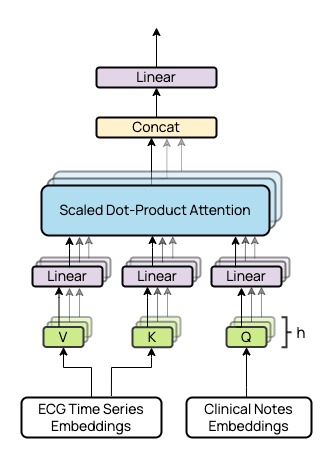
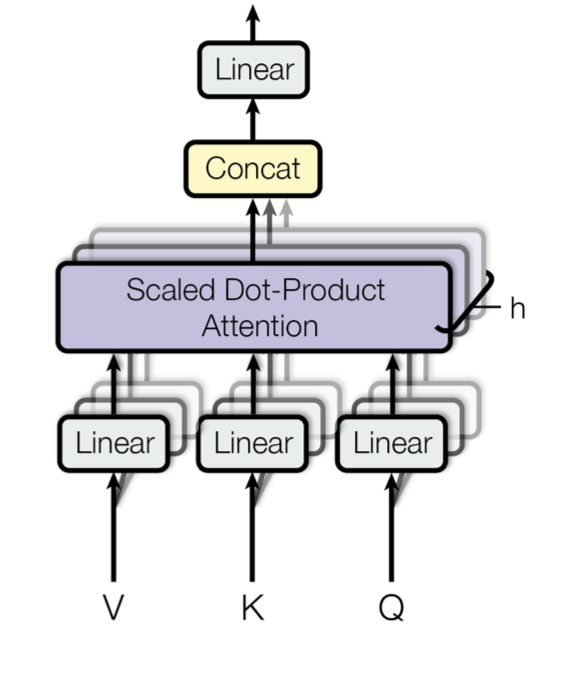
During the design process, one of the goals was to explore the potential for developing a model that could not only provide an effective analysis of the provided data but also provide clinically-relevant insights based on the outputs of different parts of the model. In this case, we wanted to see if clinically relevant insights could be drawn from how the outputs of the heads were pooled and condensed into a single representation. Although our final architecture uses the traditional multi-headed attention layer which linearly projects a single query, key, and value triplet (number of heads) times with distinct linear projections that were learned during training (Vaswani et al., 2017), we wanted to architecturally enforce the assignment of each ECG lead to each head in this layer. That way, as seen in Figure 4, instead of passing in a single , , and triplet and linearly projecting from there, we would isolate the waveform for each lead from the beginning, run independent encoder blocks for the leads, and then run a multi-variate multi-head attention layer which would directly take the embeddings generated from the independent encoders instead of linearly projecting them from a single, already-condensed set of embeddings. This would then allow us to compare the output vectors of each head and use techniques like cosine similarity indexes (or any similar/alternative vector comparison approach) and potentially examine how much the features learned from certain heads/leads were carried forward and maintained in the pooled representation (in this case, we might start with the assumption that the more similar a head vector is to the pooled vector, the more influential it was or the more information from that was maintained, although this assumption would change based on the pooling approach used). While we did implement this approach, we were unable to effectively train our architecture using this approach due to the massive computational load of running 12 independent encoders for each lead waveform prior to feeding it into the multi-variate multi-head attention layer in the decoder (12x the computation and training time as what is currently required for all model layers up to the decoder). As such, we leave this for experimentation in future iterations of research with this or similar architectures.
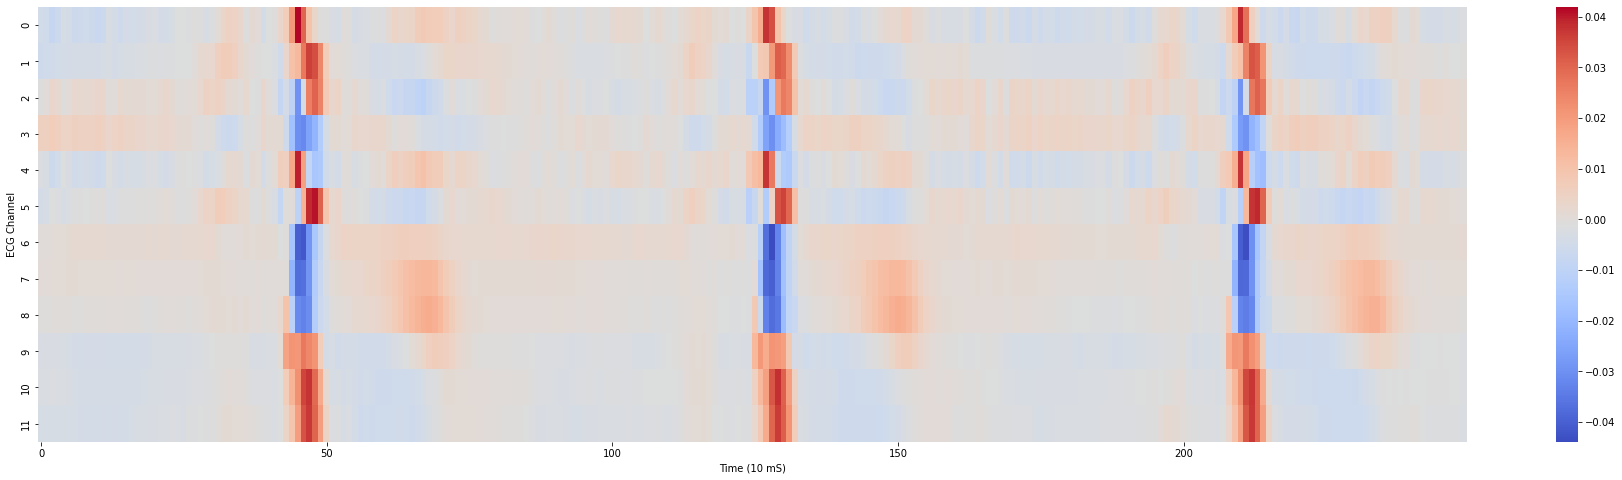
7.4 Further analysis of multi-headed attention for 12-lead ECGs
There were certain experiments considered to explore the possibility of deriving clinically-relevant insights from the model’s feature learning, with some being more robust than others. This included an attention-based visualization via a heat map that demonstrated what segments of the sequence the model attends to, as observed in Figure 5. The heat map was obtained by pooling the attention head weights and performing matrix multiplication with the input 12-lead ECG within the encoder layer. Evidently, the model attends in 80-120 time segments. This periodic attending predictably occurs because of voltage peaks and troughs, which are distinctive within the waveform. Additionally, it appears to be that the model is indifferent (pays less attention) to voltage segments that are non-changing. This attention dynamic seems to be consistent with what one may or may not pay attention to from a waveform. Unfortunately, these color-coded signal maps often do not lead to significant conclusions, and as it is in this case, not much can be concluded, other than that the model attends more dramatically to firing segments of the ECG. Although further analysis can be done on the way the Transformer calculates attention for different parts of the waveform for different leads and how that varies based on the classification, the analysis done as a part of this work does not indicate any new clinically-relevant insights from attention other than what is already known about ECG waveforms.
8 Ethical Considerations
Ethical considerations are critical especially when sensitive, personal information such as medical patient notes are in question. Care must be taken to ensure patient data is rinsed of any personally identifying tags, and that the data used cannot be traced back to an individual for privacy purposes. This is especially important with the advent of wearable technologies that make physiological data capture and analysis far more accessible—using monitoring/predictive models like ours on personal devices, meaning that such applications must be careful about how they handle metadata for patient data being processed.
Additionally, with regard to the deployment of models such as ours in critical settings like hospitals, AI systems aren’t foolproof and have a not-so-insignificant margin of error. There is always a certain risk of misdiagnosis, so there are discussions to be had about how much weight should be placed on results from an AI model in the field, who/what is liable for circumstances surrounding AI-based decisions, and how these models fit in long term in an often-changing medical environment.
9 Conclusion
In this work, we presented MVMTnet, a novel multi-variate multi-modal Transformer architecture that can perform multi-class classification of cardiac abnormalities using 12-lead ECG waveform data as well as clinical notes. We have demonstrated its superior performance to other traditional deep learning approaches, reaffirming the choice of Transformer architecture and multi-modal implementation for this particular use case, and establishing it as the state-of-the-art for this task.
And, although Transformers have historically been used for natural-language-processing tasks (Lin et al., 2022), our successful implementation on medical time-series data showcases the efficacy of Transformers across multiple application domains. Additionally, our successful use of transfer learning to integrate the clinical notes modality and improve the accuracy of all tested models further showcases the benefits of transfer learning in cross-domain applications, especially in multi-modal settings where both transfer learning and supervised learning are utilized with different Transformers within the model.
The potential applications of models such as ours are wide-ranging, ranging from deploying such models out in the field (real-time monitoring, faster response time, greater assistance for on-site medical staff), in our daily lives (using data from wearable technologies like smartwatches for health monitoring and risk-prediction), as well as in controlled research settings (organoid research; signal modeling, forecasting, and classification; and even drug efficacy testing). We are excited by the potential of MVMTnet and plan to not only further develop the model architecture, but also explore the application space and work towards bridging the gap between the research and deployment of such clinical AI models in real life.
Our codebase can be found at: MVMTnet Codebase.
10 Disclosure of Potential Conflicts of Interest
The authors declare that there are no conflicts of interest regarding this work.
References
- Adams & Choi (2012) E. Roland Adams and Anthony Choi. Using neural networks to predict cardiac arrhythmias. pp. 402–407, 2012. doi: 10.1109/ICSMC.2012.6377734.
- Addison (2005) Paul S Addison. Wavelet transforms and the ecg: a review. Physiological Measurement, 26(5):R155, aug 2005. doi: 10.1088/0967-3334/26/5/R01. URL https://dx.doi.org/10.1088/0967-3334/26/5/R01.
- Ahmad et al. (2021) Zeeshan Ahmad, Anika Tabassum, Ling Guan, and Naimul Mefraz Khan. Ecg heartbeat classification using multimodal fusion. IEEE Access, 9:100615–100626, 2021.
- Alsentzer et al. (2019) Emily Alsentzer, John R. Murphy, Willie Boag, Wei-Hung Weng, Di Jin, Tristan Naumann, and Matthew B. A. McDermott. Publicly available clinical bert embeddings. 2019. doi: 10.48550/ARXIV.1904.03323. URL https://arxiv.org/abs/1904.03323.
- Bizopoulos & Koutsouris (2018) Paschalis Bizopoulos and Dimitrios Koutsouris. Deep learning in cardiology. IEEE reviews in biomedical engineering, 12:168–193, 2018.
- Chamatidis et al. (2017) Ilias Chamatidis, Aggeliki Katsika, and Georgios Spathoulas. Using deep learning neural networks for ecg based authentication. In 2017 international Carnahan conference on security technology (ICCST), pp. 1–6. IEEE, 2017.
- Deznabi et al. (2021) Iman Deznabi, Mohit Iyyer, and Madalina Fiterau. Predicting in-hospital mortality by combining clinical notes with time-series data. In Findings of the Association for Computational Linguistics: ACL-IJCNLP 2021, pp. 4026–4031, 2021.
- Ebrahimi et al. (2020) Zahra Ebrahimi, Mohammad Loni, Masoud Daneshtalab, and Arash Gharehbaghi. A review on deep learning methods for ecg arrhythmia classification. Expert Systems with Applications: X, 7:100033, 2020. ISSN 2590-1885. doi: https://doi.org/10.1016/j.eswax.2020.100033. URL https://www.sciencedirect.com/science/article/pii/S2590188520300123.
- Eltrass et al. (2022) Ahmed S. Eltrass, Mazhar B. Tayel, and Abeer I. Ammar. Automated ECG multi-class classification system based on combining deep learning features with HRV and ECG measures. Neural Computing and Applications, 34(11):8755–8775, 2022. ISSN 1433-3058. doi: 10.1007/s00521-022-06889-z. URL https://doi.org/10.1007/s00521-022-06889-z.
- Hatami et al. (2022) Nima Hatami, Tae-Hee Cho, Laura Mechtouff, Omer Faruk Eker, David Rousseau, and Carole Frindel. Cnn-lstm based multimodal mri and clinical data fusion for predicting functional outcome in stroke patients. 2022. doi: 10.48550/ARXIV.2205.05545. URL https://arxiv.org/abs/2205.05545.
- Isin & Ozdalili (2017) Ali Isin and Selen Ozdalili. Cardiac arrhythmia detection using deep learning. Procedia computer science, 120:268–275, 2017.
- Jo et al. (2019) Taeho Jo, Kwangsik Nho, and Andrew J Saykin. Deep learning in alzheimer’s disease: diagnostic classification and prognostic prediction using neuroimaging data. Frontiers in aging neuroscience, 11:220, 2019.
- Khadanga et al. (2019) Swaraj Khadanga, Karan Aggarwal, Shafiq R. Joty, and Jaideep Srivastava. Using clinical notes with time series data for ICU management. CoRR, abs/1909.09702, 2019. URL http://arxiv.org/abs/1909.09702.
- Liang et al. (2022) Yi Liang, Turdi Tohti, and Askar Hamdulla. Multimodal false information detection method based on text-cnn and se module. PloS one, 17:e0277463, 11 2022. doi: 10.1371/journal.pone.0277463.
- Lin et al. (2022) Tianyang Lin, Yuxin Wang, Xiangyang Liu, and Xipeng Qiu. A survey of transformers. AI Open, 3:111–132, 2022. ISSN 2666-6510. doi: https://doi.org/10.1016/j.aiopen.2022.10.001. URL https://www.sciencedirect.com/science/article/pii/S2666651022000146.
- Lui & Chow (2018) Hin Wai Lui and King Lau Chow. Multiclass classification of myocardial infarction with convolutional and recurrent neural networks for portable ecg devices. Informatics in Medicine Unlocked, 13:26–33, 2018. ISSN 2352-9148. doi: https://doi.org/10.1016/j.imu.2018.08.002. URL https://www.sciencedirect.com/science/article/pii/S2352914818301333.
- Mishra et al. (2016) Ankita Mishra, Ashutosh Kumar Singh, and Sitanshu Sekhar Sahu. Ecg signal denoising using time-frequency based filtering approach. 2016 International Conference on Communication and Signal Processing (ICCSP), pp. 0503–0507, 2016. doi: 10.1109/ICCSP.2016.7754188.
- Park et al. (2022) Junsang Park, Junho An, Jinkook Kim, Sunghoon Jung, Yeongjoon Gil, Yoojin Jang, Kwanglo Lee, and Il young Oh. Study on the use of standard 12-lead ecg data for rhythm-type ecg classification problems. Computer Methods and Programs in Biomedicine, 214:106521, 2022. ISSN 0169-2607. doi: https://doi.org/10.1016/j.cmpb.2021.106521. URL https://www.sciencedirect.com/science/article/pii/S0169260721005952.
- Ribeiro et al. (2020) Antonio H. Ribeiro, Manoel Horta Ribeiro, Gabriela Paixão, Derick Oliveira, Paulo Gomes, Jéssica Canazart, Milton Ferreira, Carl Andersson, Peter Macfarlane, Wagner Meira Jr, Thomas Schön, and Antonio Luiz Ribeiro. Automatic diagnosis of the 12-lead ecg using a deep neural network. Nature Communications, 11, 04 2020. doi: 10.1038/s41467-020-15432-4.
- S & K (2022) Chandru A. S and Seetharam K. Processing of clinical notes for efficient diagnosis with dual lstm. International Journal of Advanced Computer Science and Applications, 13(2), 2022. doi: 10.14569/IJACSA.2022.0130247. URL http://dx.doi.org/10.14569/IJACSA.2022.0130247.
- Sherstinsky (2018) Alex Sherstinsky. Fundamentals of recurrent neural network (RNN) and long short-term memory (LSTM) network. CoRR, abs/1808.03314, 2018. URL http://arxiv.org/abs/1808.03314.
- Smith et al. (2019) Stephen W. Smith, Jeremy Rapin, Jia Li, Yann Fleureau, William Fennell, Brooks M. Walsh, Arnaud Rosier, Laurent Fiorina, and Christophe Gardella. A deep neural network for 12-lead electrocardiogram interpretation outperforms a conventional algorithm, and its physician overread, in the diagnosis of atrial fibrillation. IJC Heart & Vasculature, 25:100423, 2019. ISSN 2352-9067. doi: https://doi.org/10.1016/j.ijcha.2019.100423. URL https://www.sciencedirect.com/science/article/pii/S2352906719301241.
- Tan et al. (2017) Chuanqi Tan, Fuchun Sun, Wenchang Zhang, Jianhua Chen, and Chunfang Liu. Multimodal classification with deep convolutional-recurrent neural networks for electroencephalography. In Neural Information Processing: 24th International Conference, ICONIP 2017, Guangzhou, China, November 14-18, 2017, Proceedings, Part II 24, pp. 767–776. Springer, 2017.
- Vaswani et al. (2017) Ashish Vaswani, Noam Shazeer, Niki Parmar, Jakob Uszkoreit, Llion Jones, Aidan N. Gomez, Lukasz Kaiser, and Illia Polosukhin. Attention is all you need. CoRR, abs/1706.03762, 2017. URL http://arxiv.org/abs/1706.03762.
- Wagner et al. (2020) Patrick Wagner, Nils Strodthoff, Ralf-Dieter Bousseljot, Wojciech Samek, and Tobias Schaeffter. Ptb-xl, a large publicly available electrocardiography dataset (version 1.0.1). 2020. URL https://doi.org/10.13026/x4td-x982.
- Zerveas et al. (2020) George Zerveas, Srideepika Jayaraman, Dhaval Patel, Anuradha Bhamidipaty, and Carsten Eickhoff. A transformer-based framework for multivariate time series representation learning. 2020. doi: 10.48550/ARXIV.2010.02803. URL https://arxiv.org/abs/2010.02803.
- Zhang et al. (2020) D Zhang, C Yin, J Zeng, X Yuan, and P Zhang. Combining structured and unstructured data for predictive models: a deep learning approach. BMC medical informatics and decision making, 20, 2020. doi: 10.1186/s12911-020-01297-6.
Appendix