The Dark Side of Using Dark Sirens to Constrain the Hubble-Lemaître Constant
Abstract
Dark sirens, i.e., gravitational-wave (GW) sources without electromagnetic counterparts, are new probes of the expansion of the Universe. The efficacy of this method relies on correctly localizing the host galaxies. However, recent theoretical studies have shown that astrophysical environments could mislead the spatial localization by distorting the GW signals. It is unclear whether and to what degree the incorrect spatial localizations of dark sirens would impair the accuracy of the measurement of the cosmological parameters. To address this issue, we consider the future observations of dark sirens using the Cosmic Explorer and the Einstein Telescope, and we design a Bayesian framework to access the precision of measuring the Hubble-Lemaître constant . Interestingly, we find that the precision is not compromised when the number of well-localized dark sirens is significantly below , even in the extreme scenario that all the dark sirens are localized incorrectly. As the number exceeds , the incorrect spatial localizations start to produce statistically noticeable effects, such as a slow convergence of the posterior distribution of . We propose several tests that can be used in future observations to verify the spatial localizations of dark sirens. Simulations of these tests suggest that incorrect spatial localizations will dominate a systematic error of if as much as of a sample of well-localized dark sirens are affected by their environments. Our results have important implications for the long-term goal of measuring to a precision of using dark sirens.
1 Introduction
The detection of gravitational waves by the Laser Interferometer Gravitational-wave Observatory (LIGO) and the Virgo detectors (Abbott et al., 2019, 2021b, 2021c) opened the possibility of using GWs as a new messenger to measure the geometry of the Universe. The idea was proposed in Schutz (1986) where the author suggested combining the luminosity distance of a GW source and the redshift of its electromagnetic (EM) counterpart to measure the expansion of the Universe. Such an idea, more widely known as the “standard siren” (Holz & Hughes, 2005), was put to the test immediately after the detection of a binary neutron star merger (Abbott et al., 2017a, b; Hjorth et al., 2017; Abbott et al., 2017c; Fishbach et al., 2019; Abbott et al., 2021a, d; Soares-Santos et al., 2019; Palmese et al., 2020; Vasylyev & Filippenko, 2020; Finke et al., 2021), which by now has achieved a precision of about (Abbott et al., 2021d) for the measurement of the Hubble-Lemaître constant, or better if provided additional information such as observations of jets (Hotokezaka et al., 2019; Mukherjee et al., 2021). Given the current discrepancy at confidence level between the Hubble-Lemaître constants measured from the observations of type-Ia supernovae and the cosmic microwave background (CMB) (Freedman, 2017; Riess, 2019; Di Valentino et al., 2021; Perivolaropoulos & Skara, 2022), it is expected that standard sirens, as an independent method, could help resolve the tension (Abbott et al., 2018, 2017d; Reitze et al., 2019a; Punturo et al., 2010; Chen et al., 2021).
To qualify as a standard siren, the source should provide observables from which both the luminosity distance and the redshift can be obtained. While the luminosity distance is a direct observable from GW signal, the redshift is not always acquirable. In particular, mergers of binary black holes, although predominant among the LIGO/Virgo event, are generally not expected to emit detectable EM radiation (Schutz, 1986) and hence are normally referred to as “dark sirens” (or “dark standard sirens”, Soares-Santos et al., 2019).
The redshifts of dark sirens need to be obtained by alternative means. One standard method is marginalizing the redshifts of the galaxies in the error volume pinned down by GW detectors (Schutz, 1986; MacLeod & Hogan, 2008; Petiteau et al., 2011; Del Pozzo, 2012; Fishbach et al., 2019; Soares-Santos et al., 2019; Palmese et al., 2020; Abbott et al., 2021a, d). Such a marginalization could introduce large statistical errors in the resulting cosmological parameters, because there are normally to a few galaxies in the error volume localized by each dark siren. However, the overwhelmingly large number of dark sirens (Maggiore et al., 2020; Evans et al., 2021) could compensate for the weakness of each one and thus altogether provide a precise measurement of the cosmological parameters. As the number of dark sirens increases, the precision could be comparable with, if not better than, the precision using a more limited sample of (bright) standard sirens, as recent studies suggest (Del Pozzo, 2012; Chen et al., 2018; Fishbach et al., 2019; Gray et al., 2020; Borhanian et al., 2020; Yu et al., 2020; Muttoni et al., 2022; Zhu et al., 2022b).
To better estimate the redshifts of dark sirens, more sophisticated methods have been devised (Fishbach et al., 2019; Gray et al., 2020; Finke et al., 2021; Zhu et al., 2022b; Gupta, 2022). These methods are based on a key assumption, which is that the error volume localized by GW detectors truly contains the host galaxy of a dark siren. This assumption may not always be valid in light of the recent theoretical discovery that GW signals could have been distorted by the astrophysical environments in which the waves are produced and propagating (see Chen, 2021, for a summary). For example, strong gravitational lensing could make a GW source appear more distant (Smith et al., 2018; Broadhurst et al., 2018). Gravitational redshift (Chen et al., 2019; Chen, 2021) or acceleration of the source around a massive body (Robson et al., 2018; Tamanini et al., 2020; Chen, 2021), as well as the gas surrounding the source (Chen & Shen, 2019; Chen et al., 2020; Caputo et al., 2020), could bias the measurement of the mass of the source and, in turn, induce an error in the inference of the luminosity distance. In addition, the eccentricity of the orbit of a binary (Gayathri et al., 2021, 2022) and the nonstationary noise of detectors (Edy et al., 2021; Kumar et al., 2022), if not appropriately account for, could also result in biased localization of the source.
Therefore, it is possible that unmodeled astrophysical factors could lead us to an error volume that does not contain the true spatial position of a dark siren. In this case, a redshift can still be compiled using the galaxies in the incorrect volume. But the redshift is physically unrelated to the luminosity distance (incorrectly) inferred from the GW signal. It is unclear how common such a mismatch is and how seriously it could hamper the effort of accurately measuring the cosmological parameters using dark sirens.
Here, we try to address the above questions. The paper is organized as follows. In Section 2, we introduce the Bayesian framework that we use to infer cosmological parameters from the observations of dark sirens. In Section 3, we conduct mock observations assuming next-generation GW detectors. The results are shown in Section 4, where we also test the methods of verifying the reliability of the candidate host galaxies of dark sirens. In Section 5, we discuss the dependence on the fraction of false candidate host galaxies for unbiased cosmological parameter estimation. Finally, in Section 6, we summarize the main findings of this work and conclude with the implications of our results.
2 Methodology
2.1 Cosmological model
We assume that the expansion of the late Universe can be described by a flat cold dark matter (flat-CDM) cosmological model. The evolution of the expansion rate with redshift can be expressed as
| (1) |
where is the Hubble-Lemaître constant describing the current expansion rate of the Universe, is the matter density normalized by the critical density, and is the fractional density of dark energy.
Because we are interested in the relationship between the luminosity distance of a GW source and the redshift of its host galaxy, we use
| (2) |
to link the two quantities, where is the speed of light. In this cosmological model, the set of independent parameters are .
2.2 Bayesian framework
To extract the cosmic expansion information from GW and EM data, we adopt the Bayesian framework presented in Chen et al. (2018) (also see Gray et al., 2020; Finke et al., 2021; Zhu et al., 2022b). This framework uses a data set composed of independent GW events as well as the corresponding EM counterparts to infer the probability distribution (known as the posterior) of the cosmological parameters. Using the above notations, the posterior can be written as
| (3) |
where indicates all the relevant additional information.
The term denotes the likelihood of the data for the th event. Because the data contain noise, different sources with different luminosity distances , redshifts , sky longitudes and latitudes may result in the same data. Therefore, the likelihood is a marginalization of all possible , i.e.,
| (4) |
Here, is a normalization factor that accounts for the selection effects in GW (Fishbach & Holz, 2017; Abbott et al., 2019; Mandel et al., 2019) and EM observations (Chen et al., 2018). To calculate the probability , we separate it into
| (5) |
The term is the marginalized likelihood of the GW data (Finn, 1992), and is the likelihood of the observational data of the EM counterpart. For dark sirens, there is no information for their EM counterparts, so we can set to null, as well as set the likelihood to constant (Chen et al., 2018). The term is a Dirac delta function, i.e., , since is uniquely determined by given a cosmological model.
In Equation (2.2), is a prior. To calculate it, we adopt the standard assumption that it is proportional to the number density of galaxies (Schutz, 1986; MacLeod & Hogan, 2008; Petiteau et al., 2011; Del Pozzo, 2012; Chen et al., 2018; Fishbach et al., 2019; Gray et al., 2020; Finke et al., 2021). Taking into account the fact that many galaxies are too dim to be detected, we write the prior as
| (6) |
where is a distribution function compiled from galaxy surveys, represents the distribution of the undetected galaxies, and is a fraction denoting the completeness of the galaxy catalog (also see Chen et al., 2018; Fishbach et al., 2019).
The value of is determined as follows. (i) For the observed galaxy distribution function, we calculate it with
| (7) |
where is the total number of the observed galaxies and is a Gaussian distribution of with an expectation and a standard deviation . Here, we introduced two delta functions because the sky-localization errors in galaxy surveys are much smaller than those in GW observations. (ii) For the undetected galaxies, we adopt the expression
| (8) |
from Chen et al. (2018), assuming an isotropic and homogeneous universe, where is the probability of a galaxy at being in the survey galaxy catalog, is the comoving volume, and represents the differential solid angle. It should be noted here that is defined as the angle with respect to the celestial equatorial plane. (iii) The completeness fraction is calculated with
| (9) |
where is the minimum(maximum) redshift of all the candidates of the host galaxy of a GW source, and is the total comoving volume enclosed within .
To calculate the denominator in Equation (2.2), we need to consider the selection effects in observations because we can only detect those GW or EM sources that exceed certain detection thresholds (Chen et al., 2018). Since the EM data can be set to null for dark sirens, the denominator is determined solely by the GW sources. Following Chen et al. (2018), we calculate it with
| (10) |
where is a cosmological prior distribution of all possible galaxies. For an isotropic and homogeneous universe, we have . Moreover, we define
| (11) |
and Equation (2.2) then becomes
| (12) |
The term describes the probability that a GW event at will be detected. The other term describes the probability that a galaxy is at redshift and can be calculated with
| (13) |
(Zhu et al., 2022a, b), where is a smoothing interval that needs to be much larger than the typical redshift scale of a galaxy cluster, and the expression of the integrand is shown in Equation (2.2).
2.3 True and false candidate host galaxies
The effectiveness of using dark sirens to constrain cosmological parameters relies on deriving a statistically correct distribution function for the redshift of a GW source. Two factors could potentially impair the reliability of the derived redshift. (i) The galaxy catalog is likely incomplete, such that it may miss the true host galaxy of a GW source. (ii) If the models of the GW signal or the detector noise are inaccurate, the spatial localization of a GW source will be biased.
The first factor is not catastrophic. Given that most galaxies form in clusters, the brightest galaxies in a galaxy cluster still provide a statistically correct redshift even if the true host galaxy of the dark siren is too dim to be observed. Although the redshifts of the brightest cluster members and the redshift of the true host galaxy are not exactly the same, the difference has been accounted for in our Bayesian framework by the completeness fraction in Equation (2.2). For simplicity, in the following, we refer to the galaxies that are physically correlated with the true host galaxy of a dark siren as the “true candidate host galaxies”.
The second factor is more detrimental. In this case, the galaxies found at the luminosity distance and sky location inferred from the GW data may be physically uncorrelated with the GW source. Therefore, the redshift distribution provided by the galaxies in the incorrect error volume is inconsistent with the true redshift of the dark siren. This mismatch could result in a large bias in the inference of the cosmological parameters. These galaxies are referred to as the “false candidate host galaxies” in this work.
3 Mock observation
To understand the impact of the false candidate host galaxies on the estimation of the cosmological parameters, we will conduct mock observations of the host galaxies of the dark sirens, and simulate future observational constraint on the Hubble-Lemaître constant using such galaxies. Our simulation is divided into three steps. (i) Generate a mock catalog of merging stellar-mass binary black holes and distribute them in the galaxies selected from a cosmological numerical simulation. (ii) Conduct mock observations of the candidate host galaxies of the SBBHs to derive the statistical probability distribution of the redshift for each binary. (iii) Calculate the total posterior probability distributions of the cosmological parameters using the luminosity distances of the dark sirens and the statistical redshifts provided by the candidate host galaxies. The details are as follows.
First, we generate a population of SBBHs using the “Power Law + Peak” model presented in Abbott et al. (2021e). The direction of the orbital angular momentum is assumed to be random. The spin parameter is uniformly distributed in the range of . The merger time is chosen randomly between and years, and the merger phase is also random. Given these parameters, the GW signal is generated using the IMRPhenomPv2 waveform model (Hannam et al., 2014; Schmidt et al., 2015).
For each binary in our mock catalog, we assign a host galaxy that is randomly selected from the galaxy catalog of the MultiDark cosmological simulations (Klypin et al., 2016; Croton et al., 2016; Conroy et al., 2009). We note that the cosmological parameters used in the simulations are and . Because we are mainly interested in studying the expansion of the late Universe, we restrict the selected galaxies to .
To evaluate the detectability of a SBBH GW event, we consider a network composed of the Einstein Telescope (ET) (Punturo et al., 2010) and the Cosmic Explorer (CE) (Abbott et al., 2017d). The models for the sensitivity curves are ET-D (Hild et al., 2011) and CE2 (Reitze et al., 2019a, b). The response of the network to a GW signal is computed using the low-frequency approximation (Thorne, 1987), where we have taken the rotation of the Earth into account (Zhao & Wen, 2018).
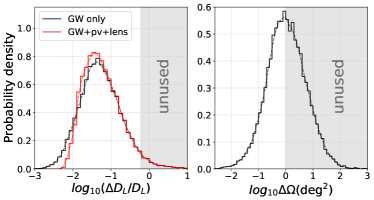
Second, for each detectable SBBH, we select the candidate host galaxies from the same MultiDark galaxy catalog according to the spatial localization inferred from the GW data. These galaxies are used to compile the probability distribution of the redshift of the dark siren. There are multiple candidates because there are large errors in the inferred luminosity distance and sky location. In our simulation, these errors are derived according to the Fisher information matrix (Cutler & Flanagan, 1994; Poisson & Will, 1995; Vallisneri, 2008) with a confidence interval (CI). In particular, we have also included additional errors in luminosity distance caused by the peculiar velocities of the galaxies and the weak-lensing effect (Kocsis et al., 2006; Hirata et al., 2010). Figure 1 shows the spatial localization errors, including the error in luminosity distance, , and the error in sky localization . We can see that, on average, and . In this study, we only use those SBBHs with relatively small localization errors, namely (equivalent to at the confidence level of ) and , because the sources with larger localization errors have less constraining power on the cosmological parameters.
It is important to mention that luminosity distances are not directly observable in galaxy surveys. The real observables are the redshifts of galaxies. Therefore, we must convert the luminosity distance inferred from GW data into the information on redshift before we can select the candidate host galaxies for a dark siren. The conversion is performed using the relationship
| (14a) | ||||
| (14b) | ||||
where and are the minimum and maximum values of given by the prior of the cosmological parameters, is the range of luminosity distance allowed by the GW data, and and are the resulting minimum and maximum values for the redshift. For the prior, we choose a uniform distribution of in the range of and a uniform distribution of in . We do not consider the observational errors in the spectroscopic redshifts of the host galaxies, because they are small in the redshift range of our interest (Aghamousa et al., 2016; Gardner et al., 2006; Gong et al., 2019). Given such redshift information, the candidate host galaxies of a dark siren are selected from an “error volume” of a size of in the MultiDark galaxy catalog.
Moreover, we must include the selection effect that exists in real galaxy surveys. In our simulation, the probability that a galaxy with an apparent magnitude of is observed is
| (15) |
where is the uncertainty in measuring the magnitude and is the limiting magnitude of the galaxy survey. We assume a conservative value of and use to mimic future observations by the Chinese Space Station Telescope (CSST) (Gong et al., 2019).
By now, we have selected the true candidate host galaxies. However, we also need to simulate the observations of the false candidate host galaxies in order to understand their potential impact. Previous studies have shown that the dark sirens at different cosmological distances will lead to systematically different constraints on the cosmological parameters (Zhu et al., 2022a). To eliminate this statistical difference correlated with distance and single out the effects caused by the incorrect identification of the candidate host galaxies, we simplify our problem by keeping the luminosity distance and its error constant, while changing only the sky localization. Therefore, we introduce a displacement to the true sky localization. Using this displaced sky localization and the same luminosity distance information, we select the false candidate host galaxies from the incorrect error volume. In this way, the selected galaxies are physically uncorrelated with the true host galaxy of the dark sirens, but in the redshift space the true and false candidate host galaxies share the same distribution. In this work, the values of the displacement, , are randomly generated within the boundary of the sky area of the galaxy survey. To ensure that the displaced sky position does not overlap with the true position of the GW source, we also impose a lower limit to the displacement, which is determined by where is the covariance matrix of the sky localization of the dark siren. This way, the inconsistency between the displaced and the true sky localization is not less than .
Third, we use the statistical redshift distributions of true and false candidate host galaxies to compute the posterior probability distributions of the cosmological parameters. The calculation is based on Equations (2.2). In the calculation, we use the Markov Chain Monte Carlo (MCMC) method to accelerate the calculation. Moreover, we use the emcee library, which is a Python-based affine invariant MCMC ensemble (Foreman-Mackey et al., 2013, 2019).
4 Results
4.1 Constraints on the cosmological parameters
One merit of using dark sirens to constrain cosmological parameters is that the precision improves with the number of dark sirens. This may no longer be true when the dark sirens with false candidate host galaxies are present. Therefore, we first study the precisions of the cosmological parameters as a function of the number of dark sirens, .
We consider a number of values for , namely , , , , and , which are almost equally spanned in the logarithmic space. Our maximum number is reasonable because (i) the “Power Law+Peak” population model (Abbott et al., 2021e) for SBBHs predicts that about SBBHs at would merge within a period of years, and (ii) about one-third of them could be covered by the current and future galaxy surveys (Aghamousa et al., 2016; Gong et al., 2019; Scaramella et al., 2022).
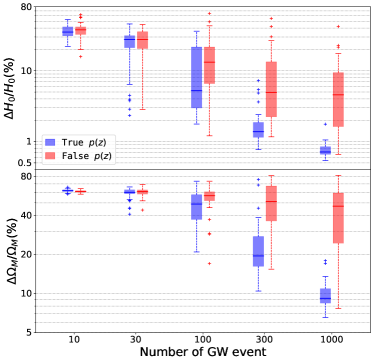
Figure 2 shows the dependence of the relative errors of and on . The median values for the errors are shown as the short horizontal bars inside the boxes, while the boxes show the CI based on 48 trials. When , the error corresponding to true candidate host galaxies is statistically comparable with the error derived from false candidate host galaxies. However, as soon as reaches , the difference between the two errors becomes statistically significant: the latter becomes substantially larger than the former. In particular, when the median precisions of and become better than and , respectively, if true candidate host galaxies are used in the simulations. On the other hand, the median precisions corresponding to false candidate host galaxies are worse by a factor of about five.
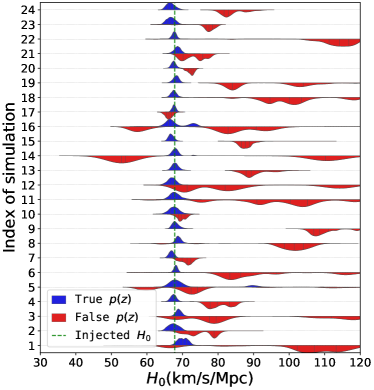
Figure 2 also shows that, as soon as reaches , the spread of the CI (the length of a box) becomes statistically different in the two kinds of simulations. The spread is systematically wider in the simulations with false candidate host galaxies. The reason can be found in Figure 3, where we show the posterior distributions of from the first 24 trial simulations when . We find that, when we use true candidate host galaxies (blue), the posterior distribution in each trial simulation is relatively concentrated around the true value of . Moreover, only in three trials (1, 5, and 16) do we see significant secondary peaks offset from the true value. On the other hand, the simulations using false candidate host galaxies (red) more often produce multiple peaks, and the locations of the peaks are widespread. Such randomness is a direct consequence of the incorrect redshift distribution compiled from the incorrect candidate host galaxies.
We notice that, when , the CIs given by the simulations with true candidate host galaxies are much broader than those given by false candidate host galaxies. This is because, when the number of dark sirens is small, e.g. , the GW catalog may or may not contain very precisely localized dark sirens (e.g., ). Without such well-localized dark sirens, the constraint on cosmological parameters would be relatively weak.
The above results suggest that, in the future, with about dark sirens, we can start to assess the reliability of our modeling of the GW signals. A small dispersion in the posterior distribution of the cosmological parameters may suggest that the selected galaxies are indeed physically correlated with the true host galaxies of the dark sirens. Therefore, the model which we use to infer the spatial localization of a GW source is accurate. If the posterior distribution has a large dispersion, the model is unlikely to be accurate, and it may miss the effects caused by the astrophysical environments, as we have discussed in Section 1.
4.2 Testing the reliability of the candidate host galaxies
Besides evaluating the posterior distribution functions of the cosmological parameters, we also design two other methods that can be used to infer the reliability of the selection of the candidate host galaxies for dark sirens.
The first method is a translation of the sky position. In this method, we search for the candidate host galaxies of a dark siren in two different error volumes: an original error volume derived directly from the GW data, and the other is obtained by artificially shifting the sky position of the original error volume by a large angle. We then compute the posterior distribution function of using the galaxies selected from the above two error volumes and derive the corresponding error . The reliability of the host galaxies can be inferred as follows. (i) If the original error volume contains the true host galaxy, the error should increase significantly after the translation of the sky position, because the shifted error volume contains only physically unrelated false candidate host galaxies. (ii) If, on the other hand, the original error volume contains only false candidate host galaxies, the before and after the translation of sky position should be statistically comparable.
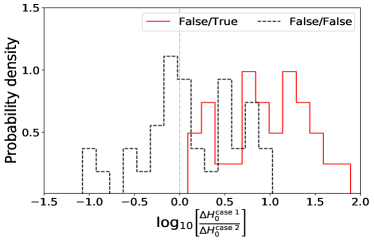
Figure 4 shows the probability distribution of the ratio between the two errors, one derived before the sky translation and the other after the sky translation. If the original error volumes (before the sky translation) contain the true host galaxy (red solid histogram), we find that, in all our simulations, the ratio will be greater than unity, i.e., the error worsens after the sky translation. In particular, the ratio may exceed in about of the simulations. If the original error volume contains only false candidate host galaxies (black dashed histogram), the probability that the ratio of is greater than unity is comparable to the probability of being smaller than unity. Moreover, the ratio hardly exceeds in this latter case. These results are generally consistent with our earlier prediction that a sky translation worsens the constraint on cosmological parameters if the original sky localization is accurate. On the contrary, the sky translation does not significantly affect the constraint if the original sky localization is inaccurate.
Based on the above results, we suggest a value of as the threshold of verifying the reliability of the sky localization of dark sirens. If the error of increases by a factor of after a sky translation, the original error volumes where we search for the host galaxies of dark sirens are likely to be correct. If the error of increases by a factor less than , the original error volumes should be taken with caution because they may miss the host galaxies in about 57% of the cases.
We note that our method is based on ideal assumptions about the completeness of the galaxy catalog. In practice, it is important to ensure that the survey depth and dust extinction are comparable in the error volumes before and after the sky translation. Otherwise, the completeness of the galaxy catalog will also affect the errors of the cosmological parameters.
The second method we use to test the reliability of the candidate host galaxies is the consistency check (Petiteau et al., 2011). It divides dark sirens into smaller groups and performs Bayesian inference independently on each group. If the spatial localization is correct and the candidate host galaxies are reliable, the posterior probabilities for different groups should be consistent. Alternatively, if the spatial localization is mostly incorrect and the selected host galaxies are false, the posteriors will be more random.
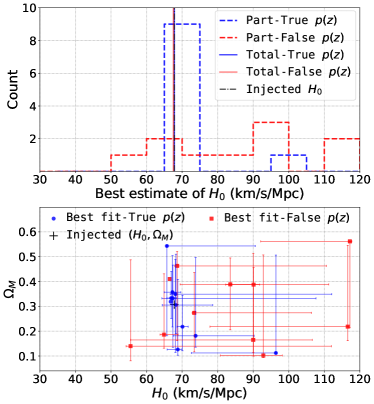
Figure 5 shows the result of such a test using dark sirens. Without dividing into groups and analyzing as a whole population, the dark sirens will result in a similar posterior distribution (see the vertical lines in the upper panel) regardless of the kind of host galaxies we use (as see Appendix A). However, if we divide them into groups and perform Bayesian inference separately, the results for true and false candidate host galaxies become different. We can see that the posteriors of the groups are consistent when the true candidate host galaxies are used in the simulation (blue), but the posteriors largely differ when we use false candidate host galaxies (red).
5 Discussion
So far, we have studied the cases in which the fraction of false candidate host galaxies for dark sirens is either or . In reality, both true and false candidate host galaxies may exist in the sample. A higher normally results in a larger bias in the estimation of the cosmological parameters. Here, we use a percentile-percentile (P-P) plot (Cook et al., 2006) to demonstrate the dependence of the bias on the fraction of the false candidate host galaxies.
An example is shown in Figure 6. When all the spatial localizations are accurate, the estimation of is unbiased, the fraction of trial simulations whose true values of fall within specific CIs as a function of the corresponding CIs (this is referred to as a P-P plot), should be along the diagonal line, as shown by the black dot-dashed line. Statistical fluctuation will blur the distribution, as is illustrated by the dark and light shaded areas in the plot, but the result should be still consistent with the diagonal.
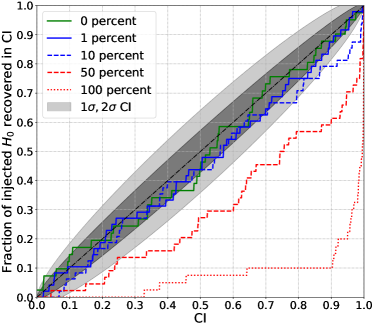
When the spatial localizations for a fraction of dark sirens are false, the P-P plot will deviate from the diagonal, as is shown by the colored histograms in Figure 6. Here, we have used trial simulations to compile each histogram, and in each simulation we consider dark sirens. We find that when the fraction of false spatial localization is no more than about , the corresponding histograms are consistent with the diagonal line within the CI. In this case, the estimation of is more or less unbiased. However, when , the histograms start to exceed the CI, indicating a significant bias in the estimation of . In particular, when or , the histogram is mostly outside the CI. This result is not surprising, because now false candidate host galaxies predominate.
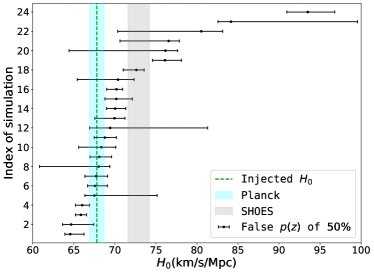
Figure 7 shows more clearly the bias of the estimated when half of the spatial localizations are false (). We find that the posterior distributions no longer center around the injected value of . In particular, out of the simulations show a bias between the posterior and the injected . In seven cases (No. 18-24), we find that the posterior distribution functions for are more consistent with the observations of type-Ia supernovae even though the value we injected is clearly from the measurement of CMB. This result highlights the risk of using dark sirens to constrain cosmological parameters when the environmental effects on GW signals are not well understood.
6 Conclusion
Recent studies have shown that the astrophysical environments of GW sources could significantly perturb the GW signals. Neglecting such an effect would lead to systematic biases in the estimation of the distance and sky position of a GW source. In this work, we have studied the consequences of such a bias on the measurement of the cosmological parameters such as the Hubble-Lemaître constant.
Our main findings are as follows. (i) The biased spatial localization will result in an incorrect statistical probability distribution for the redshift of a dark siren, which will in turn weaken and bias the constraint on the cosmological parameters. (ii) The reliability of the statistical redshifts of dark sirens can be tested by two methods, namely a sky translation and a consistency check. (iii) The constraints on cosmological parameters by dark sirens will be significantly biased if more than of the dark sirens are localized incorrectly.
The above findings are based on the assumption that more than dark sirens can be detected and localized well. It is worth noting that, in our analysis, we only use the GW sources with a localization error of . The total number of detected dark sirens is approximately twice the number of the above well-localized ones. If the number of well-localized dark sirens is significantly below , we find that the presence of false candidate host galaxies does not significantly affect the distribution of error. The same is true even in the extreme scenario that all the candidate host galaxies are inferred incorrectly. This result indicates that, when the number of dark sirens is low (e.g. ), the distribution of precisions of is limited mainly by the intrinsic uncertainty of the method, i.e., the statistical uncertainty in compiling the redshift distribution of the host galaxy of a dark siren.
Several recent studies have predicted that the third generation of ground-based GW detectors can constrain the Hubble-Lemaître constant to an precision as high as using dark sirens (Yu et al., 2020; Song et al., 2022). However, the sky localizations of a few to a dozen percent of the dark sirens may be biased by nearby SMBHs (Peng & Chen, 2021, e.g.), strong gravitational lensing (Broadhurst et al., 2018, 2022; Yang et al., 2021; Smith et al., 2018), or non-stationary detector noise (Edy et al., 2021; Kumar et al., 2022). Without properly modeling these effects, the constraint on the Hubble-Lemaître constant is likely to be much weaker.
acknowledgments
This work is supported by the National Natural Science Foundation of China grants Nos. 11991053 and 11873022. We acknowledge the use of the TianQin cluster, a supercomputer owned by the TianQin Research Center for Gravitational Physics, Sun Yat-sen University, and of the Tianhe-2, a supercomputer owned by the National Supercomputing Center in GuangZhou. The authors also thank Yi-Ming Hu, Jian-dong Zhang, Shuai Liu, and En-Kun Li for helpful discussions, and especially Yi-Ming Hu for important suggestions on the structure of this paper.
Appendix A Similar constraints resulting from different galaxies
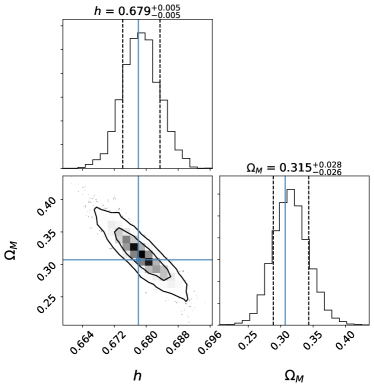
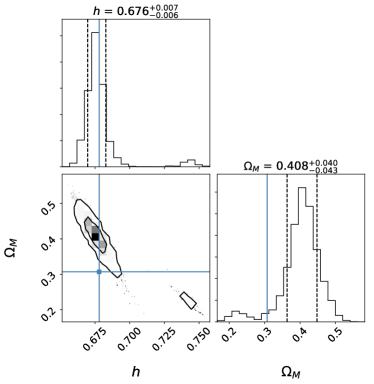
Our simulations show that sometimes false candidate host galaxies will result in a posterior distribution of cosmological parameters that is similar to the one given by the true candidate host galaxies. Figure A8 shows an example where we compare the corner plots made from the true (left subplot) and false (right subplot) host galaxies. A consistency check based on this example is presented in Figure 5.
References
- Abbott et al. (2017a) Abbott, B. P., et al. 2017a, Astrophys. J. Lett., 848, L13, doi: 10.3847/2041-8213/aa920c
- Abbott et al. (2017b) —. 2017b, Astrophys. J. Lett., 848, L12, doi: 10.3847/2041-8213/aa91c9
- Abbott et al. (2017c) —. 2017c, Nature, 551, 85, doi: 10.1038/nature24471
- Abbott et al. (2017d) —. 2017d, Class. Quant. Grav., 34, 044001, doi: 10.1088/1361-6382/aa51f4
- Abbott et al. (2018) —. 2018, Living Rev. Rel., 21, 3, doi: 10.1007/s41114-020-00026-9
- Abbott et al. (2019) —. 2019, Phys. Rev. X, 9, 031040, doi: 10.1103/PhysRevX.9.031040
- Abbott et al. (2021a) —. 2021a, Astrophys. J., 909, 218, doi: 10.3847/1538-4357/abdcb7
- Abbott et al. (2021b) Abbott, R., et al. 2021b. https://arxiv.org/abs/2108.01045
- Abbott et al. (2021c) —. 2021c. https://arxiv.org/abs/2111.03606
- Abbott et al. (2021d) —. 2021d. https://arxiv.org/abs/2111.03604
- Abbott et al. (2021e) —. 2021e. https://arxiv.org/abs/2111.03634
- Ade et al. (2016) Ade, P. A. R., et al. 2016, Astron. Astrophys., 594, A13, doi: 10.1051/0004-6361/201525830
- Aghamousa et al. (2016) Aghamousa, A., et al. 2016. https://arxiv.org/abs/1611.00036
- Borhanian et al. (2020) Borhanian, S., Dhani, A., Gupta, A., Arun, K. G., & Sathyaprakash, B. S. 2020, Astrophys. J. Lett., 905, L28, doi: 10.3847/2041-8213/abcaf5
- Broadhurst et al. (2018) Broadhurst, T., Diego, J. M., & Smoot, G. 2018. https://arxiv.org/abs/1802.05273
- Broadhurst et al. (2022) Broadhurst, T., Diego, J. M., & Smoot, G. F. 2022. https://arxiv.org/abs/2202.05861
- Caputo et al. (2020) Caputo, A., Sberna, L., Toubiana, A., et al. 2020, Astrophys. J., 892, 90, doi: 10.3847/1538-4357/ab7b66
- Chen et al. (2021) Chen, H.-Y., Cowperthwaite, P. S., Metzger, B. D., & Berger, E. 2021, Astrophys. J. Lett., 908, L4, doi: 10.3847/2041-8213/abdab0
- Chen et al. (2018) Chen, H.-Y., Fishbach, M., & Holz, D. E. 2018, Nature, 562, 545, doi: 10.1038/s41586-018-0606-0
- Chen (2021) Chen, X. 2021, Distortion of Gravitational-Wave Signals by Astrophysical Environments, doi: 10.1007/978-981-15-4702-7_39-1
- Chen et al. (2019) Chen, X., Li, S., & Cao, Z. 2019, Mon. Not. Roy. Astron. Soc., 485, L141, doi: 10.1093/mnrasl/slz046
- Chen & Shen (2019) Chen, X., & Shen, Z.-F. 2019, MDPI Proc., 17, 4, doi: 10.3390/proceedings2019017004
- Chen et al. (2020) Chen, X., Xuan, Z.-Y., & Peng, P. 2020, Astrophys. J., 896, 171, doi: 10.3847/1538-4357/ab919f
- Conroy et al. (2009) Conroy, C., Gunn, J. E., & White, M. 2009, Astrophys. J., 699, 486, doi: 10.1088/0004-637X/699/1/486
- Cook et al. (2006) Cook, S. R., Gelman, A., & Rubin, D. B. 2006, Journal of Computational and Graphical Statistics, 15, 675, doi: 10.1198/106186006X136976
- Croton et al. (2016) Croton, D. J., Stevens, A. R. H., Tonini, C., et al. 2016, Astrophys. J. Suppl., 222, 22, doi: 10.3847/0067-0049/222/2/22
- Cutler & Flanagan (1994) Cutler, C., & Flanagan, E. E. 1994, Phys. Rev. D, 49, 2658, doi: 10.1103/PhysRevD.49.2658
- Del Pozzo (2012) Del Pozzo, W. 2012, Phys. Rev. D, 86, 043011, doi: 10.1103/PhysRevD.86.043011
- Di Valentino et al. (2021) Di Valentino, E., Mena, O., Pan, S., et al. 2021, Class. Quant. Grav., 38, 153001, doi: 10.1088/1361-6382/ac086d
- Edy et al. (2021) Edy, O., Lundgren, A., & Nuttall, L. K. 2021, Phys. Rev. D, 103, 124061, doi: 10.1103/PhysRevD.103.124061
- Evans et al. (2021) Evans, M., et al. 2021. https://arxiv.org/abs/2109.09882
- Finke et al. (2021) Finke, A., Foffa, S., Iacovelli, F., Maggiore, M., & Mancarella, M. 2021, JCAP, 08, 026, doi: 10.1088/1475-7516/2021/08/026
- Finn (1992) Finn, L. S. 1992, Phys. Rev. D, 46, 5236, doi: 10.1103/PhysRevD.46.5236
- Fishbach & Holz (2017) Fishbach, M., & Holz, D. E. 2017, Astrophys. J. Lett., 851, L25, doi: 10.3847/2041-8213/aa9bf6
- Fishbach et al. (2019) Fishbach, M., et al. 2019, Astrophys. J. Lett., 871, L13, doi: 10.3847/2041-8213/aaf96e
- Foreman-Mackey (2016) Foreman-Mackey, D. 2016, The Journal of Open Source Software, 1, 24, doi: 10.21105/joss.00024
- Foreman-Mackey et al. (2013) Foreman-Mackey, D., Hogg, D. W., Lang, D., & Goodman, J. 2013, Publ. Astron. Soc. Pac., 125, 306, doi: 10.1086/670067
- Foreman-Mackey et al. (2019) Foreman-Mackey, D., Farr, W., Sinha, M., et al. 2019, Journal of Open Source Software, 4, 1, doi: 10.21105/joss.01864
- Freedman (2017) Freedman, W. L. 2017, Nature Astron., 1, 0121, doi: 10.1038/s41550-017-0121
- Gardner et al. (2006) Gardner, J. P., et al. 2006, Space Sci. Rev., 123, 485, doi: 10.1007/s11214-006-8315-7
- Gayathri et al. (2021) Gayathri, V., Healy, J., Lange, J., et al. 2021, Astrophys. J. Lett., 908, L34, doi: 10.3847/2041-8213/abe388
- Gayathri et al. (2022) —. 2022, Nature Astron., 6, 344, doi: 10.1038/s41550-021-01568-w
- Gong et al. (2019) Gong, Y., Liu, X., Cao, Y., et al. 2019, Astrophys. J., 883, 203, doi: 10.3847/1538-4357/ab391e
- Gray et al. (2020) Gray, R., et al. 2020, Phys. Rev. D, 101, 122001, doi: 10.1103/PhysRevD.101.122001
- Gupta (2022) Gupta, I. 2022. https://arxiv.org/abs/2212.00163
- Hannam et al. (2014) Hannam, M., Schmidt, P., Bohé, A., et al. 2014, Phys. Rev. Lett., 113, 151101, doi: 10.1103/PhysRevLett.113.151101
- Hild et al. (2011) Hild, S., et al. 2011, Class. Quant. Grav., 28, 094013, doi: 10.1088/0264-9381/28/9/094013
- Hirata et al. (2010) Hirata, C. M., Holz, D. E., & Cutler, C. 2010, Phys. Rev. D, 81, 124046, doi: 10.1103/PhysRevD.81.124046
- Hjorth et al. (2017) Hjorth, J., Levan, A. J., Tanvir, N. R., et al. 2017, Astrophys. J. Lett., 848, L31, doi: 10.3847/2041-8213/aa9110
- Holz & Hughes (2005) Holz, D. E., & Hughes, S. A. 2005, Astrophys. J., 629, 15, doi: 10.1086/431341
- Hotokezaka et al. (2019) Hotokezaka, K., Nakar, E., Gottlieb, O., et al. 2019, Nature Astron., 3, 940, doi: 10.1038/s41550-019-0820-1
- Hunter (2007) Hunter, J. D. 2007, Comput. Sci. Eng., 9, 90, doi: 10.1109/MCSE.2007.55
- Klypin et al. (2016) Klypin, A., Yepes, G., Gottlober, S., Prada, F., & Hess, S. 2016, Mon. Not. Roy. Astron. Soc., 457, 4340, doi: 10.1093/mnras/stw248
- Kocsis et al. (2006) Kocsis, B., Frei, Z., Haiman, Z., & Menou, K. 2006, Astrophys. J., 637, 27, doi: 10.1086/498236
- Kumar et al. (2022) Kumar, S., Nitz, A. H., & Forteza, X. J. 2022. https://arxiv.org/abs/2202.12762
- LIGO Scientific Collaboration (2018) LIGO Scientific Collaboration. 2018, LIGO Algorithm Library - LALSuite, free software (GPL), doi: 10.7935/GT1W-FZ16
- MacLeod & Hogan (2008) MacLeod, C. L., & Hogan, C. J. 2008, Phys. Rev. D, 77, 043512, doi: 10.1103/PhysRevD.77.043512
- Maggiore et al. (2020) Maggiore, M., et al. 2020, JCAP, 03, 050, doi: 10.1088/1475-7516/2020/03/050
- Mandel et al. (2019) Mandel, I., Farr, W. M., & Gair, J. R. 2019, Mon. Not. Roy. Astron. Soc., 486, 1086, doi: 10.1093/mnras/stz896
- Mukherjee et al. (2021) Mukherjee, S., Lavaux, G., Bouchet, F. R., et al. 2021, Astron. Astrophys., 646, A65, doi: 10.1051/0004-6361/201936724
- Muttoni et al. (2022) Muttoni, N., Mangiagli, A., Sesana, A., et al. 2022, Phys. Rev. D, 105, 043509, doi: 10.1103/PhysRevD.105.043509
- Palmese et al. (2020) Palmese, A., et al. 2020, Astrophys. J. Lett., 900, L33, doi: 10.3847/2041-8213/abaeff
- Peng & Chen (2021) Peng, P., & Chen, X. 2021, Mon. Not. Roy. Astron. Soc., 505, 1324, doi: 10.1093/mnras/stab1419
- Perivolaropoulos & Skara (2022) Perivolaropoulos, L., & Skara, F. 2022, New Astron. Rev., 95, doi: 10.1016/j.newar.2022.101659
- Petiteau et al. (2011) Petiteau, A., Babak, S., & Sesana, A. 2011, Astrophys. J., 732, 82, doi: 10.1088/0004-637X/732/2/82
- Poisson & Will (1995) Poisson, E., & Will, C. M. 1995, Phys. Rev. D, 52, 848, doi: 10.1103/PhysRevD.52.848
- Punturo et al. (2010) Punturo, M., et al. 2010, Class. Quant. Grav., 27, 194002, doi: 10.1088/0264-9381/27/19/194002
- Reitze et al. (2019a) Reitze, D., et al. 2019a, Bull. Am. Astron. Soc., 51, 035. https://arxiv.org/abs/1907.04833
- Reitze et al. (2019b) —. 2019b, Bull. Am. Astron. Soc., 51, 141. https://arxiv.org/abs/1903.04615
- Riess (2019) Riess, A. G. 2019, Nature Rev. Phys., 2, 10, doi: 10.1038/s42254-019-0137-0
- Riess et al. (2022) Riess, A. G., et al. 2022, Astrophys. J. Lett., 934, L7, doi: 10.3847/2041-8213/ac5c5b
- Robson et al. (2018) Robson, T., Cornish, N. J., Tamanini, N., & Toonen, S. 2018, Phys. Rev. D, 98, 064012, doi: 10.1103/PhysRevD.98.064012
- Scaramella et al. (2022) Scaramella, R., et al. 2022, Astron. Astrophys., 662, A112, doi: 10.1051/0004-6361/202141938
- Schmidt et al. (2015) Schmidt, P., Ohme, F., & Hannam, M. 2015, Phys. Rev. D, 91, 024043, doi: 10.1103/PhysRevD.91.024043
- Schutz (1986) Schutz, B. F. 1986, Nature, 323, 310, doi: 10.1038/323310a0
- Smith et al. (2018) Smith, G. P., Jauzac, M., Veitch, J., et al. 2018, Mon. Not. Roy. Astron. Soc., 475, 3823, doi: 10.1093/mnras/sty031
- Soares-Santos et al. (2019) Soares-Santos, M., et al. 2019, Astrophys. J. Lett., 876, L7, doi: 10.3847/2041-8213/ab14f1
- Song et al. (2022) Song, J.-Y., Wang, L.-F., Li, Y., et al. 2022. https://arxiv.org/abs/2212.00531
- Tamanini et al. (2020) Tamanini, N., Klein, A., Bonvin, C., Barausse, E., & Caprini, C. 2020, Phys. Rev. D, 101, 063002, doi: 10.1103/PhysRevD.101.063002
- Thorne (1987) Thorne, K. S. 1987, in Three hundred years of gravitation, ed. S. W. Hawking & W. Israel (Cambridge, England: Cambridge University Press), 330–458
- Vallisneri (2008) Vallisneri, M. 2008, Phys. Rev. D, 77, 042001, doi: 10.1103/PhysRevD.77.042001
- van der Walt et al. (2011) van der Walt, S., Colbert, S. C., & Varoquaux, G. 2011, Computing in Science and Engineering, 13, 22, doi: 10.1109/MCSE.2011.37
- Vasylyev & Filippenko (2020) Vasylyev, S., & Filippenko, A. 2020, Astrophys. J., 902, 149, doi: 10.3847/1538-4357/abb5f9
- Virtanen et al. (2020) Virtanen, P., et al. 2020, Nature Meth., 17, 261, doi: 10.1038/s41592-019-0686-2
- Yang et al. (2021) Yang, L., Wu, S., Liao, K., et al. 2021, Mon. Not. Roy. Astron. Soc., 509, 3772, doi: 10.1093/mnras/stab3298
- Yu et al. (2020) Yu, J., Wang, Y., Zhao, W., & Lu, Y. 2020, Mon. Not. Roy. Astron. Soc., 498, 1786, doi: 10.1093/mnras/staa2465
- Zhao & Wen (2018) Zhao, W., & Wen, L. 2018, Phys. Rev. D, 97, 064031, doi: 10.1103/PhysRevD.97.064031
- Zhu et al. (2022a) Zhu, L.-G., Hu, Y.-M., Wang, H.-T., et al. 2022a, Phys. Rev. Res., 4, 013247, doi: 10.1103/PhysRevResearch.4.013247
- Zhu et al. (2022b) Zhu, L.-G., Xie, L.-H., Hu, Y.-M., et al. 2022b, Sci. China Phys. Mech. Astron., 65, 259811, doi: 10.1007/s11433-021-1859-9