Argon, neon, and nitrogen impurity transport in the edge and SOL regions of a Tokamak
Abstract
Numerical simulations of the interchange plasma turbulence in the presence of medium-Z impurities (N2, Ne, Ar) seeding have been performed using BOUT++. These simulation results are used to study the impurity transport mechanism in the edge and scrape-off layer (SOL) regions. An analytical relation for the impurity ion density with the vorticity, sources and sinks, and mass to charge ratio has also been derived. Simulation shows that Ar+ moves more strongly inward compared to N+ and Ne+ that has been verified from the analytical relation. The most abundant species move both in the inward and outward directions, but on average they mainly move outward. These behaviors have been confirmed using cross-correlation techniques. The inward transport or negative flux of the impurity ions is found directly associated with the monopolar density holes in the presence of the electron temperature gradient whereas the outward transport is associated with the plasma blobs. The inward impurity transport has been analyzed using hole fraction analysis. 44% of Ar+, 28% of Ne+, and 25% of N+ ions of their total impurity densities are transported inward mainly through the avalanche events of the turbulent plasma.
I Introduction
The anomalous plasma transport in the edge and scrape-off layer (SOL)
regions gives rise to large particle and heat loads on the plasma
facing material plates in tokamaks or stellarators. These loads can
damage the material plates and hence become a potential threat to
the safe operation of the machines. Therefore, these situations demand
a controlling mechanism so that these loads can be reduced within a safe operating limit. The medium-Z
impurities such as nitrogen (N2), neon (Ne), and argon (Ar) gases are found effective in controlling
the heat and particle fluxes in the boundary region of the tokamaks bisai2019dynamics ; raj_effects_2020 ; raj2022studies ; liu2018impact ; jia2020simulations ; J.Simpson_NME_2019_100599 ; Telesca_NME12_882 ; effenberg2017numerical .
These gases and ions radiate and convert a major portion of energy
into radiation Kallenbach_2013 . The studies in references
liu2018impact ; jia2020simulations ; effenberg2017numerical have
indicated about 40%-50% mitigation of the peak heat loads on the
divertor plates. A comparative study presented in ref.J.Simpson_NME_2019_100599
suggests that neon is found to radiate more efficiently on closed
field lines than nitrogen. From ref.Telesca_NME12_882 it has
been found that if the seeding rate exceeds a certain threshold for a given particle
and heat load crossing the separatrix then an inward pinch
is triggered which is mainly related to the reduction in the edge localized modes (ELM) activities.
Also, these impurities may play an important role to detach the plasma from the material
walls so that the direct heat and particle loads can be reduced on
these material plates; detailed detachment physics has been
reported in refs. (krasheninnikov_2017, ; Kallenbach_2013, ; zhang2022modeling, ; coster2011detachment, ; O_Fevrier_PPCF_035017, ; Harrison_PPCF_065024, ; Liu_NF_2019_126046, ).
However these impurity ions move inside the magnetic device and radiate,
hence, the inner plasma near the core cools down mollen2013impurity ; pigarov2004multi ; pigarov2005multi ; priego2005anomalous .
This is an undesirable situation - could be avoided if the inward
transport of the impurity ions is controlled. For this purpose, we
need to know the exact physical mechanisms for the inward transport
of the impurity ions.
The tokamak plasma has high levels of density fluctuations in the
edge and SOL regions mainly due to the interchange/drift wave instabilities
(sarazin_intermittent_1998, ; BisaiPOP11P4018, ; DIppolitoPOP18P060501, ; GarciaPRL92P165003, ).
These unstable modes make the plasma into a high turbulence states
that generate a type of coherent structure known as “blob” where
the local plasma density is a few times higher than the background density.
A generation of the plasma blob is also often associated with a generation
of plasma “hole” where the plasma density is lower than the background
plasma density. The blobs and holes move in the edge and SOL regions
and participate in the plasma transport krasheninnikov_2017 ; krasheninnikov2001scrape ; BisaiPOP12P102515 ; BisaiPOP12P072520 .
The plasma turbulence is modified by impurity seeding. In particular impurity ions which are relatively heavier compared to the main plasma ions contribute more strongly to the polarization drifts that modify the plasma vorticity and hence the plasma turbulence. The modification in the plasma vorticity again modifies the impurity ion dynamics and hence in this way the plasma-impurity interaction behaves self-consistently. Numerous studies
have been done experimentally Wang_NME_942 ; Barbui_NF59_076008 ; H.Tanaka_NME_2017_241
as well as numerically in past related to the plasma-impurity interaction
in the boundary region of tokamaks. Authors have used a variety of numerical codes such as
SOLPS-ITER (jia2020simulations, ; wang2022modeling, ), SOLPS (liu2018impact, ),
COREDIV Telesca_NME12_882 , EMC3-EIRENE effenberg2017numerical ; KawamuraPPCF60P084005 ,
and EDGE2D-EIRENE J.Simpson_NME_2019_100599 . In the most recent works
raj_effects_2020 ; raj2022studies , it has been found that
the impurity ions with single or double-positive charges due to the
plasma-impurity interactions move inward with a velocity of about
fraction of cs (sound speed) so that these fluxes are negative.
The detailed investigations of plasma-impurity interaction shown in
Ref.krasheninnikov2008recent suggest that the blobs not only
carry plasma but also carry fully stripped impurity ions from the
hot plasma towards the walls and the holes carry freshly ionized impurity
atoms from the walls towards the hotter region. In Refs.hasegawa2017impurity ,
authors reported that the transport of impurity ions is associated
with the plasma blobs/holes using 3D-PIC seeded blob/hole simulation. But transport in the presence of plasma turbulence associated with finite temperature gradient was missing.
The present simulation work is dedicated to the study of impurity transport associated with these blobs and holes which are generated by the interchange plasma turbulence in the edge and SOL regions of tokamak in the presence of the finite electron temperature gradient that may differ from the dipolar distribution of the
impurity ions within the plasma blob/hole structures as described in Ref.hasegawa2017impurity .
For this purpose, the impurity transport studies in the presence of
the nonlinear coupling between impurity and plasma turbulence have
been performed using two-dimensional (2D) numerical simulations. The main emphasis has been given to the transport mechanism associated with the propagation of blobs and holes where these are
generated self-consistently from the plasma turbulence. We have obtained
an analytical relation between the density of these primary impurity
ions and the vorticity in the presence of the impurity sources and
sinks as the minimum and maximum values of the vorticity normally correspond to the blobs and holes, respectively.
The analytical relation has been validated with the numerical results.
It is found that the plasma vorticity is monopolar in the presence of finite electron temperature
gradient BisaiPOP20P042509 ; shankar2021finite . The first ionization species mainly
move inward in the edge region near the last closed flux (LCFS) and in the SOL region, all ions move
radially outward. The most abundant species in the edge region move inward and outward but
on average, they move radially outward direction. It is to be noted that the temperature in the hole is low such that recombination is preferred over ionization and therefore the higher charged species present in the hole will quickly recombine to the low ionization state. But in contrast, the temperature in the blob is high enough such that ionization dominates over recombination and hence the lower charged species will quickly ionize to the higher charged states. To validate these facts we have presented the cross-correlation between the impurity ions and plasma density in the edge and SOL regions.
We have also quantified the amount of impurity transport by holes in the edge and SOL regions. It has been found in the simulation that the poloidal
and time-averaged density of impurity species related to plasma density holes are about 44% of Ar+, 28% of Ne+, and 25% of N+of their total impurity densities which are being transported radially inward in the edge region.
The paper is organized as follows. The numerical simulation method has been described in section-II. The derivation of the analytical expression for the impurity ion density has been described in section-III. The results related to the impurity transport mechanism from 2D simulations are described in section-IV. A brief summary and some concluding remarks are given in section-V.
II Model Equations and Numerical Simulation
The model equations used for the simulations couple the turbulence in the edge and SOL regions with the medium-Z impurity gas dynamics. Depending on the degree of electron impact ionization and recombination rates, the impurity ions may exist in multiple charge states. The model equations consist of the electron continuity equation, quasi-neutrality relation, electron energy conservation, and conservation of the impurity ions and the neutral gas. A simple diffusive model has been used to describe impurity dynamics in the impurity conservation equation. We have assumed the ions of the main plasma and the ions of these impurities are cold. These equations have been described in refs.raj_effects_2020 ; raj2022studies that have been used for this present simulation. Numerically, all the radial derivatives have been computed using a finite difference technique. The Neumann boundary condition (zero gradient) has been applied to the electron density, electron temperature, and density related to all ions in the radial direction. The poloidal boundary conditions are periodic for all the variables, where Fourier transformation has been used for all the variables in the poloidal direction using the fastest Fourier transformation of the west version 3 (FFTW3) routines. The time evolution of all the species has been obtained using a fourth-order Adams-Bashforth method. The simulation zone has a radial size and a poloidal size , where is ion gyroradius. We have used 132 modes in the radial direction and 128 Fourier modes in the poloidal direction. 132 modes in the radial direction with give a grid resolution of = 0.96, which is about m raj_effects_2020 ; raj2022studies . The Poisson brackets are solved using a third-order accurate up-winding method. The potential has been solved from the vorticity using the boundary value of the potential as at the outer boundary (in SOL) and at the inner boundary (in edge), where is related to the floating potential. The input parameters used in our simulations are closely related to Aditya-U Tokamak parameters in the edge and SOL regions and the other details of the model can be found in refs. bisai2019dynamics ; raj2020effect ; raj2022studies . The numerical simulations have been done using BOUT++ framework DudsonPPCF53P054005 .
III Analytical estimation of the impurity ion density with vorticity
In this section, we investigate a relationship related to the impurity ion density () with the plasma vorticity, and the impurity ion sources and sinks. The equation can be written as:
| (1) |
and indicate the differential operators in () plane and direction. indicates time. and correspond to the radial and poloidal coordinates. The magnetic field acts in direction. is related to and polarization drifts that can be written as;
the first term is ion polarization drift and the second term is related to drift; . represents the electric field, represents the magnitude of toroidal magnetic field. where is the common sound speed of ions BaalrudPOP18P023505 . indicates the electron density and is the mass of the impurity. The ion diamagnetic term has not been taken into account because of the cold-ion approximation. is the source and sink associated with the impurity ions obtained from the following chemical reactions for the impurity gas:
| (2) |
indicates impurity ions, it can be any one of N2, Ne, and Ar ions. indicates charge states. , indicate the first ionization, second ionization states, etc. The continuity equation of considering all the sources and sinks from the above reactions can be written as
| (3) |
is the ratio of mass and charge of the impurity ions, i.e., . indicates the charge of a proton. Here, . The loss of impurity ions in the parallel direction of the magnetic field in the sheath-connected region has been taken into account. Boussinesq approximation has been taken in the second term of Eq.(3). With these approximations, Eq.(3) can be written as
| (4) |
is the source of obtained from the first two reactions as indicated in Eq.(2). It represents the rate at which the impurity ions are being formed in the simulation. is the effective sink related to the last two reactions as indicated in Eq.(2) including the parallel loss terms. It is to be noted that the dimension of is per second so that represents the loss rate of the impurity ions. Performing the time integration of Eq.(4) we can write the impurity ion density in Lagrange frame that moves with drift velocity as:
| (5) |
where,
represents the integration constant. The term is not taken into account as , where is the major radius, is the sound speed and its value in the dimensionless unit for ADITYA-U in the edge region is small . Equation-5 indicates that the impurity ion density is mainly governed by , vorticity, and terms. We have , consequently the magnitude of will be lower for higher ionization species than the lower ionization species, which indicates that the magnitude of for the higher ionization species drops exponentially for a given and . It is to be noted that in the absence of and Eq.(5) corresponds to that gives
Here, corresponds to the impurity ion density. This is the case as derived by Hasegawa and Ishiguro in ref.hasegawa2017impurity where they showed that impurity ion density depends on the vorticity of the plasma. A double peak of impurity ion density has been observed within a plasma hole in their simulations [hasegawa2017impurity, ] as the electron temperature was assumed uniform. But in our case, we have used finite gradient in the model equation that may give a monopolar vorticity BisaiPOP20P042509 ; shankar2021finite . The presence of finite electron temperature in the edge region, the potential can be written as . As and will be maximum/minimum at the center of the blob/hole, this will give a maximum/minimum of at the center of a plasma blob/hole. The above relation indicates will be a function of the radius (local) of the blobs and holes. Again, in the SOL region, is related with as . The local radial electric field () of the blob/hole in the edge and SOL regions will give rise to spin/rotation in the direction of the local blob-axis (in the direction of the toroidal magnetic field) that will create a vortex structure. Therefore, the blob/hole structures will be associated with the vortex. Numerically, the validation of Eq.(5) has been given in the Appendix using numerical data.
IV Simulation Results
Simulation data related to impurity transport will be presented here
in the statistically stationary phase of the turbulence. The equilibrium
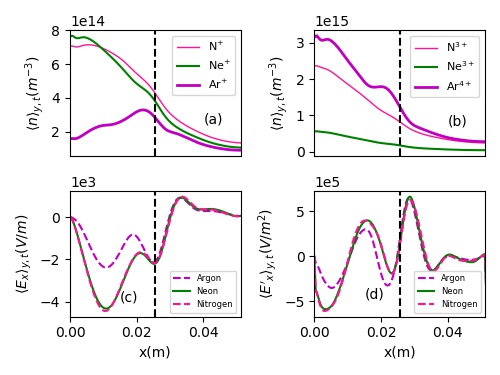
profiles of the few impurity ions, radial electric field, and
radial electric field shear are shown in Fig.1(a)-(d) as these
profiles play an important role in the transport processes.
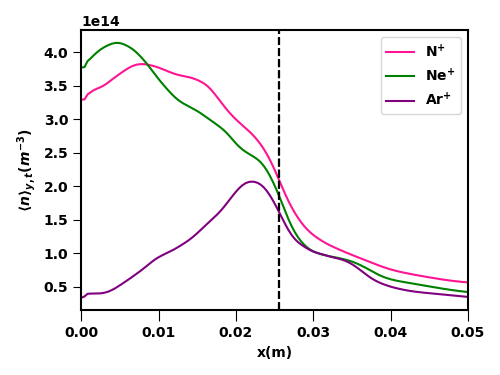
The radial distribution of the first ionization species (N+,
Ne+, Ar+) has been shown in Fig.1(a).
It shows that N+, and Ne+ ions densities are maximum in the
edge region near m whereas Ar+ ion density is maximum
near LCFS at m. The ionization potential of Ar gas is
lower than N2 and Ne gases so these gases are ionized at
the higher that is available at the lower values near m. Also the recombination
rate of the higher ionization such as Ar2+ is higher than N2+
and Ne2+ is also playing a role in this behavior. The studies in
refs.raj_effects_2020 ; raj2022studies indicate that in the
statistically stationary phase of the turbulence N3+, Ne3+,
and Ar4+ ions are the most abundant. The radial profiles of
these ions are shown in Fig.1(b). These
profiles have been determined from various factors such as ionization
potential, recombination cross-sections, and the interaction of the
neutral gas with the turbulence as described in refs.bisai2019dynamics ; raj_effects_2020 ; raj2022studies .
The radial electric field has been shown in Fig.1(c).
It is found that is modified in the presence of Ar gas than N2 and Ne gases mainly in the edge region. It is to be noted
that the modification in is related to the modification
in the plasma turbulence by plasma-impurity interaction. These impurities
are relatively heavier compared to the main plasma ions that contribute
more strongly to the polarization drifts that modify the plasma vorticity
and hence the plasma turbulence. It is to be noted that the ionization/recombination
process alone cannot determine the radial profiles of the ions but
also the radial electric field shear plays an
important role in determining the radial profile of the impurity ions.
Therefore, we have plotted the radial profile of
as shown in Fig.1(d). It has been found
that in the case of nitrogen and neon, is lower
than argon. The lower shear in the case of argon ions allows the inward/outward
motion more strongly than the nitrogen and neon ions. The radial profiles
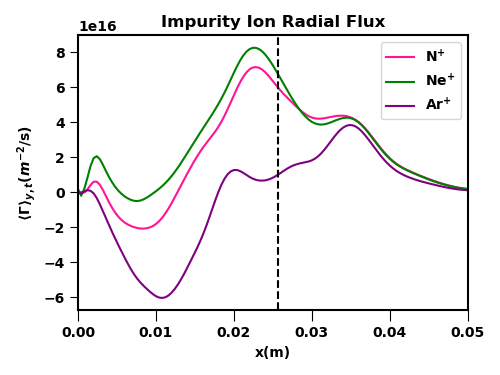
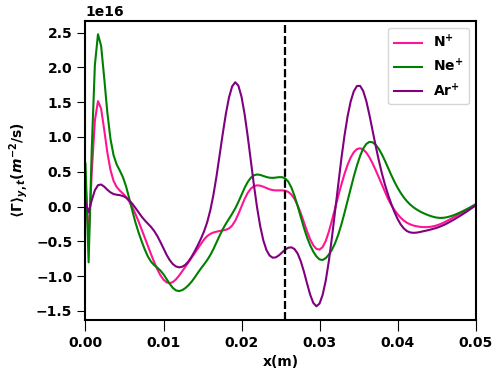
of the impurity fluxes of N+, Ne+, Ar+ions obtained
from the numerical simulation data have been shown in Fig.2. The flux of Ar+ is more negative
than Ne+, N+ions which indicates that Ar+ mainly move in the inward direction than the other two ions. The fluxes of the other higher
ionization species are mainly positive which are not shown here but we will discuss more in this section.
Since the plasma particle transport is also associated with blobs
and holes krasheninnikov2008recent , therefore, it is desirable
to analyze the impact of these impurity ions on these coherent structures
present in the plasma. As the present study is dedicated to the mechanism
of the impurity transport by the holes in the radially inward direction,
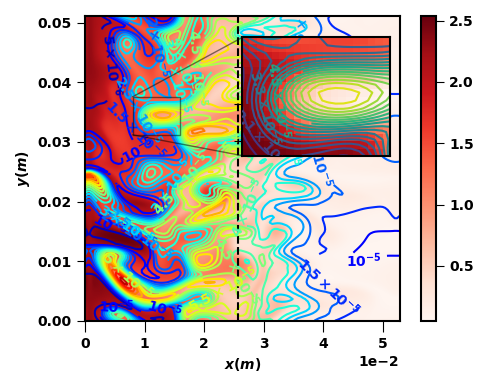
we superposed the first ionization species of argon impurity with
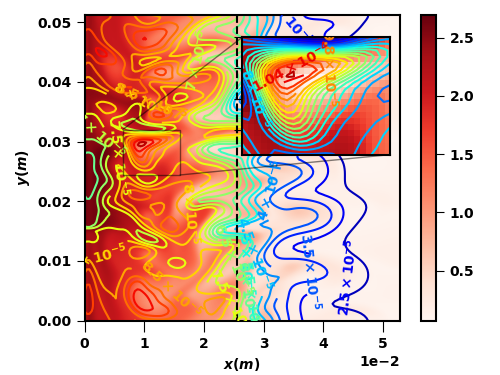
the plasma density in the plane as shown in Fig.3.
The inset plot zooms a small rectangular area to show the presence
of Ar+ inside a density hole. It is found that Ar+ is
maximum near the center of the hole. A similar phenomenon is also seen
at the other radial positions near LCFS. In the SOL region, no such
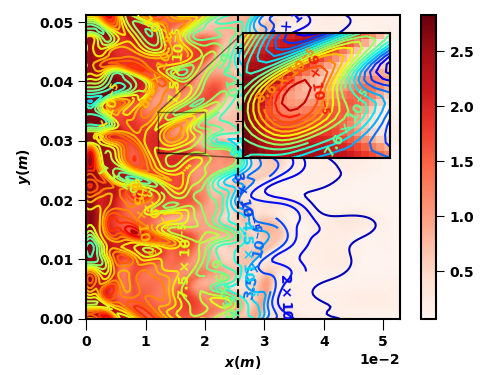
phenomenon is seen. Similarly, the superposition of Ne+ and
N+ ion densities with the plasma density are shown in Fig.4
and Fig.5, respectively. These contour plots
show that for Ne+ and N+ density is maximum at a location
where the plasma density hole is present. In all three cases,
no such maxima of the impurity ions are seen within the plasma holes
in the SOL region. In the edge region, the heavier impurities have
modified the plasma vorticity more strongly, therefore, these impurities
behave in a more correlated way with the plasma vorticity that gives
the highest impurity density with the holes where the vorticity is
positive.
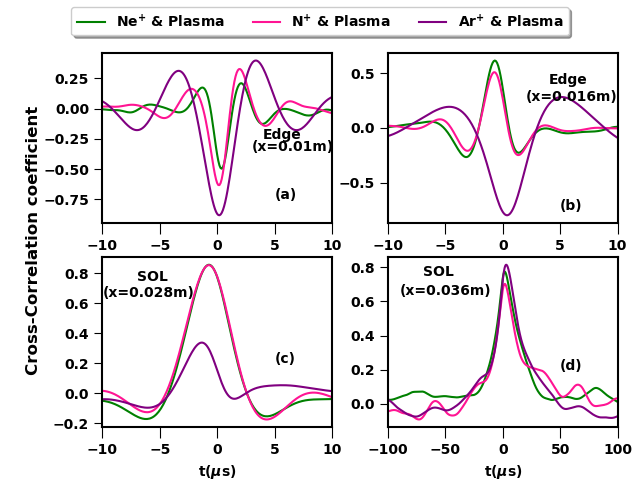
To show the simultaneous occurrence of impurity ion density maxima and plasma density holes
for a large number of cases, we have presented cross-correlations between the two time series obtained
from the numerical simulations related
to the plasma density and the density related to the first ionization species at the four radial-poloidal
(0.01m,0.025m), (0.016m,0.025m), (0.028m,0.025m), and (0.036m,0.025m) locations as shown in
Fig.6. There is no definite choice of the four locations but these can help
to estimate the cross-correlation in other radial locations. The negative cross-correlation
coefficient primarily in the edge region for the three cases indicates that when one density
increases, the other decreases. The cross-correlation coefficient has been obtained using the relation: , where is the cross-correlation coefficient for two different signals and obtained after taking the sum of their convolution. It is to be noted that varies from 0 to . The contour plots shown in Figs.3,
4, and 5 confirm that the impurity ion density is maximum
where the plasma density is minimum (holes). Therefore, from the cross-correlation analysis and the contour
plots, we can conclude that the holes are mainly associated with the maxima of the first ionization
species density. The first ionization species behave slightly differently than the main plasma, therefore,
the anti-correlation sustains up to a finite time, and after that they decorrelate. The simulation results indicate that
when the holes move radially inward the impurity ions inside the holes also move inward
so that both are correlated till the cross-correlation time that is roughly defined by the time duration
when the coefficient drops to of the maximum coefficient. This happens mainly near LCFS. It is to be noted that the first ionization species inside the hole will be less
probable to convert into second ionization species than the first ionization species outside the holes.
The holes maintain low temperature than the background up to the auto-correlation time, therefore, these will not be ionized further or less probable to convert into the second ionization species.
The accumulation of the impurity ions with the density hole as shown in
Figs.3, 4, and 5 could
be explained using Eq.(5), it
indicates that will be maximum when
is maximum. The interchange plasma turbulence indicates that
is positive-maximum at the hole position and negative-minimum at the
blob position. Therefore, will be maximum (minimum) at
the plasma hole (blob) location. This indicates that the impurity
ion density is found to be correlated with the positive vorticity
in the edge region or in other words the impurity ion density fluctuation
is mainly governed by instantaneous vorticity fluctuation. We have
described this behavior that is related to the first ionization species.
The same phenomenon is applicable to the second ionization species
but in this case will be lower as it depends on where
will be half for the second ionization species than the first.
Similarly for the third, fourth, etc, species the impurity ion density
within a hole will be much lower. Fig.6(b)
shows similar phenomenon as in Fig.6(a), only
the cross-correlation coefficient is different. In the SOL region
at m (Fig.6(c)), and m
(Fig.6(d)), the cross-correlation is positive
which indicates that the impurity density increases with the decrease
of plasma vorticity in the time series. Therefore, one can conclude
that the impurity density is maximum at the position of the plasma blob.
This is quite different from the phenomena in the edge region. This
may be also because of the fact that both the impurity ions and blobs
move radially outward direction to facilitate the outward loss mechanism,
therefore, these are correlated. They are correlated till the cross-correlation
time as the impurity ions behave in a slightly different way than the main
plasma ions. It is to be noted that 2D simulation result indicates that in SOL region (m), the
plasma holes are almost absent which indicates that the anti-correlation
with the impurity ions not seen. Figs.6(a)-(d)
indicate that N+ and Ne+ behave differently than Ar+
ions as Ar+ has higher polarization drift than N+ and
Ne+ ions. Therefore, Ar+ behaves more strongly with the plasma vorticity than the
other two ions.
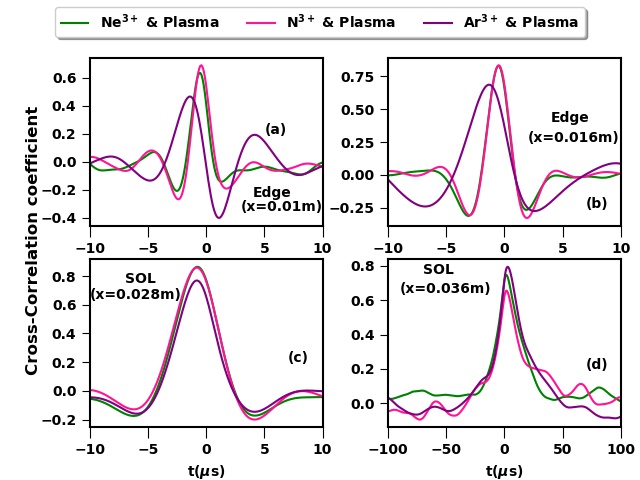
The cross-correlation between the plasma density and the most abundant ion density of N2, Ne, and Ar has been investigated as shown in Figs.7(a)-(d). These are shown at the same locations of Figs.6(a)-(d). It is to be noted that Figs.6(a)-(b) and Figs.7(a)-(b) show the opposite behavior. The correlation coefficient is negative in Figs.6(a)-(b) but in Figs.7(a)-(b) these are positive. This behavior indicates that in the edge region, the most abundant species move radially outward direction whereas the first ionization species move inward. The high at lower ionizes the first ionization species further and produces the higher ionization species. These higher ionization species accumulate and the concentration builds up and when the gradient is higher than the critical gradient (when interchange instability sets in) these move radially outward due to the plasma turbulence. The blobs also move radially outward direction, therefore, both the plasma blob and the most abundant species move in the same direction which shows a positive correlation coefficient. In the edge region, a small but finite anti-correlation is observed as the holes in this region move in the inward direction with the impurity ions as explained in the previous paragraph.
The radial inward movement of the first ionization species can be calculated from Eq.(5) by estimating radial outward flux as per
| (6) |
Using numerical data we have estimated , the results have been shown in Fig.8. The flux is negative in the edge which indicates that these ions move inward direction. The negative particle flux has been reported also in Refs.raj2022studies ; raj2020effect . It is to be noted that Eq.(6) explains the negative flux but the radial profiles as shown in Fig.6 are different from the actual numerical results as shown in Fig.2. This mismatch is mainly because we have estimated the flux in the Lagrange frame but the numerical results from the simulation have been done in the laboratory frame.
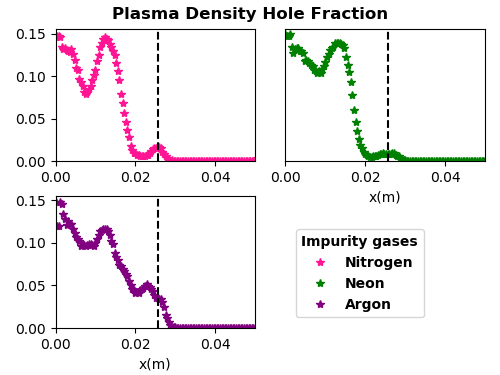
As the holes are playing a role in the impurity ion transport mainly for the first ionization species, we have investigated the hole fraction in the presence of impurity gases. The hole fraction is defined as the fraction of plasma that is contained within a hole. The low hole fraction indicates fewer numbers of plasma electrons with electron temperatures lower than the background. The radial distribution of the fraction of the plasma density in the holes is shown in Fig.9. The radial distribution of the hole fraction suggests that the holes are mainly present in the edge region and there are almost no holes in the SOL region. The low electron temperature in the holes will provide a favorable condition for the inward impurity transport as the low electron temperature will lower the electron impact ionization events of the first ionization species. Therefore, the first ionization species will survive within the hole for a long time and will move much inside before reaching a high-temperature zone where the hole will be destroyed or the impurity will be ionized by the high temperate in that zone. In the case of Ar+ions (unlike N+ and Ne+), the negative gradient provides stability against the interchange instability that will also favor the existence of Ar+ ions at the lower , therefore, large numbers of Ar+ions move in the inward direction to provide large negative impurity flux by drift. drift will be the same for both the impurity ions and main plasma particles so the structure as a whole convects in the radially inward direction. We have also estimated the percentage of impurity transport associated with the plasma density holes for all three gases from the numerical data shown in Fig.10. The conditional integration of the poloidal average of the impurity ion density is the quantification technique used in the present simulation and is represented by Eq.(7)
| (7) |
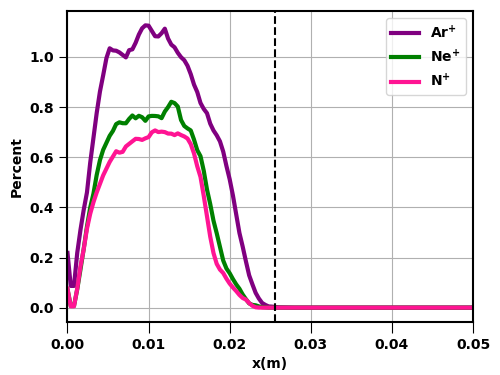
where is the conditional parameter. It yields, for an event when the holes and maxima of the impurity ions exist simultaneously, otherwise . The quantity gives the impurity fraction associated with the density holes.
The percentage of first ionization species associated with the holes has been shown in Fig.10. The area under each curve represents the total amount of impurity ions associated with the density holes. We have calculated the area from the simulation data which gives 44% of Ar+, 28% of Ne, and 25% of N ions that are transported inside the edge region through the turbulent events.
V Conclusion and discussion
Numerical simulations have performed to show the modification of the plasma turbulence by the medium-Z (N2, Ne, and Ar) impurity gases in the edge and SOL regions. The main emphasis has been given to the dynamics of the impurity ions. It is found that these impurity ion motions are strongly governed by vorticity. We have derived an analytical relation for the impurity ion density with vorticity, sources and sinks, and mass-to-charge ratio. Ar+ moves more strongly inward compared to N+ and Ne+. The most abundant species move both in the inward and outward directions, but on an average they mainly move outward in the edge and SOL regions. We have quantified this behavior using cross-correlation techniques. The numerical simulations indicate that the impurity ions’ inward transport (negative flux) is directly associated with the monopolar density holes in the presence of the electron temperature gradient. In contrast, outward transport is associated with plasma blobs. The results presented here might help in the future to understand/optimize the radiative loss in tokamak-related experiments. The inward impurity transport has been quantified using hole fraction analysis. It is found that 44% of Ar+, 28% of Ne+, and 25% of N+ ions of their total impurity density that are transported inside the edge region through the intermittent events of the turbulent plasma.
VI Acknowledgements
The simulations are performed on the Antya cluster at the Institute for Plasma Research (IPR), India. A.S. is thankful to the Indian National Science Academy (INSA) for its support under the INSA Senior Scientist Fellowship scheme.
VII Appendix
In order to verify the theoretical estimation of Eq.(5), we have calculated and from the numerical data as described in Section-IV and have estimated . Long time and poloidal averages of have been shown in Figure-11. These results are nearly comparable with Fig.1(a) that differ by a factor of two mainly because of the nonlinear terms but the radial variations of the profiles are almost similar. These results justify the Eq.(5).
References
- [1] N Bisai, MB Chowdhuri, S Banerjee, Harshita Raj, Ritu Dey, RL Tanna, R Manchanda, KA Jadeja, J Ghosh, and Aditya Team. Dynamics of neon ions after neon gas seeding into tokamak plasma. Nuclear Fusion, 59(12):126013, 2019.
- [2] Shrish Raj, N. Bisai, Vijay Shankar, and A. Sen. Effects of nitrogen seeding in a tokamak plasma. Physics of Plasmas, 27(12):122302, December 2020.
- [3] Shrish Raj, N Bisai, Vijay Shankar, A Sen, Joydeep Ghosh, RL Tanna, Malay B Chowdhuri, KA Jadeja, Kumudni Assudani, and Tanmay Martin Macwan et al. Macwan. Studies on impurity seeding and transport in edge and SOL of tokamak plasma. Nuclear Fusion, 62(3):036001, 2022.
- [4] Daoyuan Liu, Chaofeng Sang, Liang Wang, and Dezhen Wang. The impact of neon-seeding location on the divertor plasma in EAST. Fusion Engineering and Design, 136:324–329, 2018.
- [5] Guozhang Jia, Xiaoju Liu, Guosheng Xu, Liang Wang, Sizheng Zhu, Hai Xie, Hang Si, Chaofeng Sang, Zhongshi Yang, Jichan Xu, et al. Simulations of Ar seeding by SOLPS-ITER for a slot-type divertor concept. Physics of Plasmas, 27(6):062509, 2020.
- [6] J. Simpson, D. Moulton, C. Giroud, M. Groth, G. Corrigan, and JET Contributors. Using EDGE2D-EIRENE to simulate the effect of impurity seeding and fueling on the upstream electron separatrix temperature. Nuclear Materials and Energy, 20:100599, 2019.
- [7] G. Telesca, I. Ivanova-Stanik, R. Zagórski, S. Brezinsek, A. Czarnecka, P. Drewelow, C. Giroud, A. Huber, S. Wiesen, M. Wischmeier, and JET contributors. High power neon seeded JET discharges: Experiments and simulations. Nuclear Materials and Energy, 12:882–886, 2017.
- [8] F Effenberg, Y Feng, O Schmitz, H Frerichs, SA Bozhenkov, H Hölbe, R König, M Krychowiak, T Sunn Pedersen, D Reiter, et al. Numerical investigation of plasma edge transport and limiter heat fluxes in wendelstein 7-x startup plasmas with EMC3-EIRENE. Nuclear Fusion, 57(3):036021, 2017.
- [9] A.Kallenbach, M. Bernert, R. Dux, L. Casali, T. Eich, L. Giannone, A. Herrmann, R. McDermott, A. Mlynek, H. W. Müller, F. Reimold, J. Schweinzer, M. Sertoli, G. Tardini, W. Treutterer, E. Viezzer, R. Wenninger, and M. Wischmeier and. Plasma Physics and Controlled Fusion, 55(12):124041, 2013.
- [10] Krasheninnikov S. I. and Kukushkin A. S. Journal of Plasma Physics, 83(5):155830501, 2017.
- [11] Yanjie Zhang, Chaofeng Sang, Jiaxian Li, Guoyao Zheng, Ilya Y Senichenkov, Vladimir A Rozhansky, Chen Zhang, Yilin Wang, Xuele Zhao, and Dezhen Wang. Modeling of the effects of impurity seeding on plasma detachment and impurity screening of snowflake divertor on HL-2M tokamak by SOLPS-ITER. Nuclear Fusion, 62(10):106006, 2022.
- [12] DP Coster. Detachment physics in SOLPS simulations. Journal of nuclear materials, 415(1):S545–S548, 2011.
- [13] O Février, C. Theiler, J. R. Harrison, C. K. Tsui, K. Verhaegh, C Wüthrich, J. A. Boedo, H. De Oliveira, B. P. Duval, B. Labit, B. Lipschultz, R. Maurizio, H. Reimerdes, the TCV Team, and the EUROfusion MST1 Team. Plasma. Phys. Contr. Fusion, 62:035017, 2020.
- [14] J. R. Harrison, C. Theiler, O Février, H. de Oliviera, R. Maurizio, K. Verhaegh, A. Perek, A. Karpushov, B. Lipschultz, B. P. Duval, X. Feng, S. Henderson, B. Labit, B. Linehan, A. Merle, H. Reimerdes, U. Sheikh, C. K. Tsui, W. A. J. Vijvers, C Wüthrich, the TCV team, and the EUROfusion MST1 team. Plasma. Phys. Contr. Fusion, 61:065024, 2019.
- [15] J.B. Liu, L. Wang, H.Y. Guo, H.Q. Wang, G.S. Xuand F. Ding, J.C. Xu, X.J. Liu, Q.P. Yuan, K. Wu, S.C. Liu, C.F. Sang, L.Y. Meng, W. Feng, A. Hyatt, A.W. Leonard, D. Thomas, T. Zhang, T.F. Zhou, B.J. Xiao, X.Z. Gong, J. Li, B.N. Wan, and the EAST Team. Nucl. Fusion, 59:126046, 2019.
- [16] Albert Mollén, István Pusztai, Tünde Fülöp, and Sara Moradi. Impurity transport in trapped electron mode driven turbulence. Physics of Plasmas, 20(3):032310, 2013.
- [17] A Yu Pigarov, SI Krasheninnikov, TD Rognlien, WP West, B LaBombard, B Lipschultz, R Maingi, and V Soukhanovskii. Multi-fluid code simulations including anomalous non-diffusive transport of plasma and impurities in the tokamak SOL. Contributions to Plasma Physics, 44(1-3):228–234, 2004.
- [18] A Yu Pigarov, EM Hollmann, SI Krasheninnikov, TD Rognlien, and WP West. Multi-ion fluid simulation of tokamak edge plasmas including non-diffusive anomalous cross-field transport. Journal of nuclear materials, 337:371–375, 2005.
- [19] M Priego, OE Garcia, V Naulin, and J Juul Rasmussen. Anomalous diffusion, clustering, and pinch of impurities in plasma edge turbulence. Physics of plasmas, 12(6):062312, 2005.
- [20] Y. Sarazin and Ph. Ghendrih. Intermittent particle transport in two-dimensional edge turbulence. Physics of Plasmas, 5(12):4214–4228, December 1998.
- [21] Nirmal Bisai, Amita Das, Shishir Deshpande, Ratneshwar Jha, Predhiman Kaw, Abhijit Sen, and Raghavendra Singh. Phys. Plasmas, 11:4018, 2004.
- [22] D. A. D’Ippolito, J. R. Myra, and S. J. Zewben. Phys. Plasmas, 18:060501, 2011.
- [23] O.E. Garcia, V. Naulin, A. H. Nielsen, and Juul Rasmussen. Phys. Rev. Lett., 92:165003, 2004.
- [24] Sergei I Krasheninnikov. On scrape off layer plasma transport. Physics Letters A, 283(5-6):368–370, 2001.
- [25] N. Bisai, A. Das, S. Deshpande, R. Jha, P. Kaw, A. Sen, and R. Singh. Phys. Plasmas, 12:102515, 2005.
- [26] Nirmal Bisai, Amita Das, Shishir Deshpande, Ratneshwar Jha, Predhiman Kaw, Abhijit Sen, and Raghavendra Singh. Phys. Plasmas, 12:072520, 2005.
- [27] H.Q. Wang, H.Y. Guo, T.W. Petrie, A.W. Leonard, D.M. Thomas, J.G. Watkins, and DIII-D team. Nuclear Materials and Energy, 12:942–947, 2017.
- [28] T. Barbui, F. Effenberg, R. König, M. Krychowiak, O. Schmitz, J. Baldzuhn, B.D. Blackwell, B. Buttenschön, P. Drews, M. Jakubowski, S. Kwak, Y. Liang, S. Liu, H. Niemann, T. Sunn Pedersen, J. Svensson, D. Zhang, and the W7-X Team. Nucl. Fusion, 59:076008, 2019.
- [29] H. Tanaka, G. Kawamura, S. Masuzaki, M. Kobayashi, T. Akiyama, B.J. Peterson, K. Mukai, R. Sano, S.Y. Dai, R. Sakamoto, T. Morisaki, N. Ohno, and LHD Experiment Group. Nuclear Materials and Energy, 12:241–246, 2017.
- [30] Rong Wang, Zhongshi Yang, Kedong Li, Guosheng Xu, Guozhang Jia, Guojian Niu, Feifei Nian, Tao He, Lingyi Meng, Xin Lin, et al. Modeling of the impact of NEON seeding on the detachment in east by SOLPS-ITER. Physics of Plasmas, 29(11):112502, 2022.
- [31] G Kawamura, H Tanaka, K Mukai, B Peterson, S Y Dai, S Masuzaki, M Kobayashi, Y Suzuki, Y Feng, and LHD Experiment Group. Plasma. Phys. Contr. Fusion, 60:084005, 2018.
- [32] SI Krasheninnikov, DA D’ippolito, and JR Myra. Recent theoretical progress in understanding coherent structures in edge and SOL turbulence. Journal of Plasma Physics, 74(5):679–717, 2008.
- [33] Hiroki Hasegawa and Seiji Ishiguro. Impurity transport caused by blob and hole propagations. Nuclear Fusion, 57(11):116008, 2017.
- [34] N. Bisai and P. K. Kaw. Phys. Plasmas, 20:042509, 2013.
- [35] Vijay Shankar, Nirmal Bisai, Shrish Raj, and Abhijit Sen. Finite electron temperature gradient effects on blob formation in the scrape-off layer of a tokamak plasma. Nuclear Fusion, 61(6):066008, 2021.
- [36] Harshita Raj, Tanmay Macwan, Kaushalender Singh, Suman Dolui, Joydeep Ghosh, Nirmal K Bisai, KA Jadeja, KM Patel, NC Patel, RL Tanna, et al. Effect of periodic gas-puffs on drift-tearing modes in ADITYA/ADITYA-U tokamak discharges. Nuclear Fusion, 60(3):036012, 2020.
- [37] B. D. Dudson, X. Q. Xu, M. V. Umansky, H. R. Wilson, and P. B. Snyder. Plasma. Phys. Contr. Fusion, 53:054005, 2011.
- [38] S D Baalrud and C C Hegna. Phys. Plasmas, 18:023505, 2011.