AutoVis: Enabling Mixed-Immersive Analysis of Automotive User Interface Interaction Studies
Abstract.
Automotive user interface (AUI) evaluation becomes increasingly complex due to novel interaction modalities, driving automation, heterogeneous data, and dynamic environmental contexts. Immersive analytics may enable efficient explorations of the resulting multilayered interplay between humans, vehicles, and the environment. However, no such tool exists for the automotive domain. With AutoVis, we address this gap by combining a non-immersive desktop with a virtual reality view enabling mixed-immersive analysis of AUIs. We identify design requirements based on an analysis of AUI research and domain expert interviews (N=5). AutoVis supports analyzing passenger behavior, physiology, spatial interaction, and events in a replicated study environment using avatars, trajectories, and heatmaps. We apply context portals and driving-path events as automotive-specific visualizations. To validate AutoVis against real-world analysis tasks, we implemented a prototype, conducted heuristic walkthroughs using authentic data from a case study and public datasets, and leveraged a real vehicle in the analysis process.
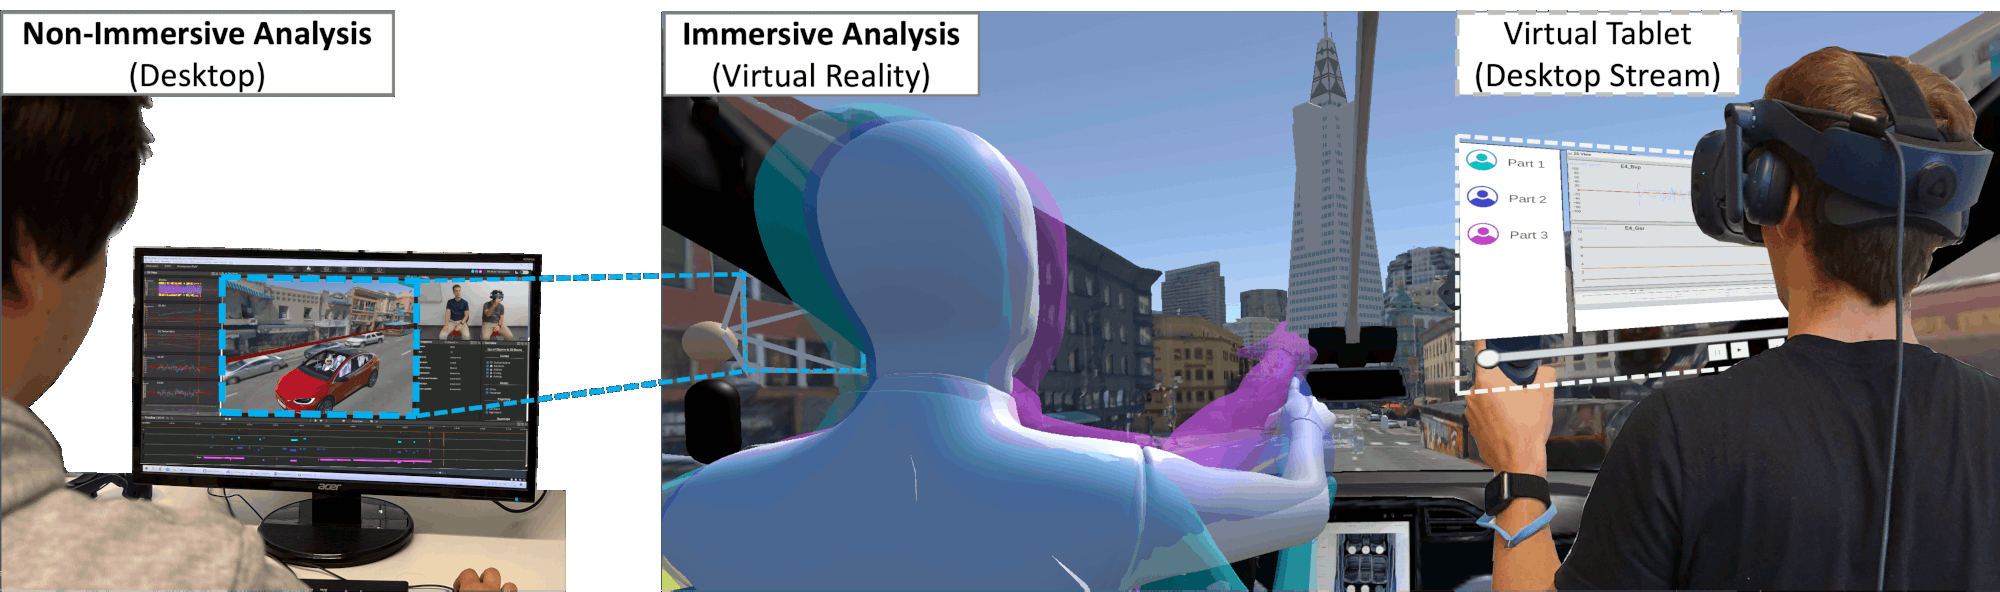
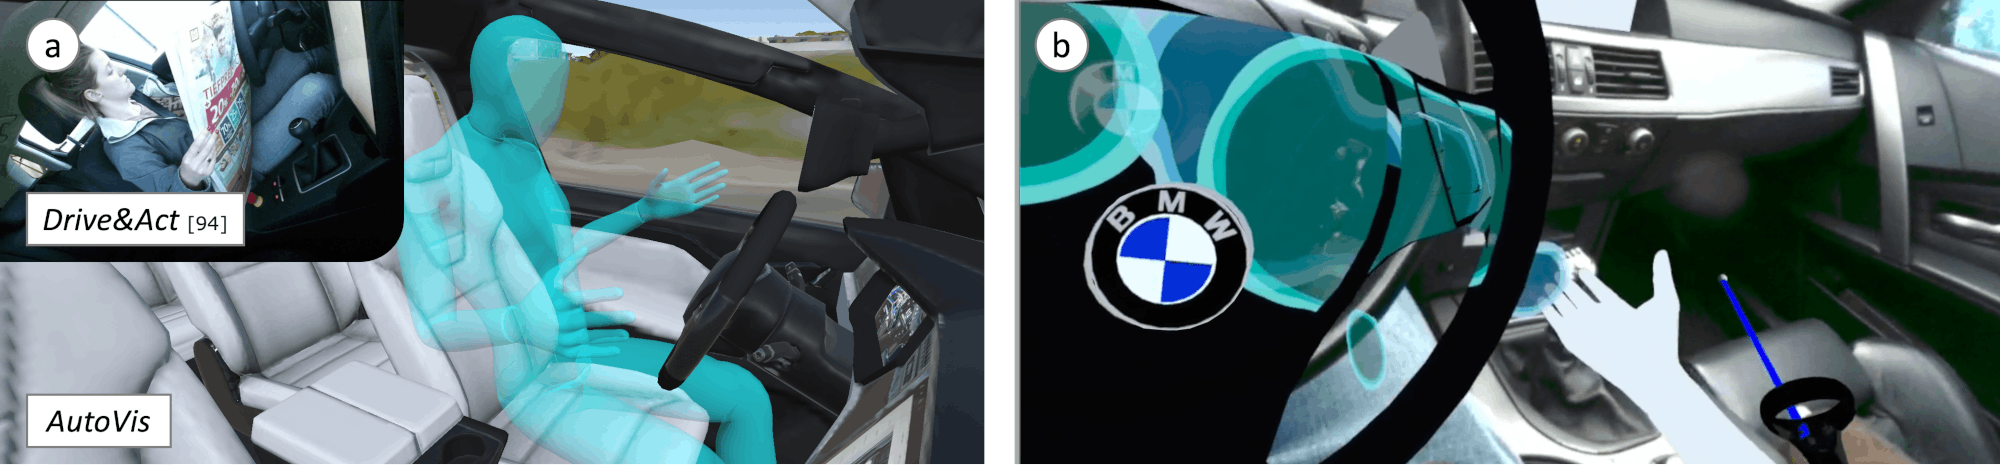
The image is split into two parts: On the left, there is a real human sitting in front of a computer using the desktop version of AutoVis. This is the non-immersive view. On the right, a virtual vehicle interior in a 3D city environment can be seen. In the foreground on the left side, there are multiple semi-transparent and opaque humanoid avatars on the driver’s seat pointing at a building in front of them. In the right foreground is a real human wearing a virtual reality headset and holding a VR controller. On the VR controller, a cutout of the AutoVis desktop view is visible. This is the immersive view of AutoVis.
1. Introduction
With the increasing technological advances of driving automation (enabling non-driving related activities (Detjen et al., 2020)) and vehicle systems (e.g., touch screens (Detjen et al., 2021b), embedded sensors (Kim et al., 2020a), or speech assistance (Lin et al., 2018)), human-vehicle interaction analysis becomes more complex. Today’s AUI development often considers numerous factors, such as the vehicle environment (Bethge et al., 2021; Liu et al., 2021), novel input and output modalities (Jansen et al., 2022), multimodal interaction (Aftab, 2019), the temporal sequence of interactions, user behavior (Liu et al., 2021), and user physiology (Trenta et al., 2019). Besides, other road users (Holländer et al., 2021) can interact with the vehicle via external human-machine interfaces (eHMIs) (De Clercq et al., 2019; Colley et al., 2021a, 2022e, 2022a, 2020b). Consequently, practitioners gather large bodies of heterogeneous, spatio-temporal data of movements, user interactions, audio/video recordings, and other events that need to be visualized and analyzed to gain the desired insights into how people use novel AUIs. Efficient and effective data analysis may benefit from tools that directly relate in-vehicle passenger behavior to the environment.
However, today’s analysis tools for AUIs (e.g., (Tavakoli et al., 2021; Ebel et al., 2021)) are non-immersive, 2D, bounded to desktops, and distancing the analysts from the often complex environments outside and inside the vehicle that might have a critical impact on passenger behavior. As a result, analysis can be time-consuming (e.g., see (Jakobsen and HornbÆk, 2014; Dey and Terken, 2017; Hecht et al., 2020; Madigan et al., 2019)), and data patterns may be invisible during analysis from a fixed point-of-view (POV) or are unclear without the original environmental context. Likewise, due to the difficult instrumentation of participants (e.g., on-body sensors) and costly external camera systems (e.g., LiDAR (Triess et al., 2021)), datasets may contain only videos of the driving environment or the interior (e.g., (Jegham et al., 2019)). Therefore, (manual) analysis of public datasets might be incomplete or require extensive post-processing. Besides, current tools do not support each driving automation level defined by the Society of Automotive Engineers (SAE) taxonomy J3016 (SAE-International, 2021). However, automated driving significantly affects passengers (Dettmann et al., 2021; Colley et al., 2020a, 2022d, 2021b) and other road users (Xu et al., 2021). Furthermore, current tools often do not adequately support the various forms of multimodal in-vehicle interaction (e.g., (Aftab, 2019; Kim et al., 2020b; Roider et al., 2018)), which combine input modalities such as gaze, gesture, speech, and touch.
In contrast, immersive analytics enable the spatial analysis of interaction and movement data in augmented (AR) and virtual reality (VR) within a replicated study environment (Büschel et al., 2021; Kloiber et al., 2020; Lilija et al., 2020). However, immersive tools, similar to (Reipschläger et al., 2022; Hubenschmid et al., 2022), are currently nonexistent in the automotive research domain. This prevents an outside-in view that may be needed to get an overview of the data (Büschel et al., 2021). However, non-immersive tools are well-suited for overview tasks, such as quickly finding relevant events (Kraus et al., 2020a). Therefore, in line with Hubenschmid et al. (2022), we argue that effective and efficient analysis of AUI studies requires immersive and non-immersive tools. In combination, these approaches compensate for their drawbacks and have the potential to overcome barriers between practitioners, their data, and the tools they use for analyzing and understanding human-vehicle interaction.
To unleash this potential, we propose AutoVis, a tool for the mixed-immersive analysis of AUI studies. AutoVis combines an immersive VR with a non-immersive desktop view (see Figure 1) to enable in-depth visualization of passenger states and interactions in- and outside the vehicle, aiming to create a strong link between data and environment. The VR view replicates a scenario in an interactive 3D environment explorable via VR head-mounted displays (HMDs). This view combines trajectory-based visualizations with interactive humanoid 3D avatars, providing a detailed representation of passengers’ movements and interactions. Additionally, heatmaps aggregate passengers’ gaze, pointing, or speech references in the vehicle or environment. To further visualize the link between in-vehicle and environmental contexts, we employ context portals. In VR, analysts can walk in the vehicle’s surroundings, sit on the passengers’ seats, relive behavioral, physiological, or interaction-related events, and re-experience the study data within its original context. In addition, analysts can leverage a real vehicle using passthrough VR. A virtual tablet (see Figure 1) enables an overview of physiological and event data to aid explorations.
Complementary to VR, a desktop view serves as a visual analysis workbook to summarize, link, explore, and compare details of different study sessions’ spatio-temporal, event, and nominal data. The desktop view also offers a 2D window into the current 3D VR scene. View synchronization enables control of tool-wide playback. Moreover, AutoVis enables transitions between VR and desktop view, therefore, representing a hybrid UI (see (Hubenschmid et al., 2022; Reipschläger et al., 2022)). In addition, the interplay between the VR and desktop view enables collaborative use of AutoVis in different levels of immersion, time, and space (see 4.5). By applying deep learning (DL) approaches for the automatic event, emotion, and object inference, AutoVis can convert datasets with low context details (e.g., only containing driving/passenger videos) into datasets of high context fidelity.
We evaluated a prototype of AutoVis to identify the advantages and challenges of combining immersive and non-immersive views for analyzing AUI studies. For this, we investigated three use cases to systematically validate our concepts against current AUI research topics. First, we conducted a use case study on multimodal interaction in automated vehicles (AVs). Second, we demonstrate the conversion and visualization of a real-world dataset (Drive&Act (Martin et al., 2019)) via AutoVis. Finally, we leveraged a real vehicle in the analysis process. In the evaluation, we apply Olsen’s heuristics (Olsen, 2007) to investigate how AutoVis supports analysis tasks. Our evaluation focuses on the applicability of our analysis concept, the interplay between immersive and non-immersive views, and how immersion fosters an effective analysis.
Contribution Statement: (1) The concept of mixed-immersive analysis of AUI studies, utilizing 3D avatars, motion trajectories, and aggregated visualizations embedded in virtually replicated environments. (2) Automotive domain-specific 3D visualization concepts using context portals and driving-path events, and leveraging a real vehicle for analysis via passthrough VR. (2) A prototype implementation of our concepts. We share a demo111The AutoVis demo website: https://autovis.onrender.com and the open-source repository222The AutoVis repository: https://gitlab.com/Pascal-Jansen/autovis with the research community to enable the design of future interactive systems. (3) Insights and research implications derived from a heuristic evaluation of three use cases highlighting how AutoVis can be used to analyze AUI interactions.
2. Related Work
AutoVis builds upon work from several research domains. Therefore, we look into: (1) immersive and non-immersive analytics and spatio-temporal data visualizations, and (2) related work on current desktop-based analysis and visualization of in-vehicle interactions.
2.1. Immersive & Non-Immersive Analytics
A common method for user study analysis is to use non-immersive tools, such as Tableau (Salesforce, 2022) and Spotfire (TIBCO, 2022), or toolkits like D3.js (Bostock et al., 2011) and R (Foundation, 2022). Previous work also employed non-immersive visualizations of spatio-temporal data. For example, augmented top-down views (Brudy et al., 2018; Chittaro et al., 2006; DeCamp et al., 2010; Tang et al., 2010; von Zadow and Dachselt, 2017) and 3D views (Brüning et al., 2012; DeCamp et al., 2010; Prilla and Rühmann, 2018) with various visualizations, such as trajectories (Brudy et al., 2018; Brüning et al., 2012; Chittaro et al., 2006; DeCamp et al., 2010; Tang et al., 2010), heatmaps (Brudy et al., 2018; Chittaro et al., 2006; von Zadow and Dachselt, 2017), and field of view frustums (Brudy et al., 2018; Chittaro et al., 2006; Prilla and Rühmann, 2018). Often, timelines (e.g., (Brudy et al., 2018; Brüning et al., 2012; Chittaro et al., 2006; DeCamp et al., 2010; Marquardt et al., 2015; von Zadow and Dachselt, 2017)) annotated by events (Brudy et al., 2018; Brüning et al., 2012; Marquardt et al., 2015; von Zadow and Dachselt, 2017) control these visualizations. Non-immersive visualizations are mostly complemented with videos to synchronize movement visualizations with the recordings (e.g., (Brudy et al., 2018; Brüning et al., 2012; DeCamp et al., 2010; Marquardt et al., 2015; von Zadow and Dachselt, 2017)). Still, non-immersive tools may require time-consuming adaptions to custom scenarios (e.g., AUIs) and do not allow re-experiencing the data in the original environmental context. In contrast, AutoVis is well-suited towards multivariate data, such as video, audio, sensor, and nominal data gathered in such quantity and variety, specifically in the AUI domain.
Recent work has presented various immersive toolkits facilitating the analysis of spatio-temporal data, for example, obtained from mixed-reality studies (Büschel et al., 2021; Nebeling et al., 2020; Kloiber et al., 2020; Lilija et al., 2020). They mostly focused on placing classic visualizations, such as scatter plots or bar charts, in immersive environments (Butcher et al., 2021; Filho et al., 2020; Hubenschmid et al., 2021; Rosenbaum et al., 2011; Saenz et al., 2017; Wagner Filho et al., 2018; Zhang et al., 2015). However, these approaches represent only two spatial dimensions. There are also 3D trajectories and 3D point plots to visualize the position and speed of participants’ heads and hands (Kloiber et al., 2020; Lilija et al., 2020; Nebeling et al., 2020), gaze cues (Prilla and Rühmann, 2018), tracked objects (Nebeling et al., 2020; Lilija et al., 2020; Büschel et al., 2017), and events (Nebeling et al., 2020). In contrast to these approaches, where the visualizations have little relation to their original environmental context, AutoVis places visualizations directly in a virtually replicated study environment. Similarly, MIRIA (Büschel et al., 2021) and ReLive (Hubenschmid et al., 2022) enable in-situ movement and interaction data analysis by rendering 3D trajectories, proxy objects, and in the case of MIRIA, additional visualizations such as heatmaps on walls or floors. AvatAR (Reipschläger et al., 2022) increased the movement and interaction detail by replicating user postures in AR. To further enrich their 3D visualizations, Reipschläger et al. (2022) placed 2D visualizations (e.g., heatmaps) on a physical tablet. However, all these works on immersive analytics target mixed-reality studies that consider (multiple) HMD users interacting in static areas (e.g., rooms) with constant environmental contexts. They do not support the automotive context (without requiring extensive adaptions) with its unique combination of moving interaction area (the vehicle) and dynamic environment with numerous actors (e.g., pedestrians, bicycles, or cars). In contrast, AutoVis provides immersive visualizations tailored to the requirements of AUI research.
Overall, AUI researchers can use non-immersive or immersive tools to analyze user studies and experiments. Non-immersive tools offer flexibility and reproducibility (e.g., via computational notebooks). Immersive tools can support decision-making (Reichherzer et al., 2021) and increase understanding of spatial data (Kraus et al., 2020b; Reipschläger et al., 2022; Hubenschmid et al., 2022), physiological data (Lee et al., 2021), and environmental context (Büschel et al., 2021; Reipschläger et al., 2022; Hubenschmid et al., 2022). However, discomfort issues (e.g., HMD weight (Yan et al., 2019) or simulator sickness (Kennedy et al., 1993)) can make these immersive approaches unattractive. Therefore, we propose an analysis of AUI studies using immersive and non-immersive approaches, enabling to choose and transition between different immersion levels based on the analysis task. A similar tool exists for analyzing mixed-reality studies, see (Hubenschmid et al., 2022). However, there is currently no approach enabling the mixed-immersive visual analysis of AUI interaction studies.
2.2. Visualization of In-Vehicle Interactions
Practitioners in the AUI domain commonly use non-immersive desktop tools, such as Tableau (Salesforce, 2022), Dovetail (Dovetail, 2022), or R (Foundation, 2022), to analyze study data, for example, video (Dey and Terken, 2017), audio (Wang et al., 2022), physiological (Dillen et al., 2020), behavioral (Hernandez et al., 2014), or tabular data (Kim et al., 2018). However, for many research topics (e.g., multimodal interaction, conversational systems, or eHMIs), such analysis is time-consuming and relevant insights on user behavior may be superficial or overlooked.
Besides, current tools are often specific to a research topic and, therefore, not (directly) applicable to other topics. For example, Blickshift Analytics (Blickshift, 2022) primarily enables analysis of eye-based interaction via scan paths and gaze heatmaps without immersive replication of the study environment. In contrast, Ebel et al. (2021) presented an approach for analyzing passenger behavior. Their tool visualizes the events, time on tasks, and interaction sequences for touchscreens. Still, there is no relation with the vehicle environment or the passenger state (e.g., physiology) and little relation to the in-vehicle space, which is only textually represented (e.g., button names). However, such visual relations would facilitate in-depth analysis of user behavior, yielding more relevant insights faster (Nebeling et al., 2020; Hubenschmid et al., 2022; Reipschläger et al., 2022). Tavakoli et al. (2021) presented a first promising approach. They fused context with driver-specific measures such as heart rate to understand the interplay of the vehicle environment and the driver’s state. However, their tool only focuses on manual driving (SAE 0), and their non-interactive visualizations provide no spatial information on passenger movements, impeding detailed analysis.
Altogether, there is no tool for interactive immersive and only insufficient tools for non-immersive analysis of human-vehicle interactions. Besides, solutions providing 3D environments that relate in-vehicle interactions with the vehicle environment are missing. With AutoVis, we aim to fill this gap for any driving automation level (SAE 0-5).
3. AutoVis: Process & Requirements
The AutoVis development process is based on the Design Study Methodology proposed by Sedlmair et al. (2012) and the development of novel visualization concepts (see (Langner et al., 2021; Büschel et al., 2021)). The process consists of (1) Ideas & Scope, (2) Requirements, (3) Concepts, (4) Prototype & Demonstration, and (5) Evaluation. This section explains the design rationale behind the AutoVis concepts (Section 4). We provide results from a literature analysis of AUI research (see 3.1), report results from five expert interviews (see 3.2), and describe the derived toolkit requirements (see 3.3).
3.1. Analysis of AUI Research
As part of the AutoVis development process, we analyzed existing AUI research. For this, literature reviews served as a starting point, see (Jansen et al., 2022; Ayoub et al., 2019; Detjen et al., 2021a). We then retrieved relevant publications via backward chaining with a depth of two. For further inclusion, publications should: (1) capture heterogeneous (spatio-) temporal data, or (2) consider in-vehicle and environment contexts, or (3) investigate interactions with novel modalities. Based on this analysis, we identified AUI research topics that would benefit from tool support:
T1 Ideation of Novel In-Vehicle Interaction
In AUI research, practitioners create novel UI interaction concepts and suggest future research directions from creative processes, for example, using design spaces (Jansen et al., 2022) or brainstorming (Dey et al., 2018). They also design novel input and output modalities leveraging, for example, olfactory (Dmitrenko et al., 2020) or thermal (Hernandez et al., 2014) sensations. We found that early work on proof-of-concept prototypes often conducted user studies. Here, an immersive analysis tool could provide insights into the spatio-temporal usage of novel interactions (e.g., olfactory) to inform further iterations about their interplay with other modalities and the environment.
T2 Evaluation of In-Vehicle UIs
In general, AUI evaluations are part of user-centered design processes containing user interviews (Funk et al., 2020), field studies (Wintersberger et al., 2018a), and lab studies (Normark, 2015). The goal is to measure, for example, the usability (Zhong et al., 2022), trust (Colley et al., 2021c), acceptance (Wintersberger et al., 2018b), or perceived safety (Osswald et al., 2012) of UIs. Evaluations use driving simulators of varying fidelity (e.g., (Colley et al., 2022c; Hock et al., 2022)) or real vehicles (Goedicke et al., 2018). We found that multiple evaluation methods are combined due to complex dynamics between passengers, vehicles, and the environment. For example, quantitative logs (e.g., passenger video, audio, and vehicle telemetry) combined with qualitative measurements (e.g., interviews). A tool could ease such combined analysis and thus enable more efficient and effective AUI evaluations by visualizing relations between the results of different evaluation methods.
T3 Know Thy Passenger
Sensors, cameras, and wearables collect large amounts of real-time information about passengers, such as heart rate (Pakdamanian et al., 2021), skin conductance (Dillen et al., 2020), or pupil size (Benedetto et al., 2011). This enables context-adaptive applications (Schölkopf et al., 2021) and facilitates driver assistance (Kundinger et al., 2021) or infotainment system interactions (Rittger et al., 2022). Various variables indicate the passenger’s state, such as cognitive load, emotion, fatigue, stress, drowsiness, attention, distraction, and situation awareness. Therefore, manually inferring actions (e.g., a button click) from a passenger state is challenging and often automated using DL (e.g., (Ahmad et al., 2018)). However, DL and user modeling can be complex and, therefore, impractical in early development. Automatic conversion of data (e.g., tabular or video) into AUI domain-tailored visualizations could enable manual pattern detection to determine data worth further investigation. In addition, the impact of in-vehicle, environmental, and social factors on passengers’ physiological and behavioral signals and vice versa is difficult to determine. An immersive tool could support such analysis by providing spatio-temporal context visualizations paired with passenger sensor data.
T4 Driver Distraction
In today’s vehicles, drivers can operate infotainment functions while driving, but this should not affect safety. As a result, distraction is still one of the primary problems of infotainment systems (Schmidt et al., 2010). Research focuses on reducing display glances, for example, employing speech dialogue systems (Chang et al., 2009) or auditory output (Kun et al., 2009). However, we found a challenge in determining in-vehicle and environmental distraction factors. Besides, distracted driver interactions with AUIs can only be assessed via manual coding of video recordings and interaction logs. A tool could help identify distraction factors without explicitly logging them based on prior assumptions by visually aggregating related events.
T5 Multimodal In-Vehicle Interaction
Multimodal UIs provide multiple modes of interaction between passengers and vehicles. This can be sequential, requiring mode switches or allowing multiple modes simultaneously (see (Jansen et al., 2022)). Practitioners presented various approaches for multimodal in-vehicle interaction, such as combining gaze with speech (Roider et al., 2018), gestures (Gomaa et al., 2020), or touch (Kim et al., 2020b). We found that researchers are mainly interested in usable combinations of modalities at different interaction locations. However, modalities’ usage order, time interval, selection, and environmental contexts are challenging to determine without tool support, as spatio-temporal information is difficult to assess from tabular, video, and audio files.
T6 Conversational and Speech-Based UIs
Speech enables hands- and glances-free interactions during driving (Weng et al., 2016). Conversational systems support drivers in assisted (SAE 1-2), automated driving (SAE 3-5), and non-driving-related activities. For example, practitioners proposed interactions with artificial speech (Kim et al., 2019; Guo et al., 2021) and voice commands (Winzer et al., 2018). Speech interactions visualized as graphs or dialog structures often fail to provide insight into speech-referred in-vehicle and environment contexts. A tool could overcome this by visualizing speech interactions as events in relation to other events and the driving environment.
T7 Control Transitions Between Vehicle and Driver
Current automation systems have operational design domains requiring control transitions between driver and vehicle (Morales-Alvarez et al., 2020). Practitioners presented various methods for safe and comfortable transitions. For example, they assessed driver’s readiness (Lv et al., 2018) and used various modalities for transition requests, such as visual (Radlmayr et al., 2014), auditory (Politis et al., 2015), and tactile (Bazilinskyy et al., 2018) modalities. We found that researchers often measure the transition quality using driving performance logs and driver reaction time. However, the driving environment which impacts the transition quality can only be determined if the scenario is set up in advance. A tool replicating the driving environment could enable insights into traffic density, road conditions, and shared driver-vehicle situation awareness for various transition scenarios.
T8 External Human Machine Interfaces
When semi- and fully AVs are introduced, vehicles may feature eHMIs to communicate (safety-related) information to other drivers (Colley et al., 2022b) and vulnerable road users, such as cyclists, pedestrians, and impaired people (Colley et al., 2020b; Haimerl et al., 2022). For example, practitioners proposed concepts for safe road crossing (Eisma et al., 2020) and automation mode indications (Lee et al., 2019). However, we found that a challenge in assessing eHMIs’ visibility, placement, and content design is the limited access to other road users’ POVs in real-world settings. A tool replicating the driving environment in 3D could provide these POVs.
3.2. AUI Domain Expert Interviews
In the next development step, we invited five AUI researchers (PhD students) from our institute for individual interviews. The goal was to reflect upon the research topics (see 3.1) and elicit common challenges in analyzing AUI studies to identify promising design choices for a mixed-immersion tool. All experts have developed, conducted, and analyzed AUI studies. The five semi-structured interviews lasted approx. one hour. Similar to Langner et al. (2021), we provided a list of typical visualization tasks (the interaction categories by Yi et al. (2007)) to guide the discussion towards immersive analytics, as the interviewees were no experts in designing such systems. In addition, we presented the research topics T1 - T8 obtained from the literature analysis (see 3.1) as an impulse for discussion and to set the scope. However, we omitted the description of how each research topic could benefit from tool support to prevent biasing the interviewees.
The interviews comprised elements of brain-writing. First, interviewees (E1 - E5) collected their thoughts on each research topic as a written text. After approx. 32 minutes (four minutes for each topic), both parties discussed the written thoughts for the remaining time. The interviewer took notes for later analysis. Three authors discussed, labeled, and coded these notes into themes (see Appendix A). The themes are: visualize object positions and movements (E1, E2, E3, E4), enable collaborative analysis (E2, E3, E4, E5), visualize data interdependencies (E2, E4), allow data annotations (E4), enable data filtering (E1, E5), include a real vehicle in the analysis (E1, E3, E4), enable mixed-immersion analysis and transitions between desktop and VR (E2, E3, E4, E5), link in-vehicle and environmental contexts (E3), and preprocess data automatically (E4, E5). The themes guided the specifications for the toolkit requirements, the concept design, and the prototype.
In addition, we derived four challenges specific to the AUI domain: Large Distances Between Objects of Interest: A driving environment can span several kilometers with a large distance between objects of interest (e.g., stores or landmarks), referenced in natural interactions (e.g., gesture, speech, or gaze). Volatile In-Vehicle and Environmental Contexts: Passengers and the vehicle can interact bidirectionally. If, in addition, these interactions relate to the environment, also hosting object interactions (e.g., between cars and pedestrians), volatile interactions between in-vehicle and environmental contexts emerge. Ubiquitous Physiological Measures: As interior embedded sensors always surround passengers, physiological measures are ubiquitous. However, the resulting data is not spatial. Nevertheless, effective analysis of AUI studies requires a link to spatio-temporal data, such as passenger and vehicle movements. Different Actors: In- and outside the vehicle, there is an interplay of diverse actors (e.g., passengers, drivers, other vehicles, bicyclists, or pedestrians), each with different goals, characteristics, and behaviors in a traffic situation.
3.3. Toolkit Requirements
After analyzing AUI research (T1 - T8, see 3.1) and interviewing domain experts (E1 - E5, see 3.2), we derived recurring themes and challenges. Based on these challenges, we list functional requirements (R1 - R9) that a system, such as AutoVis, should address. We integrate the categories by Yi et al. (2007) into the requirements to ground them in widely used interaction techniques in information visualization. The categories are Select (mark something as interesting), Explore (show me something else), Reconfigure (show me a different arrangement), Encode (show me a different representation), Abstract/Elaborate (show me more or less detail), Filter (show me something conditionally), and Connect (show me related items).
R1 Visualization of Position and Movement Data
AUI research uses positions and movements over time to investigate behavior (T1, T2, T4, T5, T7) (E1 - E4). In Abstract/Elaborate interactions, analysts should be able to retrieve movement trajectories, positions of other road users (T8) (E2, E4), and gaze/gesture directions (E2), needed to describe UI interactions. Besides, spatio-temporal object positions should enable understanding the context in Connect and help to reveal movement patterns in Select interactions.
R2 Visualization of Event Data
In addition to spatio-temporal data, AUI studies also gather event data, including interactions (e.g., gesture or speech events) (T1, T2, T4 - T7), application events (e.g., mode switches or task completions) (T1 - T7), and passenger events (e.g., emotional or cognitive state) (T1 - T8). In Connect interactions, analysts should be able to obtain event order and (co-)occurrence, as they may reveal patterns and dependencies. Moreover, analysts should be able to explore these patterns in detail over time within Explore and Filter interactions.
R3 Visualization of Data Interdependence
Researchers often measure physiological states to understand passengers (T1 - T7). However, temporal data may be difficult to interpret without the context of events or user behavior (E2, E4, and see (Lohani et al., 2019)). Therefore, temporal should be visualized close to spatio-temporal and event-based data. In Connect interactions, analysts should directly compare and discover dependencies with other temporal data streams, events, and passenger behavior (E2, E4).
R4 Linking In-Vehicle and Environment Contexts
In-vehicle interactions and the environment can be highly related (E1 - E5). For example, passengers may refer to environment objects via gaze or pointing (Gomaa et al., 2020) (E3). Therefore, AUI study analysis (in T1 - T7) might benefit from merged virtual replications of both contexts. Besides, sensor data gathered in (field) studies should be virtually replicated and linked to the in-vehicle context (E3). For example, for Connect interactions aiming to analyze eHMI interactions (T8).
R5 Filtering, Flexibility, and Gradual Control over Visualizations
When evaluating and comparing interaction data in T1 - T8, filtering allows focusing on subsets (E1). Analysts should be able to perform Filter interactions for sessions, study conditions, participants, and visualizations’ time and location to account for spatio-temporal data. Depending on the study data, the appropriate visualization placement may require flexibility and reconfigurability (E5). For example, changing visualizations’ visibility and arrangement during Reconfigure and controlling their detail via Abstract/Elaborate interactions. There should also be approaches to overcome analysts’ disabilities, such as colorblindness.
R6 Data Annotations
A typical AUI study analysis task is video or audio coding (e.g., see (Dey and Terken, 2017)) to annotate situations or behaviors in T1 - T8 (E4). Such Select interactions support highlighting undefined events and labeling datasets, for example, for DL (E4). Moreover, such annotations should relate to space and time.
R7 Integration of Video and Audio Recordings
Most AUI studies in T1 - T8 record video and audio to evaluate participant behavior. Audio becomes particularly relevant for speech interactions (T1, T2, T5, T6). Therefore, such recordings should be integrated into a single UI to prevent frequent program window switches to display different data types (E5).
R8 Leveraging a Real Vehicle
A real vehicle increases the external validity in T1 - T8. In such field studies, interactions highly depend on the vehicle interior (e.g., center console layout or seat configurations). Besides, study supervisors often cannot be part of the study, for example, in naturalistic driving studies, and want to relive the experiments (E4). Therefore, an immersive tool should integrate a real vehicle into the analysis. In Connect, Encode, Filter, and Select interactions, analysts should be able to tangibly analyze AUIs and leverage the real vehicle (E1) via passthrough VR.
R9 Enabling Collaborative Analysis
Practitioners usually work in larger groups (E2, E3, E4, E5) and collaboratively share, evaluate, and iterate over data. In addition, they collaborate across different locations and time zones (E2). Therefore, a tool should provide a shared and persistent analysis environment (E3). Collaborators should be able to analyze the data at hand (a)synchronously in different locations, with different available technologies (e.g., VR and desktop, see A.7).
4. AutoVis: Concepts
Based on R1 - R9, we propose AutoVis: a tool enabling the mixed-immersive and interactive analysis of in-vehicle interactions, passenger behavior, and physiology combined with a replicated vehicle environment and study context. To the best of our knowledge, AutoVis is the first immersive analysis tool for the AUI domain.
The core of AutoVis is the interplay of a desktop and VR view (see cross-device interactions (Sereno et al., 2022; Wang et al., 2020)). This enables seamless transitions in single- and multi-user analysis (see 4.5.1). The desktop view provides a non-immersive overview of AUI studies. In the immersive VR view, 2D (e.g., heatmaps on in-vehicle surfaces) and 3D visualizations (e.g., passenger avatars) may improve the understandability of spatial data. Besides, a virtual tablet with an overview of the desktop view supports relating the VR environment with non-spatial data, such as physiological data. Moreover, AutoVis integrates video and audio playback into one layout. Thus, AutoVis can provide study context details that may not otherwise be found in more abstract visualizations.
Although AutoVis provides two analysis views (desktop and VR), analysts are not intended to switch between tools, as switching between a hybrid system can be cumbersome (Hubenschmid et al., 2022). Instead, they can use the desktop view in the preparation or wrap-up of the analysis process and use the VR as the main view during analysis. In case of unavailable VR devices, the desktop can also serve as a main view with limited immersion.
This section describes the data processing pipeline, the views, and features of AutoVis based on the requirements informed by our development process (see 3), and the interplay between desktop and VR view in single and multi-user scenarios.
4.1. Data Processing Pipeline
To address requirements R5, R7, and R9, we designed AutoVis’s processing pipeline to be flexible and versatile in supporting a wide range of data, configurations, and applications. We describe AutoVis’s processing regarding the allowed data specification and the automatic detection of objects, events, and driving environments.
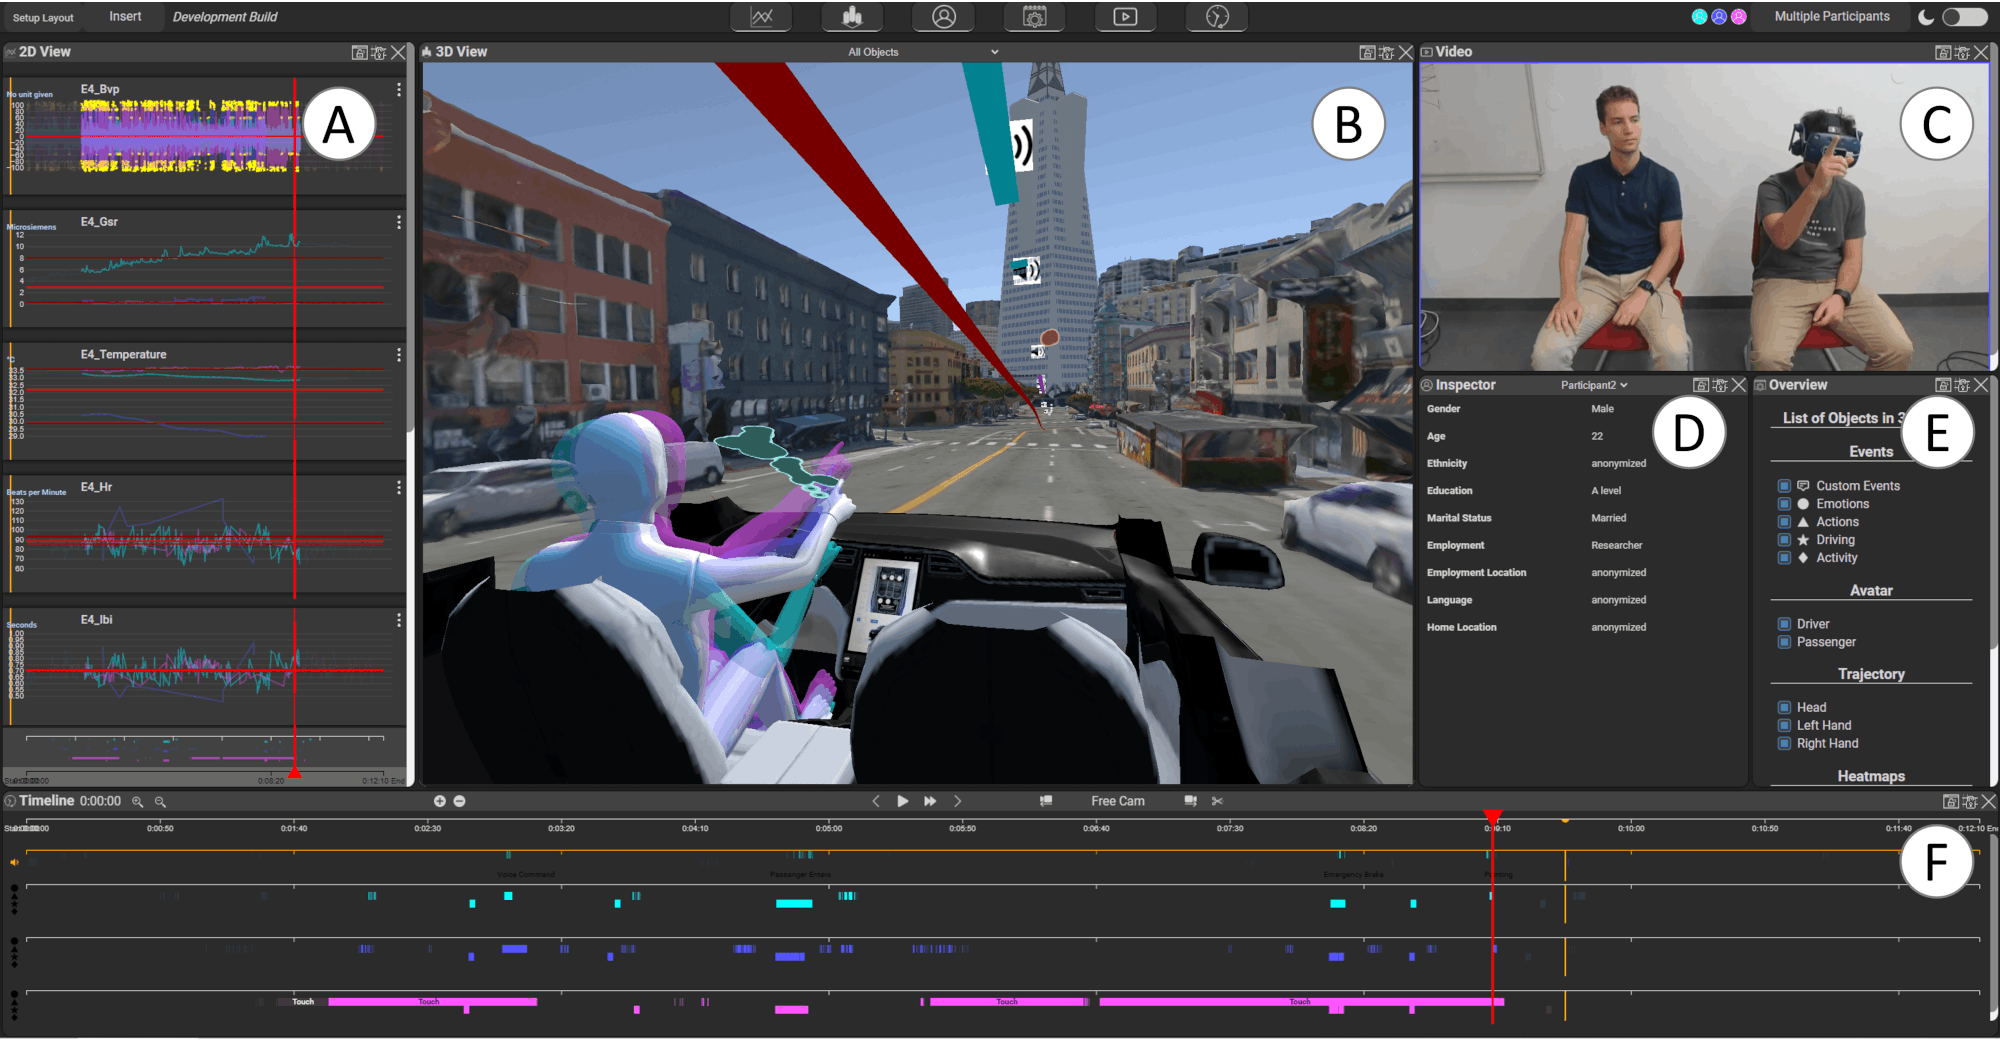
A desktop view of a dashboard of AutoVis. The dashboard is split into different panels. On the left, multiple graphs are organized in rows within one column labeled ”2D View”. In the center, a panel named ”3D View” shows a 3D visualization of the scene. A video panel is located in the top right. Two panels are directly below the video panel. The first is labeled ”Inspector” and presents data as a table. The other panel, called Overview, contains multiple checkboxes that control other panels on the dashboard. At the bottom, a horizontal timeline can be found. On it, multiple rectangular boxes represent the start and endpoints of events.
4.1.1. Data Sources & Specification
AUI interactions can be explicit (e.g., touch) or implicit (e.g., heart rate) (Jansen et al., 2022). Therefore, practitioners leverage heterogeneous data sources, which provide temporal or spatio-temporal data. For accurate study replication (R1 - R4) and to address R5, AutoVis allows using five data types: physiological (e.g., electrodermal activity (Dillen et al., 2020)), behavioral (represented as events, e.g., head movement (Broy et al., 2014) or drowsiness (Albadawi et al., 2022)), vehicular (e.g., acceleration or steering angle), environmental (e.g., positions of other road users), and personal (e.g., age or preferences). AutoVis minimally requires behavioral data (i.e., passenger posture and movements) to visualize in-vehicle avatars and trajectories and environmental data (i.e., video data) to reconstruct the vehicle surroundings. If spatio-temporal data, such as movements and GPS positions, is missing, AutoVis can still be used as a non-immersive desktop tool to visualize temporal data (e.g., sensor recordings) and events.
4.1.2. Data Preprocessing
AUI study datasets are often heterogeneous and processed to different degrees. They may contain data in raw formats (e.g., sensor streams) or abstract classes and events. Therefore, a companion tool embedded in the pipeline preprocesses data according to the AutoVis data specification (see 4.1.1).
First, AutoVis converts file formats and automatically detects events in a dataset, preventing manual labeling or the cumbersome use of external programs. We leverage open-source state-of-the-art DL approaches for automatic event detection. With this, the companion converts low-level physiological signals (e.g., electrodermal activity or pupil size) into higher-level information, such as stress, cognitive load, distraction, or drowsiness. Besides, our preprocessing concept employs image-based recognition of objects (Tianxiaomo, 2022), pose/motions (Hidalgo et al., 2022), gestures Shen et al. (2022), and emotions (Sefik Ilkin Serengil, 2022), to obtain spatial and contextual information about the vehicle environment and passengers. Based on this, AutoVis automatically places 3D models of detected objects at their inferred positions in a 3D environment (cities, roads, and landscapes) queried via GPS (e.g., via OpenStreetMap). Our preprocessing allows for omitting expensive and vast external vehicle sensors in study setups. AutoVis supports various (partly) unprocessed datasets from the automotive domain, such as Drive&Act (Martin et al., 2019), MDAD (Jegham et al., 2019), or HARMONY (Tavakoli et al., 2021).
Finally, the input files that already matched the AutoVis data specification are merged with the preprocessing results into a single config file containing all relevant study metadata. Accordingly, the config file provides information about the study conditions and sessions, events, tracked scene entities, such as object positions for each time step, and physiological data. Using timestamps, any recorded video and audio data can also be loaded and played synchronously with the replicated 3D environment and study context. AutoVis uses the same config file for desktop and VR views, which enables seamless view transitions and multi-user scenarios.
4.2. Non-Immersive Desktop View
The AutoVis desktop view provides a non-immersive overview of study data (see Figure 2). Inspired by related tools (Nebeling et al., 2020; von Zadow and Dachselt, 2017; Hubenschmid et al., 2022), our concept utilizes a freely adjustable panel layout (R5). The desktop view is divided into five panels (see Figure 2): 2D panel (A), 3D scene panel (B), video (C), inspector (D), overview (E), and timeline (F).
Similar to ReLive (Hubenschmid et al., 2022), analysts can examine events (R2), control the tool-wide audio and video playback (R7), and annotate events (R6) using the timeline (see Figure 2 F). We added line diagrams in the 2D panel (see Figure 2 A) for quickly identifying relevant sequences (R3) in non-spatial temporal data, such as physiological data. To address R1, the 3D scene panel replicates the original study environment, such as buildings or other road users, and visualizes the study vehicles’ movements using a virtual ego-vehicle (see Figure 2 B) and the interplay of passengers’ in-vehicle interactions and the environment (R4). For desktop panels’ details, see Appendix B.
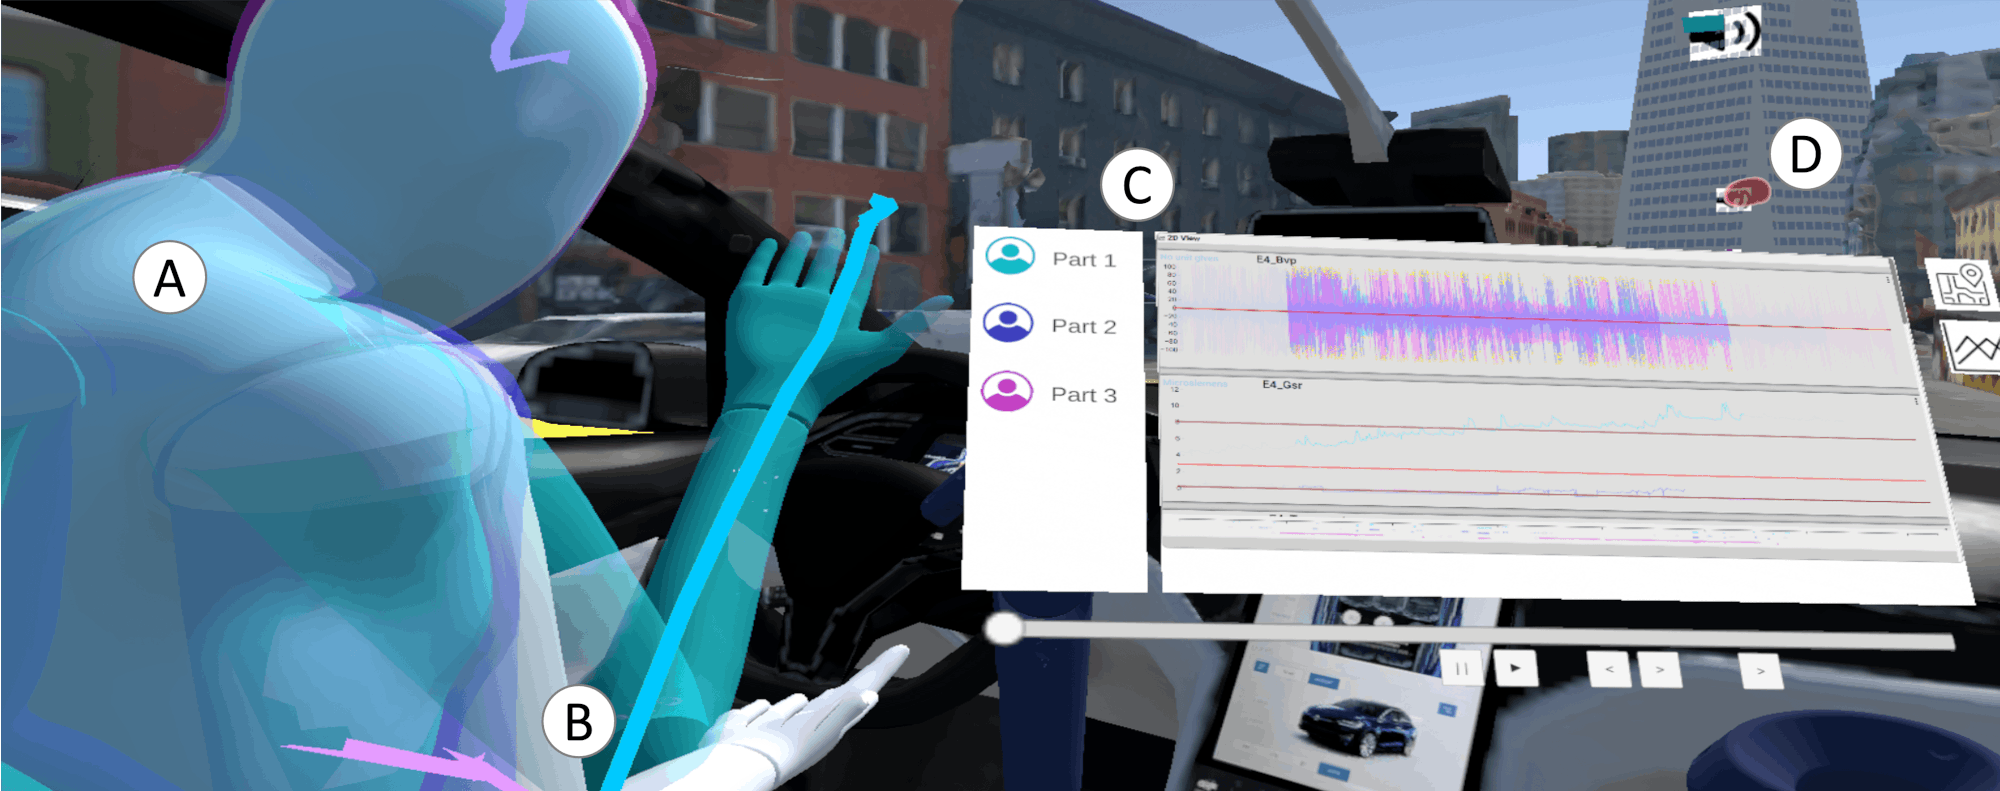
The picture shows the inside of a vehicle in a virtual environment. The picture is taken from the co-driver seat. On the driver’s seat, multiple avatars can be seen as well as colored trajectories that represent their movement over time. Heatmaps can be found on the surfaces and windows of the vehicle. A virtual tablet used by the human analyst can be seen on the right. It allows the analyst to control the timeline, switch between participants and look at graphs.
4.3. Immersive VR View
Inspired by related work (Hubenschmid et al., 2022; Büschel et al., 2021; Reipschläger et al., 2022), the immersive VR view enables the interactive re-experience of AUI studies (see Figure 3). For this, AutoVis replicates the ego-vehicle, other road users, passenger behavior, and environmental context (see 4.1.2).
Analysts can interact with the environment using their VR controllers for direct touch (tracked by Unity GameObject collisions) or interact with distant objects via raycast. Analogous to object selections in the desktop 3D scene panel, analysts can interact with avatars, trajectories, heatmaps, events, and annotations. The object selection via direct touch places a context menu next to the selected component in VR. For example, next to an avatar’s head. The context menu provides the same features as the desktop view’s inspector and overview panel (see 4.2). The (distant) object selection via raycast opens the context menu in the virtual tablet attached to the left controller (see Figure 3 C). This ensures their readability regardless of low VR resolutions and prevents unnecessary approaching of distant objects. In addition, the tablet displays scene controls, the timeline, study-related metrics, the 2D panel, the event line, and a mini-map (R3) (see Figure 4 c and d).
The VR view hosts 3D visualizations that are adapted from related immersive analytics tools (Hubenschmid et al., 2022; Büschel et al., 2021; Reipschläger et al., 2022) and novel approaches to overcome AUI domain-specific challenges (see Figure 3): avatars (A), trajectories (B), in-vehicle, and environment (D) heatmaps.
Spatio-Temporal Events & Annotations
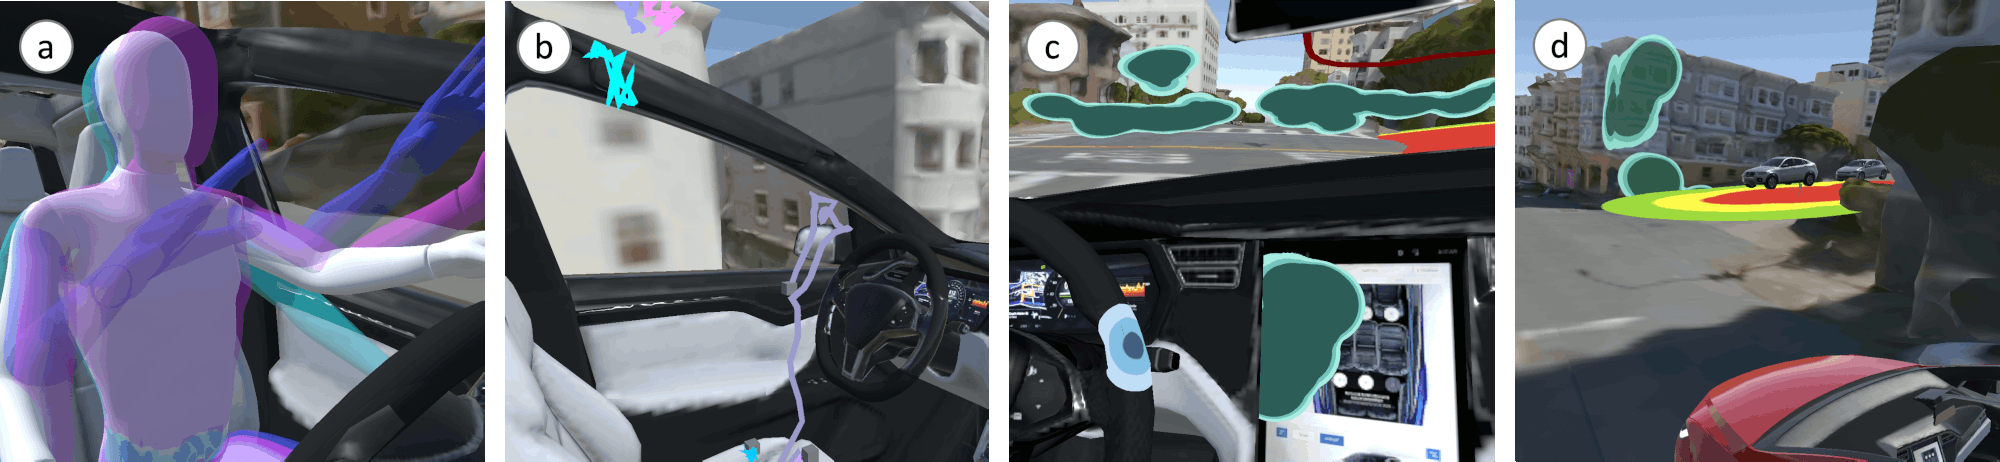
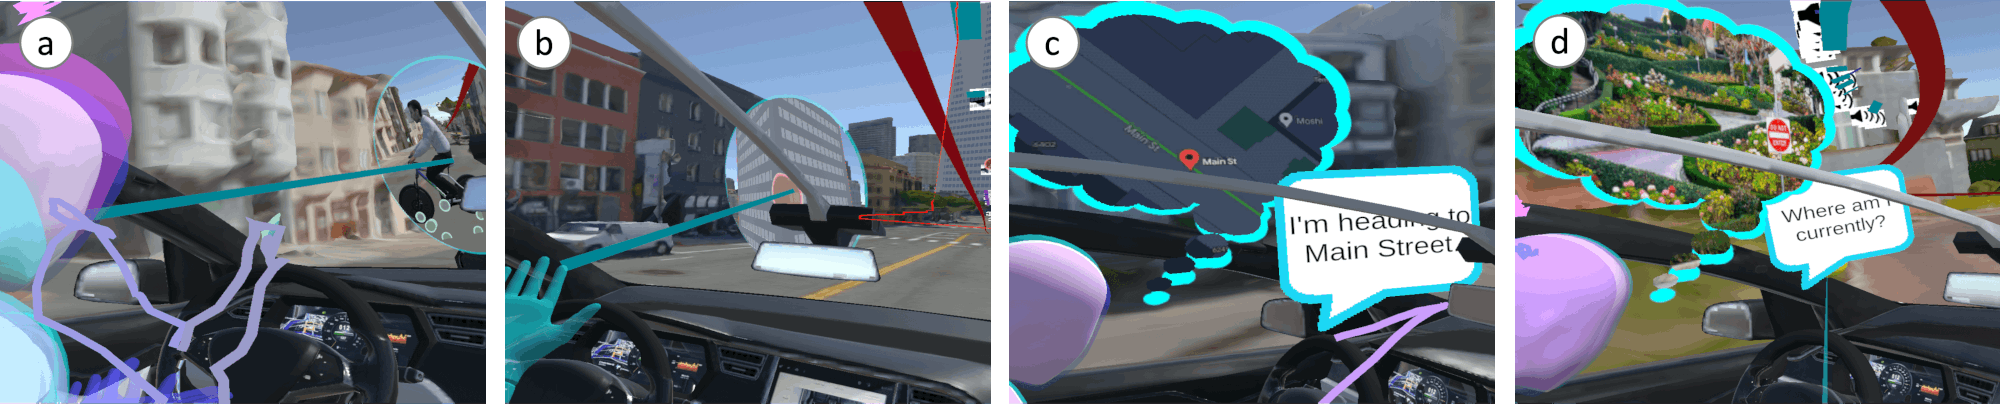
AUI study analysis considers not only the event duration but also their location. Inspired by Büschel et al. (2021), we propose to visualize such spatio-temporal events in the immersive VR view (see Figure 4 a), indicating the location and orientation of (inter)action, emotion, driving, and activity events, addressing R2 - R4. This enables discovering spatial relationships between interactions with in-vehicle UIs, driving environment, context, and passenger states (e.g., emotion or stress). However, automotive events can visually overlap on a vertical axis if study vehicles drove the same route. To overcome this, inspired by Fouché et al. (2022), we propose a vertical axis explode view for events of individual participants, triggered via direct touch or raycast. However, events can be distributed across large distances (e.g., several kilometers, see the challenge in 3.2) and hidden between replicated 3D buildings and trees. Therefore, analysts can visualize on hover (e.g., via raycast) events of the same type (e.g., emotion) on a visual layer of higher priority than the remaining environment to peek through 3D objects.
AutoVis supports creating, editing, and persistent sharing of annotations in VR, addressing R6 and R9. Analysts can place annotations in space, similar to 3D markers in MIRIA (Büschel et al., 2021) and MRAT (Nebeling et al., 2020), by moving to a specific position and open the edit menu via the controller. Such annotations are spatio-temporal labels or comments that are linked in space and to the timeline of a dataset (see Figure 4 b). AutoVis visualizes this link by automatically placing labels on the spatial event line. Analysts can use the labels to annotate their dataset, for example, for supervised DL. In contrast, comments can be set and edited anywhere in the 3D environment, for example, to leave hints, descriptions, and opinions about the analysis for oneself (when switching views) or collaborators.
Avatars
In AutoVis, avatars replicate passengers (see Figure 3 A) from pre-recorded 3D skeleton data of participant movements (R1). Inspired by AvatAR (Reipschläger et al., 2022), AutoVis updates the avatars in each playback time step. Free VR movement around avatars enables exploration of posture, relation to the vehicle environment, and movement patterns. Analysts can enter an avatar’s POV to gain first-person insights into how passengers interact with their surroundings. Such an embodied analysis is impossible using non-immersive analysis tools. AutoVis displays a distinct avatar for each participant. In contrast to AvatAR (Reipschläger et al., 2022), where avatars replicated room-scale movements, the AutoVis avatars have the same positions (e.g., sitting on driver and passenger seats). Therefore, we propose an aggregated avatar, which aggregates the positions and movements of the individual avatars to increase visual clarity (see Figure 5 a). For the aggregated avatar’s skeleton, AutoVis calculates the average position and rotation of the individual avatars’ joints per frame. Using the aggregated avatar, analysts can explore similar passenger behaviors on a meta-level (R3). To further reduce visual clutter, the avatars are semi-opaque, and their colors correspond to the participants’ tool-wide colors.
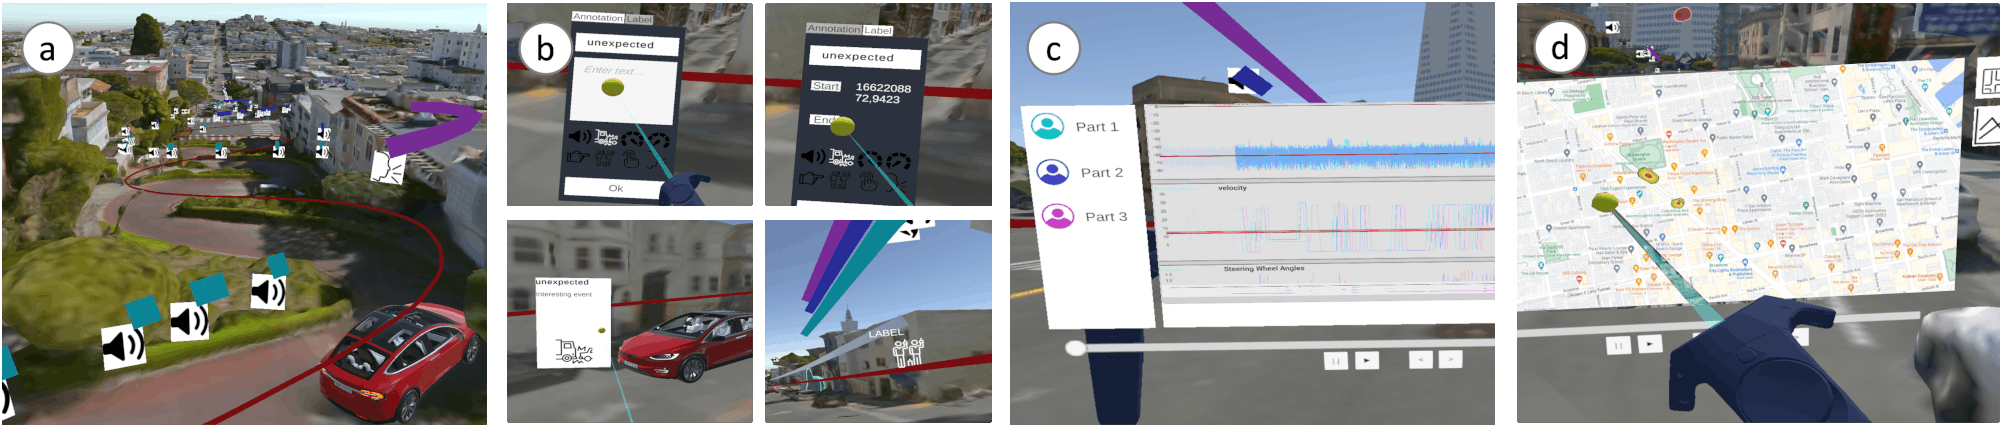
The figure is split into four sub-figures. The first picture shows a birds-eye view of the tool. A car is driving down Lombard street. Events that were recorded during a study are marked in the 3D environment. The second sub-figure shows the user placing annotations in VR as well as labels attached to the 3D event timeline. The third figure shows the virtual tablet which can be used to look at physiological and event data. The fourth picture shows a map of the location the user is currently at on the virtual tablet.
This figure is split into four sub-figures. The first shows three semi-transparent and one opaque humanoid avatars on the driver’s seat in a virtual vehicle. The second shows colored lines representing trajectories of the avatars’ head, left-hand, and right-hand movements. The third shows color-coded gaze and touch heatmaps on in-vehicle surfaces and windows throughout the interior. The last shows color-coded heatmaps of gazes and pointing at buildings and the stress in the vicinity. A heatmap on the street shows the positions of other vehicles.
Trajectories
Similar to (Büschel et al., 2021; Hubenschmid et al., 2022; Reipschläger et al., 2022), we employ 3D trajectories. The trajectories (see Figure 3 B) correspond to an avatar, providing a different representation of movements. They replicate hands and head movements for a selected time frame (R1). The trajectories are colored lines matching their avatar’s color (see Figure 5 b). They provide an overview of the passenger movements for a specific time frame without the need for playback in real-time.
In-Vehicle Heatmaps
In-vehicle heatmaps provide an overview of interactions with interior surfaces (R1), such as windshield display, center console, or dashboard. Instead of classic 2D heatmaps (e.g., as in (Reipschläger et al., 2022)), AutoVis employs heatmap textures that accurately map the 3D interior mesh (see Figure 5 c). Gaze heatmaps visualize where passengers looked, for example, to investigate glances at the dashboard or center console. This can help determine passenger states, such as distraction and cognitive load. Likewise, analysts can use touch heatmaps. Combined touch and gaze heatmaps may indicate modality interdependencies (R3) (see Figure 5 c).
Environment Heatmaps
According to our data specification (see 4.1.1), passengers can interact with the vehicle environment via gaze, pointing, and speech. Therefore, AutoVis employs gaze and pointing heatmap textures accurately mapping the replicated 3D meshes of buildings and other road users (see Figure 5 d). These heatmaps can help to determine, for example, driver distractions or detect movement and gesture patterns (R1). It also highlights correlations between environmental context and gaze/pointing interactions (R4). Moreover, a traffic heatmap displays the positions of other road users (R1) (see Figure 5 d). This enables inferring the current driving context and traffic flow. In addition, analysts can modify the distinct color schemes of each heatmap (R5).
Context Portals
Large distances between objects of interest and volatile in-vehicle and environmental contexts are common challenges in AUI study analysis (see 3.2). We propose context portals to overcome these challenges and to address R3 and R4. Context portals provide a glimpse of the referenced context (i.e., a location or object) in interactions by showing a spatial portal next to an avatar’s finger or head (e.g., as a thought bubble). The portal shows the object or location up close using a render image from an additional virtual camera (see Figure 6). Analysts can activate a context portal by selecting an (inter)action event (see timeline in Appendix B) on the event line in 3D or on the virtual tablet. However, only one portal can be visible at a time. We distinguish two context portal modes: (1) direct and (2) indirect.
AutoVis displays a (1) direct context portal when participants referenced objects or locations in the vicinity using gaze, pointing, or speech. The portal then shows a zoomed view of the referenced entity from the avatar’s POV, for example, enabling to determine an object’s visibility time during an interaction. To explicitly visualize gaze and pointing targets, there is an additional ray and hit point visualization that reaches through the direct context portal (see Figure 6 a and b). Regardless of interacting modality, the referenced object’s outline is highlighted to make it stand out against the environment (see Figure 6 b).
The interaction modality determines the 3D position of the direct context portal. In a pointing interaction, the direct context portal is displayed in an extended line of two meters from the fingertip of the respective avatar (see Figure 6 b). Analogously, the avatar’s eyes are the reference point for positioning the portal for gaze interactions. However, for speech interaction, the portal is a thought bubble next to the respective avatar’s head. In addition, a speech bubble is displayed underneath, which contains the utterance for the inspected time frame (see Figure 6 d).
An (2) indirect context portal visualizes referenced objects or locations that are not present in the environment. AutoVis queries the missing information, for example, from Google Maps, and shows a screenshot of the result in the indirect context portal (see Figure 6 c). Since passengers can only reference objects that are not in the vicinity with speech, a thought bubble displays the query result. The direct and indirect context portals circumvent searching for referenced objects or locations (e.g., a landmark) in the environment. Otherwise, this search can be time-consuming and challenging if the driving environment is unknown or may result in a barely visible distant object or location.
The figure is split into four sub-figures. The first two images depict the gaze vector of a participant. Because the gaze target was far away, a portal working as a magnifier is used to make the target appear close and larger. The third and fourth figures show events where the participant gave speech input. Speech bubbles depict what was said, thought bubbles depict the context referenced in the speech input.
4.4. Immersive Passthrough VR View
The passthrough VR view enables leveraging a real vehicle’s interior, layout, and haptics for an immersive AUI domain-specific analysis concept, addressing R8. Using a VR HMD with external cameras, analysts can capture the real vehicle, for example, while sitting in the passenger seat. AutoVis displays this camera stream as a separate visual layer of lower priority than the in-vehicle visualizations to augment the real vehicle with the 3D visualizations. Besides, the virtual ego-vehicle’s 3D model is substituted with the real vehicle (see Figure 7 a). AutoVis places the 3D in-vehicle visualizations (avatars, trajectories, and heatmaps) at their intended positions within the real vehicle inferred from the dataset.
However, datasets in the automotive domain may not contain vehicle 3D meshes. AutoVis can still infer the mesh by retrieving a pre-defined 3D model once for a given real-vehicle model name and number in a dataset (e.g., a 2004 BMW 525i Touring). AUI practitioners could also integrate the real-vehicle mesh into their dataset using an HMD’s spatial understanding. The continuously updated infrared depth scans provide the required interior mesh to augment the 3D visualizations. Using either approach, AutoVis can place avatars at their respective seats and map heatmaps to the real-vehicle interior (see Figure 7 b).
Outside the real vehicle, the 3D analysis environment is still visible as in the (normal) VR view. Although possible, we decided against augmenting the real environment with 3D visualizations to prevent the real environment from interfering with the analysis environment (see experts’ concerns on a passthrough VR mode in the Appendix A.6). Therefore, this view is only usable during parking. To activate the passthrough VR view, analysts can select an area within the real vehicle (e.g., dashboard or driver’s seat) via direct touch or raycast. Also, this enables real-vehicle passthrough only in certain areas of the virtual analysis environment (R5).
4.5. Interplay between Desktop and VR View
We describe the interplay between desktop and VR in single and multi-user scenarios. Besides, we explain specific visualizations and interaction concepts to foster collaborative analysis in AutoVis.
4.5.1. Multi-User Scenario
Analysts can collaborate in multi-user scenarios (R9) covering any combinations of desktop, VR, and passthrough VR views. Similar to the space-time taxonomy of collaborative visualization by Isenberg et al. (2011) and the definition of collaborative immersive analytics by Billinghurst et al. (2018), AutoVis supports collaborations across different levels of immersion (same- vs. mixed-immersion), times (synchronous vs. asynchronous), and spaces (co-located vs. distributed).
AutoVis enables hosting a persistent analysis environment as the basis for collaboration, addressing R9. The host shares the analysis environment as a config file (similar to a Unity scene file, see 4.1), for example, via cloud storage, to allow remote and independent access. The others only import the config file into their AutoVis instance, which reconstructs the 3D analysis environment.
To enable effective interplay between desktop and VR views, AutoVis provides three visualization concepts that apply to same- and mixed-immersion scenarios: (1) AutoVis visualizes other analysts’ positions and movements via analyst avatars (see Figure 8 a) inspired by Chen et al. (2021). They also display the analysts’ POVs via viewing frustums. In addition, (2) AutoVis provides visual bookmarks as ghost ego-vehicles to indicate the analysis position of collaborators. By selecting such ghost via direct touch or raycast, the analysis replay is set to the selected ghost’s position in time and space. Besides, (3) analysts can communicate via virtual labels and comments. For example, in asynchronous scenarios, analysts on the desktop could leave comments in the 3D environment for analysts in VR to observe at a different time and vice versa.
4.5.2. Single-User Scenario
In single-user scenarios, one analyst uses a combination of VR and desktop. For example, an analyst could use the desktop view for pre- and post-analysis and the VR view as the main tool in between. However, when desktop or VR devices are unavailable, analysts can only use one view.
The interaction concept for labels and comments also applies to single-user scenarios. However, instead of labeling or commenting for others, analysts create self-notes for another session or mark interesting aspects in the desktop view before transitioning to VR.
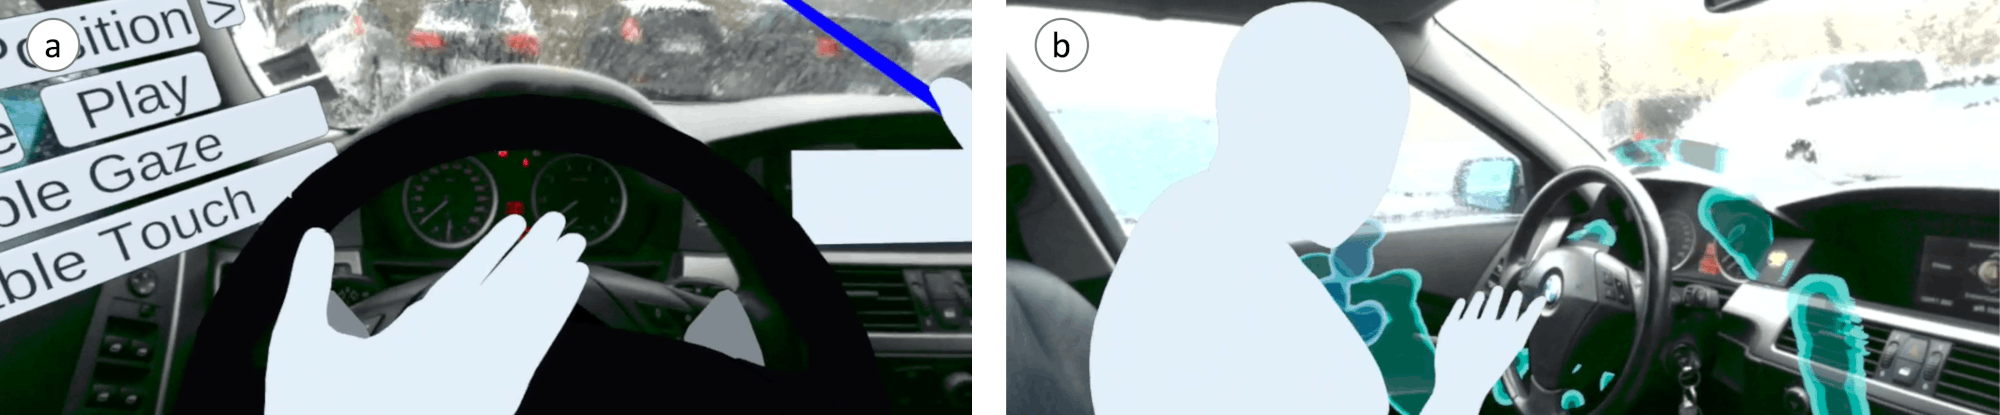
The figure depicts a real vehicle in the analysis process via passthrough VR. On the left selective passthrough can be seen, for example at the steering wheel or center console. On the right, the overlay of the virtual 3d in-vehicle visualizations can be seen.
5. AutoVis: Prototype Implementation
The prototype of AutoVis consists of three sub-prototypes demonstrating the companion (see 4.1), the desktop view (see 4.2), and the VR view (see 4.3) including the passthrough VR view (see 4.4).
In our processing pipeline (see 4.1), a (1) companion preprocesses the data and creates a JSON config file. The Python-based companion (see 4.1.2) uses state-of-the-art DL to automatically infer events from datasets and merges the results into the JSON config file. We employed DeepFace (Sefik Ilkin Serengil, 2022) for emotion recognition, OpenPose (Hidalgo et al., 2022) for posture/movement recognition, and YOLOv4 (Tianxiaomo, 2022) for object detection. Moreover, to infer passenger states, we use Driver-State-Detection (e-candeloro, 2022), Drowsiness Detection (akshaybahadur21, 2022), and Stress Detector (CodeChefVIT, 2022).
A Unity-based (2) desktop application generates the 3D analysis environment from spatio-temporal data of the ego vehicle, other road users, and the environment (e.g., weather) given in the JSON config file. To reconstruct the 3D driving environment, we use Cesium (Cesium, 2022), which provides high-resolution real-world photogrammetry in Unity version 2020.3.33f. Also, the desktop application visualizes physiological, event, and metadata returned by the companion. For this, we built a web UI using HTML, JavaScript, D3.js (Bostock et al., 2011) to visualize detailed graphs, and gridstack.js (Dumesny et al., 2022) for panel rearrangement. We embedded the web UI into Unity using 3D WebView (Vuplex, 2022). The desktop application can modify the JSON config file and vice versa (e.g., when pausing the replay or selecting objects).
Using the same JSON config file, a Unity-based (3) VR application generates the analysis environment for the VR and the passthrough VR view. In our prototype, the target platform is the Vive HMD. However, for the passthrough VR view, we employ the Meta Quest Pro, which provides color passthrough video, gesture, and eye-tracking. Moreover, the Quest Pro is a mobile VR HMD suitable for use in a real vehicle without access to a desktop system hosting the VR application.
To enable multi-user scenarios (same- or mixed-immersion), we employ Mirror (vis2k, 2022) as a networking library in Unity for live synchronization of object and analyst movements, replay state, 3D labels, comments, and active visualizations.
A supplementary video figure illustrates the prototype and the use cases described below.
6. Analysis Workflow With Practical Use Cases
We evaluate AutoVis by combining different validation approaches in several AUI analysis use cases. Our prototype serves as a technical validation that typical AUI study data can be visualized using desktop and current VR devices. Furthermore, similar to the cognitive walkthrough of Reipschlager et al. (2020) and (Meskens et al., 2008; Houben and Marquardt, 2015), we report on AutoVis walkthroughs regarding Olsen (2007)’s heuristics H: Importance, Unsolved Problem, Generality, Reducing Problem Viscosity, Empowering Novices, Power in Combination, and Scalability. Demonstration and heuristic walkthrough are common toolkit evaluation approaches (Ledo et al., 2018). We have chosen our use cases to show the diverse aspects of AutoVis in the visual exploration of data, the interplay between desktop and VR, the dataset (pre)processing, and the usage of a real vehicle in the analysis. Similar to Hubenschmid et al. (2022), we defined three research goals (G1-G3) to guide our evaluation:
-
G1
Interplay of Immersive and Non-Immersive Analysis: How do they complement each other in AUI research?
-
G2
Applicability: Does AutoVis meet the requirements of AUI researchers?
-
G3
Task Allocation: Which analysis tasks in AUI research benefit from which analysis approach (immersive or non-immersive)?
6.1. Use Case: Multimodal Interactions in AVs
We demonstrate the applicability of AutoVis on the use case of multimodal interactions in AVs (T5). Evaluating novel input and output modalities (e.g., electrodermal or brain interfaces) and modality combinations in different contexts is challenging. Thus, analysis of multimodal interactions could significantly benefit from the domain-unique visual exploration of spatio-temporal data provided by AutoVis. However, to the best of our knowledge, there is no publicly available dataset suitable for such analysis. Therefore, we recorded authentic data in an exemplary use case study (see details in Appendix C) that allowed multiple input modalities in different contexts during a ride in an AV (SAE 4).
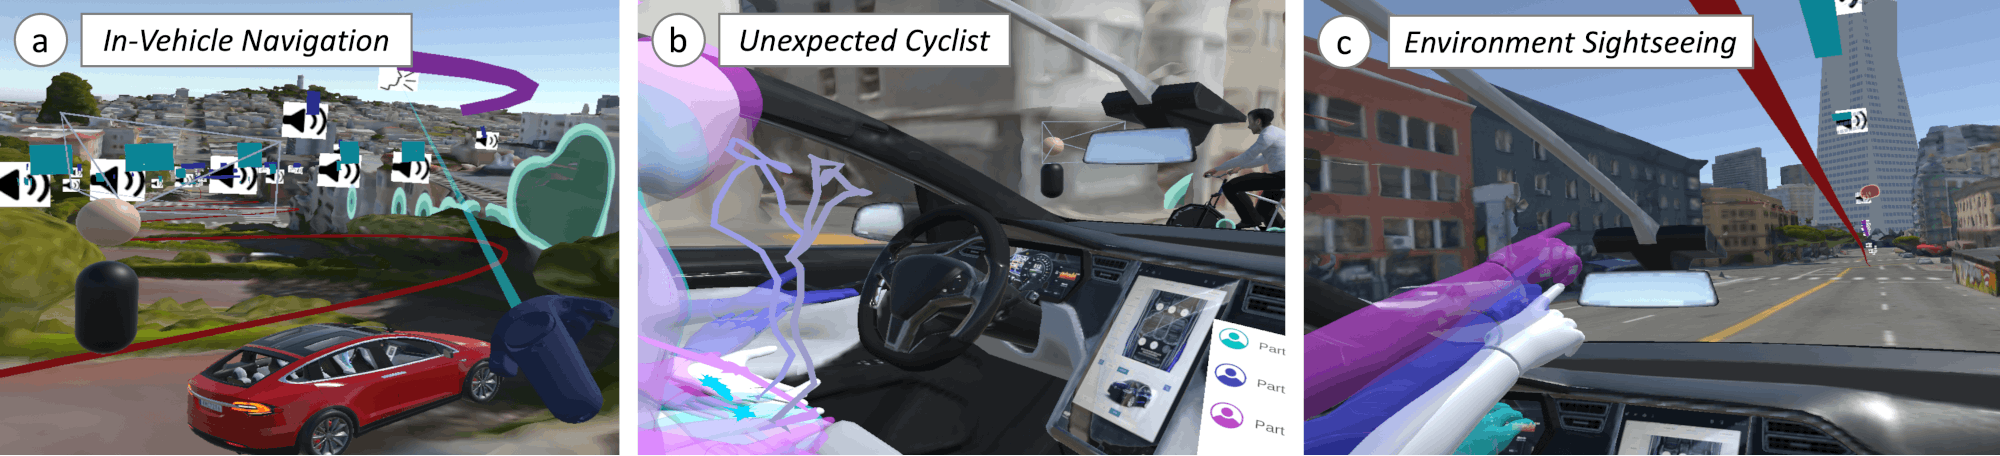
This figure is split into three sub-figures showcasing events that occurred during the example study. The first shows the in-vehicle navigation task’s analysis in a 3D scene at a virtual Lombard Street in San Francisco. The second shows the unexpected cyclist crossing in which a cyclist crosses the street from right to left. Multiple avatars and heatmaps are visible in the area of the driver’s seat. The third image shows an environment sightseeing event. On the driver’s seat are multiple avatars, each visualizing a pointing gesture toward the sightseeing target, the Transamerica Pyramid in San Francisco. A heatmap is visible on the building
We imagine an AUI researcher, Anna. She wants to investigate the input modality usage order, the time difference between modality usage, what modalities were used for which tasks, and in which environmental contexts. Her research has a crucial effect on the passengers of future (automated) vehicles, as the insights could make multimodal interactions more usable and safe (H: Importance). Anna decided to use AutoVis as there is currently no other immersive analytics solution enabling her to perform these tasks (H: Unsolved Problem). Before using AutoVis, she preprocesses the data using the companion (see 4.1.2).
Anna starts her analysis by looking at the 3D scene view in the desktop application. This enables her to see a replicated view of the data, providing a much closer match to the original study setting than analyzing the video recording (H: Reducing Problem Viscosity). She particularly focuses on a detected pointing interaction in the passengers’ environment task, which she retrieved from selecting the event on the timeline. The gaze/pointing heatmaps and the avatar visualization help her understand the situation. However, Anna is not familiar with San Francisco and has difficulties locating the referenced landmark. Therefore, she selects the pointing event in the spatio-temporal event line to display a direct context portal. Anna immediately locates the landmark through the portal without moving close to it. In the portal, she notices that some participants gazed directly at the landmark and pointed close to the gaze hit (see Figure 8 c). However, others pointed in the mere direction with bent elbows. Moreover, Anna sees that all participants first gazed at the target, then pointed, and finally asked about the target via speech. The action event annotations on the timeline show her that the time difference between the interactions was 0.5 seconds on average. This combination of timeline with 3D scene panel supports Anna in drawing her conclusions (H: Power in Combination).
Next, Anna wants to explore how participants reacted to the unexpected cyclist crossing. However, she could not find anomalies compared to the average line when she looked at the physiological signals in the 2D panel for this scenario. Anna concluded that there was no measurable physiological reaction, likely indicating that participants felt safe and trusted the AV. The automatic detection of events, such as emotions, helped her select interesting sequences in the physiological streams, as she is unfamiliar with physiology (H: Empowering Novices). However, Anna assumes that she might have missed something and contacts Jacob, who is an expert in physiology. Jacob answers her call and loads the shared persistent JSON config file into his AutoVis desktop application, and takes a closer look at the unexpected cyclist sequence. This transforms Anna’s analysis into a distributed, asynchronous multi-user scenario. Jacob suspects correlations by comparing the line diagrams of the heart rate and the electrodermal activity and creates 3D labels at the relevant spots. When Anna resumes the analysis a few days later, Jacob’s labels point her to the right spots.
Using a VR HMD, Anna immerses herself in the VR view to gain a deeper understanding of the link between in-vehicle and environmental context. For this, she searches a suitable camera perspective by clicking through the predefined positions and selects the passenger seat POV. Looking at the avatars, she discovers that some participants raised their hands in surprise while focusing on the cyclist (see Figure 8 b). In addition, they referred to the cyclist in a short conversation with the other passenger. Anna concludes that AVs must be aware of the intended interaction partner in multimodal interactions (e.g., speech and gaze), especially in social settings, to prevent misunderstandings.
The participants could freely choose modalities to query information in the in-vehicle navigation task. Looking at the timeline, Anna noticed that all participants used speech to query their location. Besides, Anna sees that the in-vehicle touch and gaze heatmaps show a widespread pattern (see Figure 8 a). She concludes that participants likely were curious about the unfamiliar setting and explored the interior by looking around and touching it.
Overall, Anna successfully retrieved valuable insights on passenger behavior in multimodal interactions regarding interaction speed, sequence, and context. However, AutoVis also applies to other topics and use cases in which practitioners, such as Anna, are interested (H: Generality). For example, in the context of T3, Anna could also gain a lot of information on the passenger state using the physiological streams overview. Besides, she is interested in conversational analysis (T6) and could use AutoVis to explore the conversation between participants, vehicle, and other passengers. Moreover, Anna could evaluate other novel modalities (T1, T2).
On the left, the virtual recreation of a woman sitting in the driver’s seat of a car can be seen. She is reading a newspaper. On the right, touch heatmaps can be seen overlayed on a real vehicle using passthrough VR.
6.2. Use Case: Analyzing a Real-World Dataset
We leverage Drive&Act (Martin et al., 2019) to demonstrate that AutoVis can convert and visualize real-world datasets. Analysts can also employ similar datasets (e.g., (Jegham et al., 2019)). However, datasets might be incomplete regarding events, 3D poses, or environment recordings. For example, we decided against using HARMONY (Tavakoli et al., 2021), as (in February 2023) only a ten seconds sample is publicly available.
Drive&Act is a large-scale dataset for driver activity recognition captured in manual and autonomous driving mode (T3 - T5). It contains data streams of 3D body poses, head poses, interior model, and a camera system with five interior views. Besides, the dataset differentiates mid-level (e.g., reading the newspaper), action, object, and location activities. Drive&Act does not include driving environment data, such as scans or video recordings of the surrounding. Regardless, AutoVis can reconstruct a 3D driving environment for Drive&Act based only on GPS coordinates (H: Generality). Consequently, this environment lacks 3D heatmaps of gestures, pointing, and other vehicles, as well as context portal visualizations.
Accordingly, AUI researchers Jack and Mia focus their analysis on the vehicle interior. They want to determine whether passengers’ body pose while reading in AVs is similar to non-driving scenarios. Since Jack and Mia each have a Vive VR HMD (same-immersion), they decide to collaboratively analyze Drive&Act in the same room (co-located synchronous) for directly discussing their findings (H: Scalability). Since Drive&Act contains 3D poses and activity events, Jack and Mia only activate the DeepFace (Sefik Ilkin Serengil, 2022) option for emotion recognition in the AutoVis companion.
In their analysis, Jack and Mia search for a suitable passenger reading event. As Mia perceives the event search in the virtual tablet as tedious, she investigates the spatio-temporal event line while driving in the virtual ego vehicle. When Mia finds a ”Newspaper Reading Task” (H: Power in Combination), she tells Jack the time frame. Jack then jumps there, by selecting the event. While Mia chooses the passenger seat POV, Jack selects the vehicle’s hood POV to have a frontal view on the individual avatars in the driver’s seat (see Figure 9 a). After looping the event in VR several times, they notice differing head poses. While some passengers focused on the reading task and permanently looked down, others looked up more often. They conclude that these participants frequently checked the driving situation, which might indicate low trust in the AV. As environment objects were not replicated due to a lack of data, they can make little connection between the driving environment and passenger behavior. However, the reconstructed 3D environment based on GPS enables them to determine the respective AV driving situations (e.g., highway vs. urban) that could explain the differing head poses (H: Power in Combination).
6.3. Use Case: Leveraging a Real Vehicle
We demonstrate how AutoVis integrates a real vehicle into an analysis process (R8). For this, we recorded a test dataset in a BMW 525i Touring to analyze a novel UI concept for an air conditioning control specific to the driver’s seat area (T1, T2). The control UI is located on the driver’s door. As part of a collaborative research project, Simon and Emma aim to develop this UI. Emma wants to cross-evaluate the results of a user study conducted in a replica of the real vehicle’s UI. However, only Simon has access to the real vehicle. Therefore, they agree on a distributed synchronous analysis session in AutoVis so that Emma can remotely guide Simon, who performs in the real vehicle (the BMW) using the passthrough VR view. The remote access to the real vehicle (H: Importance and H: Unsolved Problem) enables a more efficient cross-evaluation (H: Reducing Problem Viscosity).
Emma creates a mixed-immersion scenario using the AutoVis desktop application to access the same analysis environment as Simon. She wants to investigate the influences of the vehicle replica’s button layout on the study results. Emma guides Simon through the relevant sequences using her analyst avatar and 3D comments (H: Power in Combination). When Simon is in the right place, she signals him to touch the vehicle’s surface to activate the passthrough VR view (see Figure 9 b). Using the heatmaps and the avatars’ hand movements, they found that the participants rarely touched and looked at the novel UI on the driver’s door. The participants mainly searched for the UI at the center display. In the driver avatar POV, Emma also notes a mismatch between the study button layout and the real vehicle, which may have confused participants. Because Simon can use the real-vehicle’s haptics and thus assess spatial relations in VR more effectively (H: Power in Combination), he further notices a greater distance from the driver to the novel UI than the center display. He concludes that participants had a greater effort and, therefore, they searched the familiar center display first.
7. Discussion
We (1) discuss how AutoVis differentiates from immersive analytics in other domains; (2) elaborate on lessons learned from our demonstration and heuristic evaluation; and (3) describe challenges and insights for future research on immersive analytics for AUIs.
7.1. Differentiation of AutoVis to Prior Immersive Analytics
We adapted visualizations from prior research on immersive analytics for mixed-reality usage (Hubenschmid et al., 2022), human motion analysis (Reipschläger et al., 2022), interactive wall usage (von Zadow and Dachselt, 2017), and multi-display scenarios (Büschel et al., 2021). Similar to AutoVis, they considered multi-user scenarios, various interaction modalities (e.g., touch and gaze), and different analysis devices (VR, AR, and desktop). In line with (Reipschläger et al., 2022), we used avatars associated with body part trajectories to replicate user movements. However, we limited our concept to hand and head trajectories, as other body parts (e.g., feet) are negligible for AUIs. Besides, trajectories for each body part would increase visual clutter. Unlike prior work, we introduced an aggregated avatar enabling overview movement analysis to mitigate the limitation of visual clutter for many avatars. Similar to (von Zadow and Dachselt, 2017; Reipschläger et al., 2022; Büschel et al., 2021), we employed heatmaps to visualize interactions with surfaces. However, we applied the heatmaps as textures to 3D meshes of replicated study environment objects. This allowed us to increase the level of analysis detail compared to prior immersive analytics and effectively utilize the geometry of the replicated ego vehicle. A recurring limitation of prior immersive analytics tools is the high level of detail required for datasets (e.g., see (Reipschläger et al., 2022; Hubenschmid et al., 2022)). Therefore, in our processing pipeline, we proposed a companion to preprocess data with insufficient detail (e.g., only video data) into suitable datasets (i.e., including events, objects, and user states). In contrast to prior immersive analytics (Hubenschmid et al., 2022; Reipschläger et al., 2022; Büschel et al., 2021; von Zadow and Dachselt, 2017; Nebeling et al., 2020), AutoVis includes a real vehicle into immersive analysis processes. We argue that AutoVis can serve as a starting point for future immersive analytics considering similar prerequisites, such as the dynamic environment inside and outside an interaction space (e.g., a vehicle).
7.2. Lessons Learned
Applying Olsen’s heuristics (see 6.1) helped to identify heuristics partially covered by AutoVis. According to our research goals G1, G2, and G3, we discuss lessons learned from the implementation and demonstration of AutoVis.
Task Allocation Between Immersive and Non-Immersive View
In line with (Hubenschmid et al., 2022; Kraus et al., 2020a), our heuristic walkthroughs suggest that the desktop outperforms the VR view for overview tasks, such as understanding the driving environment and in-vehicle events. In contrast, we assume that analysts will use the VR view for detailed passenger movement analysis. However, we found that transitions from desktop to VR (e.g., single-user scenario, see 4.5) may be inappropriate due to analysis goals (e.g., analyzing only physiology) and inconvenience (e.g., HMD heat and pressure points). Therefore, we argue that the desktop view’s 3D scene panel suffices for most in-vehicle and driving analysis without transitioning to VR. Our prototype also showed that such transitions may lead to initial disorientation. In line with Hubenschmid et al. (2022), we learned that the 3D labels/comments should be set in the desktop view first to mitigate disorientation. Besides, the indirect context portals (see 4.3) sparked confusion in the multimodal interaction use case (see 6.1) as the live-queried contents’ locations were unclear. We learned that these portals should clarify the location textually and link sources.
From our use cases, we also learned that the desktop view is interchangeable with the VR view regarding the amount of accessible data. However, the desktop view is more suitable for retrieving outliers in passengers’ physiological data, useful in T3, T4, and T7. In contrast, the VR view is more appropriate for perceiving spatial distances between driving and interaction events, relevant in T5. However, we found that analysts could quickly get motion sick when scrubbing the timeline in VR moved the ego-vehicle too fast. Therefore, we argue that the desktop view should be used to prepare driving sections, which are then analyzed in VR.
Overall, we conclude that novices might have problems orienting themselves and, therefore, use inappropriate views for their tasks. For example, they may spend much time searching for relevant sequences while driving in the VR ego-vehicle in real-time. Accordingly, AutoVis should further contribute to H: Empowering Novices via tutorials and hints of unnecessary VR usage.
Collaborative Analysis
AutoVis enables collaborative analysis using the desktop and VR view (see 4.5), valuable for the ideation of novel in-vehicle UIs (T1). According to Hubenschmid et al. (2022) and the feedback from our expert interviews (see 3.2), analysts would perceive such collaboration as advantageous. However, we learned that the ghost vehicles may significantly occlude the ego vehicle and the 3D visualizations. For example, when collaborators join a session and want to inspect the current analysis state by navigating to the other analysts’ perspectives. The visual occlusion increases with the number of collaborators, limiting large scale synchronous collaborations. Additionally, we found that switching between the ghost vehicles to inspect the collaborators’ analysis states result in context switches, as all comments, labels, and exploded driving-path events would reappear in an altered state, requiring analysts to regain situational awareness after switching back. Therefore, we argue that other analysis objects should remain visible during such switches to preserve the previous analysis context.
Besides, the current AutoVis prototype provides visualizations to foster collaboration only for the 3D scene panel and the VR view. Consequently, we learned that collaborative analysis of physiological data and events in the desktop view is challenging, as collaborators do not see each other’s mouse positions or selected UI elements. Therefore, future research should consider incorporating visual aids in the non-immersive panels of the desktop view to facilitate collaborative analysis.
Real-World Study Complexity & Dataset Size
Although AutoVis applies to several use cases (see 6.1, 6.2, and 6.3) and is designed to generalize to other AUI domains (T1 - T8), H: Scalability is currently limited. In our prototype, 3D visualizations (e.g., avatars) work effectively due to the small dataset size. However, in the AUI domain, (naturalistic) datasets (e.g., required in T3) can become large and complex as they include recordings taken over several hours of driving. In line with Reipschläger et al. (2022), we found that avatars overlap, for example, when they are all located on the same seats. Likewise, heatmaps overlap for environment objects, for example, in traffic jams or pedestrian crowds. Besides, finding relevant data sequences takes longer as using the timeline becomes inefficient. For example, analysts using the desktop view would often zoom to perceive events and line diagrams without overlaps, similar to the editing process for larger videos (see (Gupta et al., 2021)). Therefore, AutoVis must provide adaptive visualizations for real-world datasets with arbitrary size, for example, using large timelines (see (Aigner et al., 2008)) and intelligent filtering of unnecessarily logged road users and in-vehicle events. Future research should also consider partitioned dataset analysis and gradually simplify and merge replications of passengers and other road users without losing relevant information to reduce visual clutter. In addition, topic-specific adaptations might be necessary due to the per-design high generalizability of AutoVis. For example, sophisticated in-vehicle conversational analysis (T6) would require additional audio lines.
Imperfect Data
AutoVis can use datasets that partially meet the data specification (see 4.1.1). However, if data is missing, the current prototype may not display visualizations (e.g., avatars in case of missing skeletal data). In real-world conditions within research topics T1 - T8, datasets can be incomplete. For example, missing video recordings of the vehicle environment (see Drive&Act (Martin et al., 2019) and MDAD (Jegham et al., 2019)). Therefore, AutoVis needs to be further optimized for datasets of lower fidelity, for example, by interpolating missing motion data. Besides, automatic inferences (e.g., for events or emotions) in the preprocessing (see 4.1.2) may misinterpret data due to imperfect DL. As a result, analysts must review all inference results in the current prototype, which prolongs the analysis.
Leveraging a Real Vehicle
Evaluations of in-vehicle UIs (T2) may benefit from using a real vehicle in the analysis. However, such a vehicle should be parked or driven in the original study environment to prevent visualizations from interfering with the real environment. During driving, safe analysis can only be performed in the passenger seat, as analysts cannot simultaneously drive. This limits the analysis (at least until AVs can be used), as analysts cannot enter the driver’s POV while driving. Besides, current passthrough technology (e.g., less than 720p in the Meta Quest Pro) is not yet advanced enough to provide highly detailed real-world information. Thus, future work might use augmented reality instead of passthrough VR for leveraging a real vehicle in the analysis. In this case, the AutoVis concept of selectively adding the real to the virtual environment would also apply.
Beyond the Vehicle Interior
Our use cases and most AUI research (T1 - T7) consider the vehicle environment only as additional information for the analysis. However, AutoVis’s extensive environment replication based on external sensors and automatic object/event recognition can represent interactions outside the vehicle in detail. This enables examining eHMIs (T8) and entering other road users’ POVs.Thus, AutoVis is the first tool providing immersive analysis of human-vehicle interactions (in field studies) without interior or exterior restrictions. However, analyzing UI interactions beyond the interior requires extensive LIDAR or external camera recordings.
AutoVis also reduces recording efforts for eHMI studies (e.g., (Colley et al., 2021a, 2020b)) by not requiring other road users equipped with sensors. However, AutoVis cannot visualize the physiological data of other road users, as such recordings are impractical in naturalistic driving studies. Also, 3D movement and intention visualizations are limited by available DL recognition approaches.
7.3. Limitations & Future Work
We demonstrated the potential of AutoVis, applied heuristics (see 6), and presented three use cases in the AUI domain, addressing T1, T2, T3, and T5. We plan to investigate use cases focusing on the research topics of driver distraction (T4), conversational UIs (T6), takeovers (T7), and eHMIs (T8). Besides, AutoVis could include other forms of mobility, such as urban air mobility (e.g., unmanned air cabs) or micro-mobility (e.g., e-scooters). Although the technical evaluation of AutoVis may not require usability studies (see (Ledo et al., 2018; Olsen, 2007; Hudson and Mankoff, 2014)), an automotive domain expert user study might yield additional insights. Therefore, we will conduct an expert user study to determine how our interaction concepts are used in a real-world analysis, which concepts users prefer, and what flaws or enhancements they identify. Moreover, we want to use AutoVis for analyses of our own AUI research projects to gain valuable insights while reducing analysis efforts. As AutoVis is currently a prototype, we will create new features and 2D/3D visualizations for desktop and VR views in the future. For this, we plan to improve the replication of 3D environments from driving data, see NVIDIA DRIVE Sim333https://developer.nvidia.com/drive/drive-sim; Accessed: 01.02.2023, and employ procedural building generation (see (Salpisti et al., 2022)).
8. Conclusion
We presented AutoVis, a mixed-immersion analysis tool combining an immersive VR with a non-immersive desktop view to enable the exploration of AUI interaction studies. The VR view lets analysts re-experience an interactive recording of the original study. Complementary, the desktop view provides an overview of study data and facilitates aggregated data analysis. Both views are synchronized, bridging immersive and non-immersive analysis, and enabling collaborative analysis in multi-user scenarios. We proposed visualization and tool interaction concepts based on design requirements derived from a literature analysis of AUI research and domain expert interviews. Our concepts leverage the unique spatiality of AUI interactions with the interplay of in-vehicle and environmental contexts. We utilize virtual humanoid avatars, 3D trajectories, and heatmap textures embedded in the vehicle interior and environment to visualize the behaviors of passengers and other road users. In addition, we presented context portals and driving path events as domain-specific visualizations to link in-vehicle and environmental contexts. To enable in situ visualizations, we also enable a real vehicle in the analysis via passthrough VR. AutoVis could thus speed up the analysis process and preserve valuable contextual and environmental cues.
We demonstrated our concept’s applicability to real-world analysis tasks in three use cases: (1) analysis of multimodal interaction in AVs, (2) analyzing a real-world dataset, and (3) leveraging a real vehicle in the analysis by implementing a prototype of AutoVis. By applying heuristic evaluations, we could show that, despite currently being a research prototype, AutoVis can benefit the analysis of AUI interactions. We plan to extend AutoVis and further evaluate our system in an expert user study. Our work contributes to the underexplored field of (immersive) analytics for AUI interactions. Besides, we tackle Grand Challenges of Immersive Analytics (Ens et al., 2021) by accurately placing visualizations in space and supporting transitions between analysis environments. We are confident that AutoVis can inspire novel immersive analytics and significantly benefits analysis of human-vehicle interaction.
Acknowledgements.
We thank the reviewers for their helpful comments. This work was supported by the project ’SEMULIN’ (selbstunterstützende, multimodale Interaktion) funded by the Federal Ministry for Economic Affairs and Energy (BMWi).References
- (1)
- Aftab (2019) Abdul Rafey Aftab. 2019. Multimodal Driver Interaction with Gesture, Gaze and Speech. In 2019 International Conference on Multimodal Interaction (ICMI ’19). Association for Computing Machinery, New York, NY, USA, 487–492. https://doi.org/10.1145/3340555.3356093
- Ahmad et al. (2018) Bashar I. Ahmad, Simon J. Godsill, Patrick M. Langdon, and Lee Skrypchuk. 2018. Predictive Touch: A Novel HMI Technology for Intelligent Displays in Automotive. In You Have a Point There Object Selection Inside an (AutomotiveUI ’18). Association for Computing Machinery, New York, NY, USA, 259–260. https://doi.org/10.1145/3239092.3267103
- Aigner et al. (2008) Wolfgang Aigner, Silvia Miksch, Wolfgang Müller, Heidrun Schumann, and Christian Tominski. 2008. Visual Methods for Analyzing Time-Oriented Data. IEEE Transactions on Visualization and Computer Graphics 14, 1 (2008), 47–60. https://doi.org/10.1109/TVCG.2007.70415
- akshaybahadur21 (2022) akshaybahadur21. 2022. Drowsiness Detection OpenCV. Drowsiness_Detection. {https://github.com/akshaybahadur21/Drowsiness_Detection} (Accessed on 08/23/2022).
- Albadawi et al. (2022) Yaman Albadawi, Maen Takruri, and Mohammed Awad. 2022. A Review of Recent Developments in Driver Drowsiness Detection Systems. Sensors 22, 5 (2022), 41. https://doi.org/10.3390/s22052069
- Ayoub et al. (2019) Jackie Ayoub, Feng Zhou, Shan Bao, and X. Jessie Yang. 2019. From Manual Driving to Automated Driving: A Review of 10 Years of AutoUI. In Proceedings of the 11th International Conference on Automotive User Interfaces and Interactive Vehicular Applications (Utrecht, Netherlands) (AutomotiveUI ’19). Association for Computing Machinery, New York, NY, USA, 70–90. https://doi.org/10.1145/3342197.3344529
- Bazilinskyy et al. (2018) P. Bazilinskyy, S.M. Petermeijer, V. Petrovych, D. Dodou, and J.C.F. de Winter. 2018. Take-over requests in highly automated driving: A crowdsourcing survey on auditory, vibrotactile, and visual displays. Transportation Research Part F: Traffic Psychology and Behaviour 56 (2018), 82–98. https://doi.org/10.1016/j.trf.2018.04.001
- Benedetto et al. (2011) Simone Benedetto, Marco Pedrotti, Luca Minin, Thierry Baccino, Alessandra Re, and Roberto Montanari. 2011. Driver workload and eye blink duration. Transportation Research Part F: Traffic Psychology and Behaviour 14, 3 (2011), 199–208. https://doi.org/10.1016/j.trf.2010.12.001
- Bethge et al. (2021) David Bethge, Thomas Kosch, Tobias Grosse-Puppendahl, Lewis L. Chuang, Mohamed Kari, Alexander Jagaciak, and Albrecht Schmidt. 2021. VEmotion: Using Driving Context for Indirect Emotion Prediction in Real-Time. In The 34th Annual ACM Symposium on User Interface Software and Technology (Virtual Event, USA) (UIST ’21). Association for Computing Machinery, New York, NY, USA, 638–651. https://doi.org/10.1145/3472749.3474775
- Billinghurst et al. (2018) Mark Billinghurst, Maxime Cordeil, Anastasia Bezerianos, and Todd Margolis. 2018. Collaborative immersive analytics. In Immersive Analytics. Springer, Cham, 221–257.
- Blickshift (2022) Blickshift. 2022. Blickshift Analytics. Blickshift GmbH. https://www.blickshift.com/products-services/blickshift-analytics/solutions-sciences-usability/ (Accessed on 08/23/2022).
- Bostock et al. (2011) Michael Bostock, Vadim Ogievetsky, and Jeffrey Heer. 2011. D³ Data-Driven Documents. IEEE Transactions on Visualization and Computer Graphics 17, 12 (2011), 2301–2309. https://doi.org/10.1109/TVCG.2011.185
- Broy et al. (2014) Nora Broy, Florian Alt, Stefan Schneegass, and Bastian Pfleging. 2014. 3D Displays in Cars: Exploring the User Performance for a Stereoscopic Instrument Cluster. In Proceedings of the 6th International Conference on Automotive User Interfaces and Interactive Vehicular Applications (Seattle, WA, USA) (AutomotiveUI ’14). Association for Computing Machinery, New York, NY, USA, 1–9. https://doi.org/10.1145/2667317.2667319
- Brudy et al. (2018) Frederik Brudy, Suppachai Suwanwatcharachat, Wenyu Zhang, Steven Houben, and Nicolai Marquardt. 2018. EagleView: A Video Analysis Tool for Visualising and Querying Spatial Interactions of People and Devices. In Proceedings of the 2018 ACM International Conference on Interactive Surfaces and Spaces (Tokyo, Japan) (ISS ’18). Association for Computing Machinery, New York, NY, USA, 61–72. https://doi.org/10.1145/3279778.3279795
- Brüning et al. (2012) Bernhard Brüning, Christian Schnier, Karola Pitsch, and Sven Wachsmuth. 2012. Integrating PAMOCAT in the Research Cycle: Linking Motion Capturing and Conversation Analysis. In Proceedings of the 14th ACM International Conference on Multimodal Interaction (Santa Monica, California, USA) (ICMI ’12). Association for Computing Machinery, New York, NY, USA, 201–208. https://doi.org/10.1145/2388676.2388716
- Büschel et al. (2021) Wolfgang Büschel, Anke Lehmann, and Raimund Dachselt. 2021. MIRIA: A Mixed Reality Toolkit for the In-Situ Visualization and Analysis of Spatio-Temporal Interaction Data. In Proceedings of the 2021 CHI Conference on Human Factors in Computing Systems (Yokohama, Japan) (CHI ’21). Association for Computing Machinery, New York, NY, USA, Article 470, 15 pages. https://doi.org/10.1145/3411764.3445651
- Büschel et al. (2017) Wolfgang Büschel, Patrick Reipschläger, Ricardo Langner, and Raimund Dachselt. 2017. Investigating the Use of Spatial Interaction for 3D Data Visualization on Mobile Devices. In Proceedings of the 2017 ACM International Conference on Interactive Surfaces and Spaces (Brighton, United Kingdom) (ISS ’17). Association for Computing Machinery, New York, NY, USA, 62–71. https://doi.org/10.1145/3132272.3134125
- Butcher et al. (2021) Peter W. S. Butcher, Nigel W. John, and Panagiotis D. Ritsos. 2021. VRIA: A Web-Based Framework for Creating Immersive Analytics Experiences. IEEE Transactions on Visualization and Computer Graphics 27, 7 (jul 2021), 3213–3225. https://doi.org/10.1109/TVCG.2020.2965109
- Cesium (2022) Cesium. 2022. Cesium for Unity. Cesium GS, Inc. {https://cesium.com/platform/cesium-for-unity/} (Accessed on 08/23/2022).
- Chang et al. (2009) Jackie C. Chang, Annie Lien, Brian Lathrop, and Holger Hees. 2009. Usability Evaluation of a Volkswagen Group In-Vehicle Speech System. In Proceedings of the 1st International Conference on Automotive User Interfaces and Interactive Vehicular Applications (Essen, Germany) (AutomotiveUI ’09). Association for Computing Machinery, New York, NY, USA, 137–144. https://doi.org/10.1145/1620509.1620535
- Chen et al. (2021) Lei Chen, Hai-Ning Liang, Feiyu Lu, Jialin Wang, Wenjun Chen, and Yong Yue. 2021. Effect of Collaboration Mode and Position Arrangement on Immersive Analytics Tasks in Virtual Reality: A Pilot Study. Applied Sciences 11, 21 (2021), 10473.
- Chittaro et al. (2006) Luca Chittaro, Roberto Ranon, and Lucio Ieronutti. 2006. VU-Flow: A Visualization Tool for Analyzing Navigation in Virtual Environments. IEEE Transactions on Visualization and Computer Graphics 12, 6 (nov 2006), 1475–1485. https://doi.org/10.1109/TVCG.2006.109
- CityGen (2022) CityGen. 2022. CityGen3D. CityGen Technologies Ltd. https://www.citygen3d.com/ (Accessed on 08/23/2022).
- CodeChefVIT (2022) CodeChefVIT. 2022. An API to detect stress real-time using facial recognition. Stress Detector. https://github.com/CodeChefVIT/Stress-Detector (Accessed on 08/23/2022).
- Colley et al. (2022a) Mark Colley, Elvedin Bajrovic, and Enrico Rukzio. 2022a. Effects of Pedestrian Behavior, Time Pressure, and Repeated Exposure on Crossing Decisions in Front of Automated Vehicles Equipped with External Communication. In Proceedings of the 2022 CHI Conference on Human Factors in Computing Systems (New Orleans, LA, USA) (CHI ’22). Association for Computing Machinery, New York, NY, USA, Article 367, 11 pages. https://doi.org/10.1145/3491102.3517571
- Colley et al. (2021a) Mark Colley, Jan Henry Belz, and Enrico Rukzio. 2021a. Investigating the Effects of Feedback Communication of Autonomous Vehicles. In 13th International Conference on Automotive User Interfaces and Interactive Vehicular Applications. ACM, Leeds United Kingdom, 263–273. https://doi.org/10.1145/3409118.3475133
- Colley et al. (2020a) Mark Colley, Christian Bräuner, Mirjam Lanzer, Marcel Walch, Martin Baumann, and Enrico Rukzio. 2020a. Effect of Visualization of Pedestrian Intention Recognition on Trust and Cognitive Load. In 12th International Conference on Automotive User Interfaces and Interactive Vehicular Applications (Virtual Event, DC, USA) (AutomotiveUI ’20). Association for Computing Machinery, New York, NY, USA, 181–191. https://doi.org/10.1145/3409120.3410648
- Colley et al. (2021b) Mark Colley, Benjamin Eder, Jan Ole Rixen, and Enrico Rukzio. 2021b. Effects of Semantic Segmentation Visualization on Trust, Situation Awareness, and Cognitive Load in Highly Automated Vehicles. In Proceedings of the 2021 CHI Conference on Human Factors in Computing Systems (Yokohama, Japan) (CHI ’21). Association for Computing Machinery, New York, NY, USA, Article 155, 11 pages. https://doi.org/10.1145/3411764.3445351
- Colley et al. (2022b) Mark Colley, Tim Fabian, and Enrico Rukzio. 2022b. Investigating the Effects of External Communication and Automation Behavior on Manual Drivers at Intersections. Proc. ACM Hum.-Comput. Interact. 6, MHCI, Article 176 (sep 2022), 16 pages. https://doi.org/10.1145/3546711
- Colley et al. (2022c) Mark Colley, Pascal Jansen, Enrico Rukzio, and Jan Gugenheimer. 2022c. SwiVR-Car-Seat: Exploring Vehicle Motion Effects on Interaction Quality in Virtual Reality Automated Driving Using a Motorized Swivel Seat. Proc. ACM Interact. Mob. Wearable Ubiquitous Technol. 5, 4, Article 150 (dec 2022), 26 pages. https://doi.org/10.1145/3494968
- Colley et al. (2021c) Mark Colley, Surong Li, and Enrico Rukzio. 2021c. Increasing Pedestrian Safety Using External Communication of Autonomous Vehicles for Signalling Hazards. In Proceedings of the 23rd International Conference on Mobile Human-Computer Interaction. ACM, Toulouse & Virtual France, 1–10. https://doi.org/10.1145/3447526.3472024
- Colley et al. (2022d) Mark Colley, Max Rädler, Jonas Glimmann, and Enrico Rukzio. 2022d. Effects of Scene Detection, Scene Prediction, and Maneuver Planning Visualizations on Trust, Situation Awareness, and Cognitive Load in Highly Automated Vehicles. Proc. ACM Interact. Mob. Wearable Ubiquitous Technol. 6, 2, Article 49 (jul 2022), 21 pages. https://doi.org/10.1145/3534609
- Colley et al. (2020b) Mark Colley, Marcel Walch, Jan Gugenheimer, Ali Askari, and Enrico Rukzio. 2020b. Towards Inclusive External Communication of Autonomous Vehicles for Pedestrians with Vision Impairments. In Proceedings of the 2020 CHI Conference on Human Factors in Computing Systems. ACM, Honolulu HI USA, 1–14. https://doi.org/10.1145/3313831.3376472
- Colley et al. (2022e) Mark Colley, Bastian Wankmüller, Tim Mend, Thomas Väth, Enrico Rukzio, and Jan Gugenheimer. 2022e. User gesticulation inside an automated vehicle with external communication can cause confusion in pedestrians and a lower willingness to cross. Transportation Research Part F: Traffic Psychology and Behaviour 87 (May 2022), 120–137. https://doi.org/10.1016/j.trf.2022.03.011
- De Clercq et al. (2019) Koen De Clercq, Andre Dietrich, Juan Pablo Núñez Velasco, Joost De Winter, and Riender Happee. 2019. External human-machine interfaces on automated vehicles: effects on pedestrian crossing decisions. Human factors 61, 8 (2019), 1353–1370.
- DeCamp et al. (2010) Philip DeCamp, George Shaw, Rony Kubat, and Deb Roy. 2010. An Immersive System for Browsing and Visualizing Surveillance Video. In Proceedings of the 18th ACM International Conference on Multimedia (Firenze, Italy) (MM ’10). Association for Computing Machinery, New York, NY, USA, 371–380. https://doi.org/10.1145/1873951.1874002
- Detjen et al. (2021a) Henrik Detjen, Sarah Faltaous, Bastian Pfleging, Stefan Geisler, and Stefan Schneegass. 2021a. How to Increase Automated Vehicles’ Acceptance through In-Vehicle Interaction Design: A Review. International Journal of Human–Computer Interaction 37, 4 (Feb. 2021), 308–330. https://doi.org/10.1080/10447318.2020.1860517 Publisher: Taylor & Francis _eprint: https://doi.org/10.1080/10447318.2020.1860517.
- Detjen et al. (2021b) Henrik Detjen, Stefan Geisler, and Stefan Schneegass. 2021b. Driving as Side Task: Exploring Intuitive Input Modalities for Multitasking in Automated Vehicles. In A Simulation Study Examining Smartphone Destinatio. Association for Computing Machinery, New York, NY, USA. https://doi.org/10.1145/3411763.3451803
- Detjen et al. (2020) Henrik Detjen, Bastian Pfleging, and Stefan Schneegass. 2020. A Wizard of Oz Field Study to Understand Non-Driving-Related Activities, Trust, and Acceptance of Automated Vehicles. In 12th International Conference on Automotive User Interfaces and Interactive Vehicular Applications (Virtual Event, DC, USA) (AutomotiveUI ’20). Association for Computing Machinery, New York, NY, USA, 19–29. https://doi.org/10.1145/3409120.3410662
- Dettmann et al. (2021) Andre Dettmann, Franziska Hartwich, Patrick Roßner, Matthias Beggiato, Konstantin Felbel, Josef Krems, and Angelika C. Bullinger. 2021. Comfort or Not? Automated Driving Style and User Characteristics Causing Human Discomfort in Automated Driving. International Journal of Human–Computer Interaction 37, 4 (2021), 331–339. https://doi.org/10.1080/10447318.2020.1860518 arXiv:https://doi.org/10.1080/10447318.2020.1860518
- Dey et al. (2018) Debargha Dey, Marieke Martens, Chao Wang, Felix Ros, and Jacques Terken. 2018. Interface Concepts for Intent Communication from Autonomous Vehicles to Vulnerable Road Users. In Adjunct Proceedings of the 10th International Conference on Automotive User Interfaces and Interactive Vehicular Applications (Toronto, ON, Canada) (AutomotiveUI ’18). Association for Computing Machinery, New York, NY, USA, 82–86. https://doi.org/10.1145/3239092.3265946
- Dey and Terken (2017) Debargha Dey and Jacques Terken. 2017. Pedestrian Interaction with Vehicles: Roles of Explicit and Implicit Communication. In Proceedings of the 9th International Conference on Automotive User Interfaces and Interactive Vehicular Applications (Oldenburg, Germany) (AutomotiveUI ’17). Association for Computing Machinery, New York, NY, USA, 109–113. https://doi.org/10.1145/3122986.3123009
- Dillen et al. (2020) Nicole Dillen, Marko Ilievski, Edith Law, Lennart E. Nacke, Krzysztof Czarnecki, and Oliver Schneider. 2020. Keep Calm and Ride Along: Passenger Comfort and Anxiety as Physiological Responses to Autonomous Driving Styles. In Proceedings of the 2020 CHI Conference on Human Factors in Computing Systems (Honolulu, HI, USA) (CHI ’20). Association for Computing Machinery, New York, NY, USA, 1–13. https://doi.org/10.1145/3313831.3376247
- Dmitrenko et al. (2020) Dmitrijs Dmitrenko, Emanuela Maggioni, Giada Brianza, Brittany E. Holthausen, Bruce N. Walker, and Marianna Obrist. 2020. CARoma Therapy: Pleasant Scents Promote Safer Driving, Better Mood, and Improved Well-Being in Angry Drivers. In Proceedings of the 2020 CHI Conference on Human Factors in Computing Systems (Honolulu, HI, USA) (CHI ’20). Association for Computing Machinery, New York, NY, USA, 1–13. https://doi.org/10.1145/3313831.3376176
- Dovetail (2022) Dovetail. 2022. Markup. Dovetail Research Pty. Ltd. https://dovetailapp.com/products/markup (Accessed on 08/23/2022).
- Dumesny et al. (2022) Alain Dumesny, Dylan Weiss, and Pavel Reznikov. 2022. gridstack.js - Build interactive dashboards in minutes. gridstack.js. https://gridstackjs.com/ (Accessed on 08/23/2022).
- e-candeloro (2022) e-candeloro. 2022. Real Time Driver State Detection. Driver-State-Detection. https://github.com/e-candeloro/Driver-State-Detection (Accessed on 08/23/2022).
- Ebel et al. (2021) Patrick Ebel, Christoph Lingenfelder, and Andreas Vogelsang. 2021. Visualizing Event Sequence Data for User Behavior Evaluation of In-Vehicle Information Systems. In 13th International Conference on Automotive User Interfaces and Interactive Vehicular Applications (Leeds, United Kingdom) (AutomotiveUI ’21). Association for Computing Machinery, New York, NY, USA, 219–229. https://doi.org/10.1145/3409118.3475140
- Eisma et al. (2020) Y. B. Eisma, S. van Bergen, S. M. ter Brake, M. T. T. Hensen, W. J. Tempelaar, and J. C. F. de Winter. 2020. External Human–Machine Interfaces: The Effect of Display Location on Crossing Intentions and Eye Movements. Information 11, 1 (2020), 18. https://doi.org/10.3390/info11010013
- Empatica (2022) Empatica. 2022. E4 Wristband. Empatica Inc. https://www.empatica.com/research/e4/ (Accessed on 08/23/2022).
- Ens et al. (2021) Barrett Ens, Benjamin Bach, Maxime Cordeil, Ulrich Engelke, Marcos Serrano, Wesley Willett, Arnaud Prouzeau, Christoph Anthes, Wolfgang Büschel, Cody Dunne, Tim Dwyer, Jens Grubert, Jason H. Haga, Nurit Kirshenbaum, Dylan Kobayashi, Tica Lin, Monsurat Olaosebikan, Fabian Pointecker, David Saffo, Nazmus Saquib, Dieter Schmalstieg, Danielle Albers Szafir, Matt Whitlock, and Yalong Yang. 2021. Grand Challenges in Immersive Analytics. In Proceedings of the 2021 CHI Conference on Human Factors in Computing Systems (Yokohama, Japan) (CHI ’21). Association for Computing Machinery, New York, NY, USA, Article 459, 17 pages. https://doi.org/10.1145/3411764.3446866
- Filho et al. (2020) Jorge A. Wagner Filho, Wolfgang Stuerzlinger, and Luciana Nedel. 2020. Evaluating an Immersive Space-Time Cube Geovisualization for Intuitive Trajectory Data Exploration. IEEE Transactions on Visualization and Computer Graphics 26, 1 (2020), 514–524. https://doi.org/10.1109/TVCG.2019.2934415
- Fouché et al. (2022) Gwendal Fouché, Ferran Argelaguet Sanz, Emmanuel Faure, and Charles Kervrann. 2022. Timeline Design Space for Immersive Exploration of Time-Varying Spatial 3D Data. In Proceedings of the 28th ACM Symposium on Virtual Reality Software and Technology (Tsukuba, Japan) (VRST ’22). Association for Computing Machinery, New York, NY, USA, Article 21, 11 pages. https://doi.org/10.1145/3562939.3565612
- Foundation (2022) R Foundation. 2022. R: The R Project for Statistical Computing. The R Foundation. https://www.tibco.com/products/tibco-spotfire (Accessed on 08/23/2022).
- Funk et al. (2020) Markus Funk, Vanessa Tobisch, and Adam Emfield. 2020. Non-Verbal Auditory Input for Controlling Binary, Discrete, and Continuous Input in Automotive User Interfaces. In Proceedings of the 2020 CHI Conference on Human Factors in Computing Systems (Honolulu, HI, USA) (CHI ’20). Association for Computing Machinery, New York, NY, USA, 1–13. https://doi.org/10.1145/3313831.3376816
- Goedicke et al. (2018) David Goedicke, Jamy Li, Vanessa Evers, and Wendy Ju. 2018. VR-OOM: Virtual Reality On-ROad Driving SiMulation. In Proceedings of the 2018 CHI Conference on Human Factors in Computing Systems (Montreal QC, Canada) (CHI ’18). Association for Computing Machinery, New York, NY, USA, 1–11. https://doi.org/10.1145/3173574.3173739
- Gomaa et al. (2020) Amr Gomaa, Guillermo Reyes, Alexandra Alles, Lydia Rupp, and Michael Feld. 2020. Studying Person-Specific Pointing and Gaze Behavior for Multimodal Referencing of Outside Objects from a Moving Vehicle. In Proceedings of the 2020 International Conference on Multimodal Interaction (Virtual Event, Netherlands) (ICMI ’20). Association for Computing Machinery, New York, NY, USA, 501–509. https://doi.org/10.1145/3382507.3418817
- Guo et al. (2021) Yuxi Guo, Qinyu Sun, Yanqi Su, Yingshi Guo, and Chang Wang. 2021. Can driving condition prompt systems improve passenger comfort of intelligent vehicles? A driving simulator study. Transportation Research Part F: Traffic Psychology and Behaviour 81 (2021), 240–250. https://doi.org/10.1016/j.trf.2021.06.007
- Gupta et al. (2021) Anchit Gupta, Faizan Farooq Khan, Rudrabha Mukhopadhyay, Vinay P. Namboodiri, and C. V. Jawahar. 2021. Intelligent Video Editing: Incorporating Modern Talking Face Generation Algorithms in a Video Editor. In Proceedings of the Twelfth Indian Conference on Computer Vision, Graphics and Image Processing (Jodhpur, India) (ICVGIP ’21). Association for Computing Machinery, New York, NY, USA, Article 25, 9 pages. https://doi.org/10.1145/3490035.3490284
- Haimerl et al. (2022) Mathias Haimerl, Mark Colley, and Andreas Riener. 2022. Evaluation of Common External Communication Concepts of Automated Vehicles for People With Intellectual Disabilities. In Proc. ACM Hum.-Comput. Interact. (MobileHCI ’22). Association for Computing Machinery, New York, NY, USA, 13 pages. https://doi.org/10.1145/3546717
- Hecht et al. (2020) Tobias Hecht, Anna Feldhütter, Kathrin Draeger, and Klaus Bengler. 2020. What Do You Do? An Analysis of Non-driving Related Activities During a 60 Minutes Conditionally Automated Highway Drive. In Human Interaction and Emerging Technologies, Tareq Ahram, Redha Taiar, Serge Colson, and Arnaud Choplin (Eds.). Springer International Publishing, Cham, 28–34.
- Hernandez et al. (2014) Javier Hernandez, Daniel McDuff, Xavier Benavides, Judith Amores, Pattie Maes, and Rosalind Picard. 2014. AutoEmotive: Bringing Empathy to the Driving Experience to Manage Stress. In Proceedings of the 2014 Companion Publication on Designing Interactive Systems (Vancouver, BC, Canada) (DIS Companion ’14). Association for Computing Machinery, New York, NY, USA, 53–56. https://doi.org/10.1145/2598784.2602780
- Hidalgo et al. (2022) Ginés Hidalgo, Zhe Cao, Tomas Simon, Shih-En Wei, Yaadhav Raaj, Hanbyul Joo, and Yaser Sheikh. 2022. OpenPose. CMU-Perceptual-Computing-Lab. https://github.com/CMU-Perceptual-Computing-Lab/openpose (Accessed on 08/23/2022).
- Hock et al. (2022) Philipp Hock, Mark Colley, Ali Askari, Tobias Wagner, Martin Baumann, and Enrico Rukzio. 2022. Introducing VAMPIRE – Using Kinaesthetic Feedback in Virtual Reality for Automated Driving Experiments. In Proceedings of the 14th International Conference on Automotive User Interfaces and Interactive Vehicular Applications (Seoul, Republic of Korea) (AutomotiveUI ’22). Association for Computing Machinery, New York, NY, USA, 204–214. https://doi.org/10.1145/3543174.3545252
- Holländer et al. (2021) Kai Holländer, Mark Colley, Enrico Rukzio, and Andreas Butz. 2021. A Taxonomy of Vulnerable Road Users for HCI Based On A Systematic Literature Review. In Proceedings of the 2021 CHI Conference on Human Factors in Computing Systems (Yokohama, Japan) (CHI ’21). Association for Computing Machinery, New York, NY, USA, Article 158, 13 pages. https://doi.org/10.1145/3411764.3445480
- Houben and Marquardt (2015) Steven Houben and Nicolai Marquardt. 2015. WatchConnect: A Toolkit for Prototyping Smartwatch-Centric Cross-Device Applications. In Proceedings of the 33rd Annual ACM Conference on Human Factors in Computing Systems (Seoul, Republic of Korea) (CHI ’15). Association for Computing Machinery, New York, NY, USA, 1247–1256. https://doi.org/10.1145/2702123.2702215
- Hubenschmid et al. (2022) Sebastian Hubenschmid, Jonathan Wieland, Daniel Immanuel Fink, Andrea Batch, Johannes Zagermann, Niklas Elmqvist, and Harald Reiterer. 2022. ReLive: Bridging In-Situ and Ex-Situ Visual Analytics for Analyzing Mixed Reality User Studies. In Proceedings of the 2022 CHI Conference on Human Factors in Computing Systems (New Orleans, LA, USA) (CHI ’22). Association for Computing Machinery, New York, NY, USA, Article 24, 20 pages. https://doi.org/10.1145/3491102.3517550
- Hubenschmid et al. (2021) Sebastian Hubenschmid, Johannes Zagermann, Simon Butscher, and Harald Reiterer. 2021. STREAM: Exploring the Combination of Spatially-Aware Tablets with Augmented Reality Head-Mounted Displays for Immersive Analytics. In Proceedings of the 2021 CHI Conference on Human Factors in Computing Systems (Yokohama, Japan) (CHI ’21). Association for Computing Machinery, New York, NY, USA, Article 469, 14 pages. https://doi.org/10.1145/3411764.3445298
- Hudson and Mankoff (2014) Scott E. Hudson and Jennifer Mankoff. 2014. Concepts, Values, and Methods for Technical Human–Computer Interaction Research. Springer New York, New York, NY, 69–93. https://doi.org/10.1007/978-1-4939-0378-8_4
- Isenberg et al. (2011) Petra Isenberg, Niklas Elmqvist, Jean Scholtz, Daniel Cernea, Kwan-Liu Ma, and Hans Hagen. 2011. Collaborative visualization: Definition, challenges, and research agenda. Information Visualization 10, 4 (2011), 310–326.
- Jakobsen and HornbÆk (2014) Mikkel R. Jakobsen and Kasper HornbÆk. 2014. Up Close and Personal: Collaborative Work on a High-Resolution Multitouch Wall Display. ACM Trans. Comput.-Hum. Interact. 21, 2, Article 11 (feb 2014), 34 pages. https://doi.org/10.1145/2576099
- Jansen et al. (2022) Pascal Jansen, Mark Colley, and Enrico Rukzio. 2022. A Design Space for Human Sensor and Actuator Focused In-Vehicle Interaction Based on a Systematic Literature Review. Proc. ACM Interact. Mob. Wearable Ubiquitous Technol. 6, 2, Article 56 (jul 2022), 51 pages. https://doi.org/10.1145/3534617
- Jegham et al. (2019) Imen Jegham, Anouar Ben Khalifa, Ihsen Alouani, and Mohamed Ali Mahjoub. 2019. MDAD: A Multimodal and Multiview in-Vehicle Driver Action Dataset. In Computer Analysis of Images and Patterns, Mario Vento and Gennaro Percannella (Eds.). Springer International Publishing, Cham, 518–529.
- Kennedy et al. (1993) Robert S. Kennedy, Norman E. Lane, Kevin S. Berbaum, and Michael G. Lilienthal. 1993. Simulator Sickness Questionnaire: An Enhanced Method for Quantifying Simulator Sickness. The International Journal of Aviation Psychology 3, 3 (1993), 203–220. https://doi.org/10.1207/s15327108ijap0303_3
- Kim et al. (2019) Auk Kim, Woohyeok Choi, Jungmi Park, Kyeyoon Kim, and Uichin Lee. 2019. Predicting Opportune Moments for In-Vehicle Proactive Speech Services. In Adjunct Proceedings of the 2019 ACM International Joint Conference on Pervasive and Ubiquitous Computing and Proceedings of the 2019 ACM International Symposium on Wearable Computers (London, United Kingdom) (UbiComp/ISWC ’19 Adjunct). Association for Computing Machinery, New York, NY, USA, 101–104. https://doi.org/10.1145/3341162.3343841
- Kim et al. (2020a) Eunyeong Kim, Mohammad Fard, and Kazuhito Kato. 2020a. A seated human model for predicting the coupled human-seat transmissibility exposed to fore-aft whole-body vibration. Applied Ergonomics 84 (April 2020), 102929. https://doi.org/10.1016/j.apergo.2019.102929
- Kim et al. (2018) Kyongho Kim, HyunKyun Choi, and Byungtae Jang. 2018. Design of the Driver-Adaptive Vehicle Interaction System. In 2018 International Conference on Information and Communication Technology Convergence (ICTC). IEEE, 3 Park Ave, New York City, 297–299. https://doi.org/10.1109/ICTC.2018.8539526
- Kim et al. (2020b) Myeongseop Kim, Eunjin Seong, Younkyung Jwa, Jieun Lee, and Seungjun Kim. 2020b. A Cascaded Multimodal Natural User Interface to Reduce Driver Distraction. IEEE Access 8 (2020), 112969–112984. https://doi.org/10.1109/ACCESS.2020.3002775
- Kloiber et al. (2020) Simon Kloiber, Volker Settgast, Christoph Schinko, Martin Weinzerl, Johannes Fritz, Tobias Schreck, and Reinhold Preiner. 2020. Immersive analysis of user motion in VR applications. The Visual Computer 36, 10 (2020), 1937–1949.
- Kraus et al. (2020a) Matthias Kraus, Katrin Angerbauer, Juri Buchmüller, Daniel Schweitzer, Daniel A. Keim, Michael Sedlmair, and Johannes Fuchs. 2020a. Assessing 2D and 3D Heatmaps for Comparative Analysis: An Empirical Study. In Proceedings of the 2020 CHI Conference on Human Factors in Computing Systems (Honolulu, HI, USA) (CHI ’20). Association for Computing Machinery, New York, NY, USA, 1–14. https://doi.org/10.1145/3313831.3376675
- Kraus et al. (2020b) M. Kraus, N. Weiler, D. Oelke, J. Kehrer, D. A. Keim, and J. Fuchs. 2020b. The Impact of Immersion on Cluster Identification Tasks. IEEE Transactions on Visualization and Computer Graphics 26, 1 (2020), 525–535. https://doi.org/10.1109/TVCG.2019.2934395
- Kun et al. (2009) Andrew L. Kun, Tim Paek, Željko Medenica, Nemanja Memarović, and Oskar Palinko. 2009. Glancing at Personal Navigation Devices Can Affect Driving: Experimental Results and Design Implications. In Proceedings of the 1st International Conference on Automotive User Interfaces and Interactive Vehicular Applications (Essen, Germany) (AutomotiveUI ’09). Association for Computing Machinery, New York, NY, USA, 129–136. https://doi.org/10.1145/1620509.1620534
- Kundinger et al. (2021) Thomas Kundinger, Andreas Riener, and Ramyashree Bhat. 2021. Performance and Acceptance Evaluation of a Driver Drowsiness Detection System Based on Smart Wearables. In 13th International Conference on Automotive User Interfaces and Interactive Vehicular Applications (Leeds, United Kingdom) (AutomotiveUI ’21). Association for Computing Machinery, New York, NY, USA, 49–58. https://doi.org/10.1145/3409118.3475141
- Langner et al. (2021) Ricardo Langner, Marc Satkowski, Wolfgang Büschel, and Raimund Dachselt. 2021. MARVIS: Combining Mobile Devices and Augmented Reality for Visual Data Analysis. In Proceedings of the 2021 CHI Conference on Human Factors in Computing Systems (Yokohama, Japan) (CHI ’21). Association for Computing Machinery, New York, NY, USA, Article 468, 17 pages. https://doi.org/10.1145/3411764.3445593
- Ledo et al. (2018) David Ledo, Steven Houben, Jo Vermeulen, Nicolai Marquardt, Lora Oehlberg, and Saul Greenberg. 2018. Evaluation Strategies for HCI Toolkit Research. In Proceedings of the 2018 CHI Conference on Human Factors in Computing Systems (Montreal QC, Canada) (CHI ’18). Association for Computing Machinery, New York, NY, USA, 1–17. https://doi.org/10.1145/3173574.3173610
- Lee et al. (2021) Benjamin Lee, Dave Brown, Bongshin Lee, Christophe Hurter, Steven Drucker, and Tim Dwyer. 2021. Data Visceralization: Enabling Deeper Understanding of Data Using Virtual Reality. IEEE Transactions on Visualization and Computer Graphics 27, 2 (2021), 1095–1105. https://doi.org/10.1109/TVCG.2020.3030435
- Lee et al. (2019) Yee Mun Lee, Ruth Madigan, Jorge Garcia, Andrew Tomlinson, Albert Solernou, Richard Romano, Gustav Markkula, Natasha Merat, and Jim Uttley. 2019. Understanding the Messages Conveyed by Automated Vehicles. In Proceedings of the 11th International Conference on Automotive User Interfaces and Interactive Vehicular Applications (Utrecht, Netherlands) (AutomotiveUI ’19). Association for Computing Machinery, New York, NY, USA, 134–143. https://doi.org/10.1145/3342197.3344546
- Lilija et al. (2020) Klemen Lilija, Henning Pohl, and Kasper Hornbæk. 2020. Who Put That There? Temporal Navigation of Spatial Recordings by Direct Manipulation. In Proceedings of the 2020 CHI Conference on Human Factors in Computing Systems (Honolulu, HI, USA) (CHI ’20). Association for Computing Machinery, New York, NY, USA, 1–11. https://doi.org/10.1145/3313831.3376604
- Lin et al. (2018) Shih-Chieh Lin, Chang-Hong Hsu, Walter Talamonti, Yunqi Zhang, Steve Oney, Jason Mars, and Lingjia Tang. 2018. Adasa: A Conversational In-Vehicle Digital Assistant for Advanced Driver Assistance Features. In Proceedings of the 31st Annual ACM Symposium on User Interface Software and Technology (UIST ’18). Association for Computing Machinery, New York, NY, USA, 531–542. https://doi.org/10.1145/3242587.3242593
- Liu et al. (2021) Shu Liu, Kevin Koch, Zimu Zhou, Simon Föll, Xiaoxi He, Tina Menke, Elgar Fleisch, and Felix Wortmann. 2021. The Empathetic Car: Exploring Emotion Inference via Driver Behaviour and Traffic Context. Proc. ACM Interact. Mob. Wearable Ubiquitous Technol. 5, 3, Article 117 (sep 2021), 34 pages. https://doi.org/10.1145/3478078
- Lohani et al. (2019) Monika Lohani, Brennan R Payne, and David L Strayer. 2019. A review of psychophysiological measures to assess cognitive states in real-world driving. Frontiers in human neuroscience 13 (2019), 57.
- Lv et al. (2018) Chen Lv, Huaji Wang, Dongpu Cao, Yifan Zhao, Mark Sullman, Daniel J. Auger, James Brighton, Rebecca Matthias, Lee Skrypchuk, and Alexandros Mouzakitis. 2018. A Novel Control Framework of Haptic Take-Over System for Automated Vehicles. In 2018 IEEE Intelligent Vehicles Symposium (IV). IEEE, New York, NY, USA, 1596–1601. https://doi.org/10.1109/IVS.2018.8500480
- Madigan et al. (2019) Ruth Madigan, Sina Nordhoff, Charles Fox, Roja Ezzati Amini, Tyron Louw, Marc Wilbrink, Anna Schieben, and Natasha Merat. 2019. Understanding interactions between Automated Road Transport Systems and other road users: A video analysis. Transportation Research Part F: Traffic Psychology and Behaviour 66 (2019), 196–213. https://doi.org/10.1016/j.trf.2019.09.006
- Marquardt et al. (2015) Nicolai Marquardt, Frederico Schardong, and Anthony Tang. 2015. EXCITE: Exploring collaborative interaction in tracked environments. In IFIP Conference on Human-Computer Interaction. Springer, Springer, Cham, 89–97.
- Martin et al. (2019) Manuel Martin, Alina Roitberg, Monica Haurilet, Matthias Horne, Simon Reiß, Michael Voit, and Rainer Stiefelhagen. 2019. Drive&Act: A Multi-Modal Dataset for Fine-Grained Driver Behavior Recognition in Autonomous Vehicles. In 2019 IEEE/CVF International Conference on Computer Vision (ICCV). IEEE, New York, NY, USA, 2801–2810. https://doi.org/10.1109/ICCV.2019.00289
- Meskens et al. (2008) Jan Meskens, Jo Vermeulen, Kris Luyten, and Karin Coninx. 2008. Gummy for Multi-Platform User Interface Designs: Shape Me, Multiply Me, Fix Me, Use Me. In Proceedings of the Working Conference on Advanced Visual Interfaces (Napoli, Italy) (AVI ’08). Association for Computing Machinery, New York, NY, USA, 233–240. https://doi.org/10.1145/1385569.1385607
- Morales-Alvarez et al. (2020) Walter Morales-Alvarez, Oscar Sipele, Régis Léberon, Hadj Hamma Tadjine, and Cristina Olaverri-Monreal. 2020. Automated Driving: A Literature Review of the Take over Request in Conditional Automation. Electronics 9, 12 (2020), 34. https://doi.org/10.3390/electronics9122087
- Nebeling et al. (2020) Michael Nebeling, Maximilian Speicher, Xizi Wang, Shwetha Rajaram, Brian D. Hall, Zijian Xie, Alexander R. E. Raistrick, Michelle Aebersold, Edward G. Happ, Jiayin Wang, Yanan Sun, Lotus Zhang, Leah E. Ramsier, and Rhea Kulkarni. 2020. MRAT: The Mixed Reality Analytics Toolkit. In Proceedings of the 2020 CHI Conference on Human Factors in Computing Systems (Honolulu, HI, USA) (CHI ’20). Association for Computing Machinery, New York, NY, USA, 1–12. https://doi.org/10.1145/3313831.3376330
- Normark (2015) Carl Jörgen Normark. 2015. Design and Evaluation of a Touch-Based Personalizable In-Vehicle User Interface. International Journal of Human–Computer Interaction 31, 11 (2015), 731–745. https://doi.org/10.1080/10447318.2015.1045240 arXiv:https://doi.org/10.1080/10447318.2015.1045240
- Olsen (2007) Dan R. Olsen. 2007. Evaluating User Interface Systems Research. In Proceedings of the 20th Annual ACM Symposium on User Interface Software and Technology (Newport, Rhode Island, USA) (UIST ’07). Association for Computing Machinery, New York, NY, USA, 251–258. https://doi.org/10.1145/1294211.1294256
- Osswald et al. (2012) Sebastian Osswald, Daniela Wurhofer, Sandra Trösterer, Elke Beck, and Manfred Tscheligi. 2012. Predicting Information Technology Usage in the Car: Towards a Car Technology Acceptance Model. In Proceedings of the 4th International Conference on Automotive User Interfaces and Interactive Vehicular Applications (Portsmouth, New Hampshire) (AutomotiveUI ’12). Association for Computing Machinery, New York, NY, USA, 51–58. https://doi.org/10.1145/2390256.2390264
- Pakdamanian et al. (2021) Erfan Pakdamanian, Shili Sheng, Sonia Baee, Seongkook Heo, Sarit Kraus, and Lu Feng. 2021. DeepTake: Prediction of Driver Takeover Behavior Using Multimodal Data. In Proceedings of the 2021 CHI Conference on Human Factors in Computing Systems (Yokohama, Japan) (CHI ’21). Association for Computing Machinery, New York, NY, USA, Article 103, 14 pages. https://doi.org/10.1145/3411764.3445563
- Politis et al. (2015) Ioannis Politis, Stephen Brewster, and Frank Pollick. 2015. Language-Based Multimodal Displays for the Handover of Control in Autonomous Cars. In Proceedings of the 7th International Conference on Automotive User Interfaces and Interactive Vehicular Applications (Nottingham, United Kingdom) (AutomotiveUI ’15). Association for Computing Machinery, New York, NY, USA, 3–10. https://doi.org/10.1145/2799250.2799262
- Prilla and Rühmann (2018) Michael Prilla and Lisa M Rühmann. 2018. An Analysis Tool for Cooperative Mixed Reality Scenarios. In 2018 IEEE International Symposium on Mixed and Augmented Reality Adjunct (ISMAR-Adjunct). IEEE, IEEE, New YOrk, NY, USA, 31–35.
- Radlmayr et al. (2014) Jonas Radlmayr, Christian Gold, Lutz Lorenz, Mehdi Farid, and Klaus Bengler. 2014. How Traffic Situations and Non-Driving Related Tasks Affect the Take-Over Quality in Highly Automated Driving. Proceedings of the Human Factors and Ergonomics Society Annual Meeting 58, 1 (2014), 2063–2067. https://doi.org/10.1177/1541931214581434 arXiv:https://doi.org/10.1177/1541931214581434
- Reichherzer et al. (2021) Carolin Reichherzer, Andrew Cunningham, Tracey Coleman, Ruochen Cao, Kurt McManus, Dion Sheppard, Mark Kohler, Mark Billinghurst, and Bruce H Thomas. 2021. Bringing the Jury to the Scene of the Crime: Memory and Decision-Making in a Simulated Crime Scene. In Proceedings of the 2021 CHI Conference on Human Factors in Computing Systems (Yokohama, Japan) (CHI ’21). Association for Computing Machinery, New York, NY, USA, Article 709, 12 pages. https://doi.org/10.1145/3411764.3445464
- Reipschläger et al. (2022) Patrick Reipschläger, Frederik Brudy, Raimund Dachselt, Justin Matejka, George Fitzmaurice, and Fraser Anderson. 2022. AvatAR: An Immersive Analysis Environment for Human Motion Data Combining Interactive 3D Avatars and Trajectories. In Proceedings of the 2022 CHI Conference on Human Factors in Computing Systems (New Orleans, LA, USA) (CHI ’22). Association for Computing Machinery, New York, NY, USA, Article 23, 15 pages. https://doi.org/10.1145/3491102.3517676
- Reipschlager et al. (2020) Patrick Reipschlager, Tamara Flemisch, and Raimund Dachselt. 2020. Personal augmented reality for information visualization on large interactive displays. IEEE Transactions on Visualization and Computer Graphics 27, 2 (2020), 1182–1192.
- Rittger et al. (2022) Lena Rittger, Doreen Engelhardt, and Robert Schwartz. 2022. Adaptive User Experience in the Car—Levels of Adaptivity and Adaptive HMI Design. IEEE Transactions on Intelligent Transportation Systems 23, 5 (2022), 4866–4876. https://doi.org/10.1109/TITS.2021.3124990
- Roider et al. (2018) Florian Roider, Lars Reisig, and Tom Gross. 2018. Just Look: The Benefits of Gaze-Activated Voice Input in the Car. In Adjunct Proceedings of the 10th International Conference on Automotive User Interfaces and Interactive Vehicular Applications (AutomotiveUI ’18). Association for Computing Machinery, New York, NY, USA, 210–214. https://doi.org/10.1145/3239092.3265968
- Rosenbaum et al. (2011) René Rosenbaum, Jeremy Bottleson, Zhuiguang Liu, and Bernd Hamann. 2011. Involve Me and I Will Understand!–Abstract Data Visualization in Immersive Environments. In International Symposium on Visual Computing. Springer, Springer, Cham, 530–540.
- SAE-International (2021) SAE-International. 2021. Taxonomy and Definitions for Terms Related to Driving Automation Systems for On-Road Motor Vehicles. https://www.sae.org/standards/content/j3016_202104/. [Online; accessed: 24-August-2021].
- Saenz et al. (2017) Michael Saenz, Ali Baigelenov, Ya-Hsin Hung, and Paul Parsons. 2017. Reexamining the cognitive utility of 3D visualizations using augmented reality holograms. In IEEE VIS Workshop on Immersive Analytics: Exploring Future Interaction and Visualization Technologies for Data Analytics. ACM, New York, NY, USA, 5.
- Salesforce (2022) Salesforce. 2022. Tableau: Business Intelligence and Analytics Software. Salesforce Inc. https://www.tableau.com/ (Accessed on 08/23/2022).
- Salpisti et al. (2022) Despoina Salpisti, Matthias de Clerk, Sebastian Hinz, Frank Henkies, and Gudrun Klinker. 2022. A Procedural Building Generator Based on Real-World Data Enabling Designers to Create Context for XR Automotive Design Experiences. In Virtual Reality and Mixed Reality, Gabriel Zachmann, Mariano Alcañiz Raya, Partrick Bourdot, Maud Marchal, Jeanine Stefanucci, and Xubo Yang (Eds.). Springer International Publishing, Cham, 149–170.
- Schmidt et al. (2010) Albrecht Schmidt, Wolfgang Spiessl, and Dagmar Kern. 2010. Driving Automotive User Interface Research. IEEE Pervasive Computing 9, 1 (2010), 85–88. https://doi.org/10.1109/MPRV.2010.3
- Schölkopf et al. (2021) Lasse Schölkopf, Maria-Magdalena Wolf, Veronika Hutmann, and Frank Diermeyer. 2021. Conception, Development and First Evaluation of a Context-Adaptive User Interface for Commercial Vehicles. In 13th International Conference on Automotive User Interfaces and Interactive Vehicular Applications (Leeds, United Kingdom) (AutomotiveUI ’21 Adjunct). Association for Computing Machinery, New York, NY, USA, 21–25. https://doi.org/10.1145/3473682.3480256
- Sedlmair et al. (2012) Michael Sedlmair, Miriah Meyer, and Tamara Munzner. 2012. Design Study Methodology: Reflections from the Trenches and the Stacks. IEEE Transactions on Visualization and Computer Graphics 18, 12 (2012), 2431–2440. https://doi.org/10.1109/TVCG.2012.213
- Sefik Ilkin Serengil (2022) Sefik Ilkin Serengil. 2022. DeepFace: A Facial Recognition Library for Python. DeepFace. https://github.com/serengil/deepface (Accessed on 08/23/2022).
- Sereno et al. (2022) Mickael Sereno, Stéphane Gosset, Lonni Besançon, and Tobias Isenberg. 2022. Hybrid touch/tangible spatial selection in augmented reality. In Computer Graphics Forum. Wiley Online Library, Wiley, Hoboken, New Jersey, USA, 403–415.
- Shen et al. (2022) Junxiao Shen, John Dudley, George Mo, and Per Ola Kristensson. 2022. Gesture Spotter: A Rapid Prototyping Tool for Key Gesture Spotting in Virtual and Augmented Reality Applications. IEEE Transactions on Visualization and Computer Graphics 28, 11 (2022), 1–11. https://doi.org/10.1109/TVCG.2022.3203004
- Tang et al. (2010) Anthony Tang, Michel Pahud, Sheelagh Carpendale, and Bill Buxton. 2010. VisTACO: Visualizing Tabletop Collaboration. In ACM International Conference on Interactive Tabletops and Surfaces (Saarbrücken, Germany) (ITS ’10). Association for Computing Machinery, New York, NY, USA, 29–38. https://doi.org/10.1145/1936652.1936659
- Tavakoli et al. (2021) Arash Tavakoli, Shashwat Kumar, Xiang Guo, Vahid Balali, Mehdi Boukhechba, and Arsalan Heydarian. 2021. HARMONY: A Human-Centered Multimodal Driving Study in the Wild. IEEE Access 9 (2021), 23956–23978. https://doi.org/10.1109/ACCESS.2021.3056007
- Tianxiaomo (2022) Tianxiaomo. 2022. Pytorch-YOLOv4. YOLOv4. https://github.com/Tianxiaomo/pytorch-YOLOv4 (Accessed on 08/23/2022).
- TIBCO (2022) TIBCO. 2022. TIBCO Spotfire®. TIBCO Software Inc. https://www.tibco.com/products/tibco-spotfire (Accessed on 08/23/2022).
- Trenta et al. (2019) Francesca Trenta, Sabrina Conoci, Francesco Rundo, and Sebastiano Battiato. 2019. Advanced Motion-Tracking System with Multi-Layers Deep Learning Framework for Innovative Car-Driver Drowsiness Monitoring. In 2019 14th IEEE International Conference on Automatic Face & Gesture Recognition (FG 2019). IEEE, Cham, 1–5. https://doi.org/10.1109/FG.2019.8756566
- Triess et al. (2021) Larissa T. Triess, Mariella Dreissig, Christoph B. Rist, and J. Marius Zöllner. 2021. A Survey on Deep Domain Adaptation for LiDAR Perception. In 2021 IEEE Intelligent Vehicles Symposium Workshops (IV Workshops). IEEE, New York, NY, USA, 350–357. https://doi.org/10.1109/IVWorkshops54471.2021.9669228
- Upton and Cook (1996) Graham Upton and Ian Cook. 1996. Understanding statistics. Oxford University Press, Oxford, United Kingdom.
- vis2k (2022) vis2k. 2022. Mirror. vis2k. {https://assetstore.unity.com/packages/tools/network/mirror-129321} (Accessed on 08/23/2022).
- von Zadow and Dachselt (2017) Ulrich von Zadow and Raimund Dachselt. 2017. GIAnT: Visualizing Group Interaction at Large Wall Displays. In Proceedings of the 2017 CHI Conference on Human Factors in Computing Systems (Denver, Colorado, USA) (CHI ’17). Association for Computing Machinery, New York, NY, USA, 2639–2647. https://doi.org/10.1145/3025453.3026006
- Vuplex (2022) Vuplex. 2022. 3D WebView for Windows and macOS (Web Browser). Vuplex. {https://assetstore.unity.com/packages/tools/gui/3d-webview-for-windows-and-macos-web-browser-154144} (Accessed on 08/23/2022).
- Wagner Filho et al. (2018) Jorge A Wagner Filho, Marina F Rey, Carla MDS Freitas, and Luciana Nedel. 2018. Immersive visualization of abstract information: An evaluation on dimensionally-reduced data scatterplots. In 2018 IEEE Conference on Virtual Reality and 3D User Interfaces (VR). IEEE, IEEE, New YOrk, NY, USA, 483–490.
- Wang et al. (2022) Manhua Wang, Seul Chan Lee, Genevieve Montavon, Jiakang Qin, and Myounghoon Jeon. 2022. Conversational Voice Agents Are Preferred and Lead to Better Driving Performance in Conditionally Automated Vehicles. In Proceedings of the 14th International Conference on Automotive User Interfaces and Interactive Vehicular Applications (Seoul, Republic of Korea) (AutomotiveUI ’22). Association for Computing Machinery, New York, NY, USA, 86–95. https://doi.org/10.1145/3543174.3546830
- Wang et al. (2020) Xiyao Wang, Lonni Besançon, David Rousseau, Mickael Sereno, Mehdi Ammi, and Tobias Isenberg. 2020. Towards an understanding of augmented reality extensions for existing 3D data analysis tools. In Proceedings of the 2020 CHI Conference on Human Factors in Computing Systems. ACM, New York, NY, USA, 1–13.
- Weng et al. (2016) Fuliang Weng, Pongtep Angkititrakul, Elizabeth E. Shriberg, Larry Heck, Stanley Peters, and John H.L. Hansen. 2016. Conversational In-Vehicle Dialog Systems: The past, present, and future. IEEE Signal Processing Magazine 33, 6 (2016), 49–60. https://doi.org/10.1109/MSP.2016.2599201
- Wintersberger et al. (2018a) Philipp Wintersberger, Anna-Katharina Frison, and Andreas Riener. 2018a. Man vs. Machine: Comparing a Fully Automated Bus Shuttle with a Manually Driven Group Taxi in a Field Study. In Adjunct Proceedings of the 10th International Conference on Automotive User Interfaces and Interactive Vehicular Applications (Toronto, ON, Canada) (AutomotiveUI ’18). Association for Computing Machinery, New York, NY, USA, 215–220. https://doi.org/10.1145/3239092.3265969
- Wintersberger et al. (2018b) Philipp Wintersberger, Anna-Katharina Frison, Andreas Riener, and Tamara von Sawitzky. 2018b. Fostering User Acceptance and Trust in Fully Automated Vehicles: Evaluating the Potential of Augmented Reality. Presence: Teleoperators and Virtual Environments 27, 1 (Feb. 2018), 46–62. https://doi.org/10.1162/pres_a_00320 _eprint: https://direct.mit.edu/pvar/article-pdf/27/1/46/2003540/pres_a_00320.pdf.
- Winzer et al. (2018) Oliver M. Winzer, Antonia S. Conti-Kufner, and Klaus Bengler. 2018. Intersection Traffic Light Assistant – An Evaluation of the Suitability of Two Human Machine Interfaces. In 2018 21st International Conference on Intelligent Transportation Systems (ITSC) (Maui, HI, USA). IEEE Press, New York, NY, USA, 261–265. https://doi.org/10.1109/ITSC.2018.8569708
- Xu et al. (2021) Zhigang Xu, Zijun Jiang, Guanqun Wang, Runmin Wang, Tingting Li, Jinting Liu, Yijing Zhang, and Peng Liu. 2021. When the automated driving system fails: Dynamics of public responses to automated vehicles. Transportation Research Part C: Emerging Technologies 129 (2021), 103271. https://doi.org/10.1016/j.trc.2021.103271
- Yan et al. (2019) Yan Yan, Ke Chen, Yu Xie, Yiming Song, and Yonghong Liu. 2019. The Effects of Weight on Comfort of Virtual Reality Devices. In Advances in Ergonomics in Design, Francisco Rebelo and Marcelo M. Soares (Eds.). Springer International Publishing, Cham, 239–248.
- Yi et al. (2007) Ji Soo Yi, Youn ah Kang, John Stasko, and J.A. Jacko. 2007. Toward a Deeper Understanding of the Role of Interaction in Information Visualization. IEEE Transactions on Visualization and Computer Graphics 13, 6 (2007), 1224–1231. https://doi.org/10.1109/TVCG.2007.70515
- Zhang et al. (2015) Meng-Jia Zhang, Jie Li, and Kang Zhang. 2015. Using Virtual Reality Technique to Enhance Experience of Exploring 3D Trajectory Visualizations. In Proceedings of the 8th International Symposium on Visual Information Communication and Interaction (Tokyo, AA, Japan) (VINCI ’15). Association for Computing Machinery, New York, NY, USA, 168–169. https://doi.org/10.1145/2801040.2801072
- Zhong et al. (2022) Qi Zhong, Jinyi Zhi, and Gang Guo. 2022. Dynamic is optimal: Effect of three alternative auto-complete on the usability of in-vehicle dialing displays and driver distraction. Traffic Injury Prevention 23, 1 (2022), 51–56. https://doi.org/10.1080/15389588.2021.2010052 arXiv:https://doi.org/10.1080/15389588.2021.2010052 PMID: 34937441.
Appendix A Coded Themes from the AUI Domain Expert Interviews
In the following, we present the results from the automotive domain expert interviews coded in common themes. Five experts (E1-E5) participated in the semi-structured interviews (see 3.2).
A.1. Visualization of Object Positions and Movements
-
E1
”There are many objects inside and outside the vehicle, which can be recorded in sometimes hours of video footage. These are always difficult to keep track of. Manual coding of videos is often time-consuming, and interesting aspects could get overlooked.”
-
E2
”The positions and movements of passengers within the vehicle should be displayed so that it can be understood when, how, and where interaction took place.”
-
E3
”Many interactions with AUIs are triggered by external factors of the vehicle environment, for example, the driver might gesture towards or look at other vehicles or pedestrians at a crosswalk. Therefore, it is essential that the positions and movements of other objects in the environment, such as cars or pedestrians, are visible.”
-
E4
”For eHMI research, a replication of the exterior of a vehicle (or several vehicles) in the same simulation environment is of key importance. In this context, the vehicle’s interior would be less relevant.”
A.2. Collaborative Analysis
-
E2
”Most of the time, many researchers collaborate in an AUI research project. They often collaborate across locations and different time zones. One difficulty is working together on an analysis at the same time. That’s why people use online notebooks that persistently store notes and analysis without needing someone to share them live, so they can work independently on the same file.”
-
E5
”The data from automotive studies are usually analyzed in a team, with one person doing the main work, such as preparing the data for analysis, and then later the other authors iterating together over the initially collected results and annotating anomalies.”
-
E3
”For collaboration to be effective, the data should be stored persistently (like an online notebook) so that each collaborator can access the data independently of the others (in terms of time) and mark relevant passages for later discussions.”
-
E4
”One’s own knowledge sometimes reaches its limits when evaluating extensive AUI studies, for example, if when analyzing physiological data. In this case, we often consult other researchers in this case, who are more experienced in these areas. It would be great if these additional experts could be also part of the analysis environment to foster interactions.”
A.3. Visualizing Data Interdependencies
-
E2
”When we record data that represent different passenger states, these are stored in logs that are difficult to read manually. A common problem is that the correlations between the position logs of the passengers and the event logs are not readable and thus have to be reconstructed in a cumbersome way.”
-
E4
”If video recordings and other measurements, such as the heart rate, are added to the event logs, then correlations can no longer be analyzed without additional effort.”
A.4. Dataset Annotations
-
E4
”Independent of the specific research topic, one should be able to annotate data. This allows one to describe the data for collaborators. In addition, annotated datasets can be effectively used in further processing, such as DL.”
A.5. Data Filtering and Modularity
-
E1
”Self-recorded but also public datasets are often very extensive. Therefore, it would be handy if these could be filtered so that, for example, only interactions with a specific dashboard element are displayed, although the dataset contains logs about interactions with the entire interior.”
-
E5
”Analogous to development environments like Unity or analysis environments like RStudio, it would be helpful to combine different visualizations and view modules. For example, I would not always be interested in a video of the driver, or I would like the view of the events to be larger to increase visibility.”
A.6. Leveraging a Real Vehicle in the Analysis
-
E1
”An analysis in a real vehicle only makes sense if the same vehicle has been used across all participants in a study. In naturalistic driving studies, each study participant drives his or her own vehicle. Nevertheless, it would be conceivable to use the surfaces of a real vehicle in the analysis, e.g., to visualize the interaction pattern directly on the surfaces.”
-
E3
”I consider the analysis in a real vehicle, while it is driving, to be impractical and not purposeful. The driving environment (apart from the landscape and the city) is constantly changing and therefore not usable in the analysis. Thus, I would rather find the movements and the changing background while driving distracting for a focused analysis.”
-
E4
”In studies that take place in a real car or even in a driving simulator, the study supervisor often can’t or isn’t allowed to be there and ride in the car and observe the participants up close. It would be great if exactly that were possible in VR, e.g., there could be a detailed simulation of the ride that analysts could relive.”
A.7. Enabling Mixed-Immersion Analysis
-
E5
”Not everyone has a VR HMD beside their table, so it would be handy to have a desktop environment where you can also analyze and, in the best case, collaborate with the others and not be excluded.”
-
E2
”I think that the immersive analysis using a VR HMD is overhead, for example, if one would like to have only an overview of the events, retrieving outliers, or other measuring errors in the physiological data recordings. Likewise, I don’t always find an immersive 3D environment helpful, because I often have to jump to different places and, consequently, have a hard time keeping track of a participant’s entire ride.”
-
E4
”In a VR view, there is often a lack of overview of the situation because the viewpoint is usually the first-person perspective of a passenger or bystanders (other cars, pedestrians, etc.). In addition, the feeling of missing something is increased by the fact that I have to turn my head to capture all the information in a 3D space that can appear in 360 degrees.”
A.8. Immersive Analysis via VR
-
E2
”When participants make certain interactions, I always find it hard to assess why they just happened the way they did. Taking the perspective of the participants would help to see the study from their POV, and then perhaps have a new perspective on the data.”
-
E3
”When analyzing videos and interaction logs, I always have to imagine in my head what the (3D) driving environment just looked like, so that I have a better context when analyzing data. If I designed the study myself and implemented it (e.g., in Unity), I can usually remember the driving environment or just look it up. With other people’s studies, I can’t do that as easily anymore and have trouble establishing a spatial relationship between the data.”
A.9. Interplay Between Immersive and Non-Immersive Analysis
-
E4
”I assume that the transition between a VR and desktop application is too cumbersome. If I were analyzing data, I might only see the desktop environment for data preparation or post-processing. If it makes sense, then, I would only use the VR environment as the main analysis tool and not constantly switch between VR and desktop.”
-
E2
”If desktop and VR can be used at the same time, then one person could guide the other via desktop, analogous to the VR preview in desktop in SteamVR.”
A.10. Gradual Control Over the Visualization
-
E1
”It is very difficult to understand how many things are happening simultaneously in automotive scenarios (e.g., many passengers inside the vehicle, multiple operations outside, complicated relationships between inside and outside, etc.). Therefore, step-by-step time-lapse control would allow a more thorough examination of a scenario at slower or faster playback speeds.”
A.11. Linking In-Vehicle and Environment Contexts
-
E3
”When a landmark is referenced in a gesture interaction, one must search for the reference in the environment. Such ”search” can be time-consuming and difficult if the scene is unknown. In addition, the referenced object could be too far away to see in detail in VR. Similarly, voice interactions are difficult to analyze, if the referenced location/object is not even close to the current street.”
A.12. Automatic Conversion of Datasets and Data Preprocessing
-
E5
”An analysis tool in the automotive area should merge all available data of a dataset so that one can easily access video, audio, and other logs without having to open three different programs and switch back and forth between windows.”
-
E4
”As there are always many different sensor recordings, logs, video recordings, etc., it would be an enormous relief if a tool could automatically convert and prepare all this data to use it in a plug-and-play environment.”
Appendix B Non-Immersive Desktop View Details
In this section, we describe the detailed concepts for the non-immersive desktop view (see 4.2). The desktop view is divided into five panels (see Figure 2): 2D panel (A), 3D scene panel (B), video (C), inspector (D), overview (E), and timeline (F).
The timeline panel consists of: a timeline, event line, and control elements (see Figure 2 F). Similar to ReLive (Hubenschmid et al., 2022), analysts can examine events R2 and control the tool-wide study playback, for example, to directly jump to interesting points within the data. Analysts can also annotate sections on the timeline with labels that are automatically added to the dataset and visualized as tags on the event line R6. The timeline enables audio playback and shows when participants spoke as audio events R7. The event line hosts four types of events: (inter)action, emotion, driving, and activity, which can be automatically derived from a dataset (see 4.1.2). The participants’ events are color-coded to reduce visual clutter (see Figure 2 F). Interaction events describe passenger interactions, such as touches or gestures. In contrast, activity events are any passenger activity unrelated to UI interactions. Lastly, driving events describe the driving scenario (e.g., red traffic lights or accelerations).
While the timeline was adopted from Hubenschmid et al. (2022), we added line diagrams in the 2D panel for non-spatial temporal data, such as physiological data, to overcome the AUI-specific challenge of ubiquitous physiological measures (see 3.2). The 2D panel provides an overview of 2D data and events (see Figure 2 A) enabling quick identification of relevant data sequences R3 for further examinations on the timeline, in the 3D scene, or VR. At the bottom, an event line facilitates the vertical recognition of correlations between data streams and events. In addition, a red horizontal line helps detect deviations from the mean and, combined with an outlier detection (in yellow, based on the 1.5xIQR rule (Upton and Cook, 1996)), hints at data anomalies. However, like other outlier detectors, this should be used cautiously, due to false positives. Besides, analysts can mark sections in the line diagrams to zoom R5.
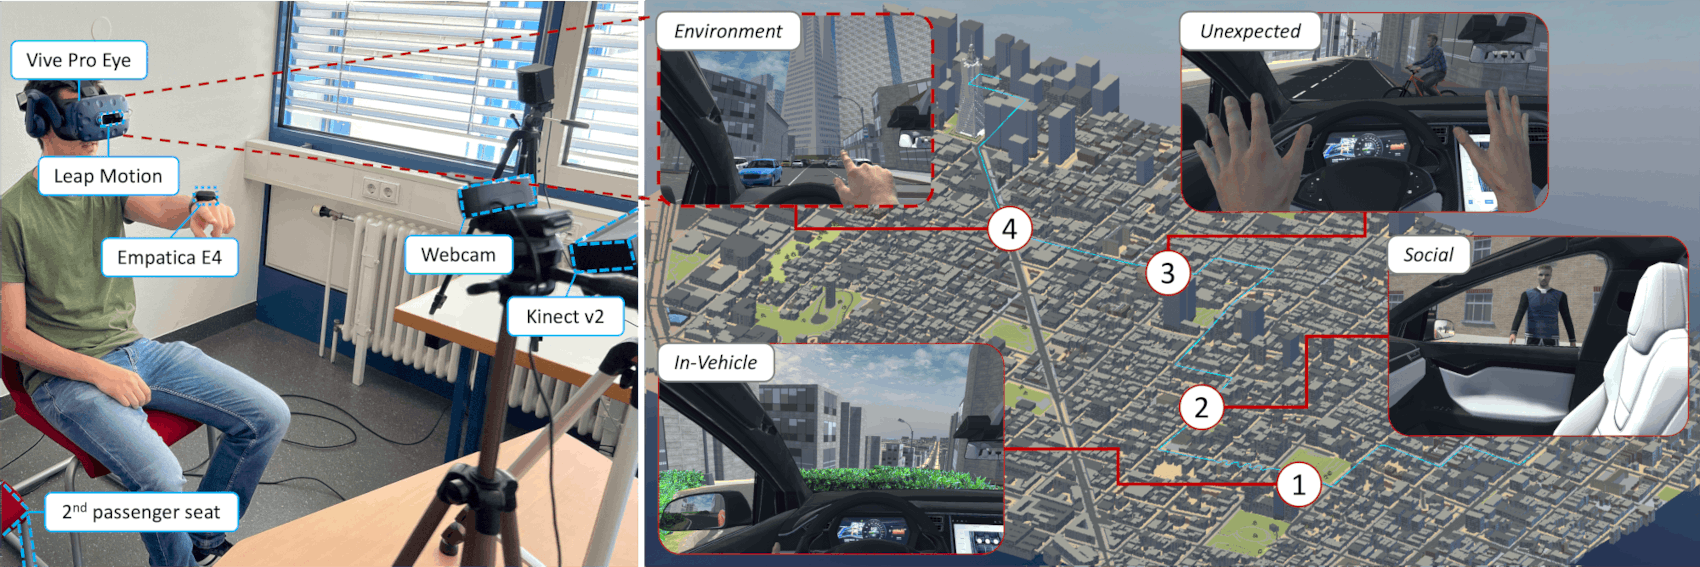
The figure is split into two images. On the left, a real picture of a person sitting on a chair can be seen. The person is wearing a VR headset with an additional hand-tracking sensor glued to it, as well as an Empatica E4 wearable sensor on their left hand. The person is pointing at something. Additional sensors (Kinect v2) and a webcam point at the person. The picture on the right shows an aerial view of a virtual city. A cyan-colored line represents a path a car took through the city. Along the path, four markings show special events with close-up images of said events. All event-related images are shot from the POV of the person in the driver’s seat. The first event is the car driving through a winding road with hedges. In the second event, another passenger enters the car. In the third picture, a cyclist unexpectedly appears in front of the vehicle. The passenger has his arms raised in shock. In the fourth picture, the passenger points at a building the car is driving towards.
To address R1 and R4, the 3D scene panel replicates the original study environment and visualizes the study vehicles’ movements using a virtual ego-vehicle (see Figure 2 B). The 3D panel also replicates objects (in the range of vehicle sensors), such as buildings, pedestrians, cars, and cyclists R1. In contrast to ReLive (Hubenschmid et al., 2022), which replicates smaller environments (e.g., a room), the 3D scene panel replicates large environments (using GPS logs) to overcome the AUI-specific problem of large distances between objects of interest (see 3.2). Similar to immersive analytics tools, such as MIRIA (Büschel et al., 2021) and ReLive (Hubenschmid et al., 2022), analysts can re-experience the scene from any POV using free movement and predefined virtual (isometric) camera positions. However, to account for the AUI-specific challenge of volatile in-vehicle and environmental contexts (see 3.2), analysts can slice the virtual ego-vehicle at any axis to see inside the interior (see Figure 2 B) and select objects to track them through the scene R5. The 3D scene panel shows the same content as the VR view, as they are generated from the same JSON config file.
The inspector panel provides meta information on 3D scene objects upon selection in the 3D scene panel (e.g., the ego vehicle’s speed) and study-specific metrics, such as demographic data (see Figure 2 D). The overview panel lists all 3D scene objects, available participants samples, and visualization settings addressing R5 (see Figure 2 E). Participants have a unique adjustable color throughout AutoVis. In addition, analysts can select which subsets of participants are visualized tool-wide. They can also toggle the visibility of avatars, trajectories, heatmaps, and events.
Appendix C Use Case Study Details: Multimodal Interactions in AVs
We provide the details on the apparatus and procedure of the use case study on multimodal in-vehicle interactions (see 6.1).
Apparatus
We leverage a static VR simulator using the Vive Pro Eye, as safety regulations forbid a real-world AV study at our institution. We placed two chairs next to each other to resemble the front seats (see Figure 10). We employed the Empatica E4 (Empatica, 2022) wristband to record physiological signals (blood volume pulse, inter-beat interval, skin temperature, electrodermal activity, and acceleration). For body tracking, we used Microsoft Kinect for Windows v2, and for hand tracking, we used the Leap Motion attached to the Vive HMD. In a Wizard of Oz approach, the study supervisor manually labeled hand gestures, such as pointing, by watching the participants and pressing a button. In contrast to camera-based methods, this approach can recognize gestures only understandable to humans. However, the timing could be slightly off. The Vive microphone was used to record speech input, and the built-in eye-tracking recorded gaze and pupil size. We also captured the participants’ behavior using a webcam. As a virtual ego-vehicle, we instrumented a Tesla Model X capable of automated driving. We detected touch inputs via Unity GameObject collisions with the virtual hands.
The virtual test track has a total length of about 2400 meters and resembles the downtown of San Francisco, see Figure 10 right. We selected this environment as Waymo currently employs fully automated taxis in that area444https://waymo.com/sf/; Accessed: 01.02.2023, making it a realistic testbed. The environment was created in Unity 2020.3.37f1, and the city layout was generated with CityGen3D (CityGen, 2022) using OpenStreetMap data of a 3.9 area.
Procedure
For a demonstration of AutoVis, we recorded data from only three participants. One recording session lasted 12 minutes. In the real world, the participants wore a VR HMD and sat on the left chair, resembling the driver’s seat. The automated vehicle in the VR simulation traveled at a speed of approx. 35 . Overall, the participants performed four tasks, see Figure 10 (1-4), in-vehicle, social, unexpected, and environment, covering important aspects for the analysis of multimodal interactions. First, they queried their current location (Lombard Street) in an in-vehicle navigation task. Then, another passenger entered the AV in the VR simulation, transforming the vehicle into a social place. However, in the real world, this passenger just sat down on a chair next to the participant. After that, the AV performed an unexpected emergency break because a cyclist crossed the street. Finally, the participants referred to a landmark in the environment (Transamerica Pyramid). In each task, participants could freely interact with one or multiple modalities (i.e., touch, gesture, gaze, and speech) simultaneously.