[1] \cormark[1] \cormark[2]
[coauthor]Equal contribution. \cortext[cor1]Corresponding author. Email address: lizhang08@nudt.edu.cn.
Oriented Object Detection in Optical Remote Sensing Images using Deep Learning: A Survey
Abstract
Oriented object detection is one of the most fundamental and challenging tasks in remote sensing, aiming at locating the oriented objects of numerous predefined object categories. Recently, deep learning based methods have achieved remarkable performance in detecting oriented objects in optical remote sensing imagery. However, a thorough review of the literature in remote sensing has not yet emerged. Therefore, we give a comprehensive survey of recent advances and cover many aspects of oriented object detection, including problem definition, commonly used datasets, evaluation protocols, detection frameworks, oriented object representations, and feature representations. Besides, the state-of-the-art methods are analyzed and discussed. We finally discuss future research directions to put forward some useful research guidance. We believe that this survey shall be valuable to researchers across academia and industry.
keywords:
Oriented object detection \sepRemote sensing \sepDeep learning1 Introduction
With the rapid development of remote sensing (RS) technologies, an increasing number of images with various resolutions and different spectra can be easily obtained by satellites or unmanned aerial vehicles (UAVs). Naturally, it is an urgent demand of the research community to investigate a variety of advanced technologies for processing and analyzing massive RS images automatically and efficiently. As a crucial cornerstone of automatic analysis for RS images, object detection aims to recognize objects of predefined categories from given images and to regress a precise localization of each object instance (e.g., via an oriented bounding box). Object detection in RS images serves as an essential step for a broad range of applications, including intelligent monitoring (Zhao et al., 2018; Salvoldi et al., 2022), urban planning (Burochin et al., 2014), port management (Zhang et al., 2021a), and military reconnaissance (Liu et al., 2022).
As shown in Figure 1, RS object detection can be divided into two types: horizontal object detection and oriented object detection (also called rotated object detection), according to the representation style of objects. The former represents the detected object using a horizontal bounding box (HBB) with the format of (Everingham et al., 2010; Lin et al., 2014; Russakovsky et al., 2015), where denotes the coordinates of the bounding box center, and denote the width and height of the bounding box, respectively. The latter locates the detected object using an oriented bounding box (OBB) with the format of , where denotes the rotation angle with respect to the horizontal direction. Hence, the second depicts a more accurate location by utilizing extra direction information.
Traditional detectors rely on handcrafted descriptors (Dalal and Triggs, 2005; Fei-Fei and Perona, 2005; Wright et al., 2009; Blaschke, 2010; Leitloff et al., 2010; Stankov and He, 2013; Blaschke et al., 2014) and often show limited performance due to the shallow features. Recent years have seen impressive progress in computer vision with the advance of deep neural networks (DNN) (Hinton and Salakhutdinov, 2006; LeCun et al., 2015; Chen et al., 2018; He et al., 2016; Krizhevsky et al., 2012, 2017). Benefiting from the continuous improvement of computing resources, DNN can learn high-level patterns from large-scale datasets in an end-to-end fashion. Therefore, DNN-based methods can exploit representative and discriminative features. Recently, various DNN-based detectors have been proposed and have dominated the state-of-the-art. Most of these methods focus on designing horizontal object detectors (Girshick et al., 2014; Girshick, 2015; Ren et al., 2017; Liu et al., 2016a; Lin et al., 2020; Redmon et al., 2016; Redmon and Farhadi, 2017; Hei and Jia, 2020; Duan et al., 2019; Zhou et al., 2019; Yang et al., 2019b) for natural scene images, which are taken from a horizontal perspective. In contrast, RS images are typically captured from the bird-eye view (BEV), posing the additional challenges for detection tasks as follows (Xia et al., 2018):
Arbitrary orientations. In BEV, objects in RS images can appear in arbitrary orientations, resulting in an adverse impact on the detection performance, as shown in Figure 2(a).
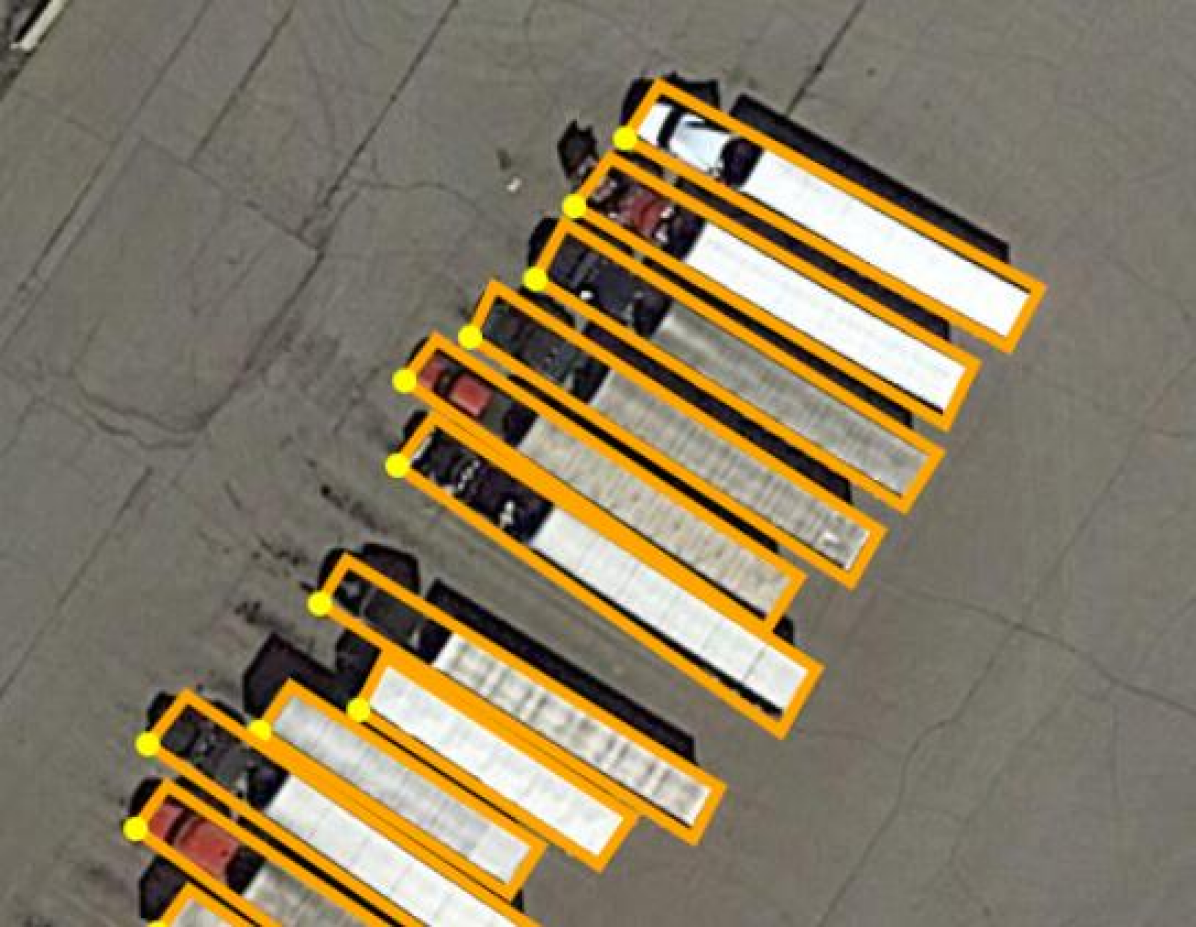
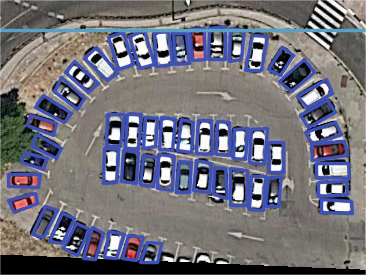
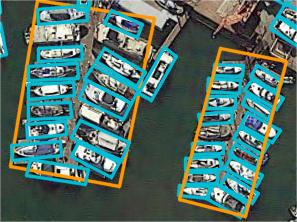
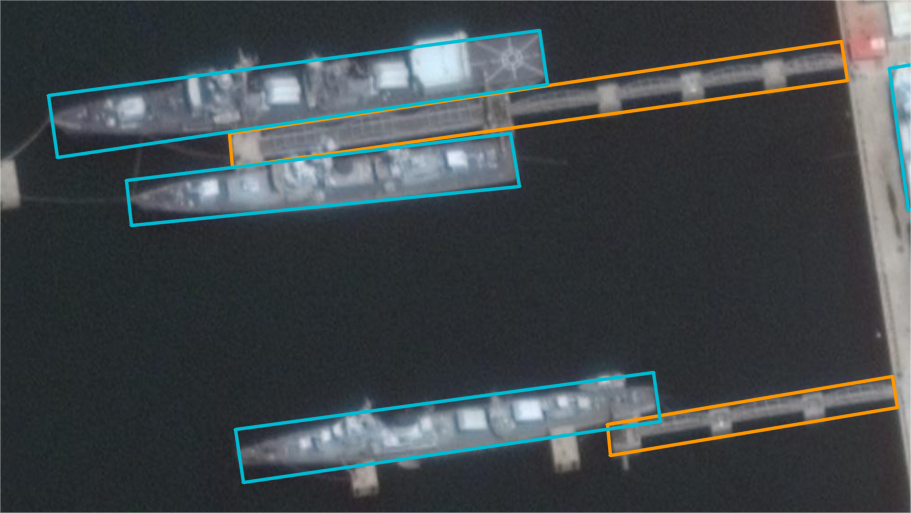
Dense arrangement. In some specific scenarios, there may be many small objects distributed densely, e.g., the ships in a harbor and the vehicles in a parking lot, as illustrated in Figure 2(b). As a result, one horizontal box predicted by detectors may contain multiple crowded objects, where mutual interference among multiple objects can pose a huge challenge.
Large aspect ratio. As shown in Figure 2(c), RS images typically contain some categories with an extremely large aspect ratio, such as bridges, ships, harbors, etc. The localization accuracy of these categories is very sensitive to the orientation error.
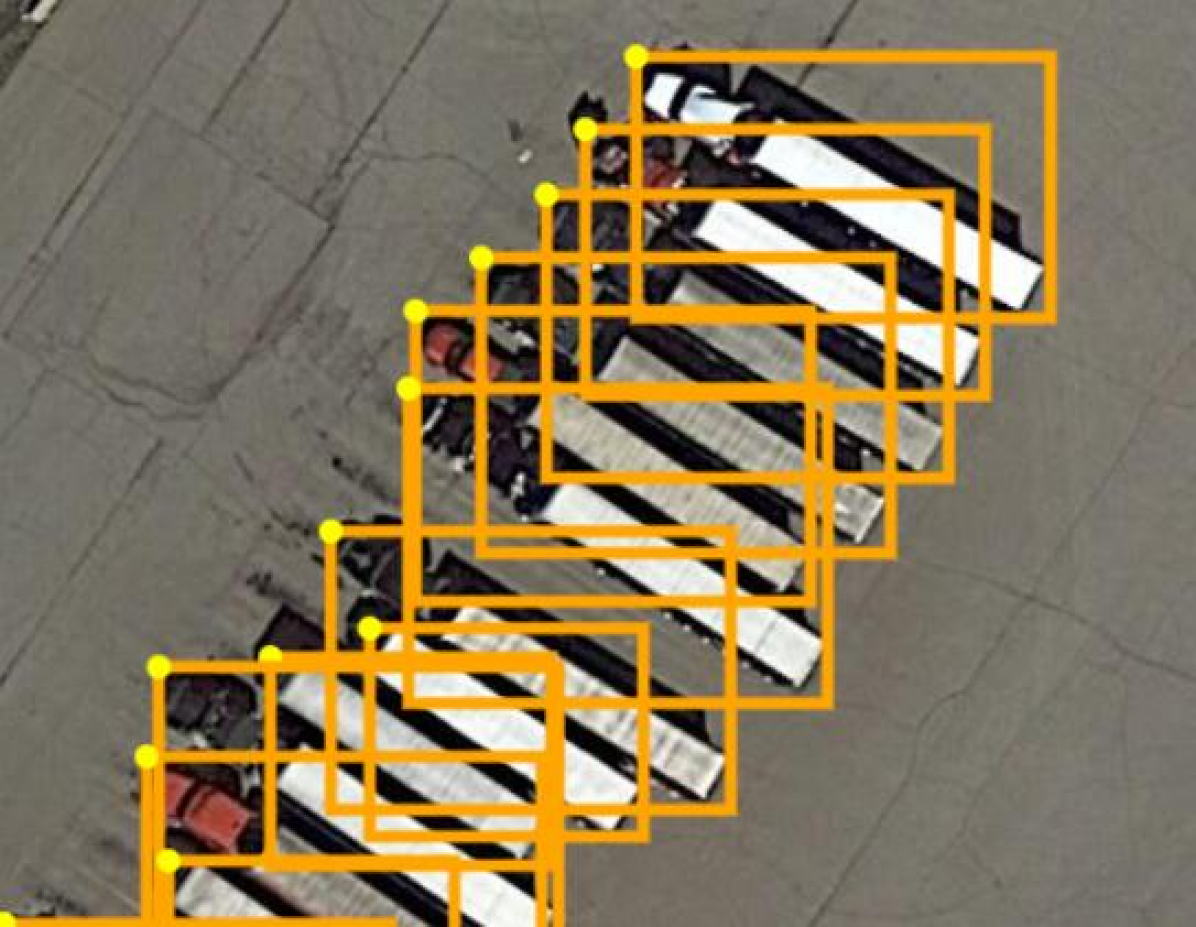
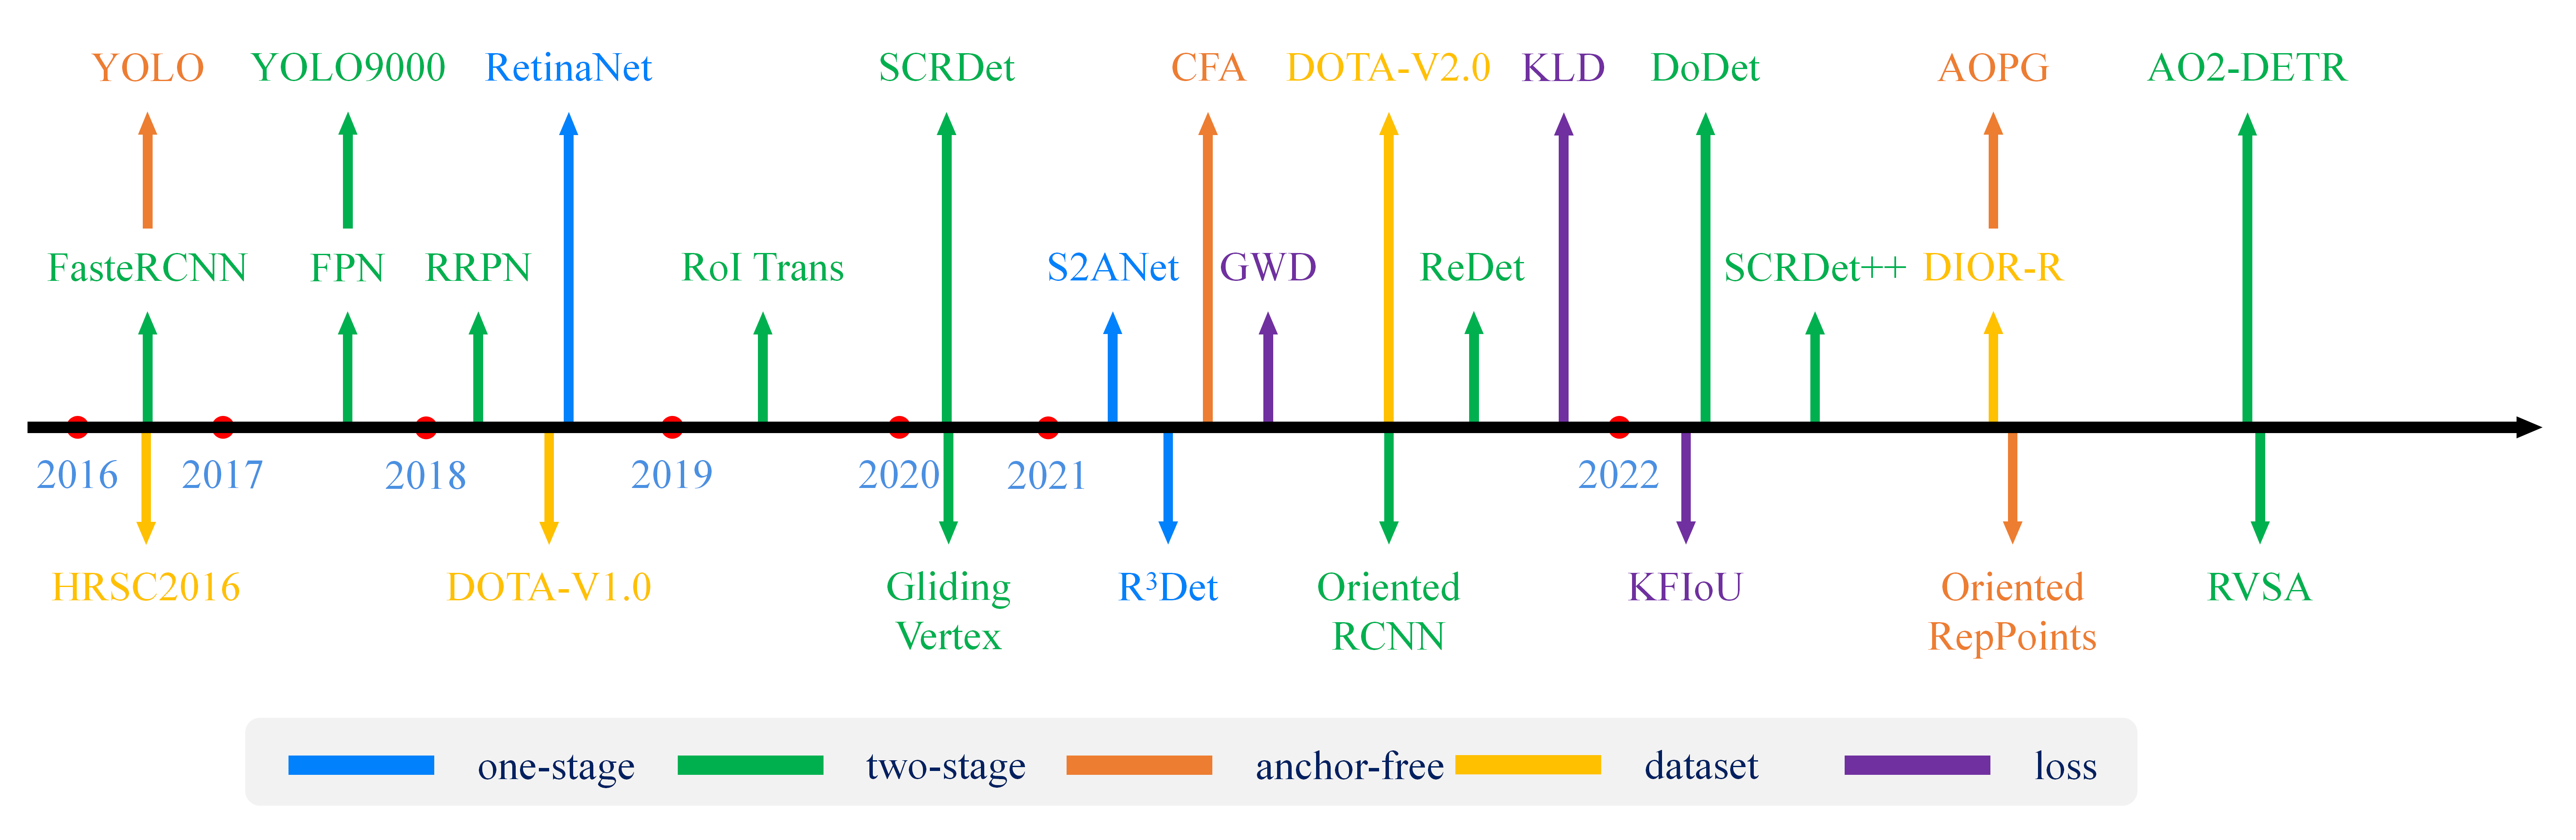
Therefore, although these horizontal object detectors perform well on natural scene images, they are not suitable for objects with arbitrary orientations in RS images. A HBB cannot depict the object orientation and contains redundant information in the background. What’s more, in dense arrangement scenarios (especially for objects with extremely large aspect ratios), the intersection-over-union (IoU) between an HBB and the adjacent HBBs can be very large, as illustrated in Figure 1(b). Thus, the non-maximum suppression (NMS) technique tends to cause missed detections. To cope with these challenges, more efforts have been devoted to oriented object detection. Because an OBB can enclose the objects precisely and distinguish the object from the densely arranged adjacent objects. Several milestone methods and widely-used datasets are illustrated in Figure 3.
While enormous oriented object detection methods exist, a comprehensive survey of this subject is still lacking. Given the continued maturity and increasing concerns about this field, this paper attempts to present a thorough analysis of recent efforts and systematically summarize their achievements. Through reviewing a large number of contributions in the field of oriented object detection, our survey covers the following respects: problem definition, commonly used datasets, evaluation protocol, detection frameworks, OBB representation, and feature representation. Furthermore, a brief conclusion and an outlook toward future research are given.
1.1 Related Surveys
In the field of object detection, a number of prominent surveys have been published in recent years. Several efforts focus on a specific category, such as face detection (Zafeiriou et al., 2015; Wang et al., 2018a; Wu and Ji, 2019; Du et al., 2022), text detection (Ye and Doermann, 2015; Yin et al., 2016), pedestrian detection (Brunetti et al., 2018), and ship detection (Li et al., 2021). There are more surveys focus on generic horizontal object detection, aiming at detecting the objects of multiple predefined categories in natural scenarios (Jiao et al., 2019; Liu et al., 2020; Wu et al., 2020; Zhao et al., 2019b; Xiao et al., 2020a). These works cover various aspects of generic horizontal object detection, including deep learning based detection frameworks, training strategies, feature representation, evaluation metrics, and typical application areas. What’s more, there are also surveys of generic horizontal object detection under specific conditions, including small object detection (Tong et al., 2020; Han et al., 2021c; Liu et al., 2021a) and camouflaged object detection (Mondal, 2020). Although a few surveys (Cheng and Han, 2016; Li et al., 2020) analyze and summarize RS object detection, they focus only on traditional approaches and horizontal object detection. Hence, none of the above surveys focus on oriented object detection. To the best of our knowledge, this is the first survey paper that try to comprehensively cover deep learning methods for oriented object detection under RS scenarios. This survey focuses on the major advances of oriented object detection and also includes pivotal works on horizontal object detection for completeness and readability.
1.2 Contributions
The major contributions of this work are summarized as follows:
(1) Comprehensive survey of recent and advanced progress of deep learning for oriented object detection. We systematically summarize the commonly used datasets, deep learning network frameworks for oriented object detection, and state-of-the-art methods.
(2) In-depth analysis and discussion of oriented object representations and feature representations. We discuss the challenges and corresponding solutions of oriented object representations, including inconsistency between metric and loss, angular boundary discontinuity and square-like problem, and vertexes sorting problem. Besides, we analyze and compare the existing methods for feature representation in oriented object detection, including enhanced and rotation-invariant feature representations.
(3) Overview of potential trends in the future. We shed light on possible directions in the future from seven aspects: domain adaptation, scale adaption, long-tailed oriented object detection, multi-modal information fusion, lightweight methods, video object detection, and object instance segmentation.
The structure of this paper is organized as follows. We first introduce the problem definition of oriented object detection in Section 2. Then, we present an overview of commonly used datasets and elaborate on the evaluation protocols in Section 3. After reviewing DNN-based frameworks in Section 4, we discuss the OBB representation and feature representation in Section 5 and Section 6, respectively. Furthermore, we analyze and compare the state-of-the-art methods in Section 7. Finally, potential future research directions are discussed in Section 8.
2 Problem Definition
Object detection involves localization (where are objects from predefined categories located in a given image?) and recognition (which predefined categories do these objects belong to?). Hence, a detector needs to distinguish objects of predefined categories from given images by predicting the precise localization and the correct categorical label. Specifically, the categorical label of a predicted object is represented as a dimensional probability distribution with the format of , where is the number of predefined categories, and denotes the probability of one background category and predefined categories, respectively. The localization predicted by an oriented detector is represented as an OBB. For better comprehensibility, we provide a common formulation of the deep learning based oriented object detection problem.
Given an input image , we assume that there are annotated or ground-truth (GT) objects belonging to predefined categories:
| (1) |
where and denote the categorical label and the GT OBB of -th object, respectively. This format is also applied to the predictions of the detector:
| (2) |
where indicates the number of predicted results, represents the -th probability distribution of predefined categories calculated by the sigmoid function, and denotes the -th regressed OBB.
To train the detector, each prediction is first assigned a positive or negative label. A prediction is positive only if there is at least one GT object that has an RIoU (the intersection over the union area of two OBBs) overlap higher than a preset threshold with it. The threshold is commonly set as 0.5. Otherwise, the prediction is negative. The RIoU between the regressed OBB and the GT OBB can be computed as:
| (3) |
where and denote intersection and union, respectively. Then, for each positive prediction , we assign the GT object with the highest RIoU overlap with it to itself. Note that a single annotated object may be assigned to multiple predictions. Finally, the detector is trained by minimizing the objective function, i.e. the multi-task loss:
| (4) |
where is an annotated object associated with the prediction. is 1 and 0 for positive and negative prediction respectively. and are the numbers of positive predictions and predicted results, respectively. and denote regression loss and classification loss, respectively. The term indicates that the regression loss is activated only for positive predictions and is disabled otherwise. A balancing parameter controls the trade-off between classification and regression.
The main purpose of the loss functions is to quantify the difference between the predictions and the ground truth and to guide the training process of the detector. Therefore, the loss functions significantly impact the detection performance. As an extension of generic horizontal object detection, oriented object detection also adopts the cross-entropy loss (de Boer et al., 2005) or focal loss (Lin et al., 2020) in the classification task. On the other hand, although widely used in generic horizontal object detection, the smooth loss (Girshick, 2015) is not suitable for oriented object detection, which needs to predict the object orientation. More details about loss functions will be discussed in Section 5.
3 Datasets and Performance Evaluation
3.1 Datasets
As a data-driven technology, deep learning is inseparable from various datasets. Throughout the development of object detection based on deep learning, datasets have played an indispensable role not only in training models, but also served as common benchmarks to evaluate and verify model performance (Liu et al., 2020). With the help of challenging datasets, object detection is advanced towards increasingly complex and tough scenarios. In horizontal object detection, a large number of datasets, including PASCAL VOC (Everingham et al., 2010), ImageNet (Russakovsky et al., 2015), Microsoft COCO (Lin et al., 2014), and Open Images (Kuznetsova et al., 2020), have emerged and pushed deep learning based methods to achieve tremendous successes.
With the rapid development of Earth observation technologies, a vast number of high-quality RS images can be easily obtained to build large-scale datasets to study deep learning based algorithms in RS object detection. Recently, several research groups have released their public RS image datasets. Datasets annotated only with HBBs are not covered here, including DIOR (Li et al., 2020), LEVIR (Zou and Shi, 2018), NWPU VHR-10 (Cheng et al., 2014), RSOD (Xiao et al., 2015; Long et al., 2017), xView (Lam et al., 2018), and HRRSD (Zhang et al., 2019). In this subsection, we only focus on introducing RS image datasets annotated with OBBs, including SZTAKI-INRIA (Benedek et al., 2012), 3K vehicle (Liu and Mattyus, 2015), UCAS-AOD (Zhu et al., 2015), VEDAI (Razakarivony and Jurie, 2016), HRSC2016 (Liu et al., 2016b), DOTA (Xia et al., 2018; Ding et al., 2022), ShipRSImageNet (Zhang et al., 2021b), and DIOR-R (Cheng et al., 2022a)]. We introduce the above datasets in detail as follows:
SZTAKI-INRIA (Benedek et al., 2012) contains 665 buildings in 9 multi-sensor aerial or satellite images taken from different cities. Due to the small capacity, this dataset is used to evaluate traditional object detection algorithms.
3K vehicle (Liu and Mattyus, 2015) is created for vehicle detection, comprising 20 images and 14,235 vehicles. The images have a resolution of 5616 3744 and are captured by a DLR camera system at a height of 1,000m above the ground. Therefore, the ground sample distance (GSD) is approximately 13 cm, leading to smaller scale variations. Besides, the images have a similar background. Hence, this dataset is excluded from the evaluation of algorithms on complicated scenes.
VEDAI (Razakarivony and Jurie, 2016) is also proposed for vehicle detection, containing more categories and a wider variety of backgrounds, e.g. fields, grass, mountains, urban area, etc, making the detection more complicated. It comprises 1,210 images with a resolution of . The images are cropped from Very-High-Resolution (VHR) satellite images with a GSD of 12.5cm. However, the dataset only consists of 3,640 instances, because the images with too many dense vehicles are excluded. It is worth mentioning that each image has four color channels, including three visible channels and one 8-bit near-infrared channel.
UCAS-AOD (Zhu et al., 2015) contains 7,482 planes in 1,000 images, 7,114 cars in 510 images, and 910 negative images. All images in this dataset are cropped from Google Earth aerial images. Especially, the instances are carefully selected to ensure their orientations are distributed evenly.
HRSC2016 (Liu et al., 2016b) is a widely-used dataset in ship detection. It contains 1,070 images and 2,976 instances collected from Google Earth. The image resolutions range from 300 300 to 1,500 900. Furthermore, this dataset contains more than 25 categories of ships with large varieties of scales, orientations, appearances, shapes, and backgrounds (e.g. sea, port). Currently, it is one of the most popular datasets for evaluating algorithms of oriented object detection.

DOTA (Xia et al., 2018; Ding et al., 2022) contains large quantities of objects with a considerable variety of orientations, scales, and appearances. The images are selected from different sensors and platforms, including Google Earth, GF-2 Satellite, and UAVs. The size of images ranges from to pixels. What’s more, there are three versions of this dataset.
| V1.0 | V1.5 | V2.0 | ||
| Images | Training | 1,411 | 1,830 | |
| Validation | 458 | 593 | ||
| Test/Test-dev | 937 | 2,792 | ||
| Test-challenge | - | 6,053 | ||
| Total | 2,806 | 11,268 | ||
| Instances | Training | 98,990 | 210,631 | 268,627 |
| Validation | 28,853 | 69,565 | 81,048 | |
| Test/Test-dev | 60,439 | 121,893 | 353,346 | |
| Test-challenge | - | - | 1,090,637 | |
| Total | 188,282 | 403,318 | 1,793,658 | |
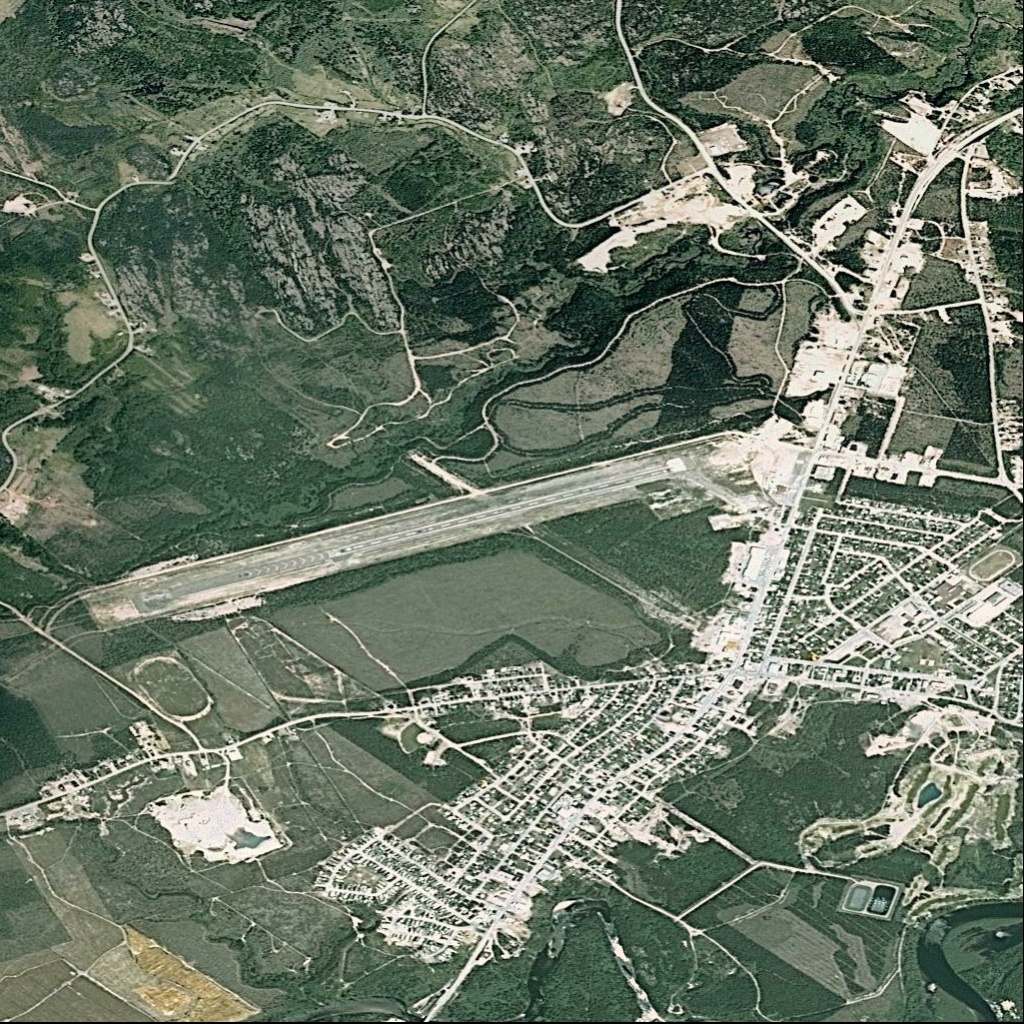
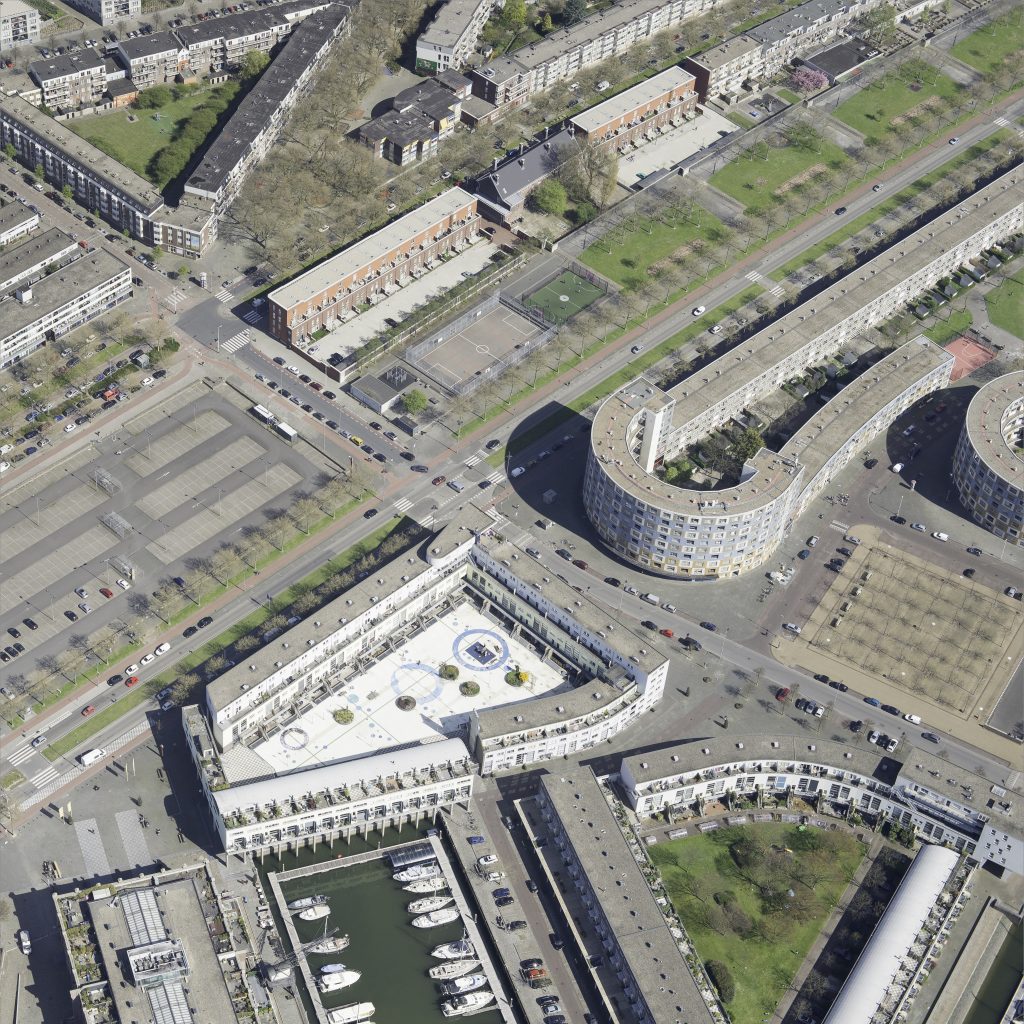
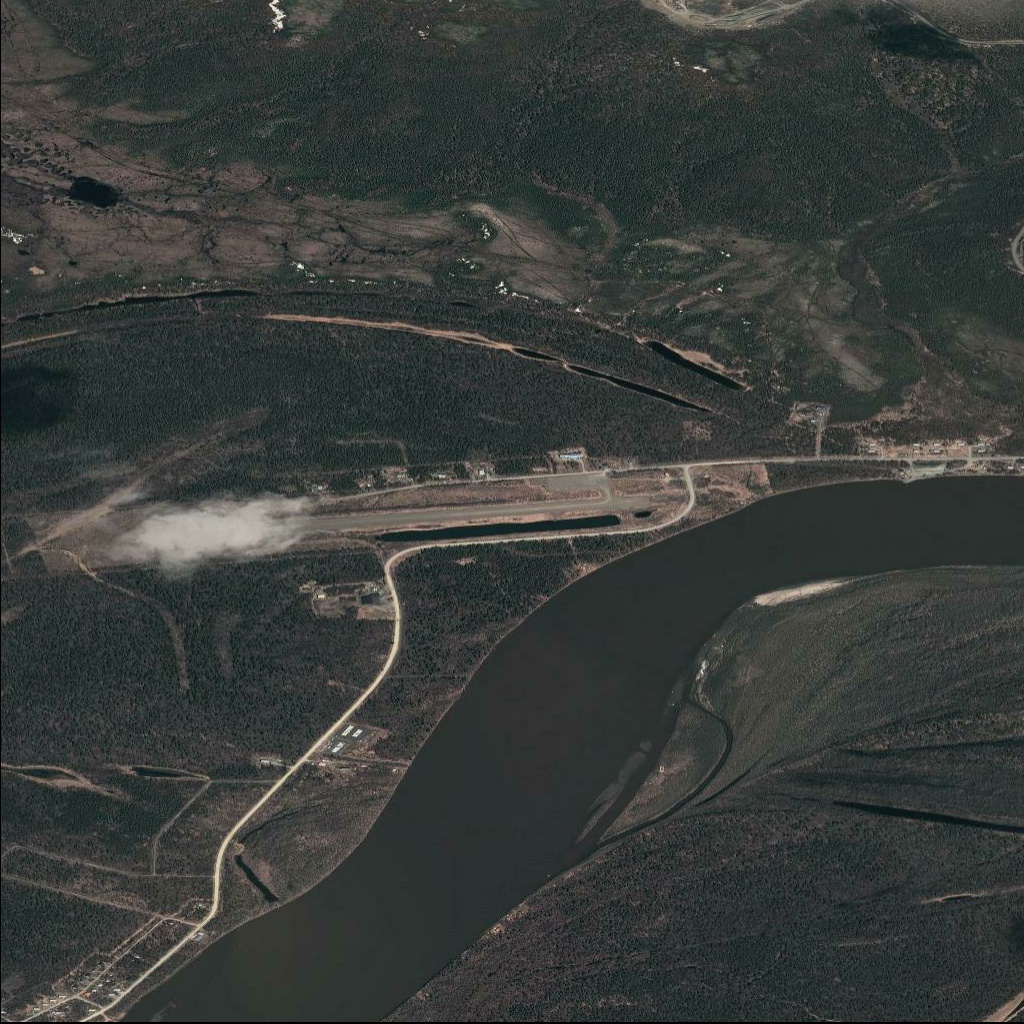
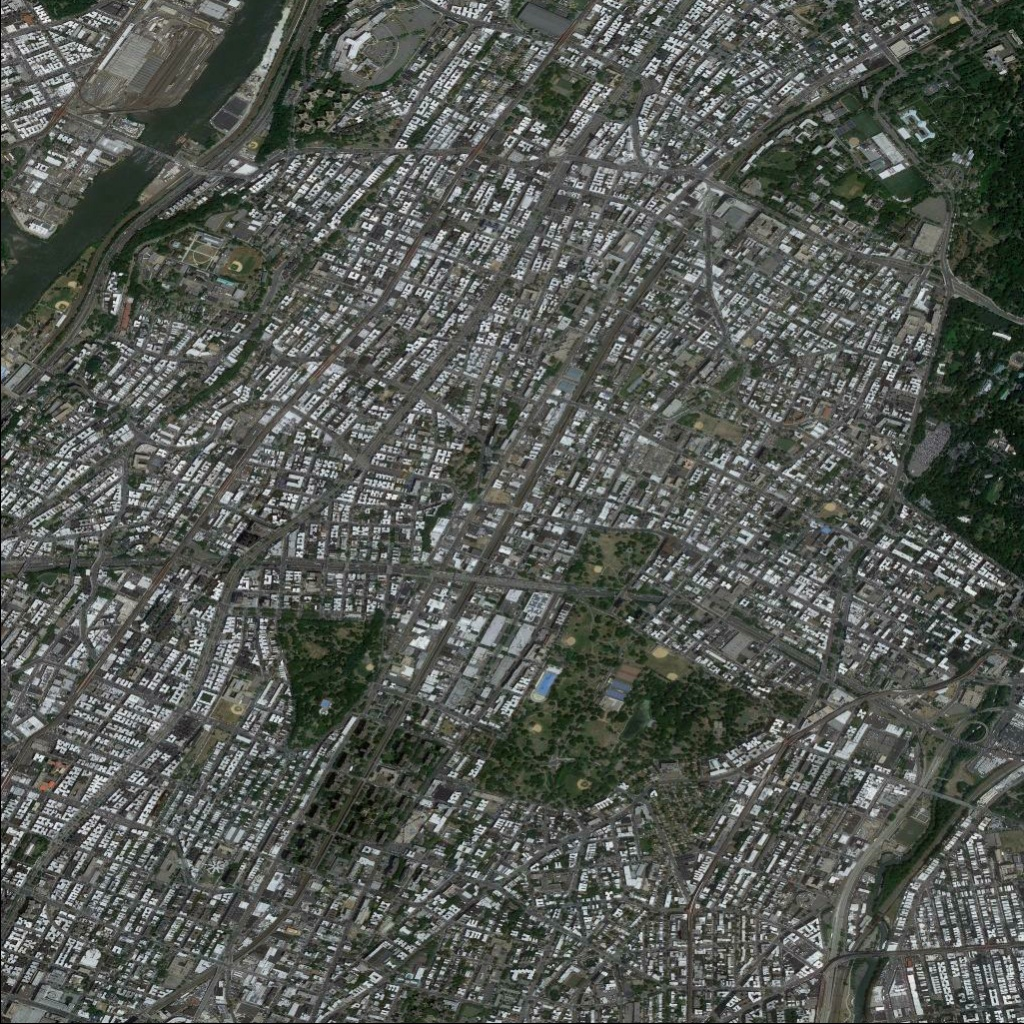
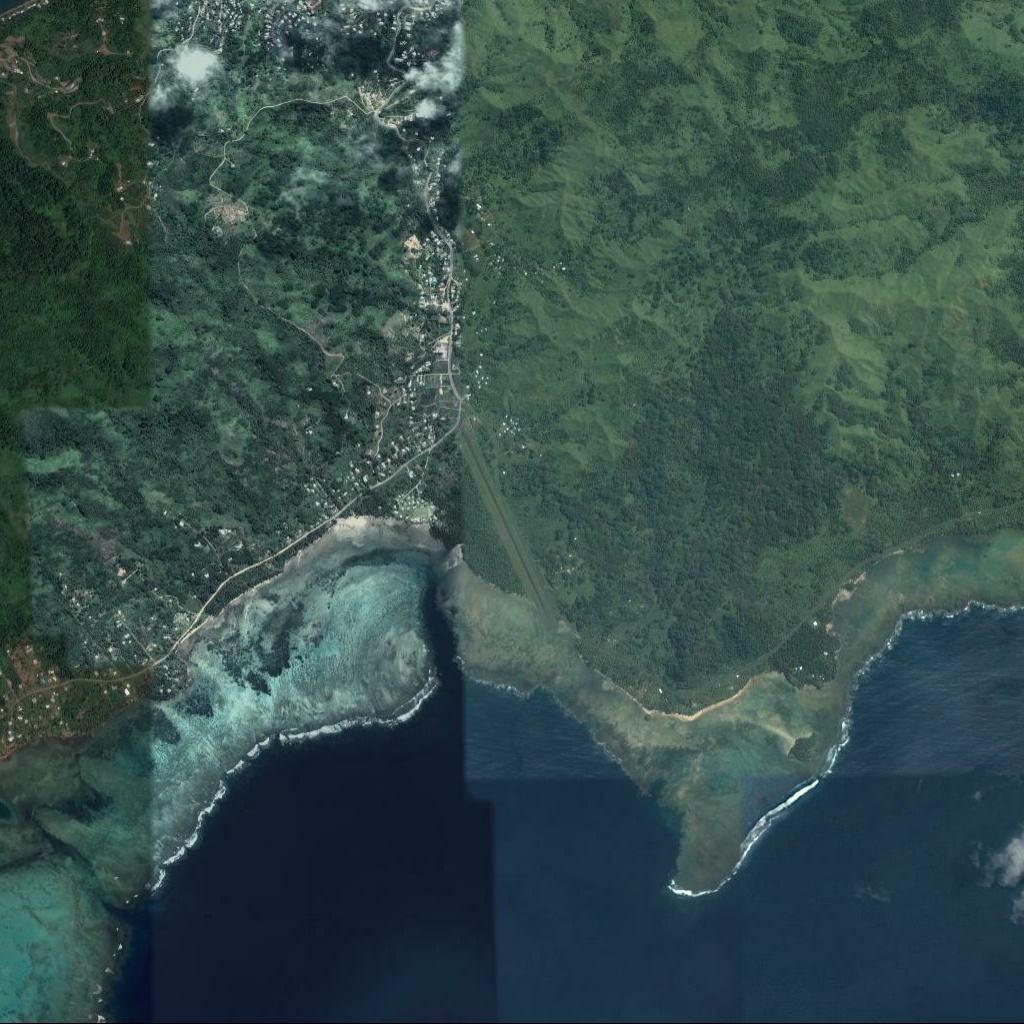
The number of images and instances in three versions of DOTA are summarized in Table 1. DOTA-V1.0 (Xia et al., 2018) and DOTA-V1.5 share the same images, which are split into training, validation and test subsets. As an extension of DOTA-V1.0, DOTA-V1.5 annotates extremely small instances whose sizes are equal to or less than 10 pixels. Besides, DOTA-V1.5 extends a new category, namely container crane. Thus, the number of instances increased from 188,282 to 403,318. Compared with the previous versions, DOTA-V2.0 (Ding et al., 2022) contains more images collected from Google Earth, GF-2 Satellites, and aerial platforms. In addition, a large number of images are taken under an oblique view and a lower foreground ratio to approach the real-world application scenes, as shown in Figure 4. It further adds two new categories, including airport and helipad. The number of instances is increased to about 1.8 million. Moreover, it contains two test subsets, namely test-dev and test-challenge. The latter comprises a greater number of object instances (around 1.1 million) and more complicated scenes, making the task more challenging.
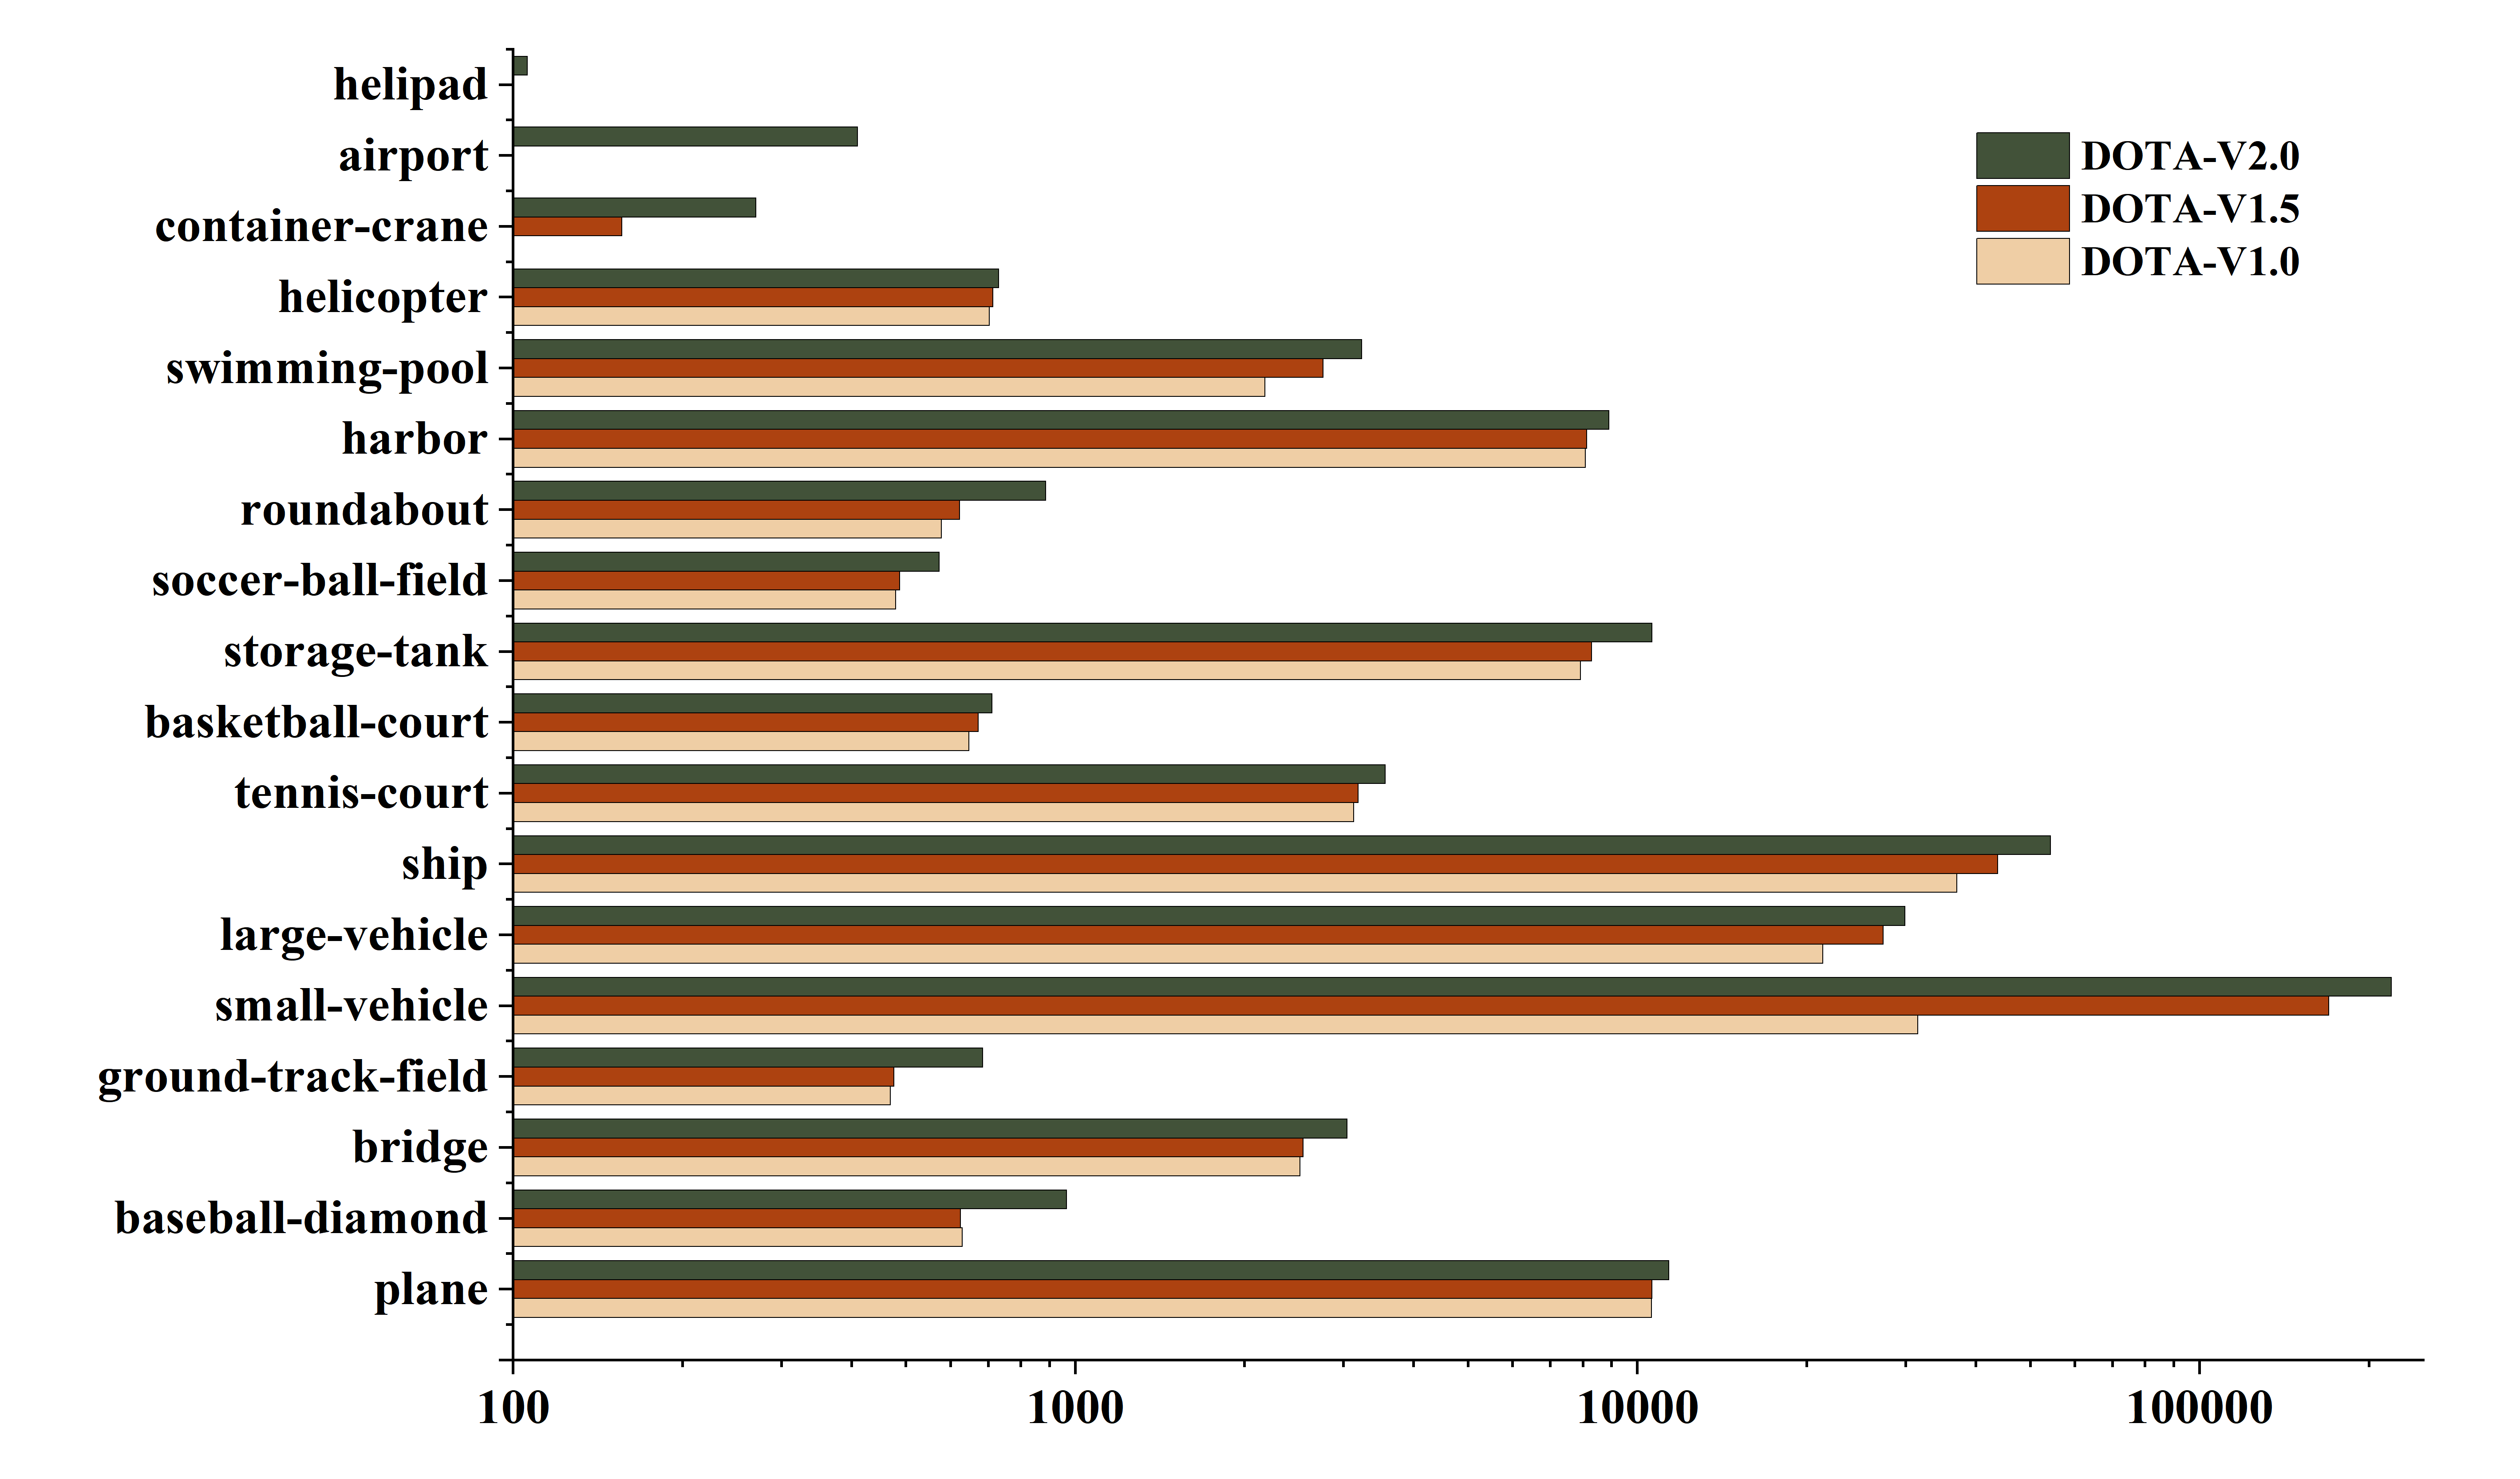
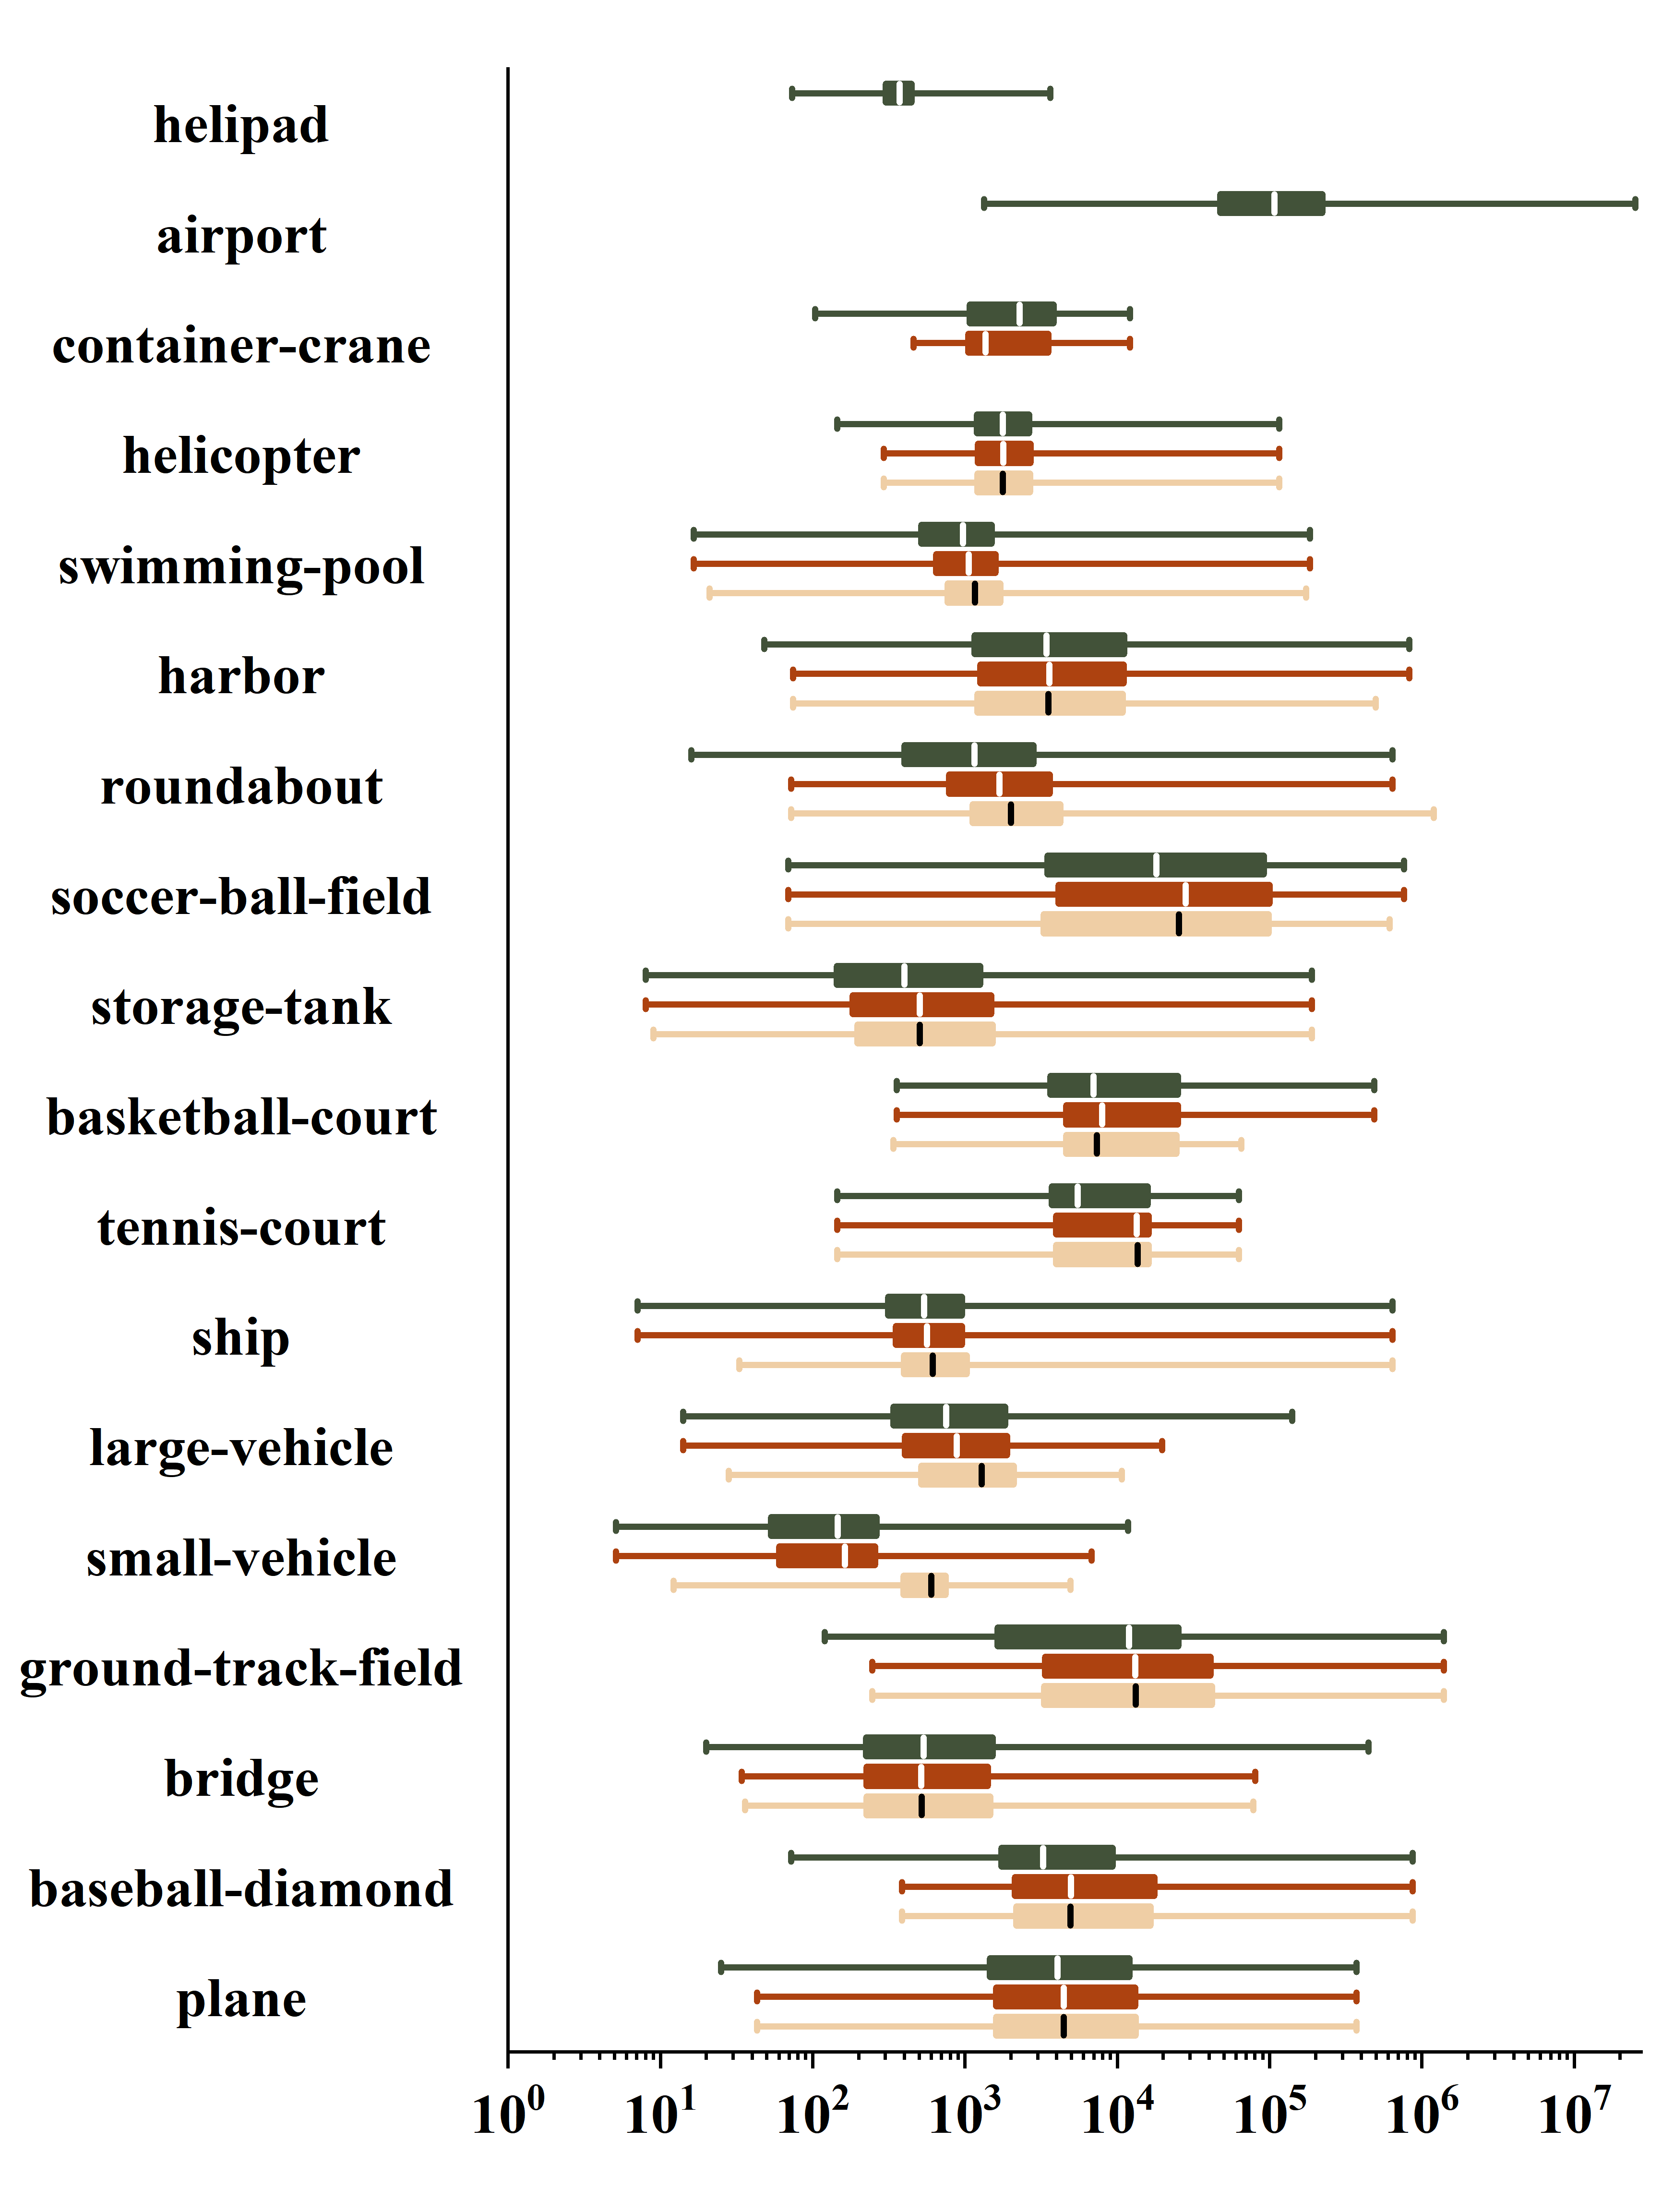
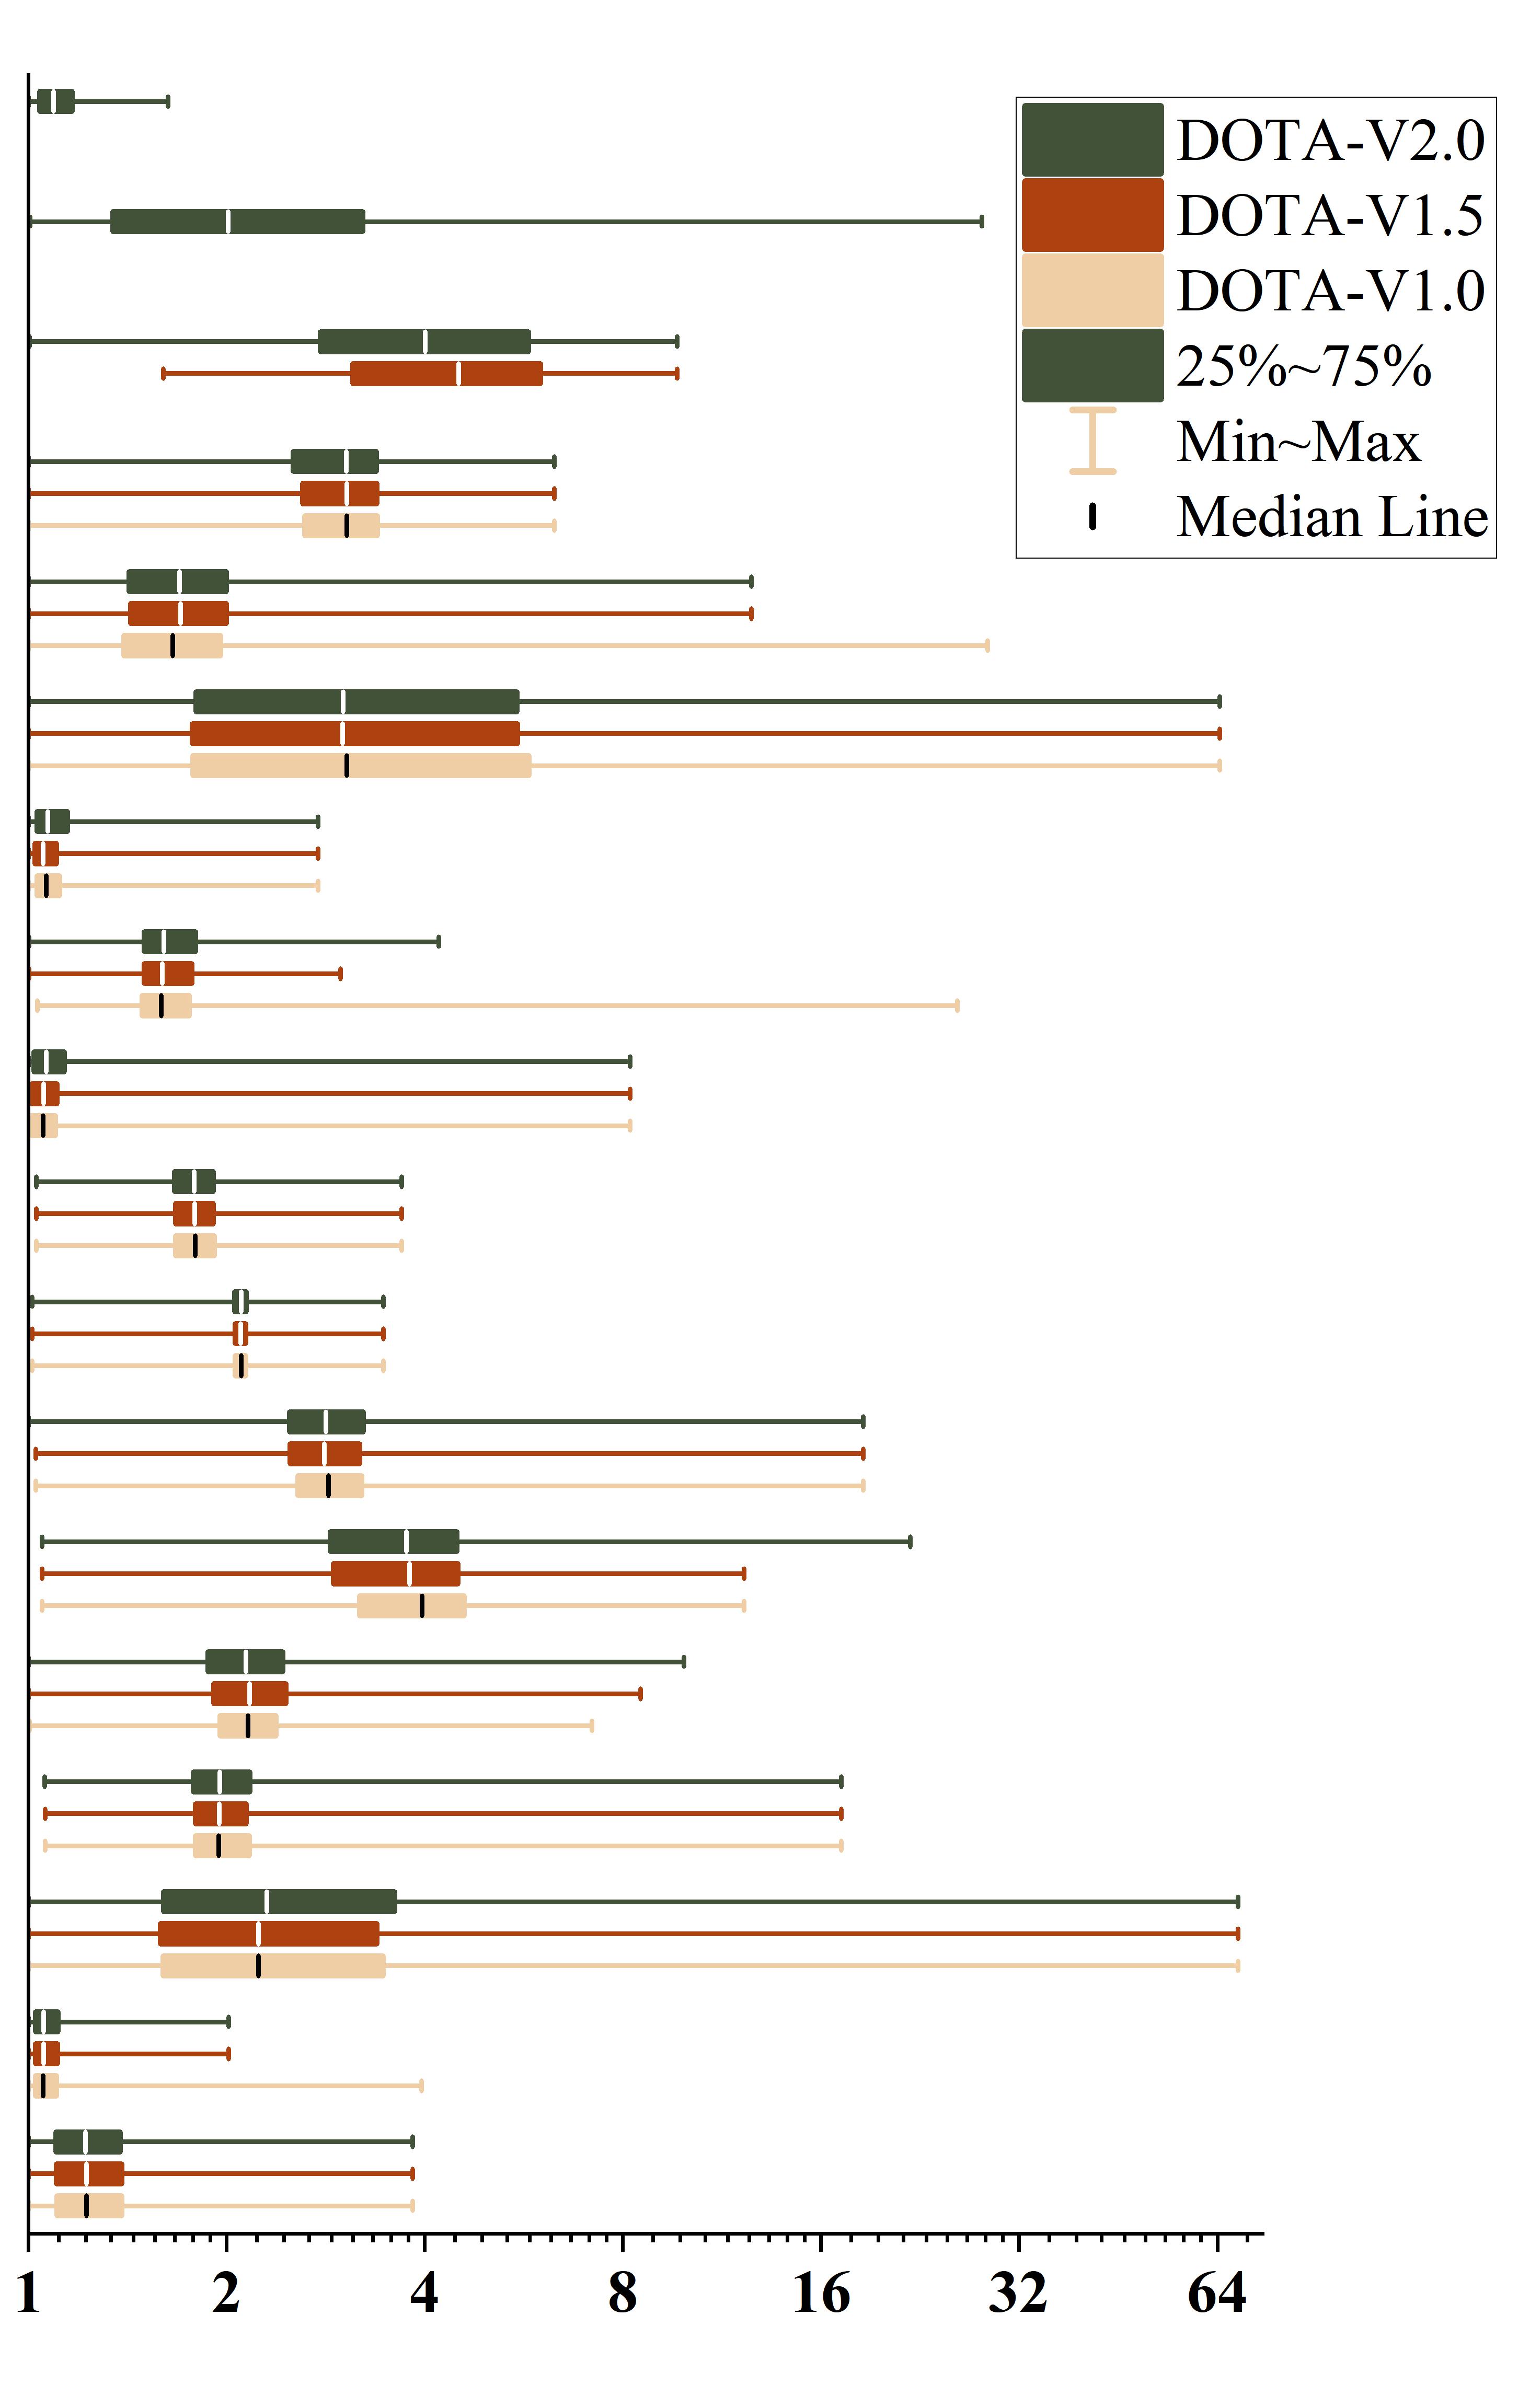
Figure 5 shows the number of instances for each category in training and validation subsets of DOTA-V1.0, V1.5 and V2.0. Note that the distributions of different categories are severely imbalanced. The instances of small-vehicle and ship have a large quantity, while nearly half of the other categories have quantities of less than 1,000, including plane, baseball diamond, ground track field, basketball court, soccer ball field, roundabout, helicopter, container crane, airport and helipad. The severe category imbalance makes the model seriously overfitting to the many-shot categories but underfitting to the low-shot categories (Gupta et al., 2019; Cui et al., 2019; Wang et al., 2021b). Figure 6 further summarizes the size and ratio distributions for each category in three versions of DOTA, respectively. As shown in Figure 6(a), the minimum size is orders of magnitude lower than the maximum size in each category. Moreover, there is also a large range of size differences between categories. Both the inter- and intra-class size variations make the detection tasks more challenging. Figure 6(b) indicates that the aspect ratios of different categories vary greatly. Furthermore, some categories have an extremely large aspect ratio, such as bridge, harbor and airport. Up to now, DOTA is the most challenging dataset for oriented object detection, due to its tremendous object instances, large aspect ratio, significant size variance, and complicated aerial scenes.
FGSD (Chen et al., 2020) is a new fine-grained ship detection dataset expanded based on HRSC2016. This dataset contains 2,612 RS images and 5,634 ship instances from 17 large ports around the world. The instances are classified into 43 categories which are further divided into 4 high-level categories, including submarine, aircraft carrier, civil ship, and warship. Except for ships, a new category named dock is also annotated in this dataset for future research.
ShipRSImageNet (Zhang et al., 2021b) is the largest RS dataset for ship detection. It contains 3,435 images collected from xView (Lam et al., 2018), HRSC2016 (Liu et al., 2016b), FGSD (Chen et al., 2020), Airbus Ship Detection Challenge, and Chinese satellites. Most of the images are sliced into about . A total number of 17,573 ships are divided into 50 categories. There are diverse spatial resolutions, scales, aspect ratios, backgrounds, and orientations in this dataset.
DIOR-R (Cheng et al., 2022a) contains 192,518 instances and 23,463 images. The images are the same as the ones in DIOR (Li et al., 2020), while the instances are annotated in the format of OBB. The GSD ranges from 0.5m to 30m. There are 20 common categories in DIOR-R, including airplane, airport, baseball field, basketball court, bridge, chimney, expressway service area, expressway toll station, dam, golf field, ground track field, harbor, overpass, ship, stadium, storage tank, tennis court, train station, vehicle, and windmill.
| Dataset | Category | Quantity | Instance | GSD | Resolution |
| SZTAKI-INRIA (Benedek et al., 2012) | 1 | 9 | 665 | - | |
| 3K vehicle (Liu and Mattyus, 2015) | 1 | 20 | 14235 | 0.13m | |
| VEDAI (Razakarivony and Jurie, 2016) | 9 | 1210 | 3640 | 0.125m | |
| UCAS-AOD (Zhu et al., 2015) | 2 | 2420 | 14596 | - | |
| HRSC2016 (Liu et al., 2016b) | 25 | 1070 | 2976 | 0.42m | |
| DOTA-V1.0 (Xia et al., 2018) | 15 | 2806 | 188282 | 0.14.5m | |
| DOTA-V1.5 | 16 | 2806 | 403318 | 0.14.5m | |
| DOTA-V2.0 (Ding et al., 2022) | 18 | 11268 | 1793658 | 0.14.5m | |
| FGSD (Chen et al., 2020) | 43 | 5634 | 2612 | 0.121.93m | |
| ShipRSImageNet (Zhang et al., 2021b) | 50 | 3435 | 17573 | 0.126m | |
| DIOR-R (Cheng et al., 2022a) | 20 | 23463 | 192518 | 0.530m |
Table 2 lists the parameters of the above RS datasets for intuitive comparison. As an early large-scale dataset with tremendous instances and various categories, DOTA-V1.0 (Xia et al., 2018) has been widely used to compare the performance of various detectors. Furthermore, as ships usually possess large aspect ratios, the early ship dataset HRSC2016 (Liu et al., 2016b) has also been used to evaluate different detectors.
3.2 Evaluation Protocol
Accuracy and efficiency are both the most crucial criteria in evaluating the performance of oriented object detectors. The evaluation protocol for OBB is different from the one for HBB, because IoU is replaced with RIoU. On the other hand, the efficiency is evaluated using frame per second (FPS), which means the number of image frames processed by detectors per second. Accuracy evaluation takes into account both precision and recall. There are two universally-agreed metrics for accuracy evaluation, namely average precision (AP) and F-measure.
For the object detection task, the detector outputs a list of predicted results , where each item contains an OBB , a category label , and a confidence score . is an index of object order, denotes the number of predicted results. Then, the predicted results whose confidence score is greater than a predefined confidence threshold are assigned to GT objects based on RIoU and category, where , and the superscript denotes the OBB, category label, and GT respectively. To calculate the precision and recall of the detector, the number of true positives (TP) in the predicted results is needed. A predicted result which is assigned a GT object is judged to be a TP if the following criteria are met:
(1) The predicted label is equal to the label of GT object.
(2) The RIoU between the predicted OBB and the GT OBB , denoted by RIoU , is not smaller than the predefined RIoU threshold, which is denoted by and is generally set to 0.5.
Otherwise, it is regarded as a false positive (FP).
Precision is the proportion of correctly predicted instances among the total predicted results, while recall is the proportion of all positive instances predicted by the detector among the total GT objects. The formulas are defined as follows:
| (5) |
| (6) |
where , , and denote the number of TP, FP, and false negative (FN), respectively, which are determined by and . Note that the precision and the recall are functions of the confidence threshold with a fixed .
What’s more, neither precision nor recall can evaluate the accuracy of a detector independently, while the F-measure is a single measure that combines precision and recall using weighted harmonic mean:
| (7) |
where is a weighting parameter. The value of is generally set to 1 to balance the importance of precision and recall. In recent works, AP is the most frequently used metric for accuracy evaluation, which is usually computed for each category separately. For each category, AP is derived using the precision and the recall . Specifically, by varying the confidence threshold from 1.0 to 0.0 gradually, the recall increases as increases and a list of pairs can be obtained. This allows precision to be considered as a discrete function of recall. The discrete function is well-known as the precision-recall curve (PRC), denoted by . The AP value is obtained by computing the average value of precision over the interval from to :
| (8) |
Therefore, AP also can be considered as the area under PRC. Finally, to evaluate the overall accuracy of all categories, the mean AP (mAP) averaged over all categories is adopted as the final metric of evaluation.
4 Detection Frameworks
There are numerous oriented object detection methods built on generic horizontal object detection methods. Consequently, the deep learning models of mainstream oriented object detection can also be roughly divided into anchor-based and anchor-free methods.
4.1 Anchor-based
Anchor-based methods localize objects via a regression mode, which can further be divided into two-stage (or multi-stage) and one-stage detection frameworks. In the pipeline of a two-stage detector, a sparse set of category-independent region proposals, that can potentially contain objects, are generated in the first stage (Chavali et al., 2016; Hosang et al., 2016). In the second stage, the features in the region of interest (RoI) are extracted from the feature maps for each proposal, and then are used for classification and refined regression. Finally, post-processing operation, such as NMS, is adopted to output detection results. In contrast, there is no region proposal generation in a one-stage detector, which directly locates and classifies objects using DCNNs. Therefore, one-stage detectors have a simpler pipeline. Nevertheless, the accuracy of one-stage detectors is lower than two-stage detectors (Ding et al., 2019; Xie et al., 2021; Lin et al., 2020; Yang et al., 2021b). The primary advantage of one-stage detectors is the fast inference speed, which is desired in real-time applications. The properties of several two-stage and one-stage detection frameworks are summarized in Table 3 and Table 4 respectively.
4.1.1 Two-stage
| Method | Baseline | backbone | mAP1 | Highlights |
| Rotated Faster RCNN | Faster RCNN | R-1012 | 54.13 | A classical two-stage framework and a typical baseline for most of two-stage rotated detectors. |
| (Ren et al., 2017) | ||||
| RRPN | Rotated Faster RCNN | R-101 | 61.01 | Use rotated anchors to generate rotated proposals. |
| (Ma et al., 2018) | ||||
| Rotated Faster RCNN | R-101 | 69.56 | Propose an RRoI learner to convert HRoIs to RRoIs and an RPS RoI Align to extract spatially rotation-invariant feature maps. | |
| RoI Transformer | ||||
| (Ding et al., 2019) | ||||
| RoI Transformer | ReR-50 | 80.10 | Use rotation equivariant networks and RiRoI Align to extract rotation-invariant feature in both spatial and orientation dimensions. | |
| ReDet | ||||
| (Han et al., 2021a) | ||||
| ReDet | ReR-50 | 80.37 | Design a dynamic enhancement anchor network to generate more qualified positive samples and enhance the performance of small objects. | |
| DEA | ||||
| (Liang et al., 2022) | ||||
| Rotated Faster RCNN | R-50 | 80.87 | Design a lightweight module to generate oriented proposals and a midpoint offset representation. Achieve competitive accuracy to advanced two-stage detectors and reach approximate efficiency to one-stage detectors. | |
| Oriented RCNN | ||||
| (Xie et al., 2021) | ||||
| KFIoU | RoI Transformer | Swin-T | 80.93 | Design the KFIoU loss based on Kalman filter to achieve the best trend-level alignment with RIoU. |
| (Yang et al., 2022) | ||||
| Oriented RCNN | ViTAE | 81.24 | Use MAE (He et al., 2022) to pretrain the plain ViTAE transformer. Employ RVSA to learn adaptive window sizes and orientations in a data-driven manner. | |
| RVSA | ||||
| (Wang et al., 2022) |
-
1
The “mAP” column indicates the mAP on DOTA-V1.0 (Xia et al., 2018) when the RIoU threshold is set to 0.5. The results of these methods are the best reported results from corresponding papers.
-
2
R-101 denotes ResNet-101, likewise for R-50, R-152. ReR-50 denotes the Rotation equivariant ResNet-50 (Han et al., 2021a). Swin-T and ViTAE denote the tiny version of Swin Transformer (Liu et al., 2021b) and Vision Transformer (Dosovitskiy et al., 2021; Xu et al., 2021b; Zhang et al., 2023)(the same below).
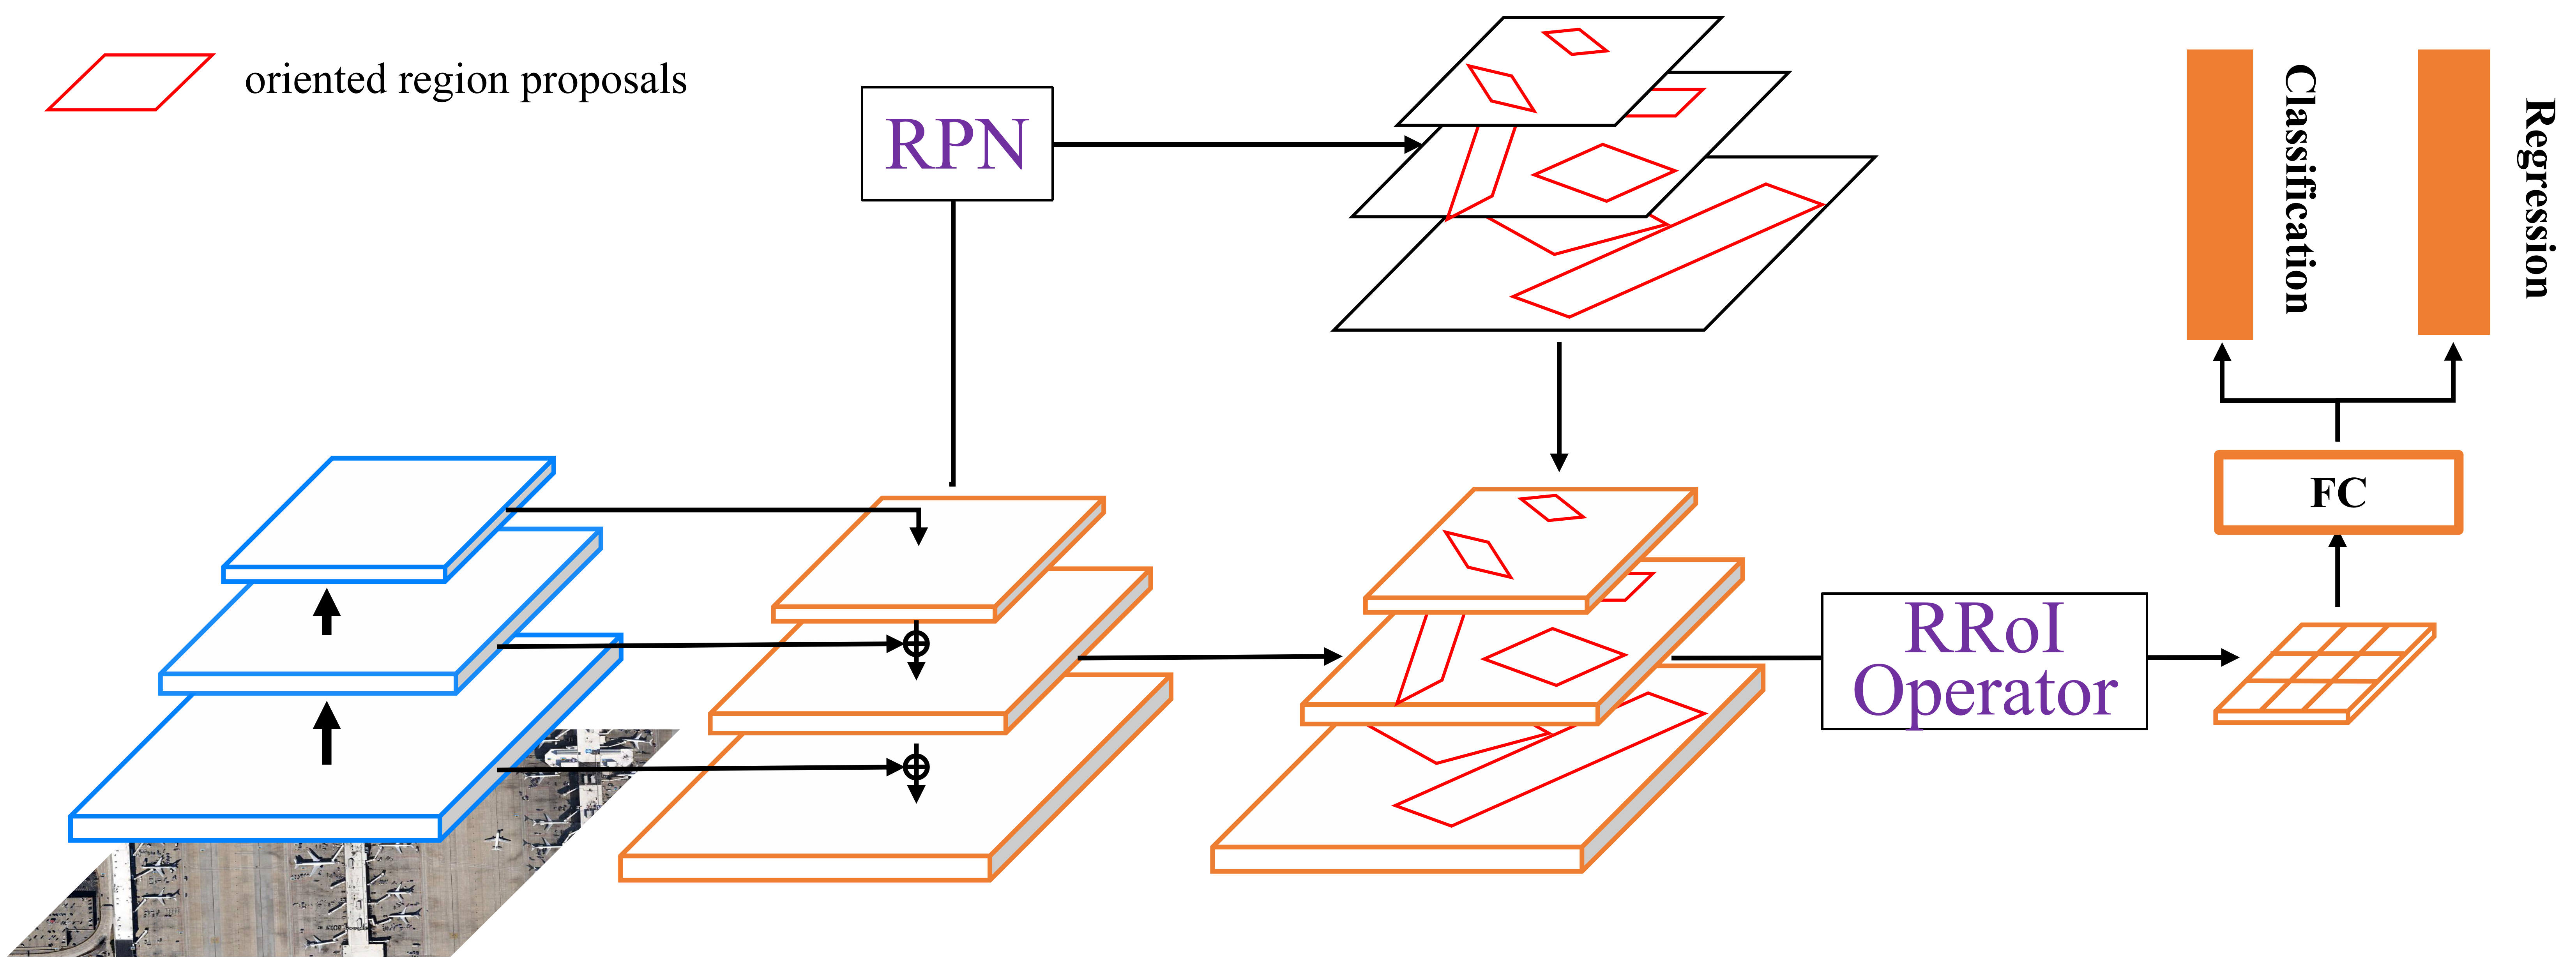
Rotated Faster RCNN. Recently, Faster RCNN (Ren et al., 2017) received considerable attention as a classical two-stage generic horizontal object detection framework, showing high accuracy and efficiency. As a result, a variety of improvements or extending efforts based on Faster RCNN are proposed, including FPN (Lin et al., 2017), Cascade RCNN (Cai and Vasconcelos, 2018), Mask RCNN (He et al., 2020b), and DetectoRS (Qiao et al., 2021). FPN can extract rich high-level semantic information at different scales via a top-down architecture with lateral connections, as well as detect region proposals at multi-level feature maps. The combination of Faster RCNN and FPN shows significant improvement in multi-scale detection, especially for small objects. Thus, Faster RCNN armed with FPN becomes a benchmark in the task for object detection. By adding an additional output channel to regress the orientation of each object, its extending work, termed Faster RCNN OBB or Rotated Faster RCNN (Ren et al., 2017; Xia et al., 2018), can easily be employed for oriented object detection and also serves as a benchmark. As illustrated in Figure 7, the framework of Rotated Faster RCNN consists of the following pipeline:
(1) Feature maps generation. The backbone networks composed of CNN modules and the FPN structure are both utilized to extract multi-level feature maps with strong semantic information at multi-scales, which are also widely used in one-stage frameworks.
(2) Region proposal networks (RPN). RPN takes a feature map (of any size) as input and generates a collection of horizontal region proposals by sliding a tiny network over the input feature map. At each sliding position in the feature map, RPN first initializes a total of reference boxes of different scales and aspect ratios, where , where and denote the number of scales and aspect ratios, respectively. Each anchor of the input feature map is mapped to a lower-dimensional feature vector, which is then fed into two sibling fully connected (FC) layers: a binary classification layer that estimates the probability of objects existing and a regression layer that refines the location of anchor coarsely. Thus, RPN simultaneously predicts region proposals at each sliding position. However, negative anchors will predominate as only a few locations contain objects, and dominate the gradient during training. To address this issue, a random sampling operator is adopted to make the proportion between positive and negative anchors up to 1:1. In a word, RPN outputs a certain number of horizontal region proposals with a coarse location.
(3) Regions with CNN features (RCNN). An RoI operator, e.g. RoI Pooling (Ren et al., 2017), RoI Align (He et al., 2020b), or deformable RoI Pooling (Dai et al., 2017), is adopted to convert the features map inside any region proposal of different spatial extent into a small feature map with a fixed size. Then each fixed-size feature map is fed into two sibling FC layers: one estimates probabilities over all categories plus background, and another regresses the orientation and refines the coarse location suggested by RPN.
However, However, since the naive RPN only generates a set of horizontal region proposals (as RoIs), there are non-negligible misalignments between the HBBs and rotated objects. Especially, several oriented and crowded objects may be contained by one horizontal RoI (HRoI). As a result, the feature maps of these HRoIs contain irrelevant information, making classification and localization more challenging yet inspiring successive innovations.
Many recent advances in two-stage oriented object detection greatly benefit from the frameworks of Rotated Faster RCNN, leading to an enormous number of improved detection methods. Some typical two-stage oriented object detection methods are reviewed as follows, including RRPN (Ma et al., 2018; Yang et al., 2018a; Zhang et al., 2018), RoI Transformer (Ding et al., 2019), oriented RCNN (Xie et al., 2021), and DODet (Cheng et al., 2022b).
Rotated RPN (RRPN). As horizontal anchors and HRoIs are insufficient for oriented object detection in RS images, RRPN (Ma et al., 2018; Yang et al., 2018a; Zhang et al., 2018) are designed with rotated anchors to fit the objects with different orientations and generate rotated proposals. Specifically, in addition to scales and aspect ratios, different orientation parameters are added to further generate additional anchors, which are then fed into OBB regression layers to refine the rotated region proposals. To eliminate irrelevant interference information, the rotated RoI (RRoI) operators, including RRoI-Pooling or RRoI Align (Yang et al., 2018a), are designed to extract a fixed-size feature map, according to the rotated proposals. Thanks to the rotated anchors and the RRoI operators, RRPN achieves better performance in terms of recall. However, RRPN still has several significant drawbacks: (1) To maintain the trade-offs between orientation coverage and computational complexity, the number of orientation samples is limited. Therefore, it is intractable to obtain accurate RRoIs to pair with all rotated objects. (2) The number of densely rotated anchors is times that of anchors generated by RPN, leading to expensive computation and memory consumption, where denotes the number of orientations. (3) A large amount of rotated anchors degrades the efficiency of matching proposals with GT objects, because there are plenty of redundant RIoUs and the computation of RIoU is more complex than IoU.
RoI Transformer. To reduce the number of rotated anchors, RoI Transformer (Ding et al., 2019) retains a naive RPN structure and introduces a lightweight learnable module, named RoI Learner. Aiming at directly converting HRoIs to RRoIs, RRoI Learner is composed of three components: a position-sensitive RoI Align (Dai et al., 2016) for extracting HRoI features, a lightweight FC layer for regressing the offsets between GT OBB and HRoI, and an OBB decoder for outputting the RRoI by decoding HRoI and offsets. Then a rotated position-sensitive RoI Align (RPS RoI Align) receives these RRoIs and further extracts spatially rotation-invariant feature maps, which are used in the final tasks of classification and regression. Such a design generates precise RRoIs without enormous rotated anchors, resulting in higher efficiency and accuracy.
Oriented RCNN. Although the RoI Transformer significantly boosts accuracy and efficiency, it involves an additional stage to produce RRoIs, making the networks complex and heavy. As a result, Xie et al. (2021) designs a simpler structure, named oriented RPN, to generate high-quality RRoIs from horizontal anchors. To reduce computation costs, oriented RPN only contains a convolutional layer and two sibling convolutional layers. This lightweight module benefits from the proposed novel OBB representation, named midpoint offset representation. For an oriented object, its midpoint offset representation consists of six parameters , where refers to its external HBB, denote the offsets w.r.t the midpoints of the top and right sides of the external HBB, respectively. The external HBB can provide bounded constraint for OBB and the offsets can avoid the periodicity of angle (PoA) problem. Benefiting from the design of oriented RPN and midpoint offset representation, Oriented RCNN can achieve competitive accuracy to advanced two-stage detectors and reach approximate efficiency to one-stage detectors.
DODet. To avoid the spatial and feature misalignments between horizontal proposals and oriented objects, Cheng et al. (2022b) designs the dual-aligned oriented detector (DODet), consisting of an oriented proposal network (OPN) and a localization-guided detection head (LDH). OPN is a lightweight network to generate high-quality rotated proposals. Besides, a new OBB representation is designed to better adapt objects with large aspect ratios, which replaces the width and height with aspect ratio and area. LDH is used to address the feature misalignments between regression and classification. The regression head is first adopted to generate more accurate OBBs. These OBBs are then used as guidance to refine the classification features. With the design of new OBB representation and feature alignments, DODet can achieve substantial improvement for objects with large aspect ratios and reached mAP on HRSC2016 dataset.
4.1.2 One-stage
| Method | Baseline | backbone | mAP | Highlights |
| Rotated RetinaNet | RetinaNet | R-50 | 68.43 | Design the focal loss to mitigate class imbalance. A typical baseline for most of one-stage rotated detectors. |
| (Lin et al., 2020) | ||||
| R3Det | Rotated RetinaNet | R-152 | 76.47 | Use FRM to refine features and design a differentiable SkewIoU loss. |
| (Yang et al., 2021b) | ||||
| Deformable DETR | R-50 | 79.22 | An end-to-end transformer-based rotated detector. Use OPG to generate oriented proposals and design OPR to refine these oriented proposals. | |
| AO2-DETR | ||||
| (Dai et al., 2022) | ||||
| S2A-Net | Rotated RetinaNet | R-50 | 79.42 | Use FAM to align features and adopt ODM to extract oriented-sensitive features. |
| (Han et al., 2022a) | ||||
| GWD | R3Det | R-152 | 80.23 | First present a Gaussian Wasserstein distance based loss to model the deviation between two OBBs. |
| (Yang et al., 2021c) | ||||
| KLD | R3Det | R-152 | 80.63 | Similar to GWD, it adopts KLD instead of GWD to achieve more accurate detection. |
| Yang et al. (2021d) | ||||
| KFIoU | R3Det | R-152 | 81.03 | Design the KFIoU loss based on Kalman filter to achieve the best trend-level alignment with RIoU. |
| (Yang et al., 2022) |
Different from two-stage detection frameworks working in a coarse-to-fine paradigm, one-stage detectors directly predict the class probabilities and locations of objects without using region proposal networks and RoI operators. Hence, one-stage detectors are therefore more efficient and better adapted for real-time detection. Recently, a line of classical one-stage algorithms has emerged and achieved significant progress, including Rotated RetinaNet (Lin et al., 2020), R3Det (Yang et al., 2021b), and S2A-Net (Han et al., 2022a).
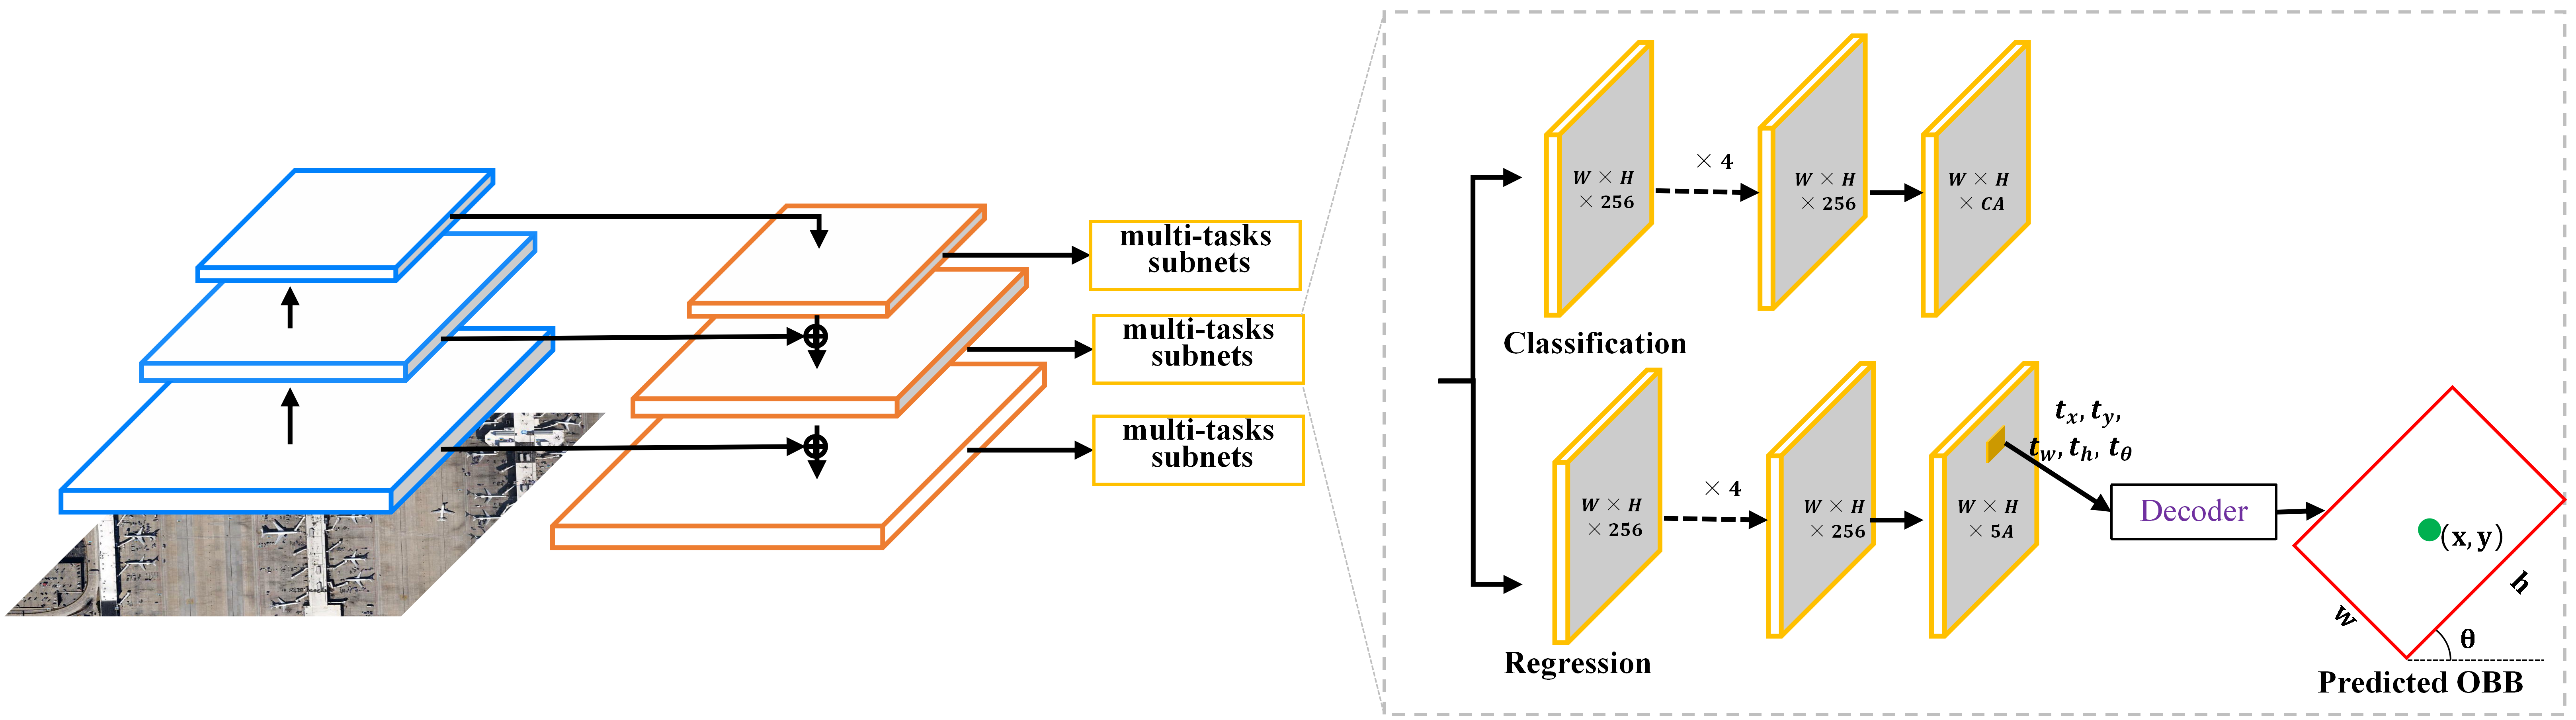
Rotated RetinaNet. Lin et al. (2020) proposed RetinaNet with focal loss to effectively mitigate class imbalance during the training process, achieving accuracy comparable to two-stage detectors. As a result, the RetinaNet-based rotated detector, named Rotated RetinaNet, is used as a benchmark. As illustrated in Figure8, Rotated RetinaNet first extracts multi-level feature maps via CNN modules with FPN. Then, a certain number of anchors are initialized. For each anchor per spatial location, the relative offset between the anchor and the GT OBB is predicted by a regression head. Meanwhile, the class probability of each anchor is predicted by a classification head. In contrast to class-agnostic RPN which only distinguishes between the background and foreground of each anchor, the classification head predicts probabilities over all categories. What’s more, both heads are deeper than RPN and do not share parameters.
Although its architecture is simple and computationally efficient, Rotated RetinaNet still lags behind the current advanced two-stage oriented detectors in terms of accuracy. The first reason is that horizontal anchors cannot tightly cover the oriented objects, leading to misalignment between objects and anchors. What’s more, the convolutional features are typically axis-aligned and possess fixed receptive fields, while objects are distributed with arbitrary orientations and various scales. As a result, the corresponding feature of an anchor is unable to precisely represent the object, especially when the object has an extreme aspect ratio. To solve these issues, numerous refined detectors (Yang et al., 2021b; Han et al., 2022a) are proposed to align objects and anchors, using a fully convolution block instead of a RoI operator which requires massive time-consuming region-wise processes.
Refined Rotation RetinaNet (R3Det). R3Det (Yang et al., 2021b) refines Rotated RetinaNet using a feature refinement module (FRM). It works in a coarse-to-fine paradigm. Specifically, R3Det first generates multi-level feature maps and then transforms the horizontal anchors to refined rotated anchors, which can provide more accurate position information. To align and reconstruct feature maps, FRM employs pixel-wise feature interpolation to sample features from five locations (i.e., one center and four corners) of the corresponding refined rotated anchors and sums them up. In addition, an approximate RIoU loss, named SkewIoU loss, is designed to solve the indifferentiable problem of RIoU, enabling stable training and accurate localization.
Single-shot Alignment Network (S2A-Net). Similar to R3Det, S2A-Net (Han et al., 2022a) also selects Rotated RetinaNet as the baseline. To achieve feature alignment and alleviate the inconsistency between regression and classification, a feature alignment module (FAM) and an oriented detection module (ODM) are designed. FAM first generates high-quality rotated anchors from horizontal anchors via an anchor refinement network. Then, it adaptively aligns the features with an alignment convolution (AlignConv). Specifically, AlignConv is a variant of deformable convolution (Dai et al., 2017), which infers the offsets with the guide of refined rotated anchors to extract rotated grid-distributed features. While the classification task requires orientation-invariant features, the regression task benefits from the orientation-sensitive features, resulting in the inconsistency between regression and classification. Therefore, inspired by Rotation-sensitive Regression Detector (Liao et al., 2018), ODM adopts active rotating filters (Zhou et al., 2017) to extract orientation-sensitive features for regression. Then a pooling operator is employed to extract orientation-invariant features from the orientation-sensitive features for classification.
4.2 Anchor-Free
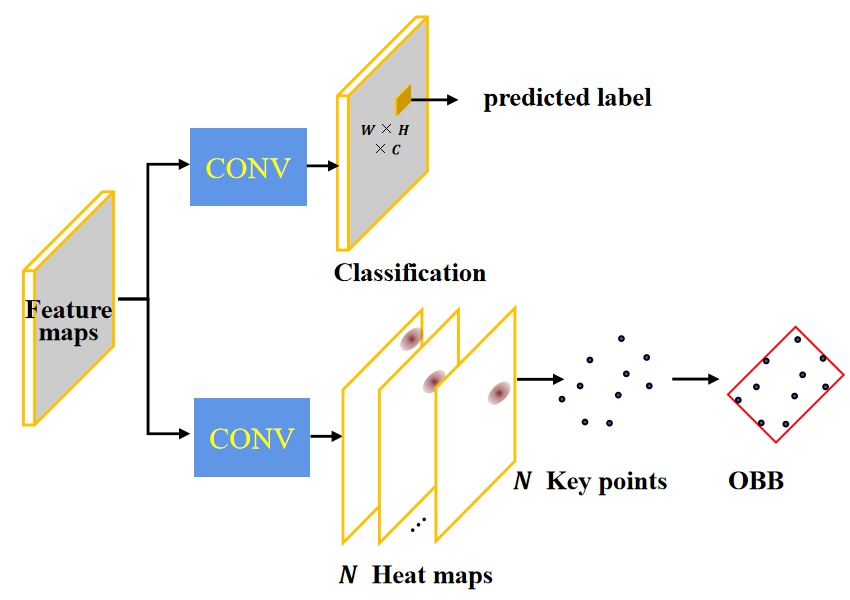
While the anchor-based methods play a very important role and make significant improvements in object detection, they still suffer from some critical drawbacks. Firstly, the predefined anchors are designed manually and have several hand-crafted components, including scales, aspect ratios, and even orientations, which are fixed during training and cannot be adjusted adaptively. Secondly, the hand-crafted anchors have trouble matching objects with different scales or orientations. Thirdly, most of the anchors are negative, leading to an imbalance between positive and negative samples. To tackle the above issues, a constellation of anchor-free methods is developed to find objects without preset anchors. These anchor-free methods eliminate anchor-related hyper-parameters and have achieved comparable performance with anchor-based methods, showing potential in the generalization to wide applications (Zhang et al., 2020c). According to the representation of OBB, anchor-free methods can be divided into keypoint-based methods (Guo et al., 2021; Wei et al., 2020) and center-based methods (Guan et al., 2021; He et al., 2021; Lin et al., 2019; Xiao et al., 2020b; Yi et al., 2021; Zhang et al., 2022; Zhou et al., 2020; Zhao et al., 2021).
The keypoint-based methods first locate a set of adaptive or self-constrained key points and then circumscribe the spatial extent of the object, as shown in Figure 9(a). O2-DNet (Wei et al., 2020) first locates the midpoints of four sides of the OBB by regressing the offsets from the center point. Then, two sets of opposite midpoints are connected to form two mutually perpendicular midlines which can be decoded to get the representation of OBB. In addition, a self-supervision loss is designed to constrain the perpendicular relationship between two middle lines and a collinear relationship between the center point and two opposite midpoints. Following the RepPoints (Yang et al., 2019b), CFA (Guo et al., 2021) utilizes the deformable convolution (Dai et al., 2017) to generate a convex hull for each oriented object. The convex hull is represented by a set of irregular sample points bounding the spatial extent of an object, which are determined by the designed Convex Intersection over Union (CIoU) loss. To alleviate feature aliasing between densely packed objects, convex-hull set splitting and feature anti-aliasing strategies are designed to refine the convex-hulls and adaptively optimal feature assignment. To predict the high-quality oriented reppoints, Oriented RepPoints (Li et al., 2022b) further designs an Adaptive Points Assessment and Assignment (APAA) scheme to measure the quality of reppoints. Such a scheme assesses each set of reppoints from four aspects, including classification, localization, orientation alignment, and point-wise correlation. As a result, the high-quality reppoints obtained by APAA enable Oriented RepPoints to achieve state-of-the-art performance among anchor-free methods.
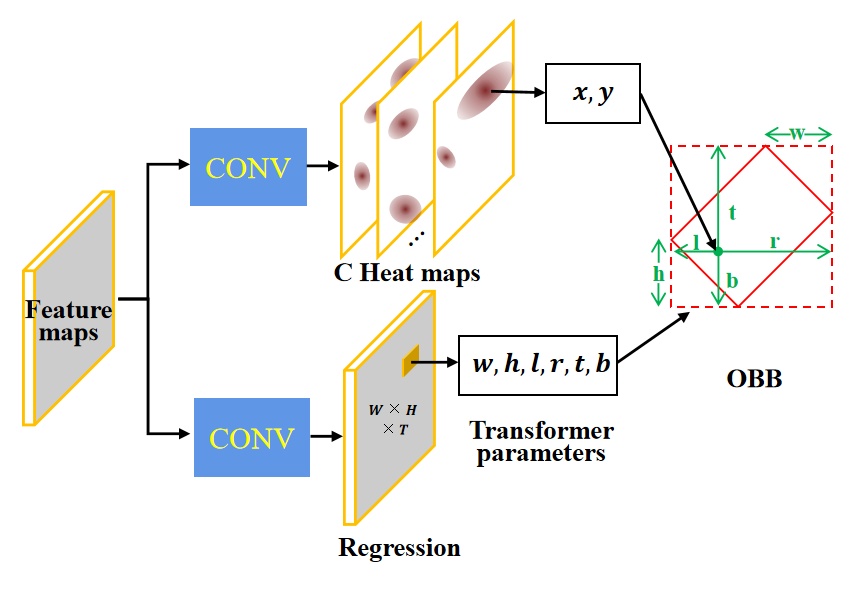
The center-based methods generally generate multiple probabilistic heatmaps and a series of feature maps. As shown in Figure 9(b), the heatmaps provide a set of candidates (peak points) as coarse center points. Meanwhile, the feature maps regress transformation parameters to accurately represent the OBB. The heatmaps are denoted by , where and denote the width and height of original image respectively, represents the number of predefined categories, is a scale factor. The GT heatmaps are formed by producing a locally high energy region near the center point of each object. The value at the center point of each object on the heatmaps is set to 1, the value near the center point is determined by the Gaussian kernel, and the rest regions are set to . The pipeline of center-based methods comprises two steps. A number of peak points are first selected as coarse center points from the probabilistic heatmaps. Then, transformation parameters, including the center points offset, object sizes, and angle, are regressed on the corresponding feature maps at the position of each coarse center point. However, the center-based methods typically follow the one-stage paradigms and tend to predict coarse locations, while state-of-the-art methods generally contain one or multiple refine stages to improve the performance. Thus, an effective scheme for performance improvement is leveraging anchor-free methods to generate coarse proposals that are then refined to generate high-quality proposals or detection results, e.g. AOPG (Cheng et al., 2022a), DEA (Liang et al., 2022). This could be attributed to the fact that the anchor-free rotated proposal generation scheme can not only generate accurate proposals but also avoid the problems caused by horizontal anchors. Nevertheless, there is still a significant performance gap between plain center-based oriented methods and other state-of-the-art methods, necessitating further future research.
4.3 Anchor-based vs. Anchor-free
Although anchor-based and anchor-free frameworks show their own merits, there are also shortcomings in specific scenarios. For instance, in terms of small objects, it is difficult for anchor-based methods to obtain positive samples, due to the low IoU between small objects and predefined anchors. In contrast, anchor-free methods only need to select a point as a positive sample for a small object. On the other hand, anchor-free methods show worse performance for objects of large size and extreme aspect ratio.
To cope with the above dilemma, the suitable OBB representation and the powerful feature representation of oriented objects are also widely studied, since they can be seamlessly integrated into both anchor-based and anchor-free frameworks. In the following, we discuss the OBB representation and feature representation in Section 5 and Section 6, respectively.
5 OBB Representations
The most frequently-used methods of OBB representation are the -based representation and the quadrilateral representation, consisting of five and eight parameters respectively.
5.1 -based representation
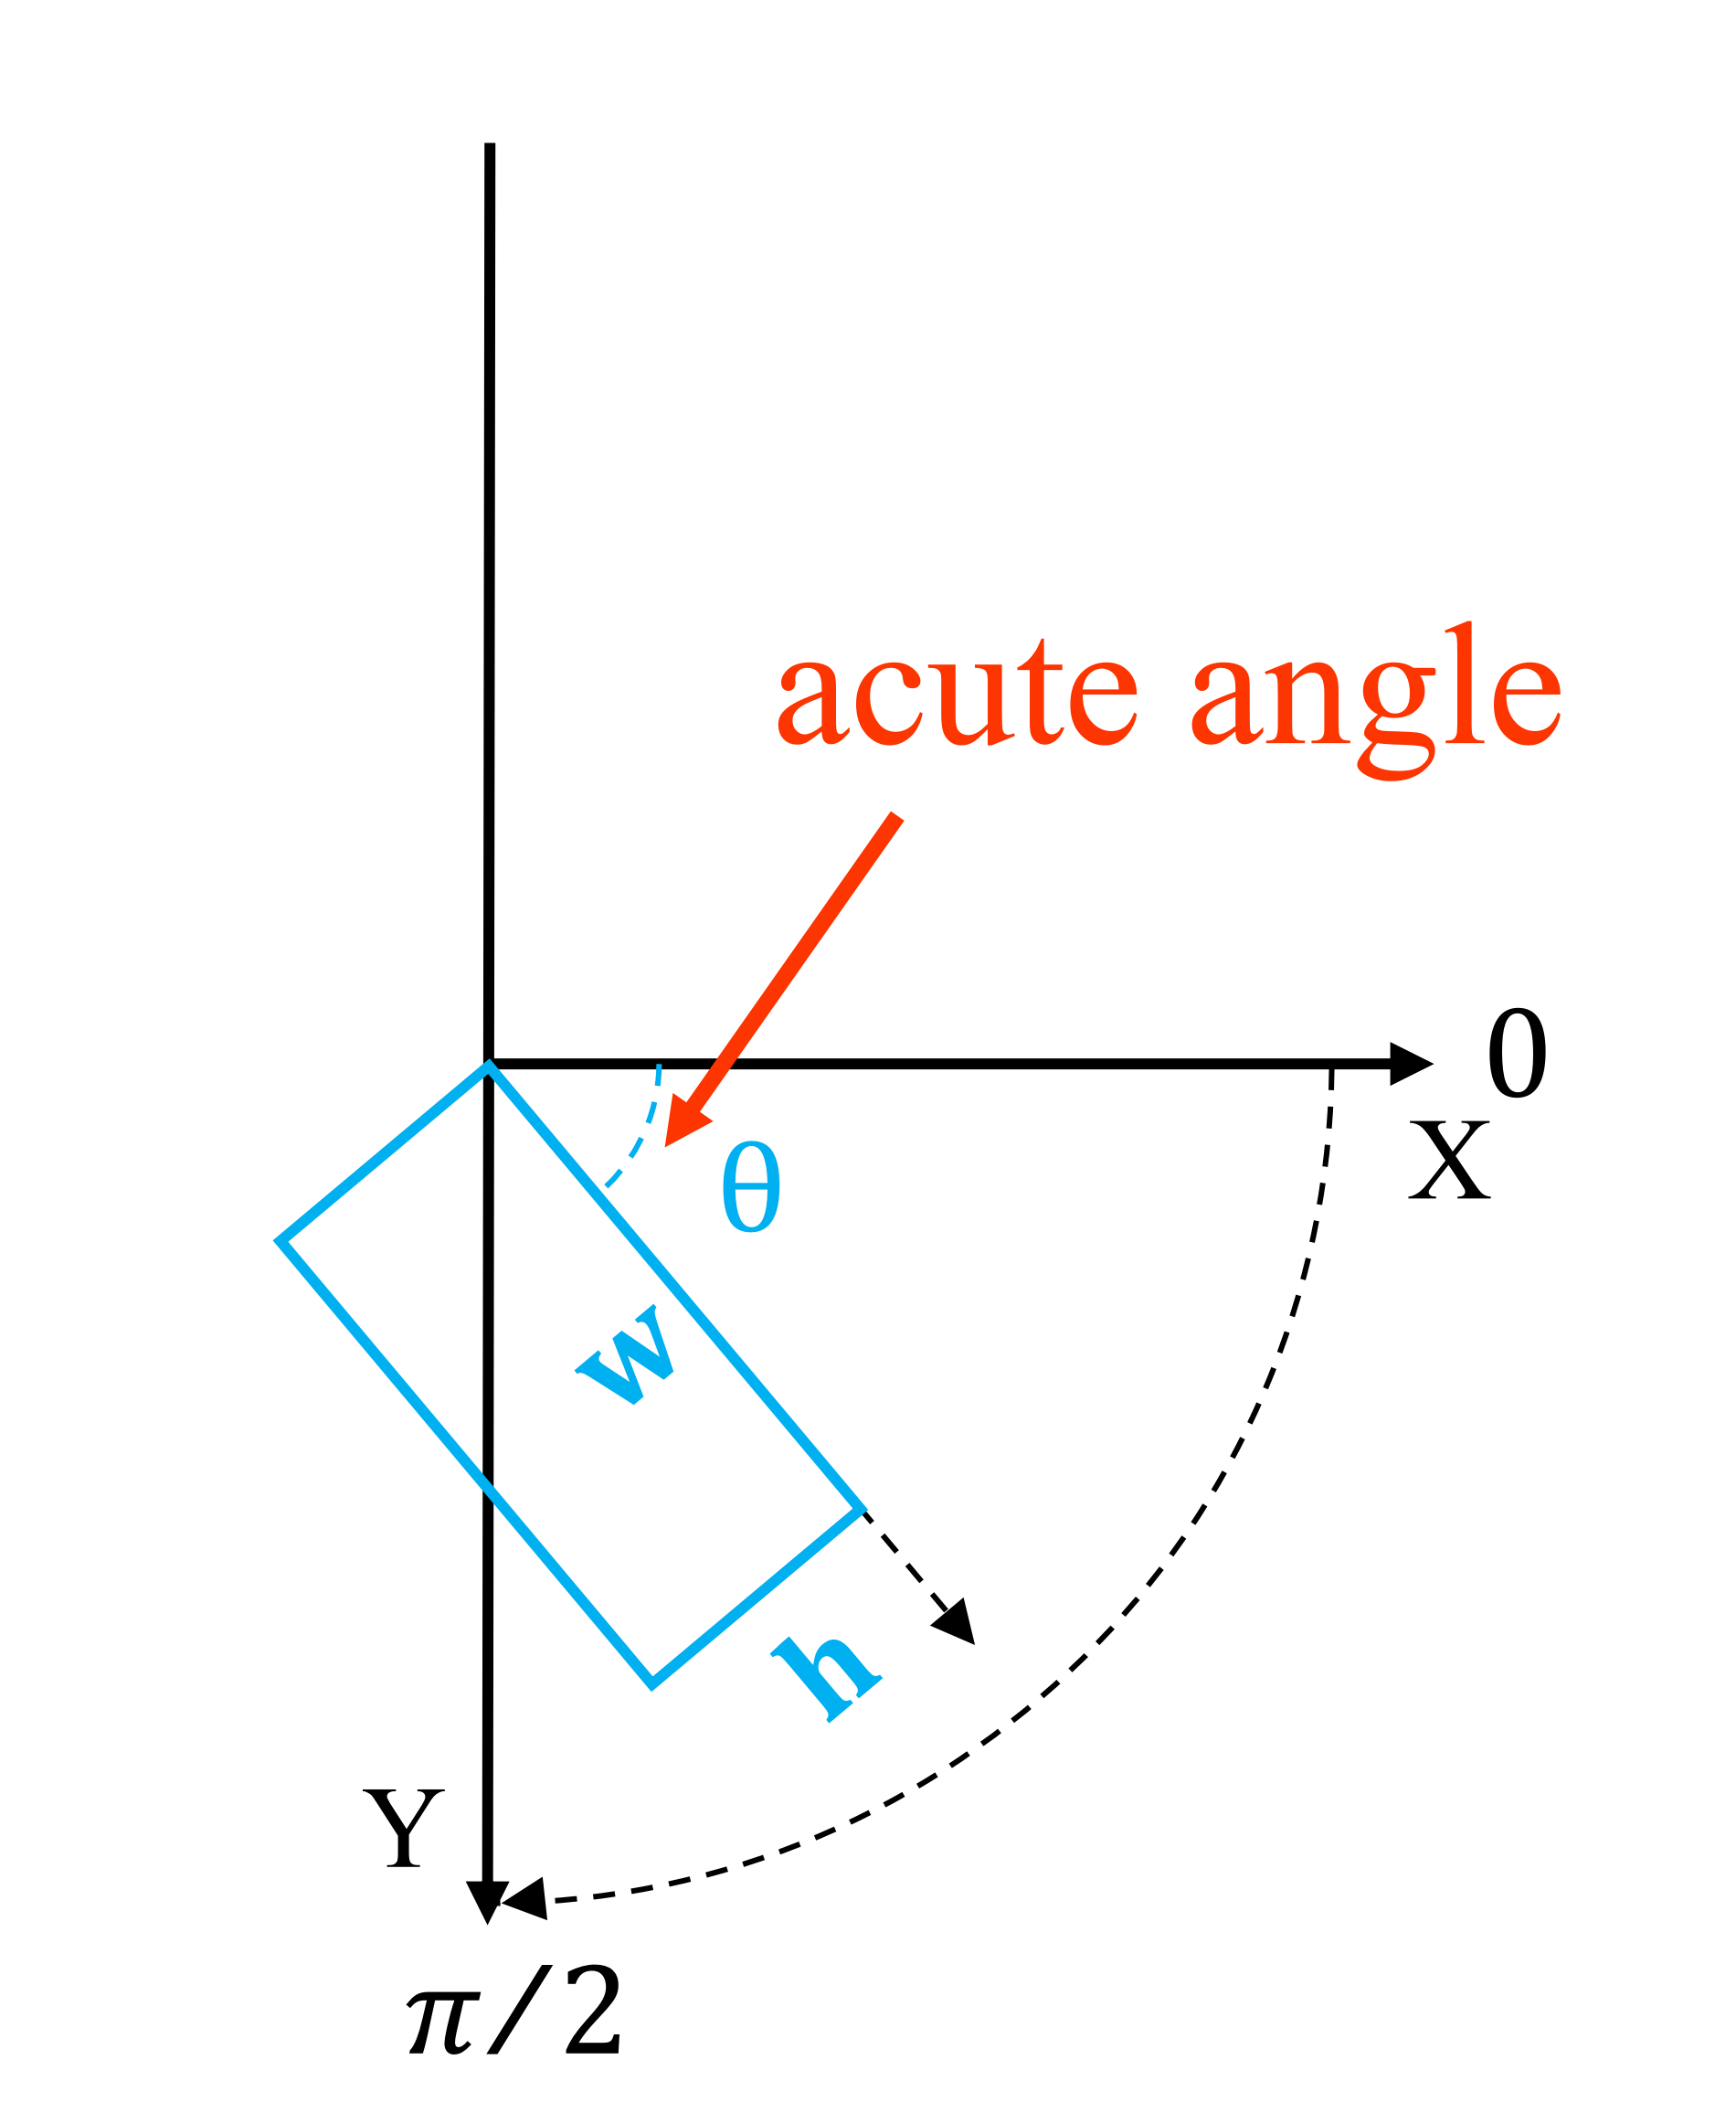
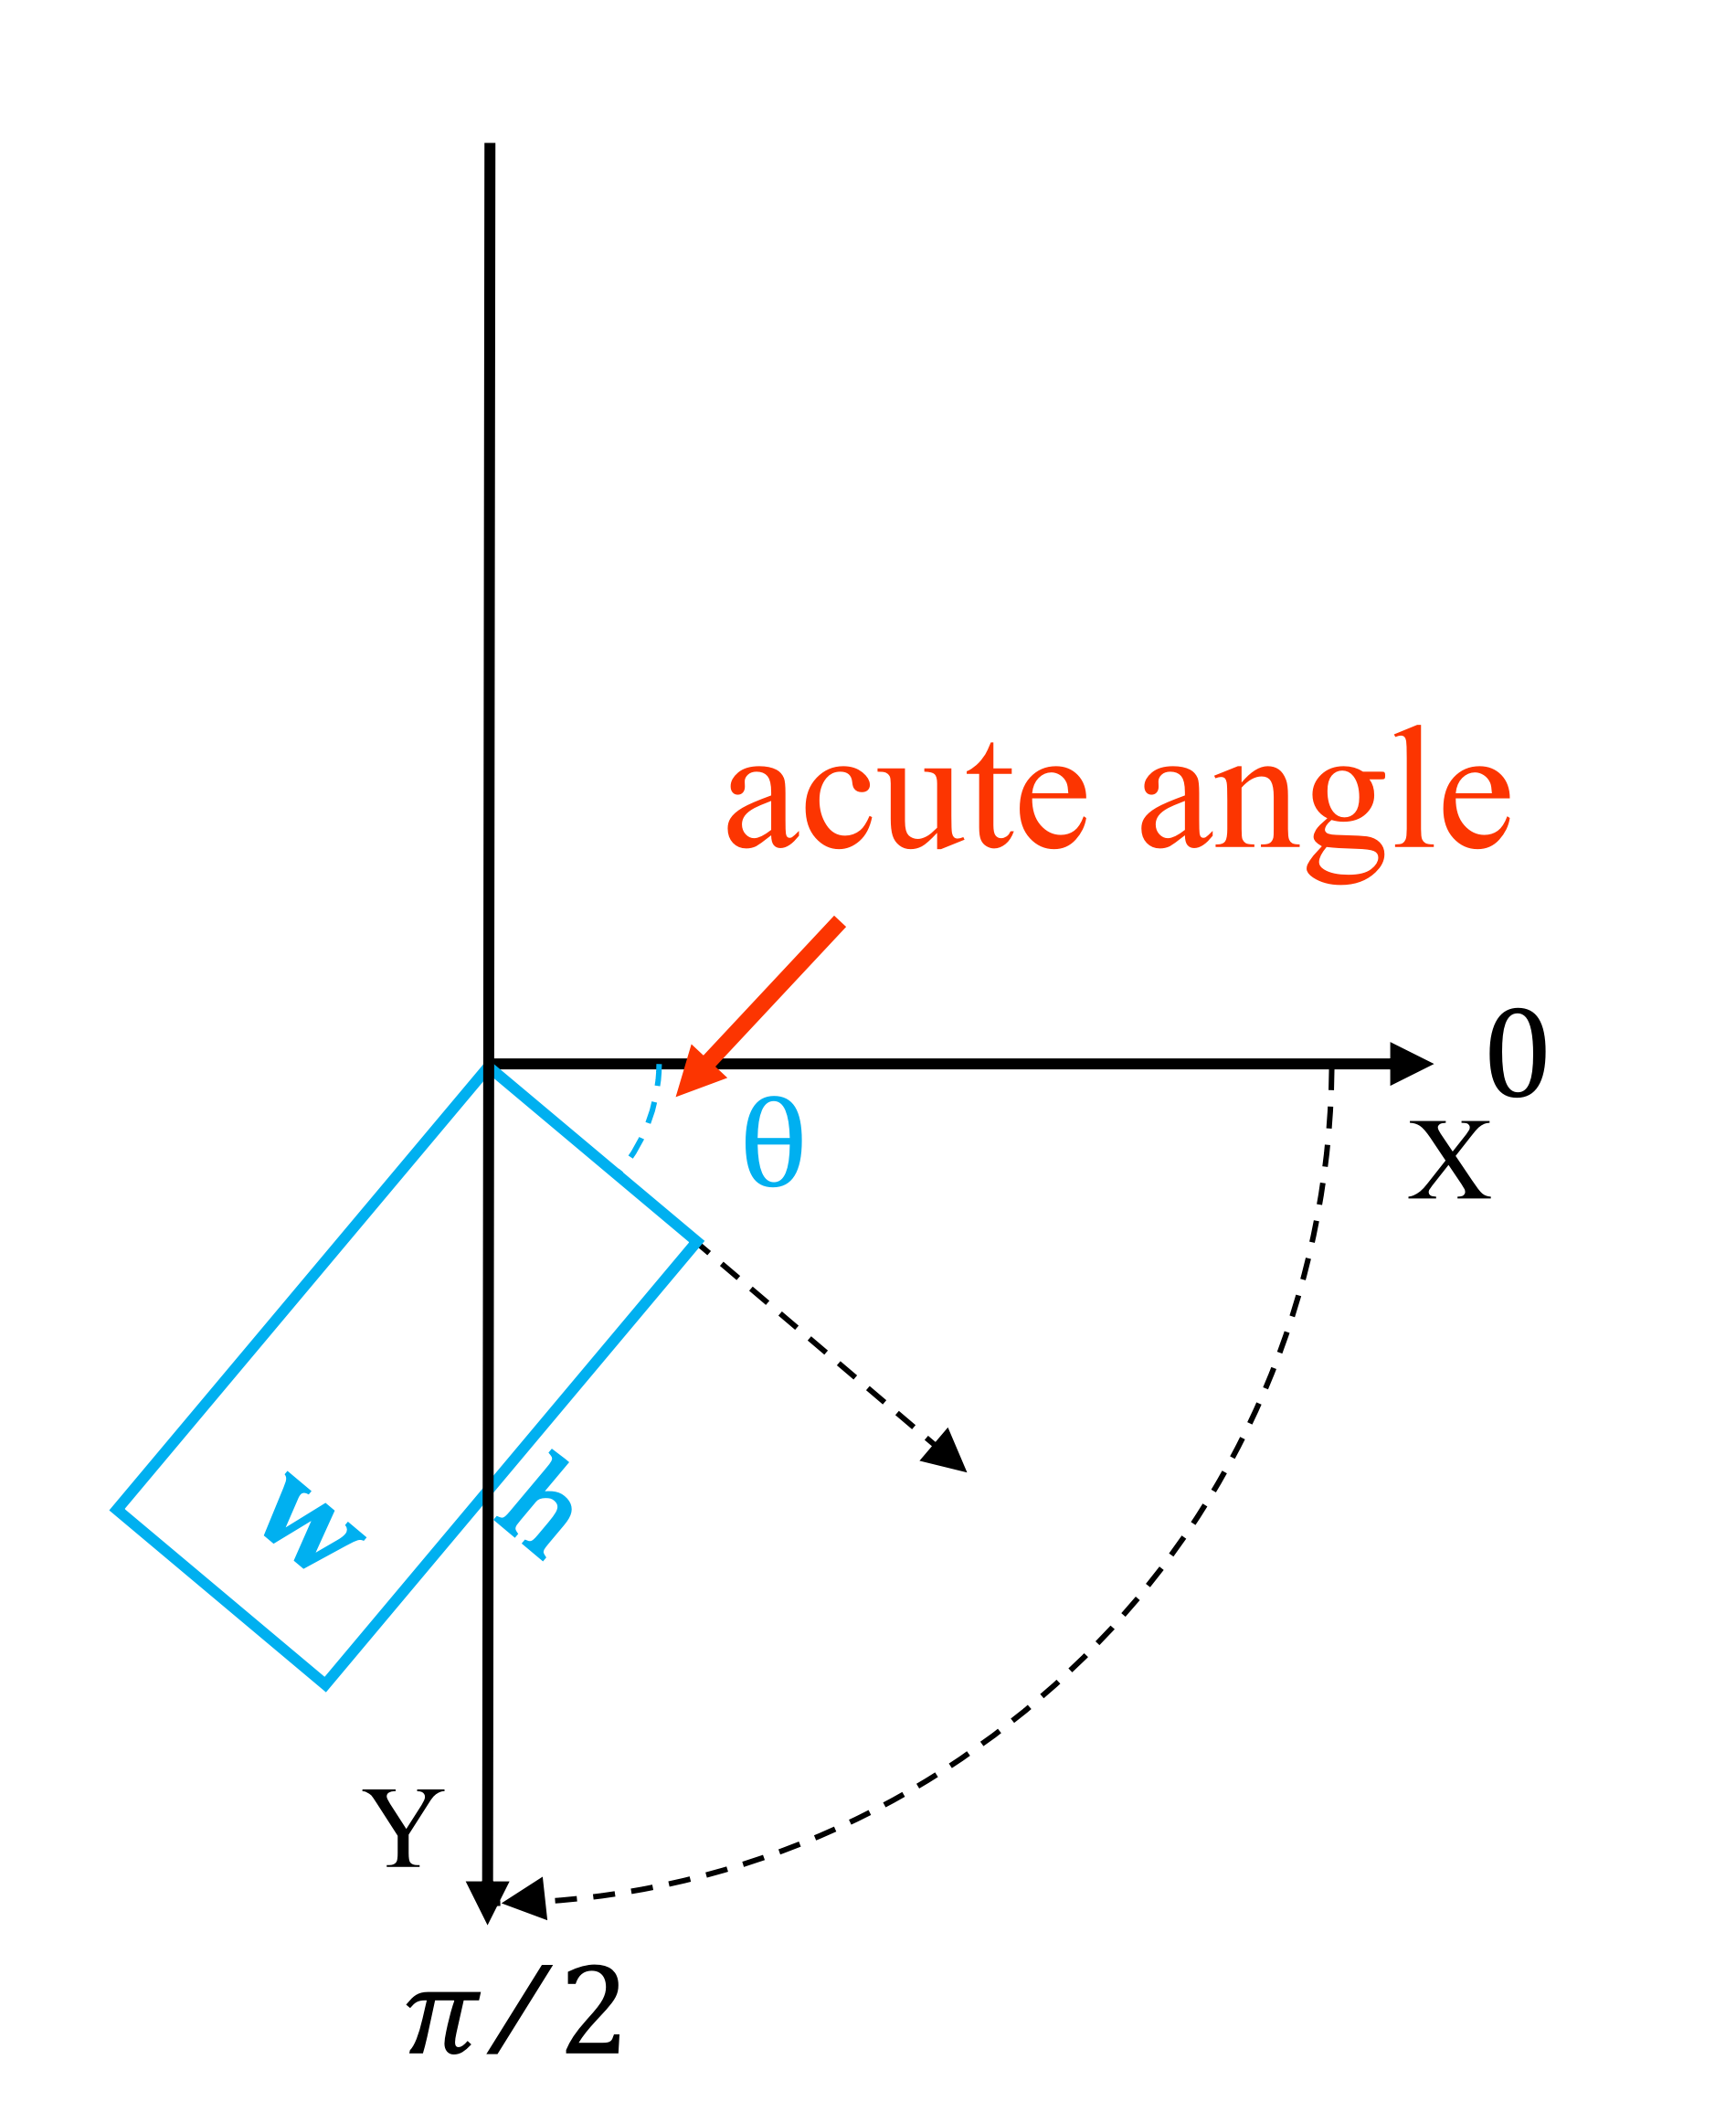
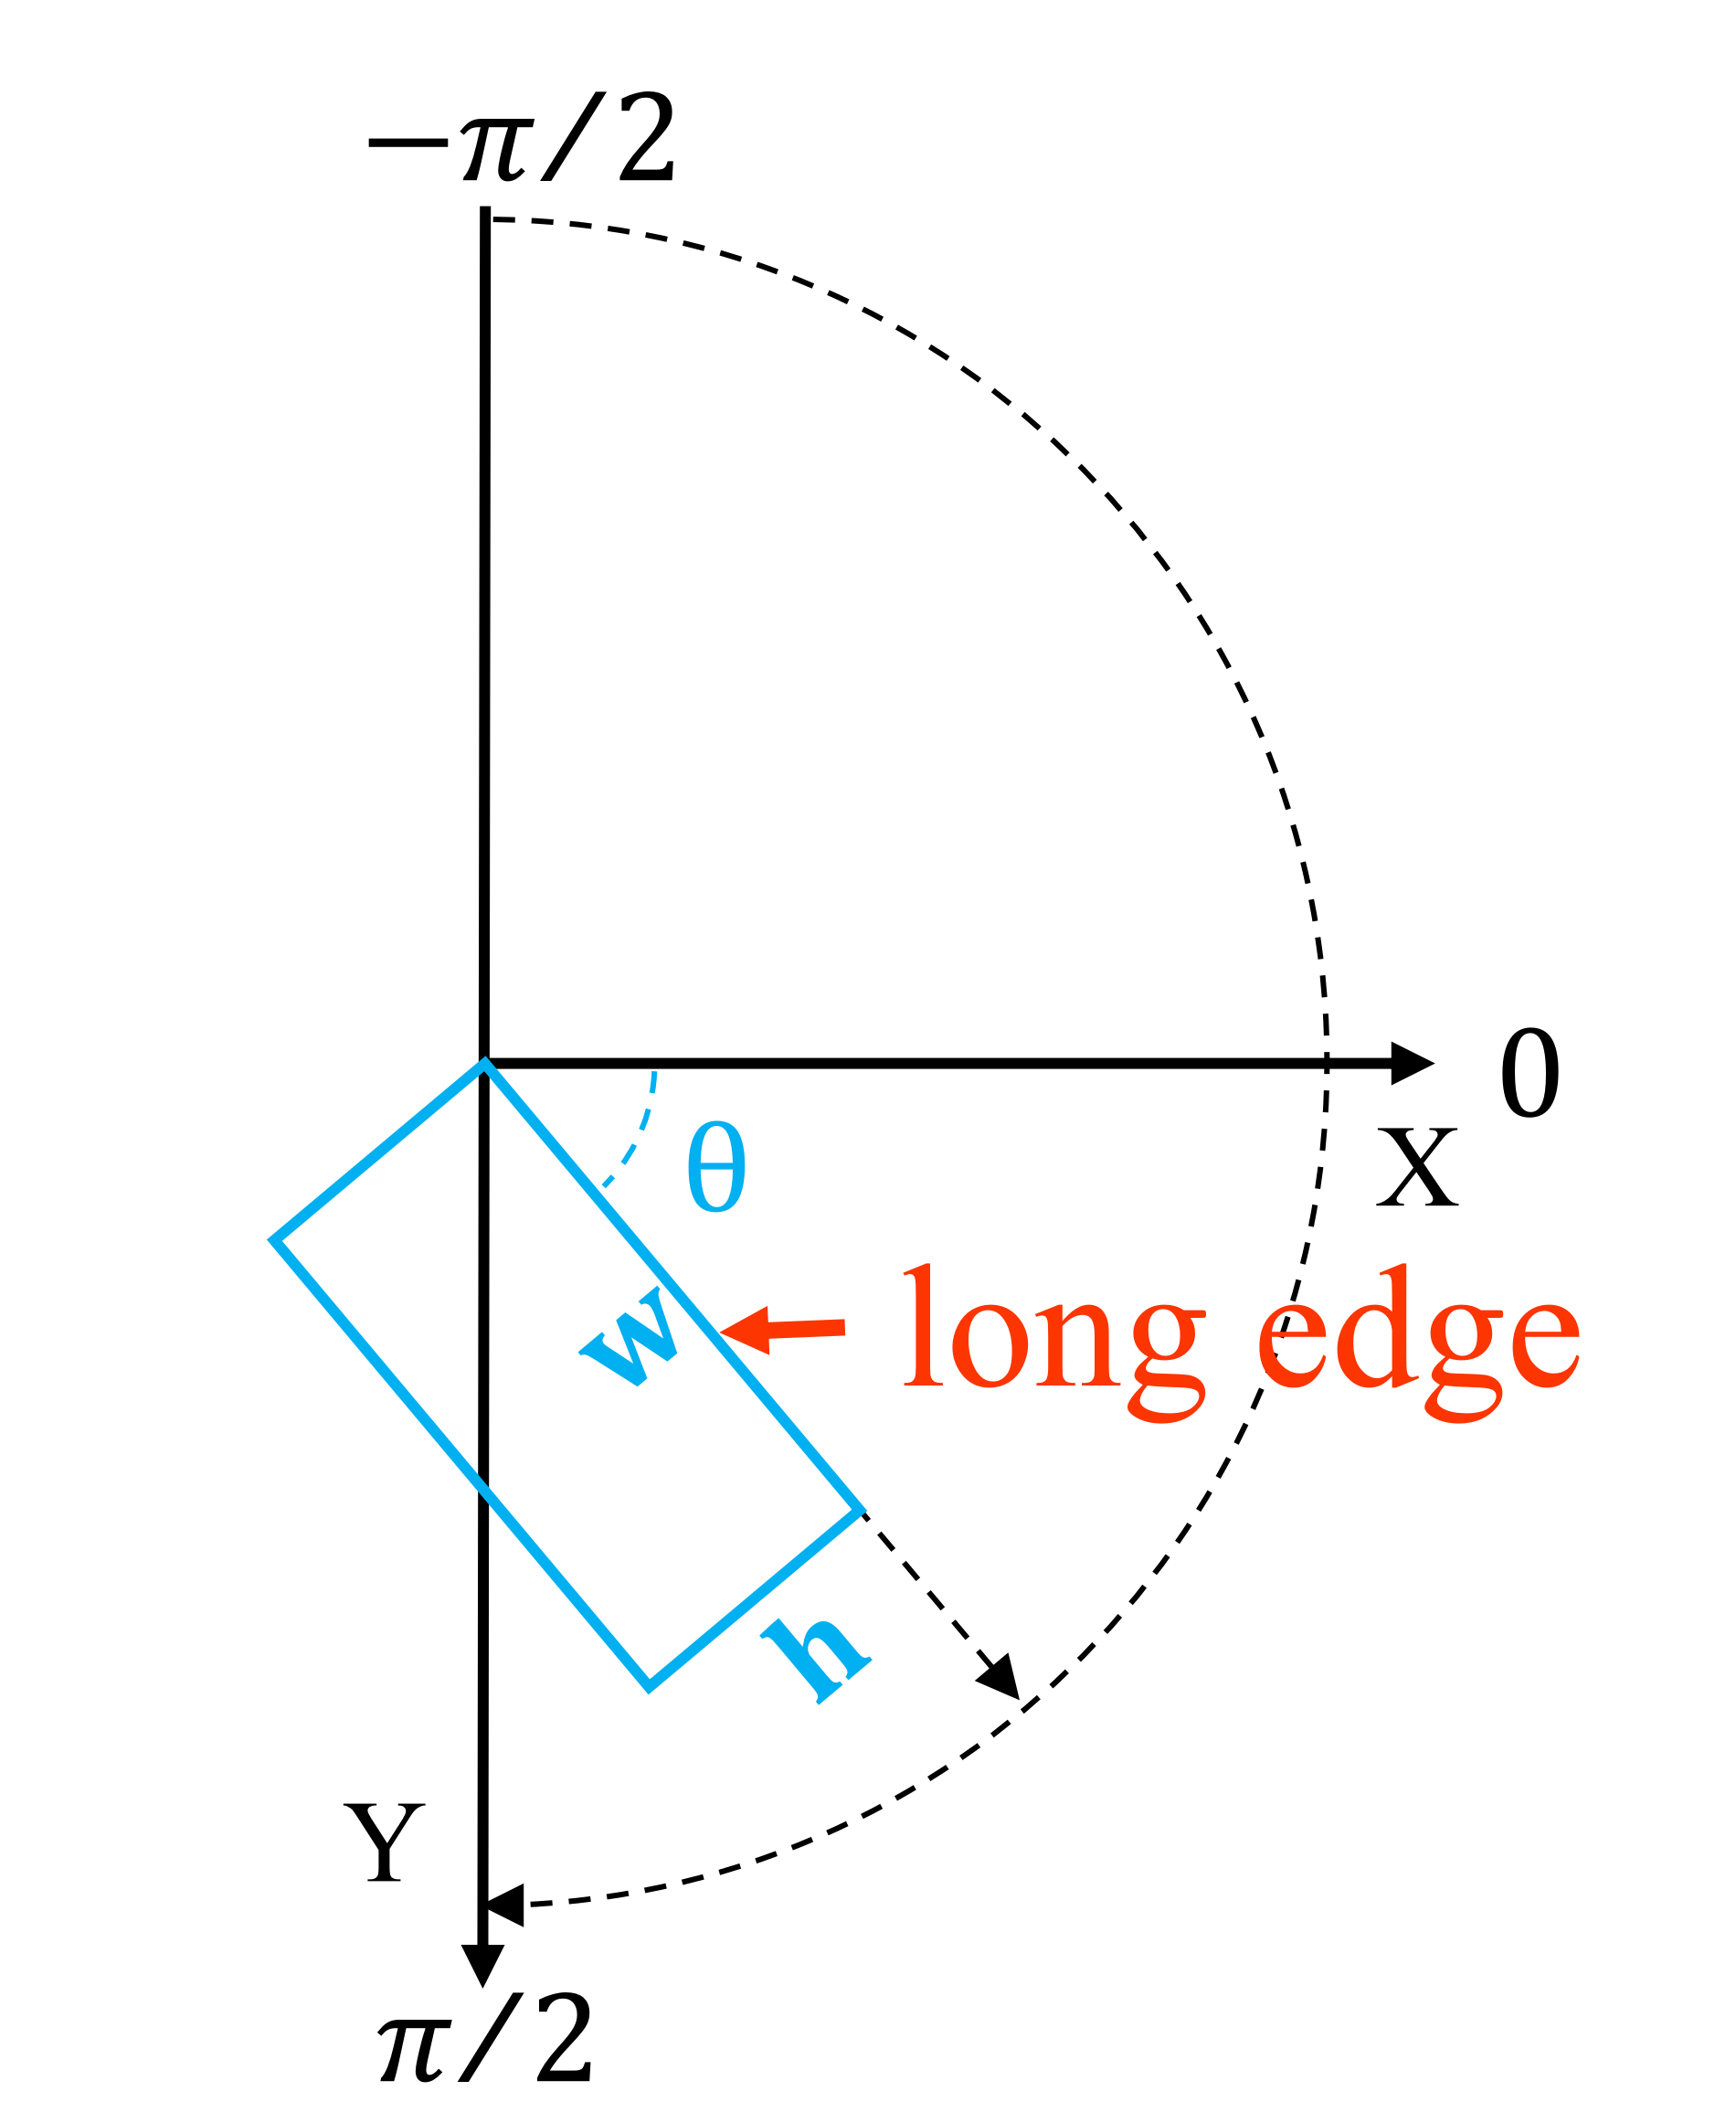
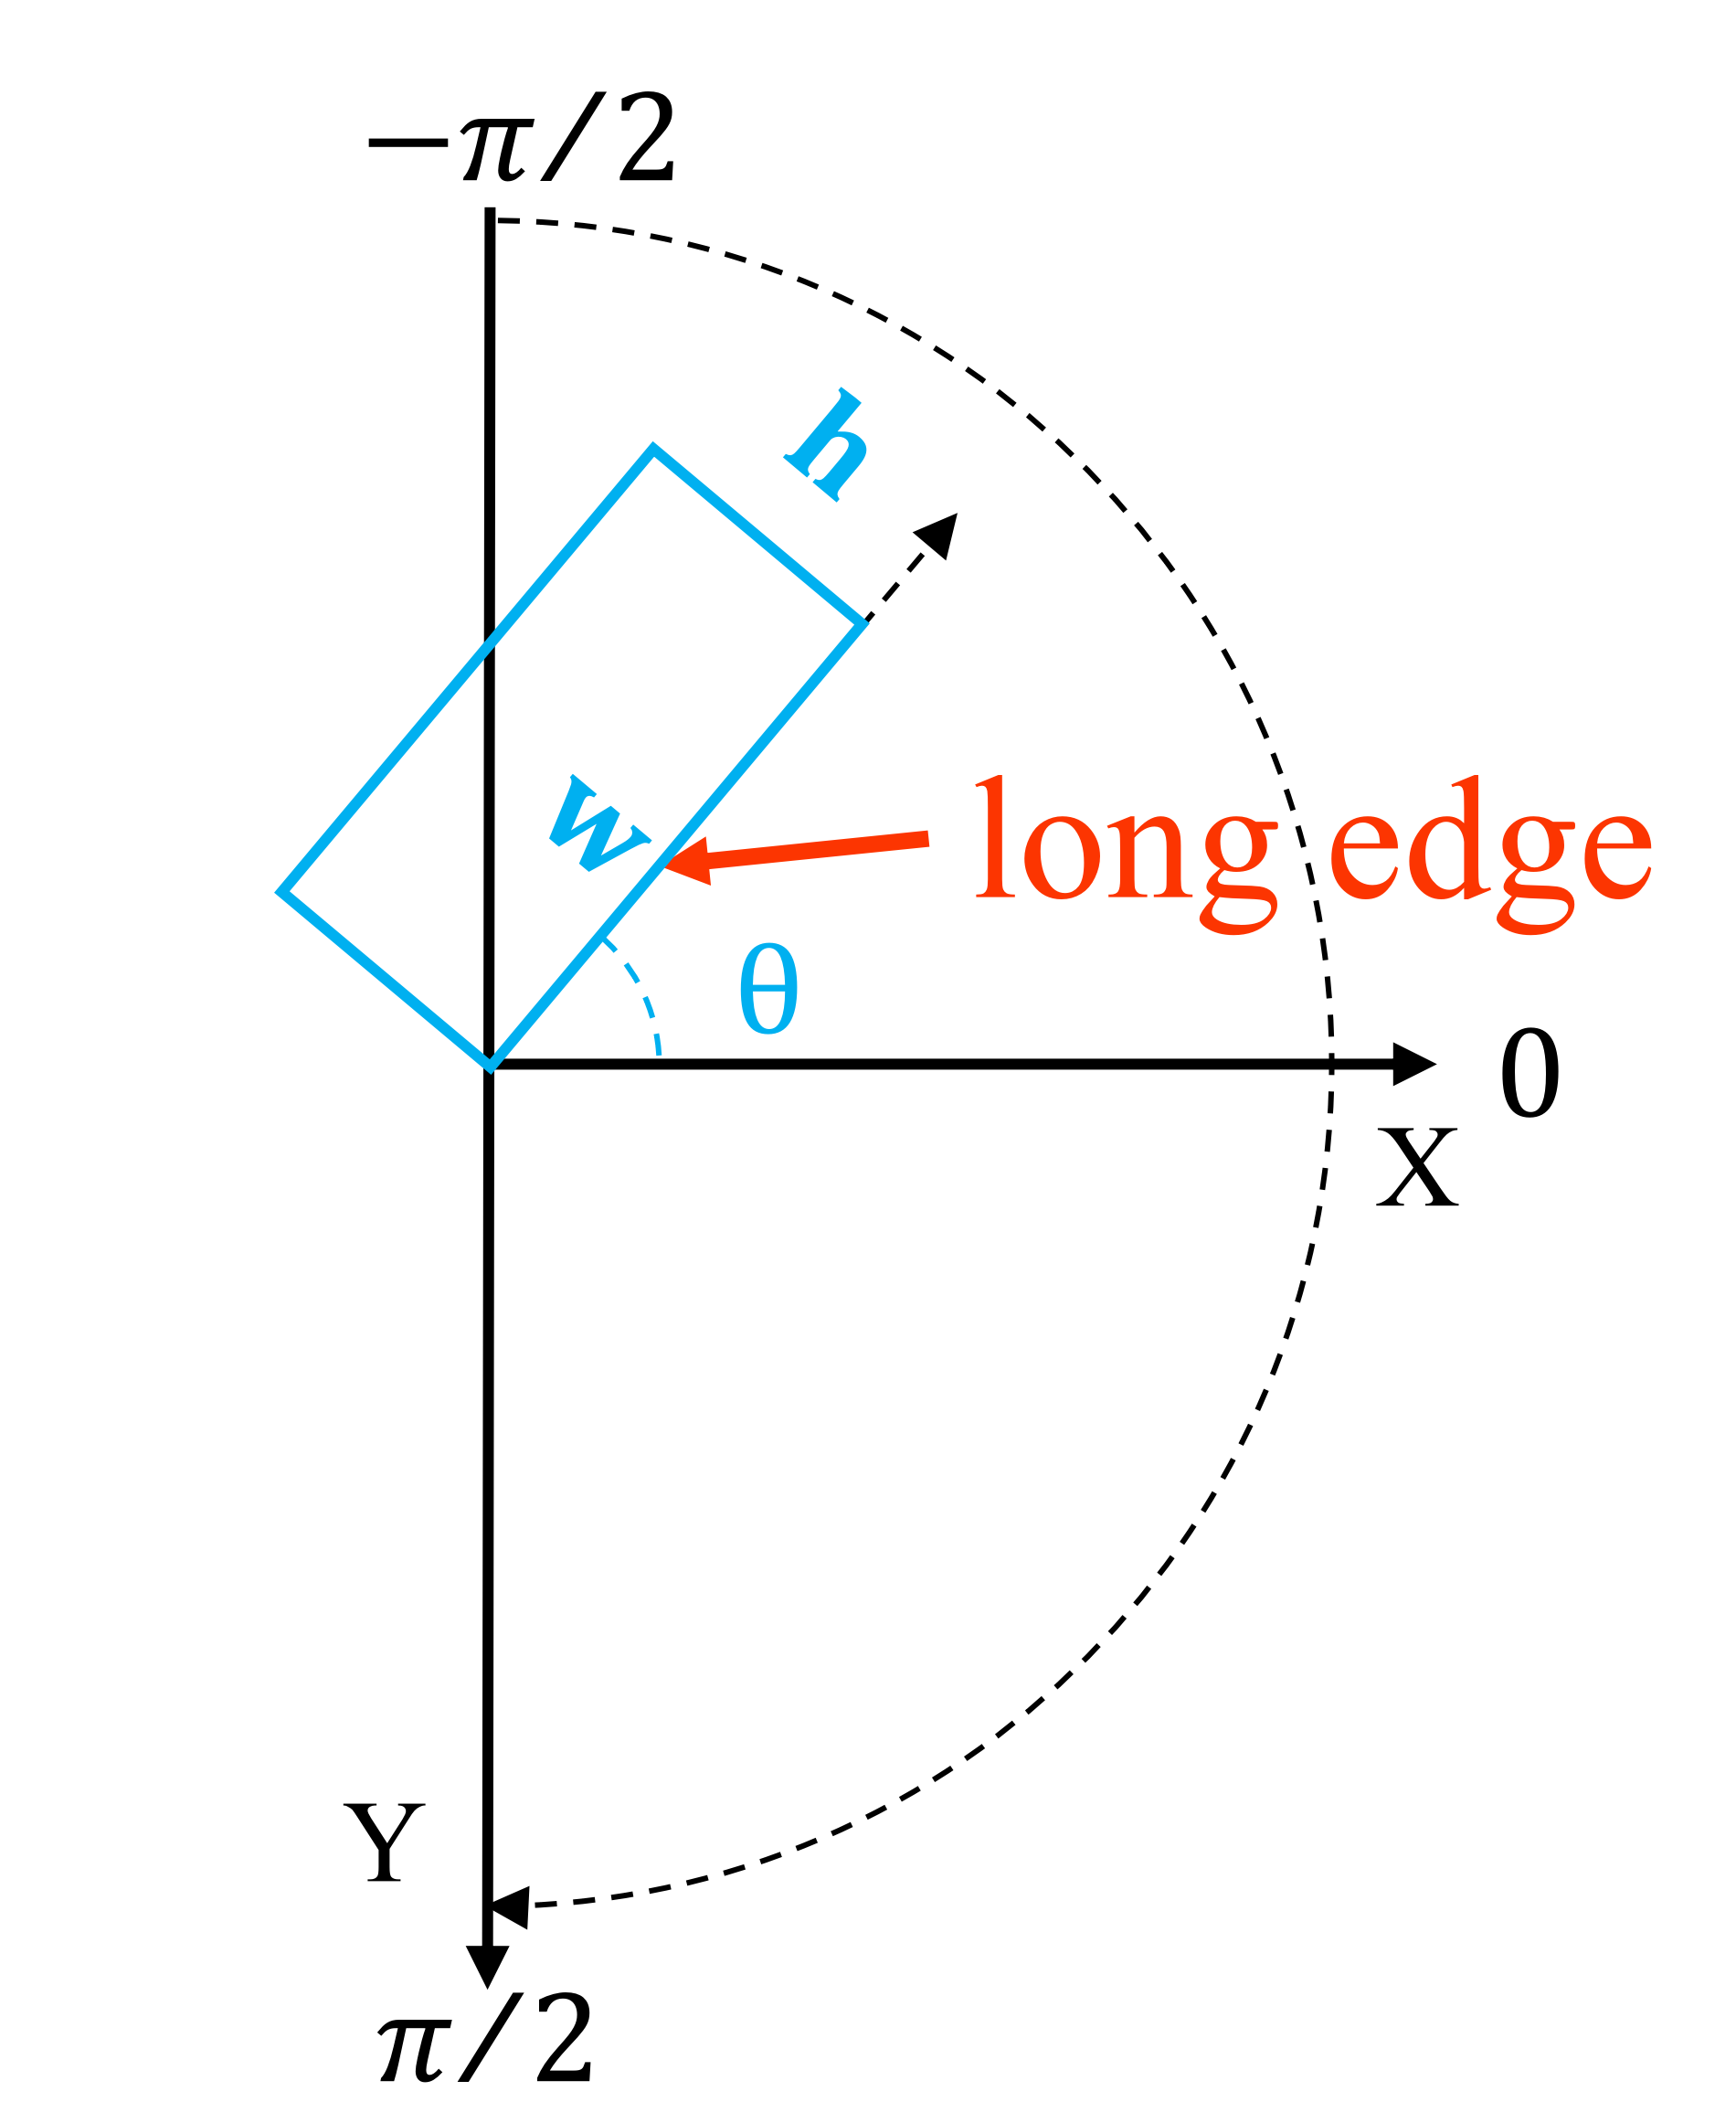
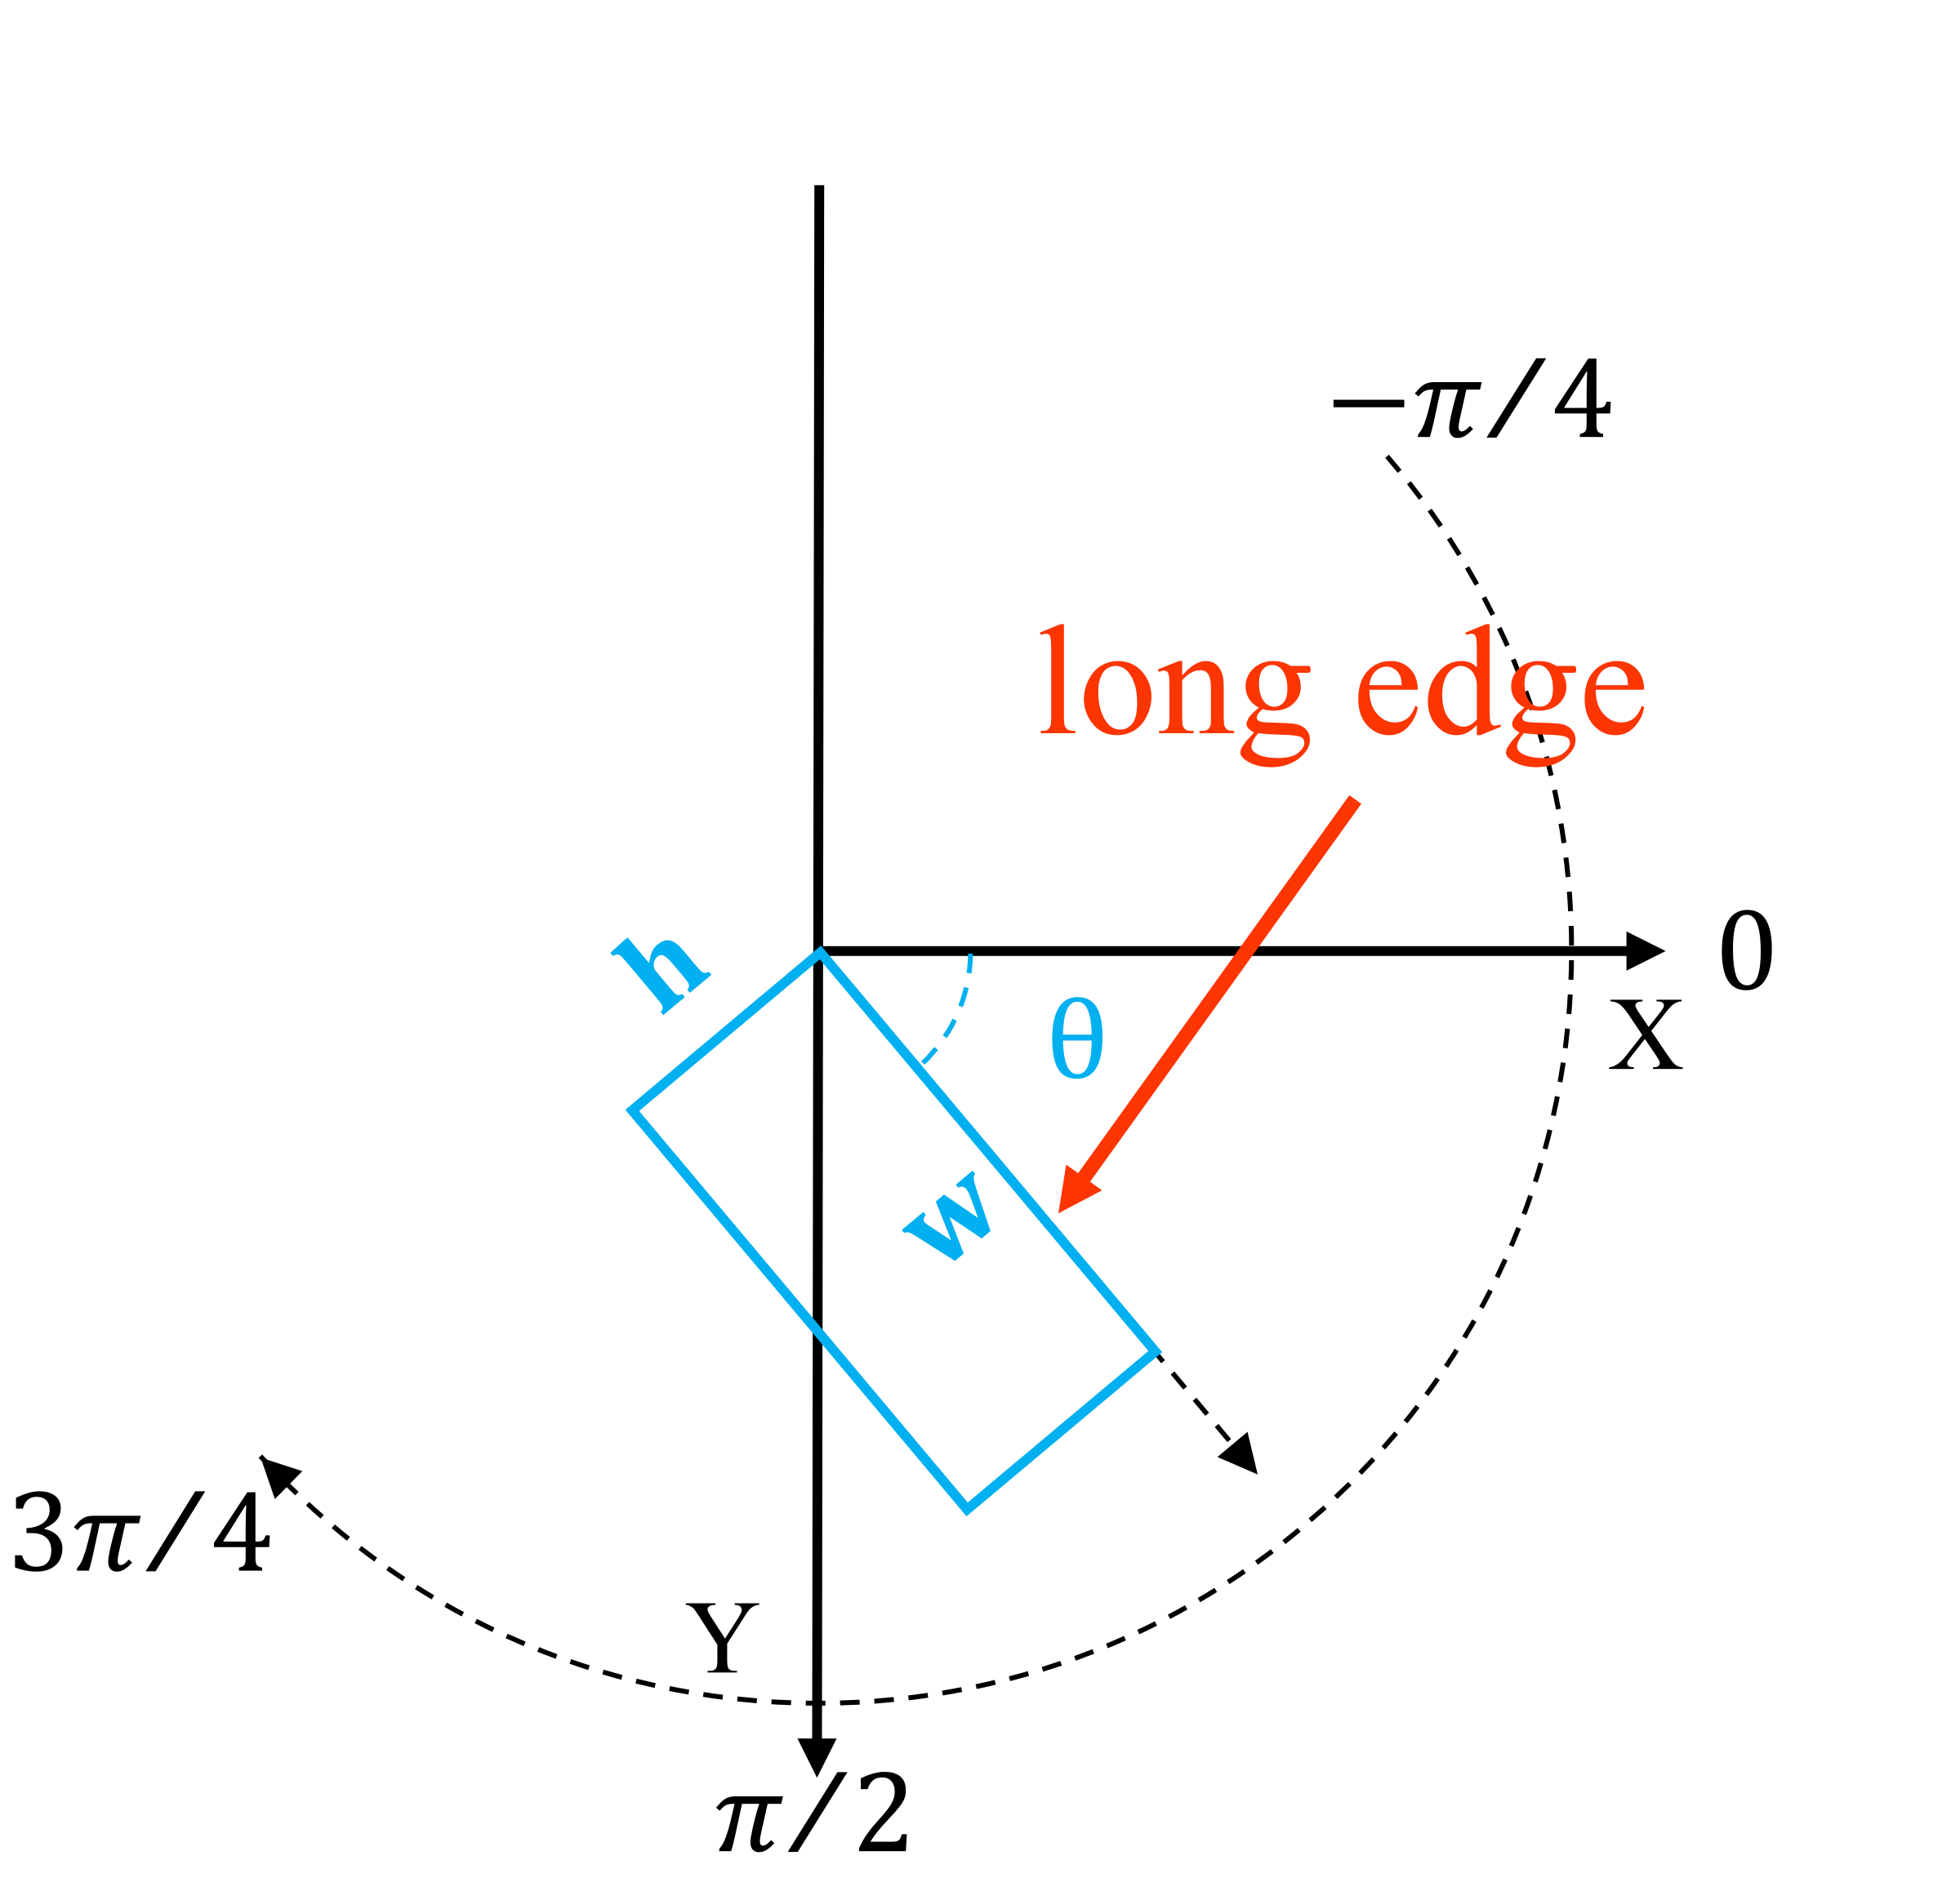
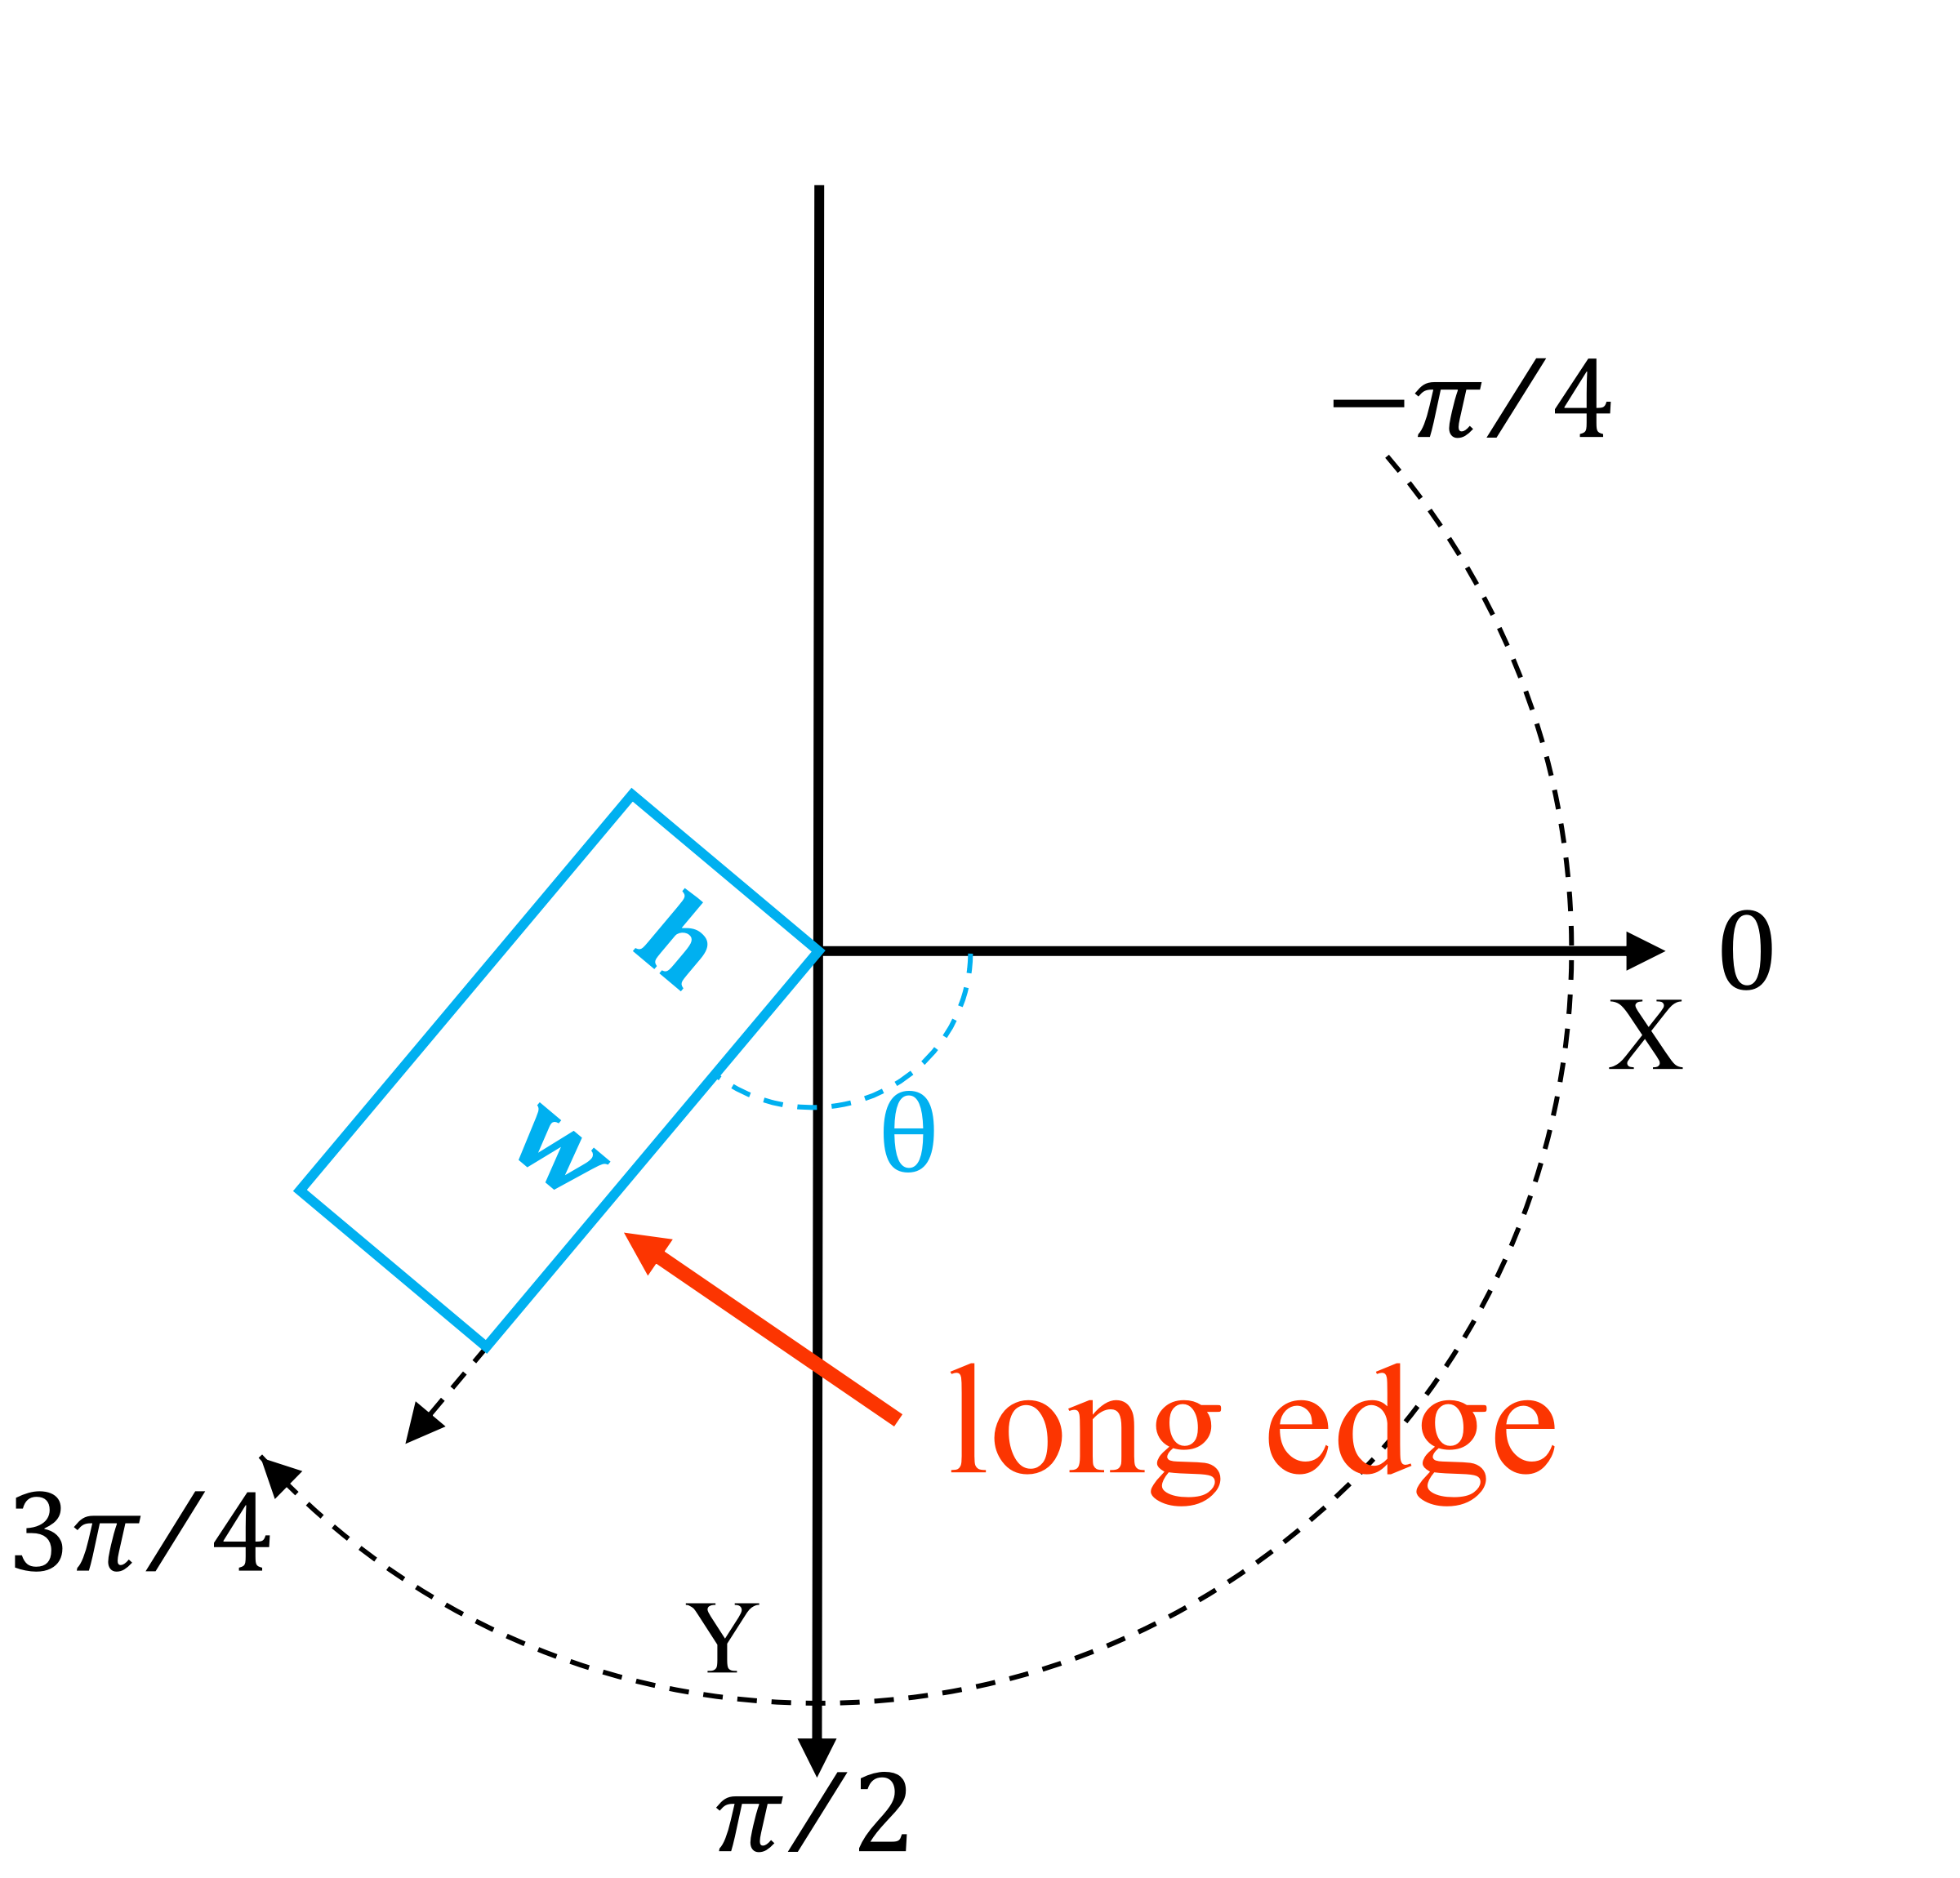
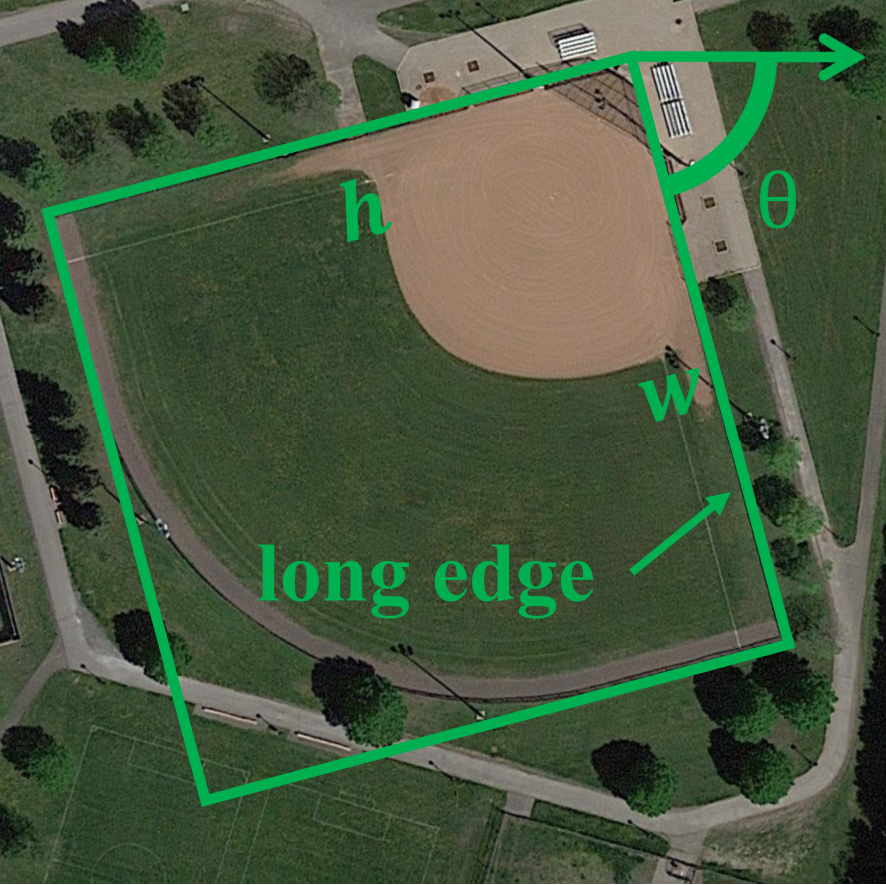
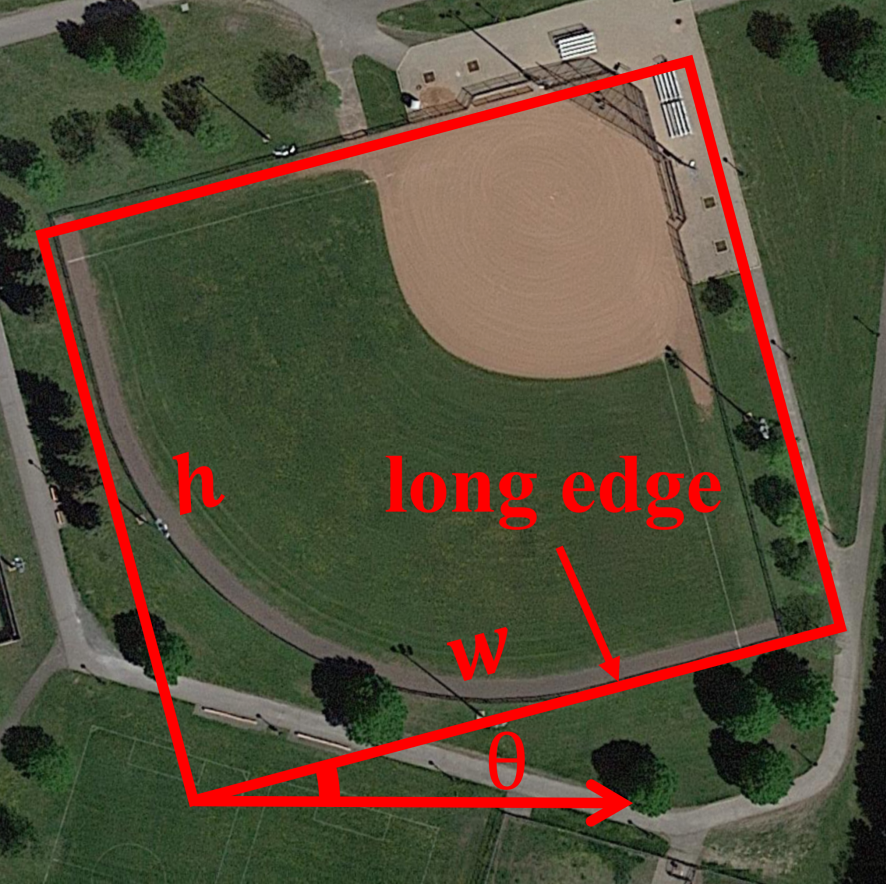
The -based representation adopts a vector in the format of to define an OBB. The present approaches can be classified into two types according to the definition of the angle , including the OpenCV definition (which follows the OpenCV protocol) and the long edge definition. As shown in Figure 10, the former defines as the acute angle (i.e. the right angle) between the OBB and -axis, leading to . Note that the width is defined as the side of the acute angle and can be shorter than the height , which is shown in the top of Figure 10. To tackle this issue, the long edge definition is proposed by setting as the angle between the long edge of the OBB and -axis. Therefore, the angular range is (Ding et al., 2019; Han et al., 2021a) or (Han et al., 2022b), which are shown in Figure 10 and Figure 10, respectively. As shown in the bottom of Figure 10, the parameters of the same OBB have significant differences in different OBB representations.
Built upon well-designed horizontal detectors, most oriented object detectors predict OBBs in a regression fashion. In the -based OBB representation, given an anchor box denoted by , the neural network first predicts the offsets between the predicted OBB and the anchor box:
| (9) | ||||
where denotes the predicted OBB. is used to ensure that the angle difference stays within the preset range, thus avoiding the impact of PoA. Similarly, the GT offsets are denoted by:
| (10) | ||||
where denotes the GT OBB. Hence, the objective function for the regression task is:
| (11) |
where denotes the norm and the smooth loss (Girshick, 2015) is widely adopted. Due to the PoA (Qian et al., 2021, 2022; Yang et al., 2021c, 2022b), the OBB regression will encounter the following challenges.
5.1.1 Inconsistency between Metric and Loss
Although the majority of detectors adopt the smooth L1 loss as the objective function of regression, the most commonly used metric for localization is RIoU, which is presented in Section 2. Therefore, there is an inconsistency between the loss function and the evaluation metric, and an optimum choice for the regression task may not guarantee a high localization accuracy in terms of RIoU. What’s more, a good regression loss function should take into account the central point distance, aspect ratio, and overlap area, which has been demonstrated to be effective in horizontal object detection (Rezatofighi et al., 2019; Zheng et al., 2020). However, the aspect ratio and the overlap area can be disregarded by the smooth L1 loss easily.
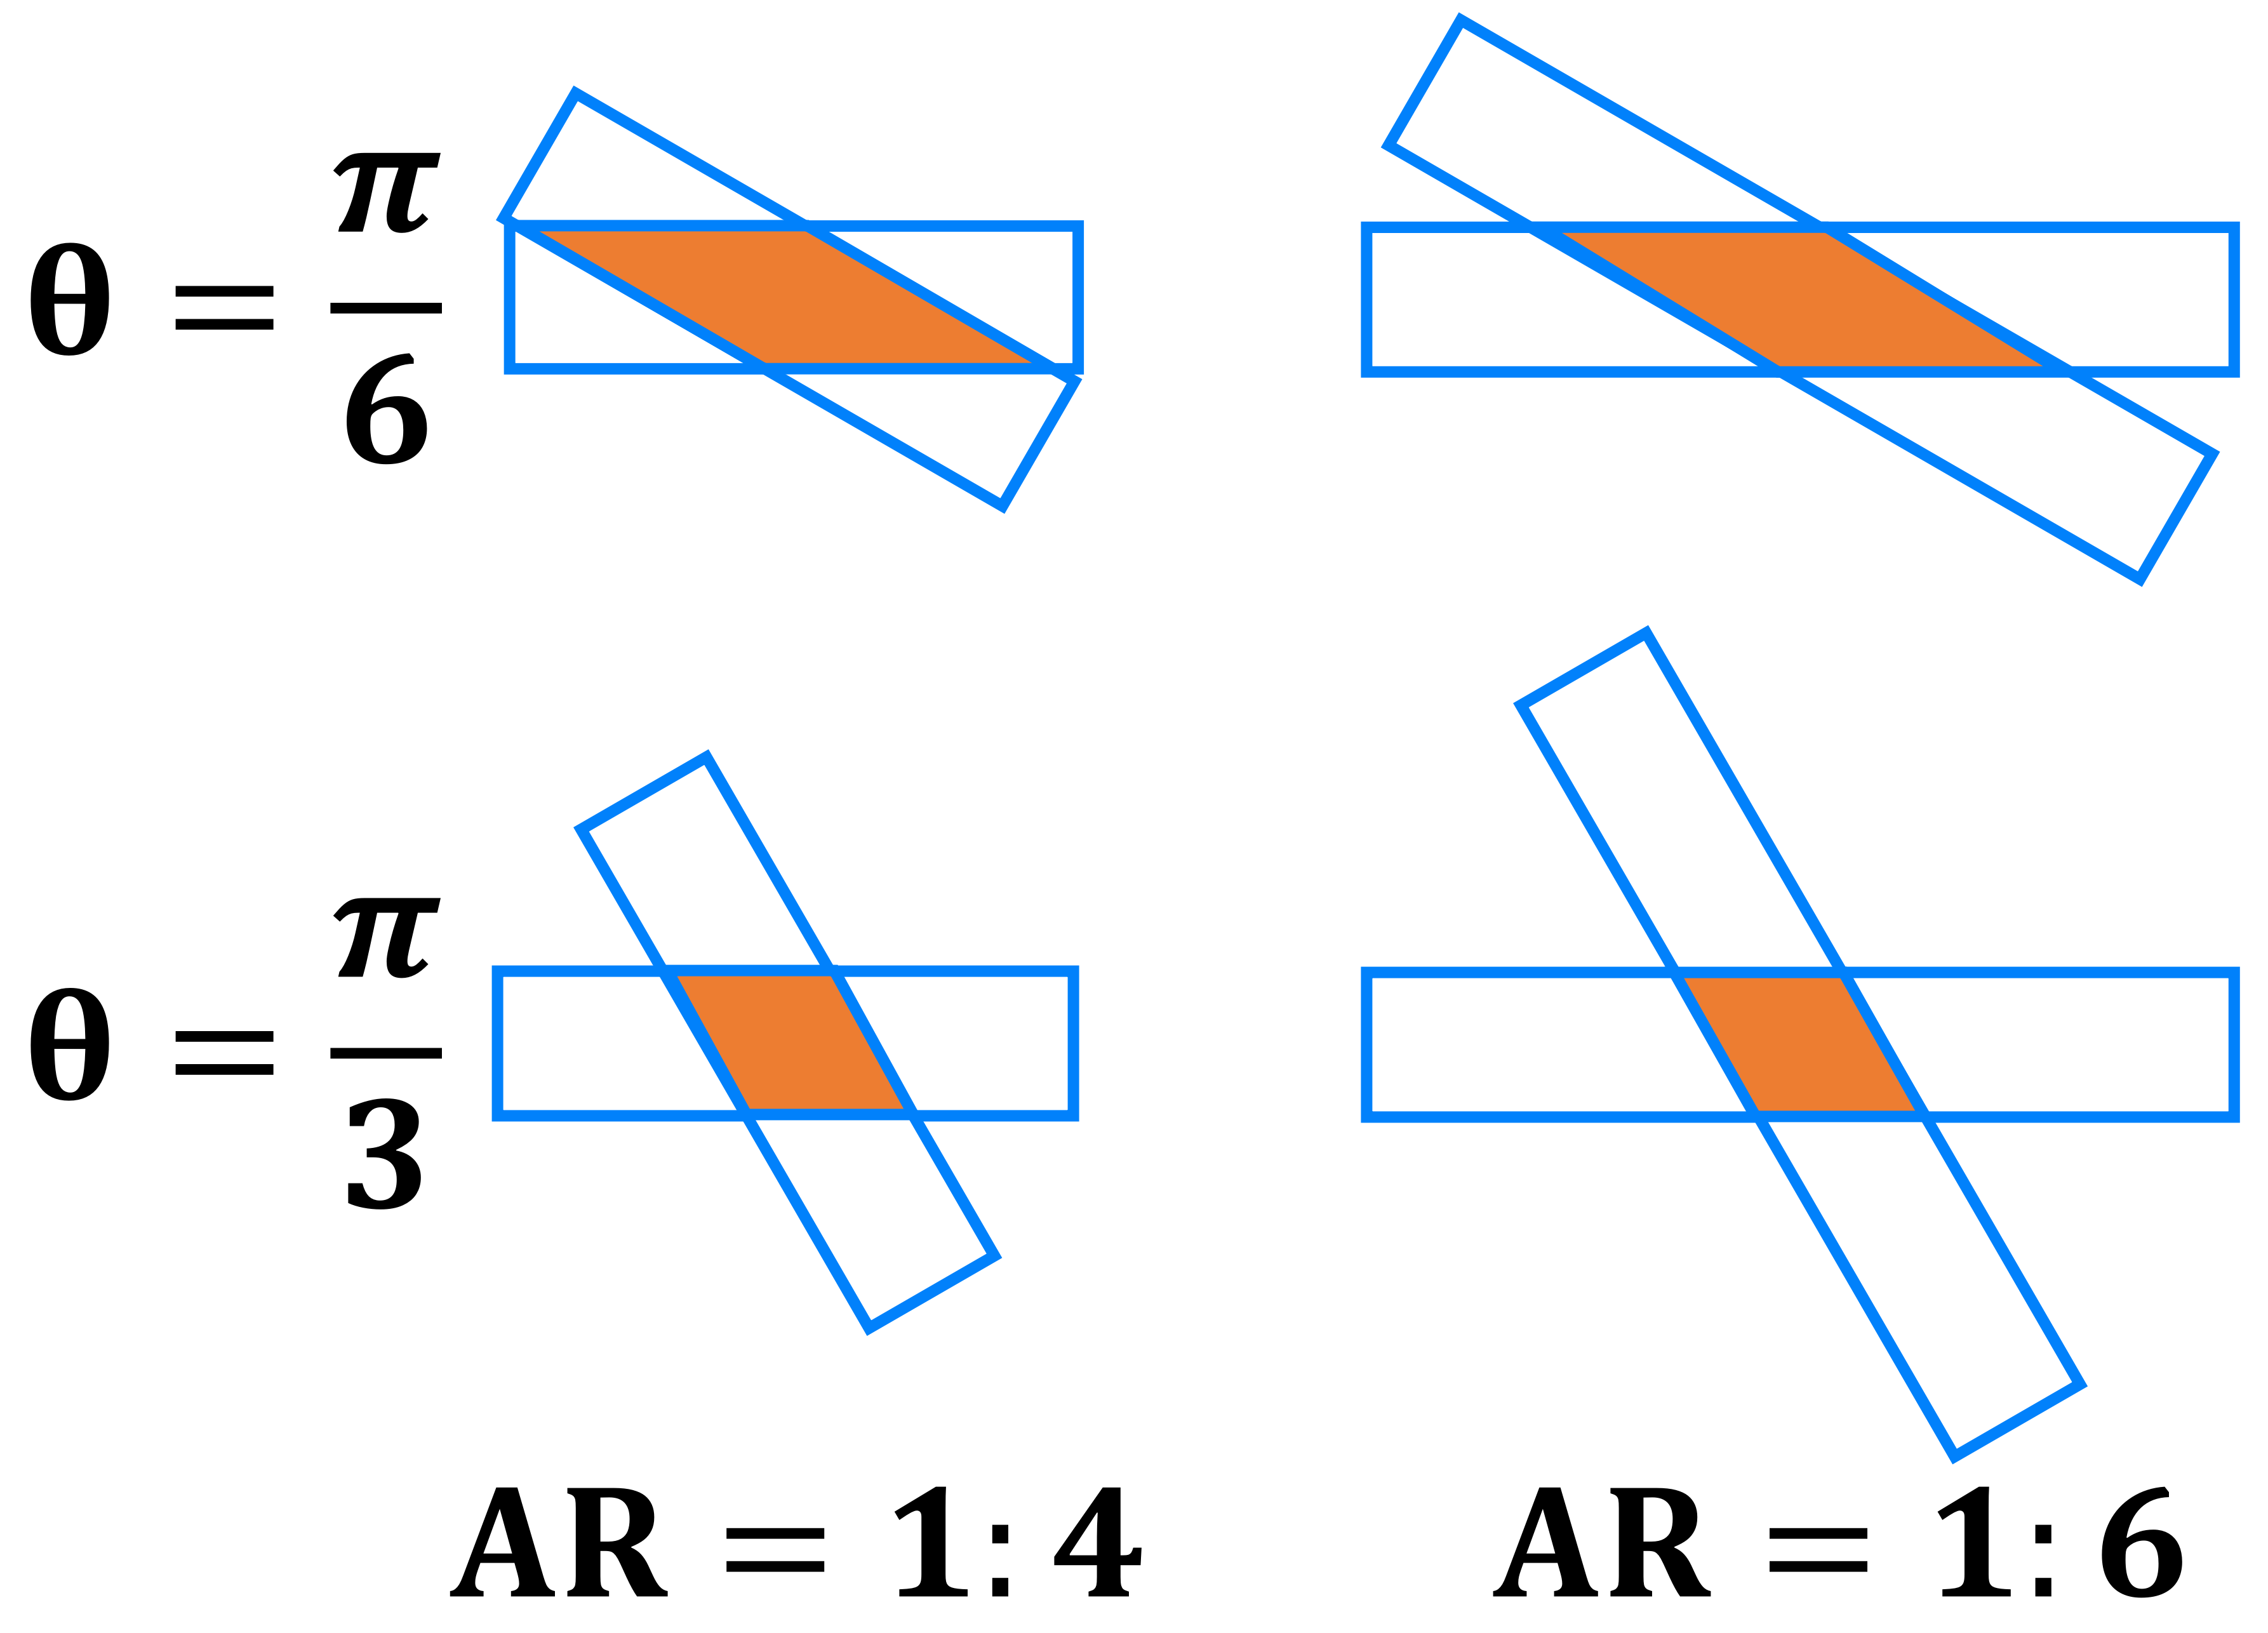
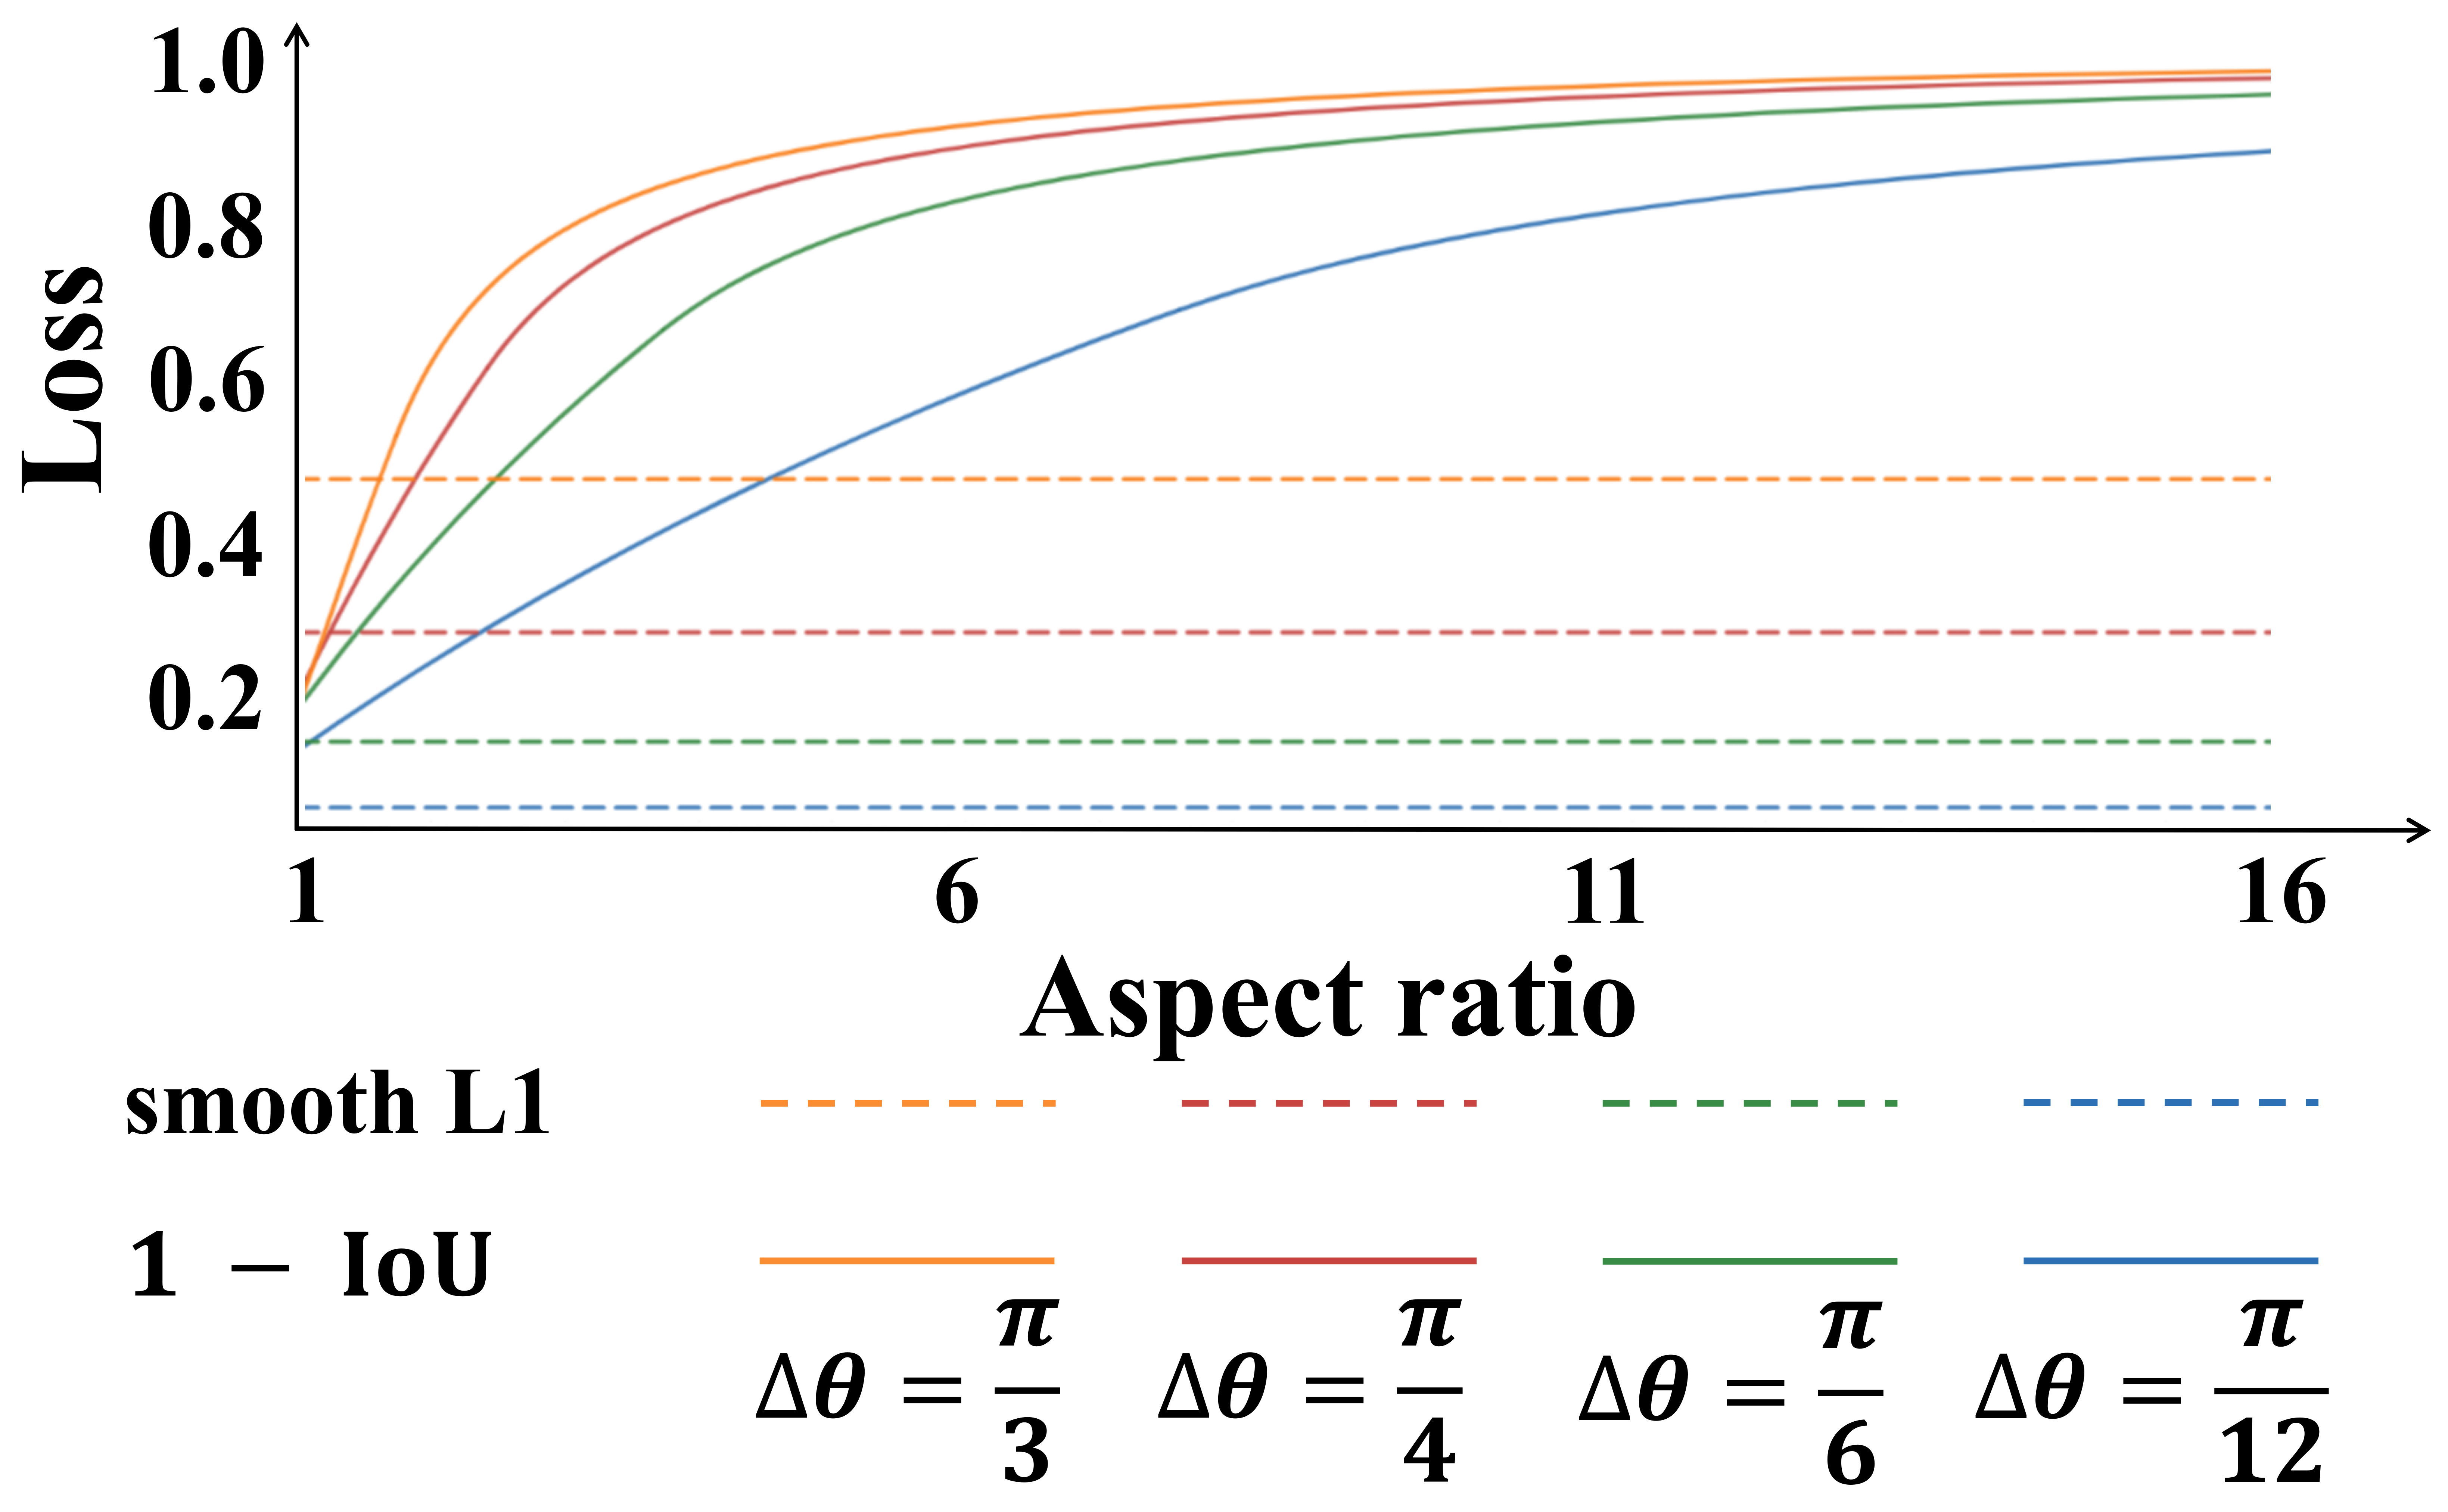
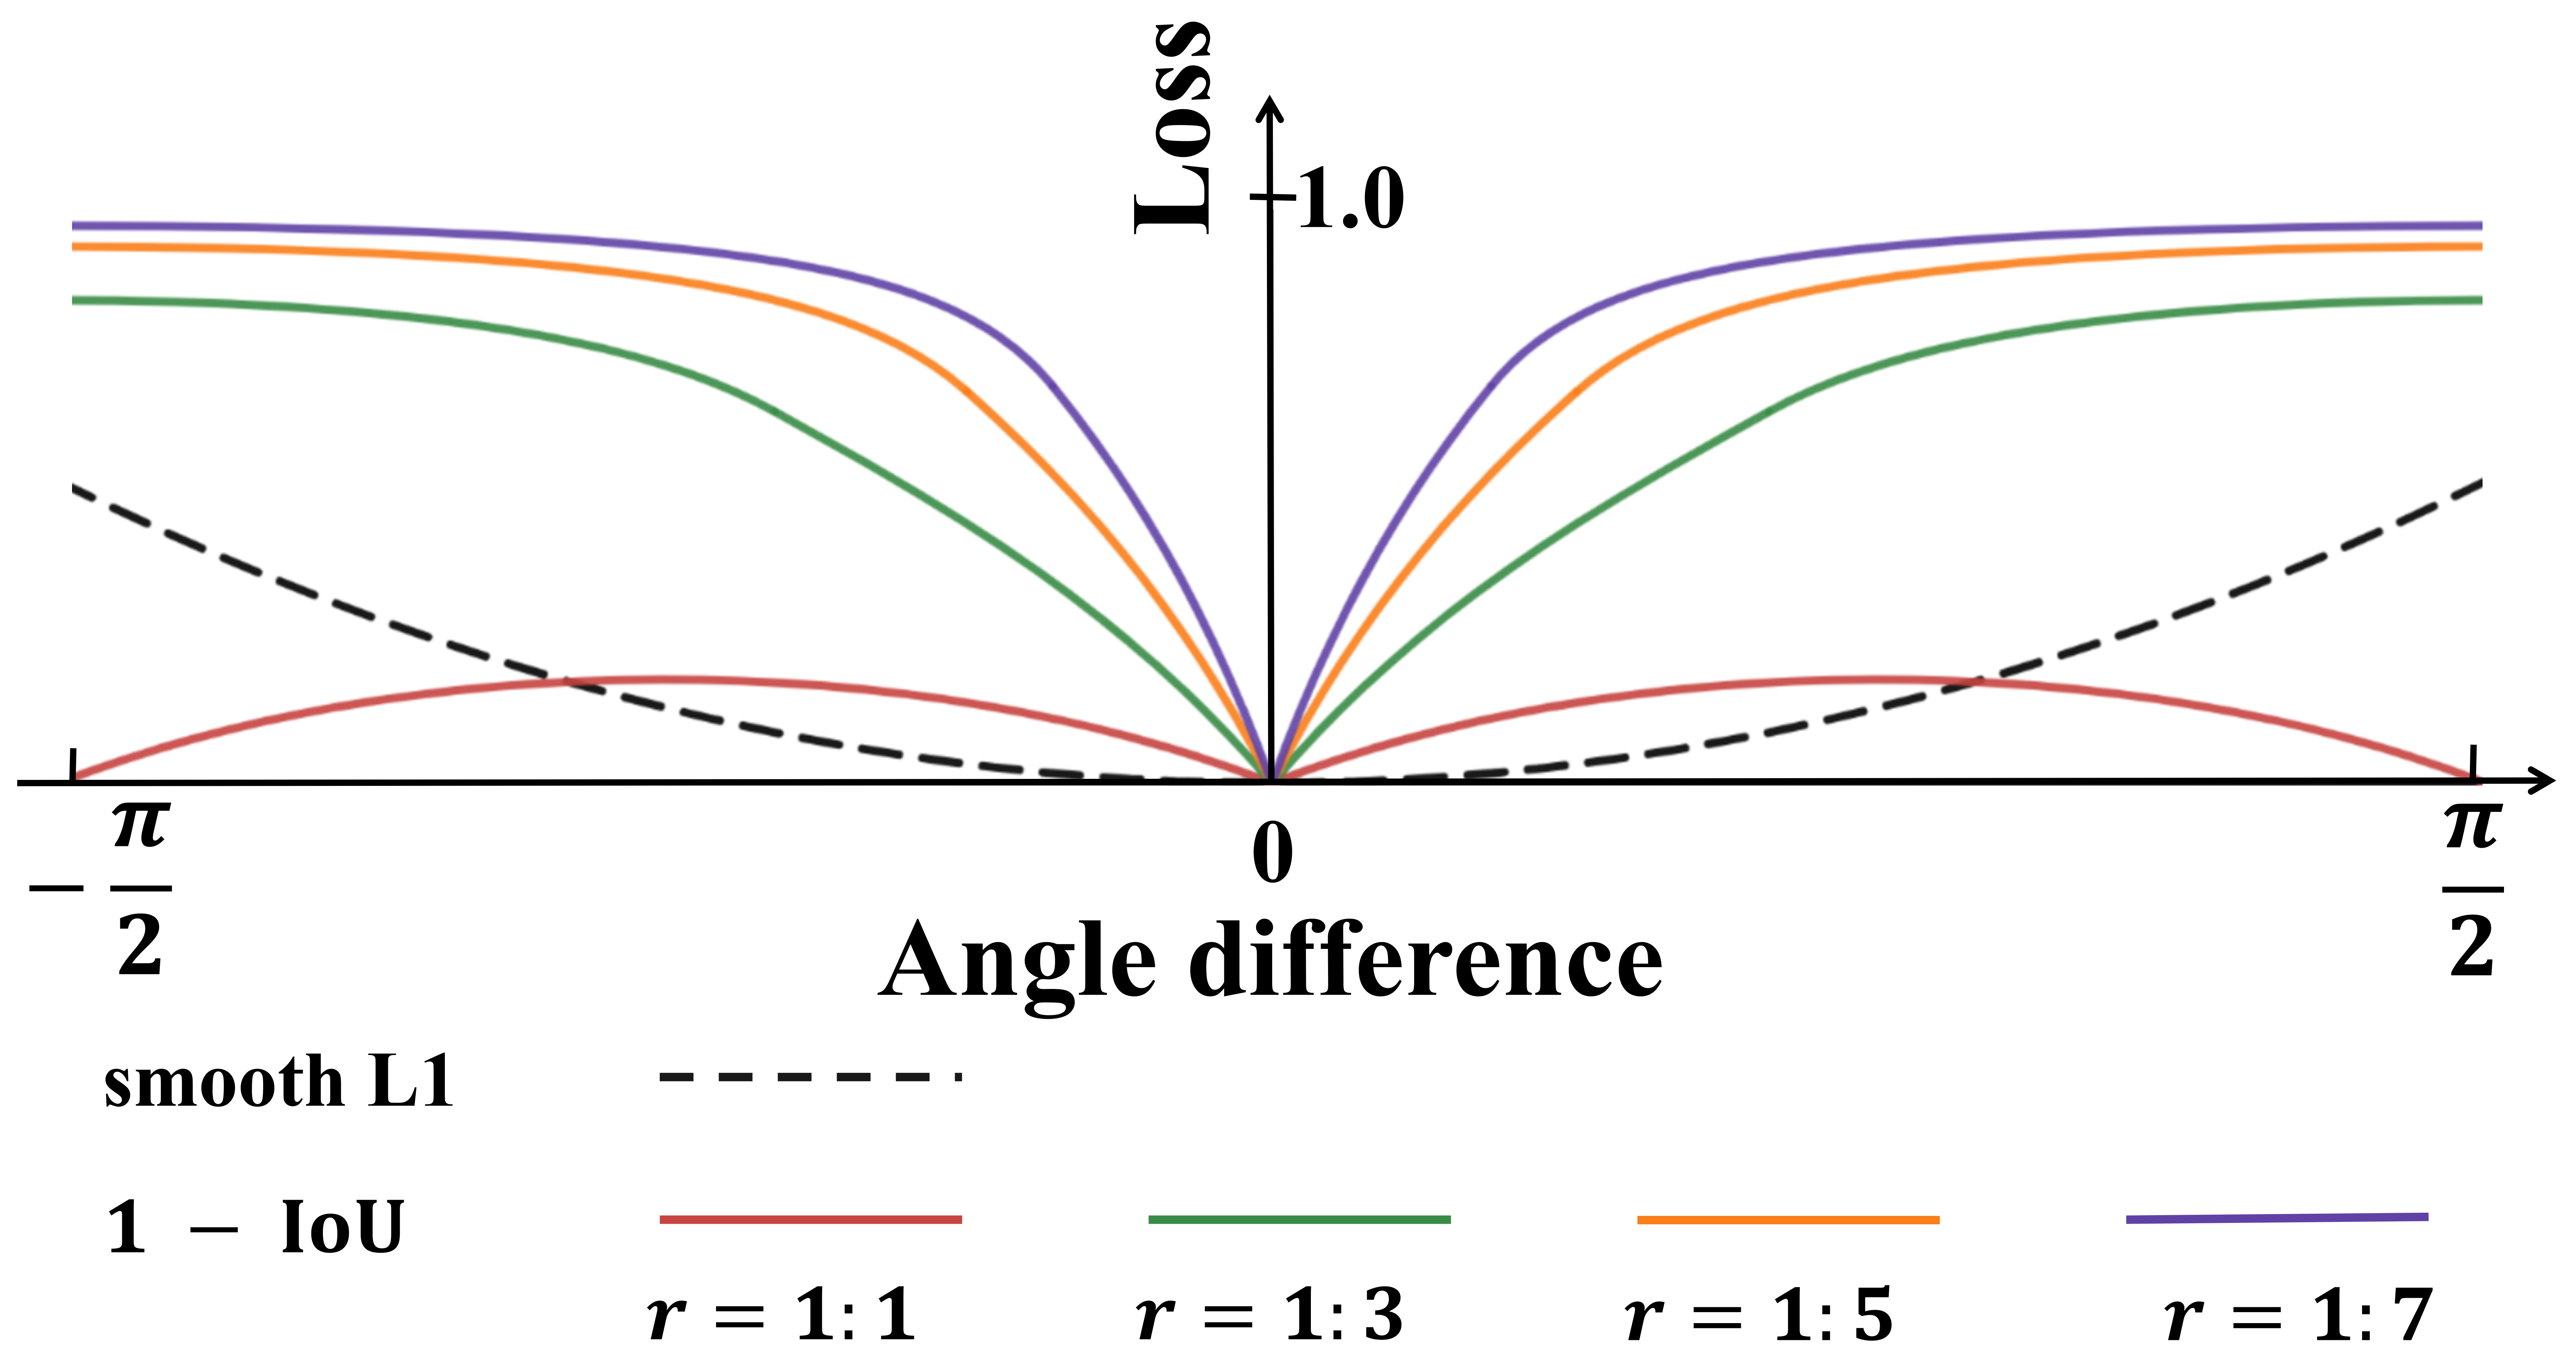
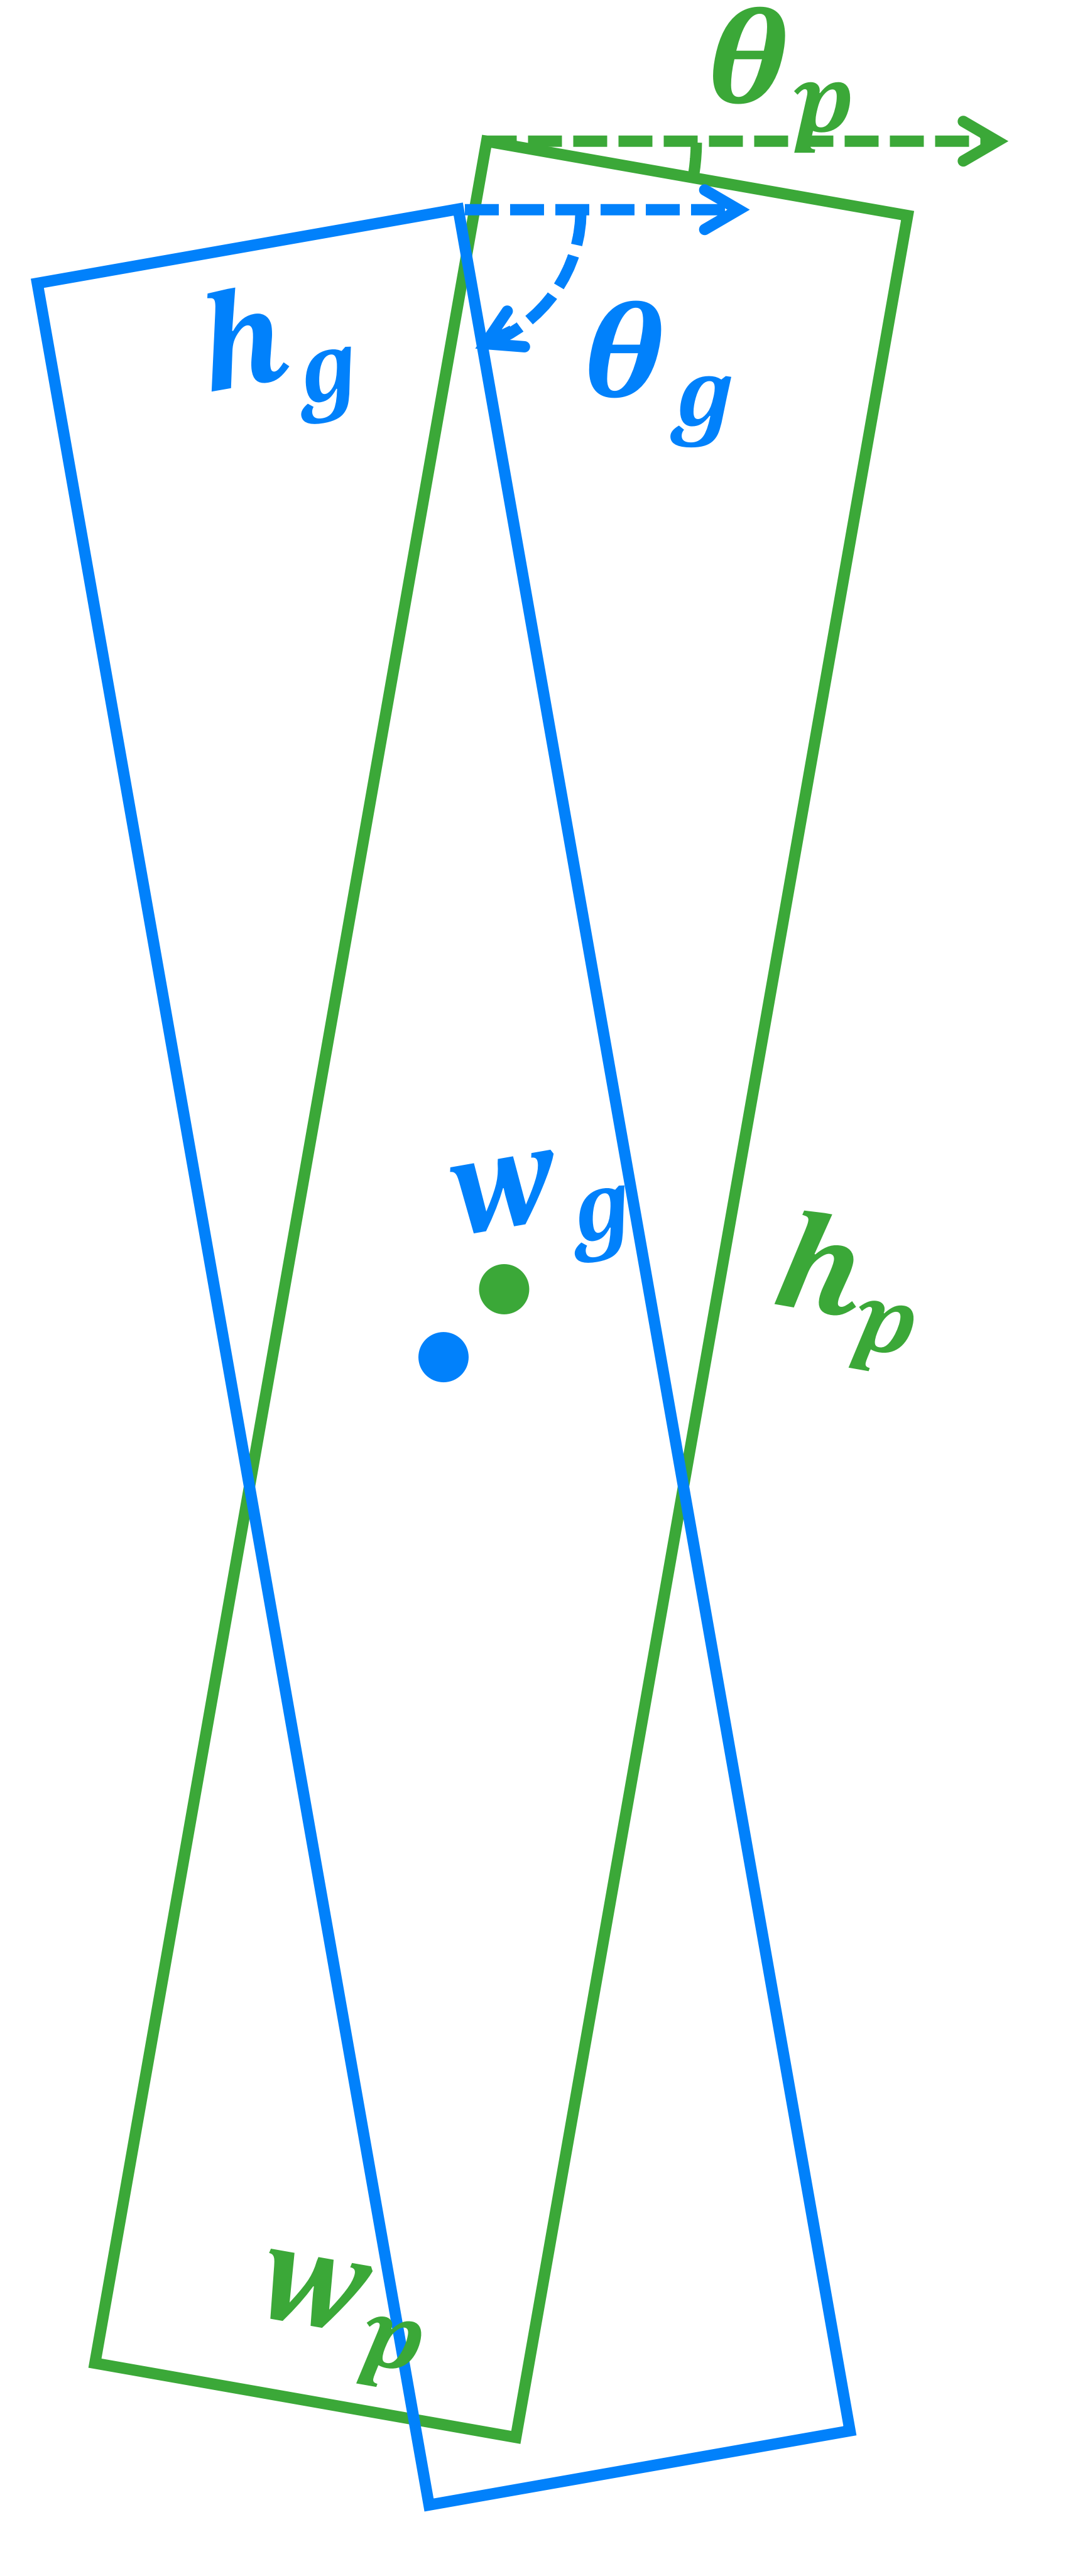
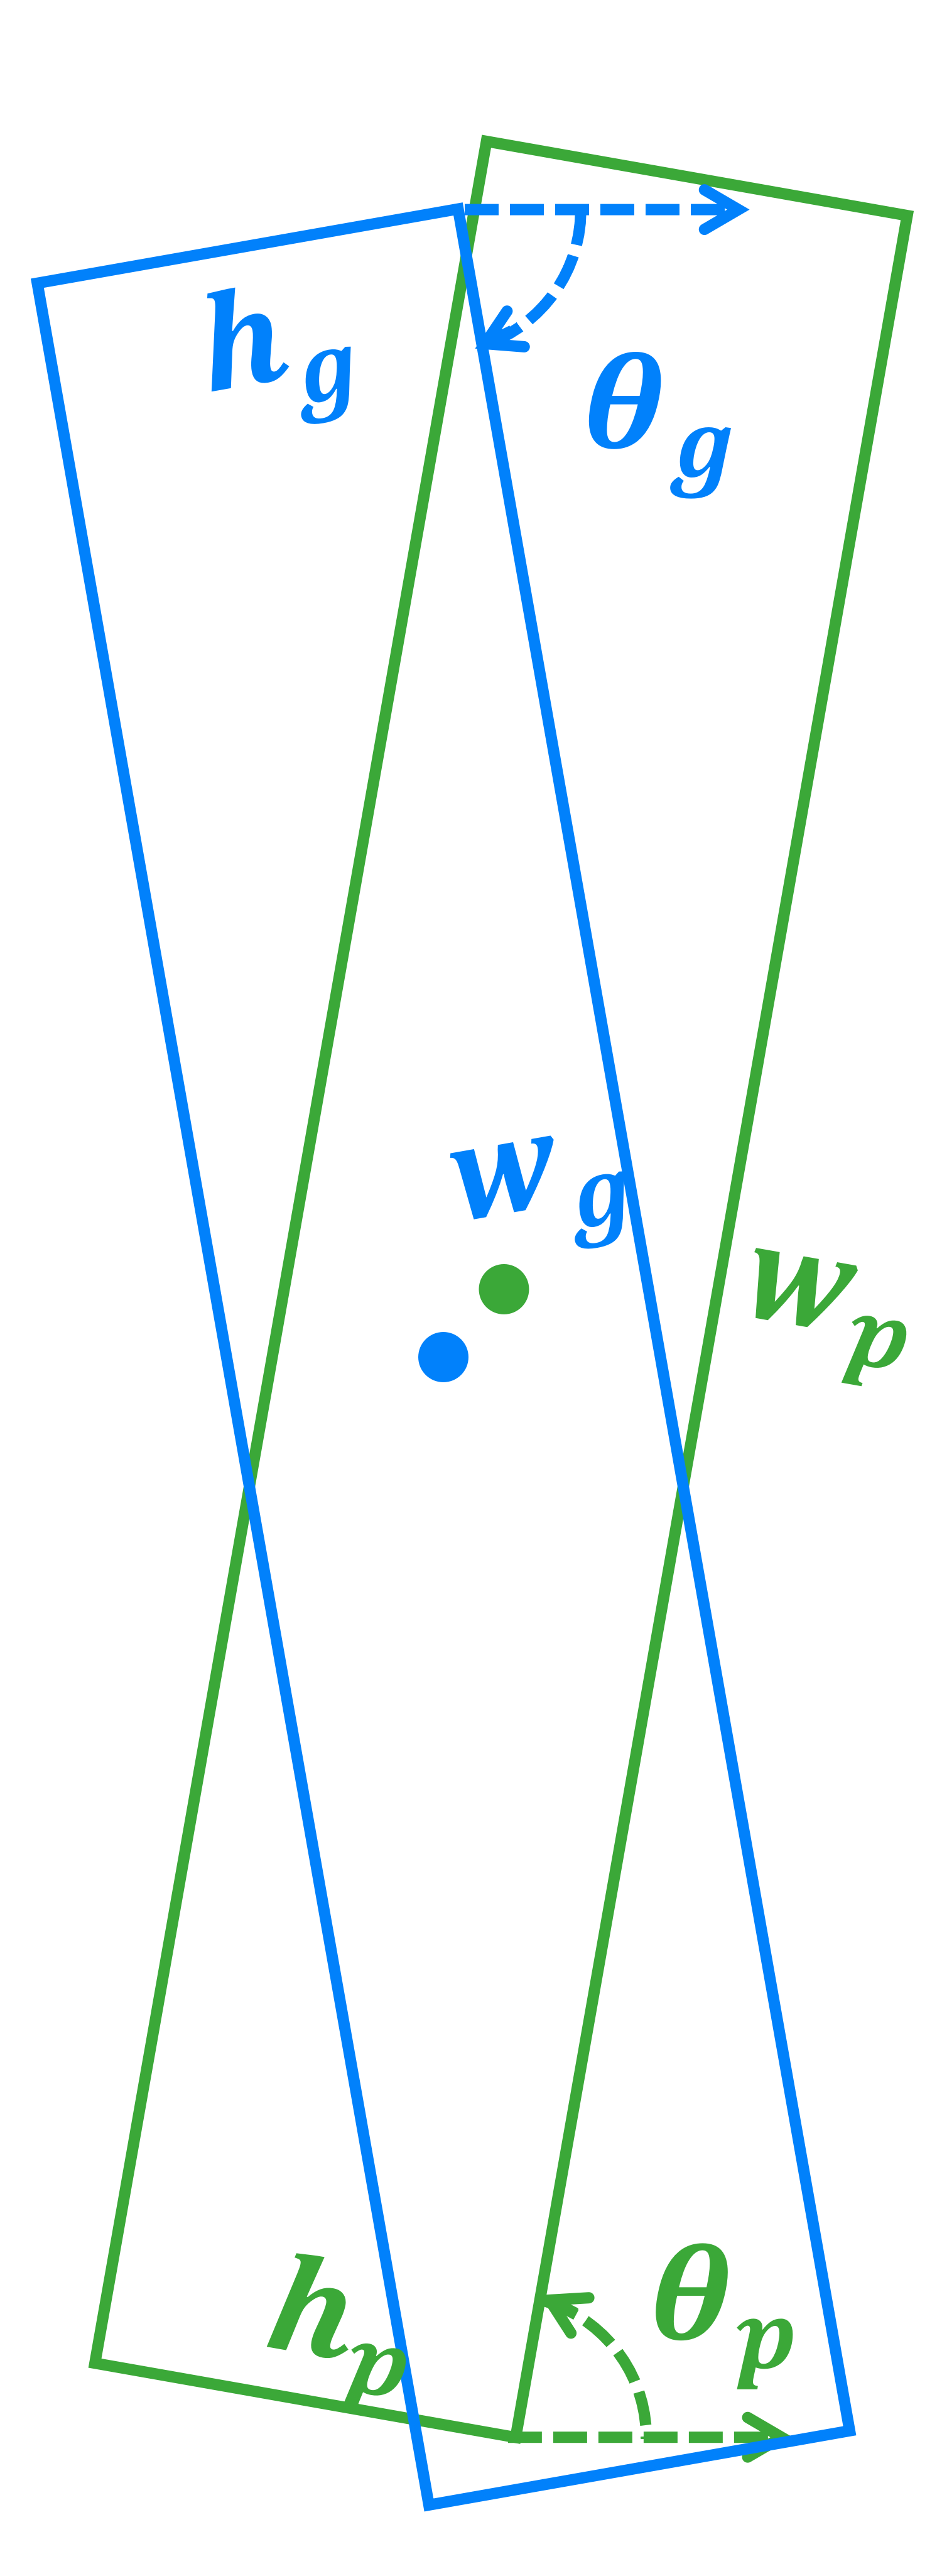
We illustrate the inconsistency between metric and loss in Figure 11. As shown in Figure 11, the top and the bottom rows have different angle differences, while the aspect ratio of the OBBs on the left is different from those on the right. Meanwhile, the center points, width and height of the four cases are the same. The orange area denotes the IoU between OBBs. Note that the regression loss is sensitive to angle variances but remains unchanged for different aspect ratios. Specifically, when the aspect ratio varies, the union of two OBBs will change but the intersection is constant, causing the change of RIoU. The same conclusion can be drawn from Figure 11, which shows the variation curves of the RIoU and smooth L1 loss with respect to aspect ratio under different angle differences. Note that the RIoU changes drastically but the smooth L1 loss remains constant. Furthermore, Figure 11 shows the variation curve of RIoU and smooth L1 loss with respect to the angle under different aspect ratios. In the neighborhood of 0, both losses are consistent in monotonicity but not in convexity. The RIoU changes more intensely than the smooth L1 loss when the angle difference is close to zero.
Given the above limitations of the smooth L1 loss, numerous IoU-induced loss functions are proposed in horizontal detectors, such as GIoU (Rezatofighi et al., 2019) and DIoU (Zheng et al., 2020). However, these IoU-induced losses cannot be incorporated directly into oriented object detection, because of the in-differentiable nature of RIoU (Yang et al., 2021c). To tackle this problem, several differentiable functions are designed to approximate RIoU loss (Yang et al., 2021b, 2019a, 2022a). Chen et al. (2020b) proposed PIoU by introducing a differentiable kernel function, which accumulates the contribution of interior overlapping pixels to approximate the intersection area. Other solutions (Yang et al., 2019a, 2022a, 2021b) integrated RIoU as a weight of the smooth L1 loss:
| (12) |
The regression loss is defined in Eq. 11 and adopts the smooth L1 loss. is a loss function related to RIoU, e.g. . Compared with the smooth L1 loss, the IoU-smooth L1 loss can be divided into two parts, a normalized regression loss controlling the direction of gradient propagation, and a scalar adjusting gradient magnitude. When the RIoU is close to 1, , and is approximately equal to 0, which can effectively alleviate the inconsistency between the metric and regression loss. However, angle regression still suffers from the problem of PoA. Therefore, the loss functions can only alleviate the impact of the problem, which is not theoretically solved.
5.1.2 Angular Boundary Discontinuity and Square-like Problem
Because of the PoA problem (Yang et al., 2021c, d, 2022; Qian et al., 2021, 2022), the smooth L1 loss suffers from the problem of angular boundary discontinuity, which is illustrated in Figure 12. Specifically, a small angle difference may cause a large loss change when the angular value approaches the angular boundary range. Figure 12 illustrates an ideal OBB representation, where the predicted and GT OBB only differ slightly in terms of the angle and center point. For OBBs with OpenCV definition, the angular value must be an acute or right angle, i.e. , as shown in Figure 12. As a result, the angle difference between the two OBBs increases sharply as the angular value is close to 0 or . In addition, the width of the predicted OBB is the short edge, whereas the width of the GT OBB is the long edge, causing a significant regression loss of width and height. For OBBs under long edge definition with the angular range of , the angular boundary discontinuity leads to a significant angle difference, i.e. , as shown in Figure 12. This problem will also occur in long edge definition with the angular range of when the angular value is close to or .
Additionally, for square-like objects, including storage-tank and roundabouts, the long edge definition will encounter a so-called square-like problem due to the difference of angle parameters (Yang et al., 2021c, d, 2022). As shown in Figure 13, when the aspect ratio is close to 1 but the length and width of the predicted OBB are opposite to that of GT, the corresponding angle will differ by about , leading to a large regression loss even if the RIoU is about 1.
Both boundary discontinuity and square-like problem can seriously confuse the network, leading to training instability. Thus, several methods have been proposed to address these issues, which can be divided into three types:
Modulated rotated loss (Qian et al., 2021, 2022). The modulated Rotated loss is designed for the OBB representation under the OpenCV definition, which adds an extra loss item based on the naive regression loss to eliminate the boundary discontinuity. Specifically, it can be expressed as follows:
| (13) |
Here, and can be calculated as follows:
| (14) | ||||
where represents the L1 loss function. The definitions of and are the same as the Eq. 9 and Eq. 10 respectively. represents the aspect ratio. The motivation for adding a term is to exchange the edges and eliminate the PoA problems. When the angular value is close to the boundary range, may increase suddenly, which is much larger than . Therefore, can effectively eliminate the boundary discontinuity, making the loss continuous. However, although the modulated loss can guarantee loss continuous, the gap between metric and loss still exists.
Angle coder (Yang and Yan, 2020; Yang et al., 2021a; Yu and Da, 2022). Yang and Yan (2020) proposed a new baseline by transforming the angular regression task into a classification problem. The angle is discretized into a certain number of intervals, and then a discrete angle is predicted by classification. Then, the circular smooth label (CSL) technique is designed, which contains a circular label encoding with periodicity to handle the PoA problem. The label smooth technique is adopted using a window function to increase the error tolerance to adjacent angles. Although CSL eliminates the boundary discontinuity, its heavy prediction layer harms the efficiency and the square-like problem remains unsolved. To tackle these issues, Yang et al. (2021a) further adopted Densely Coded Labels (DCL) by introducing a lightweight prediction layer, which reduces the code length. DCL achieved a notable improvement in terms of both accuracy and speed. Moreover, Angle Distance and Aspect Ratio Sensitive Weighting (ADARSW) were designed to improve the accuracy of square-like objects. However, the hyper-parameters have a significant impact on the performance of CSL and DCL. Even worse, the optimal settings on different datasets are also different. Hence, laborious tuning is required to achieve the best performance on different datasets. To solve this problem, Yu and Da (2022) designed a differentiable angle coder, named Phase-Shifting Coder (PSC). PSC encodes the angle into a periodic phase to solve the boundary discontinuity problem. Moreover, to further solve square-like problem, PSCD was proposed by mapping the angle into the phases of different frequencies, which is the advanced dual-frequency version of PSC.
Gaussian distribution based methods (Yang et al., 2021c, d, 2022, 2022b). The Gaussian distribution based methods provide a unified and elegant solution to the problems of boundary discontinuity and the square-like issue. Firstly, the OBB is converted to a 2-D Gaussian distribution by the following formula:
| (15) | ||||
where and represent the rotation matrix and the diagonal matrix of eigenvalues, respectively. As shown in Eq. 15, the angle and the aspect ratio are encoded into the matrix in the Gaussian distribution based method. Therefore, the merit is that the problems of PoA and boundary discontinuity are efficiently solved. As a result, the exchangeability of edges (EoE) and the square-like problem are eliminated.
Then, a distance function is used to measure two Gaussian distributions, such as Gaussian Wasserstein Distance (GWD) (Yang et al., 2021c) or Kullback-Leibler Divergence (KLD) (Yang et al., 2021d). Compared with the smooth L1 loss which optimizes all parameters independently, GWD is a semi-coupled measure, which can optimize width, height and angle jointly. Meanwhile, the center point is optimized independently, which may cause the regressed OBBs to slightly shifted. In addition, GWD is not scaled invariant, which is not robust to detect multi-scale objects. KLD can eliminate the above problem, which can be expressed as:
| (16) | ||||
Note that KLD is a chain coupling of all parameters and is invariant to scale. Therefore, KLD can jointly optimize all parameters and is self-modulated during the training process.
Finally, to obtain consistency between the metric and the regression loss, the distance between Gaussian distributions is converted into an approximate IoU loss using a nonlinear transformation:
| (17) |
where denotes the distance between Gaussian distributions, and represents the non-linear function, such as or . The hyperparameter modulates the entire loss.
However, both GWD and KLD only maintain value-level consistency instead of trend-level consistency between RIoU and regression loss. To tackle this issue, Yang et al. (2022) designed the KFIoU loss based on Kalman filter to achieve the best trend-level alignment with RIoU, which is differentiable and does not require additional hyperparameters. Based on the mechanism of RIoU, KFIoU calculates the overlapping area between two Gaussian distributions via a Kalman filter. Benefiting from the trend-level alignment strategy, KFIoU achieves better performance than GWD and KLD.
5.2 Quadrilateral representation
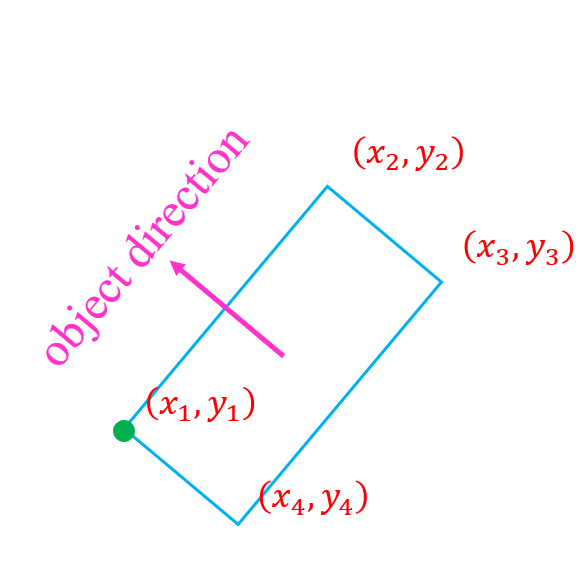
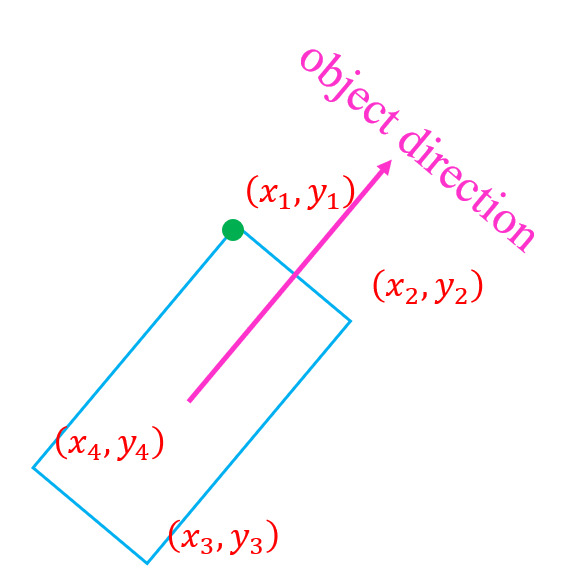
The quadrilateral representation denotes an OBB as a vector , where indicates the image coordinates of the vertex arranged in a clockwise order (Xu et al., 2021a). This representation method can compactly enclose oriented objects with large deformation and has been widely adopted to annotate objects in large-scale RS datasets, including DOTA (Xia et al., 2018; Ding et al., 2022), and HRSC2016 (Liu et al., 2016b). Significantly, the top-left vertex relative to the object direction is chosen as the starting point ), as shown in Figure 14(a).
For the quadrilateral representation, the detector outputs a vector , where represent the relative offsets between the -th vertex of the predicted OBB and the corresponding anchor box. Then, the predicted offsets are used to approximate the GT coordinate offsets between the -th vertex of the GT OBB and that of the anchor box. The regression loss of quadrilateral OBB representation can be expressed as:
| (18) |
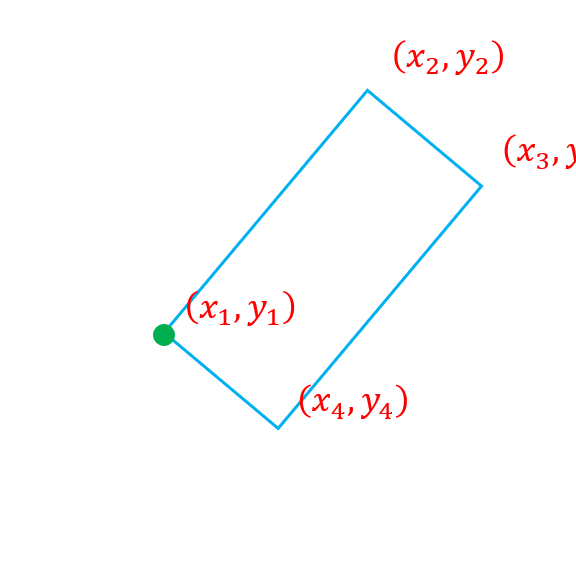
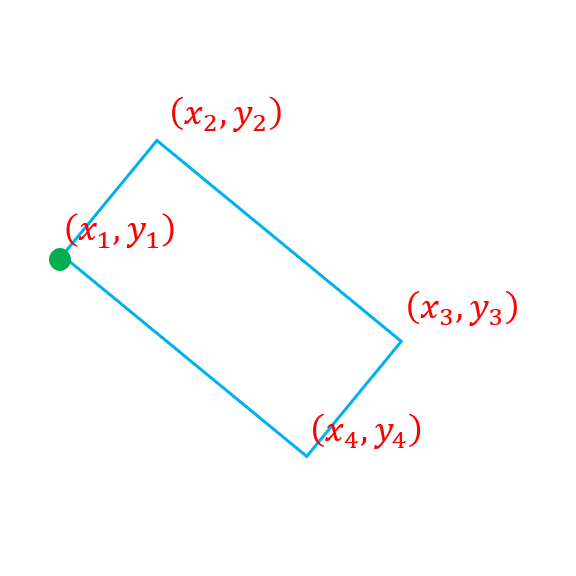
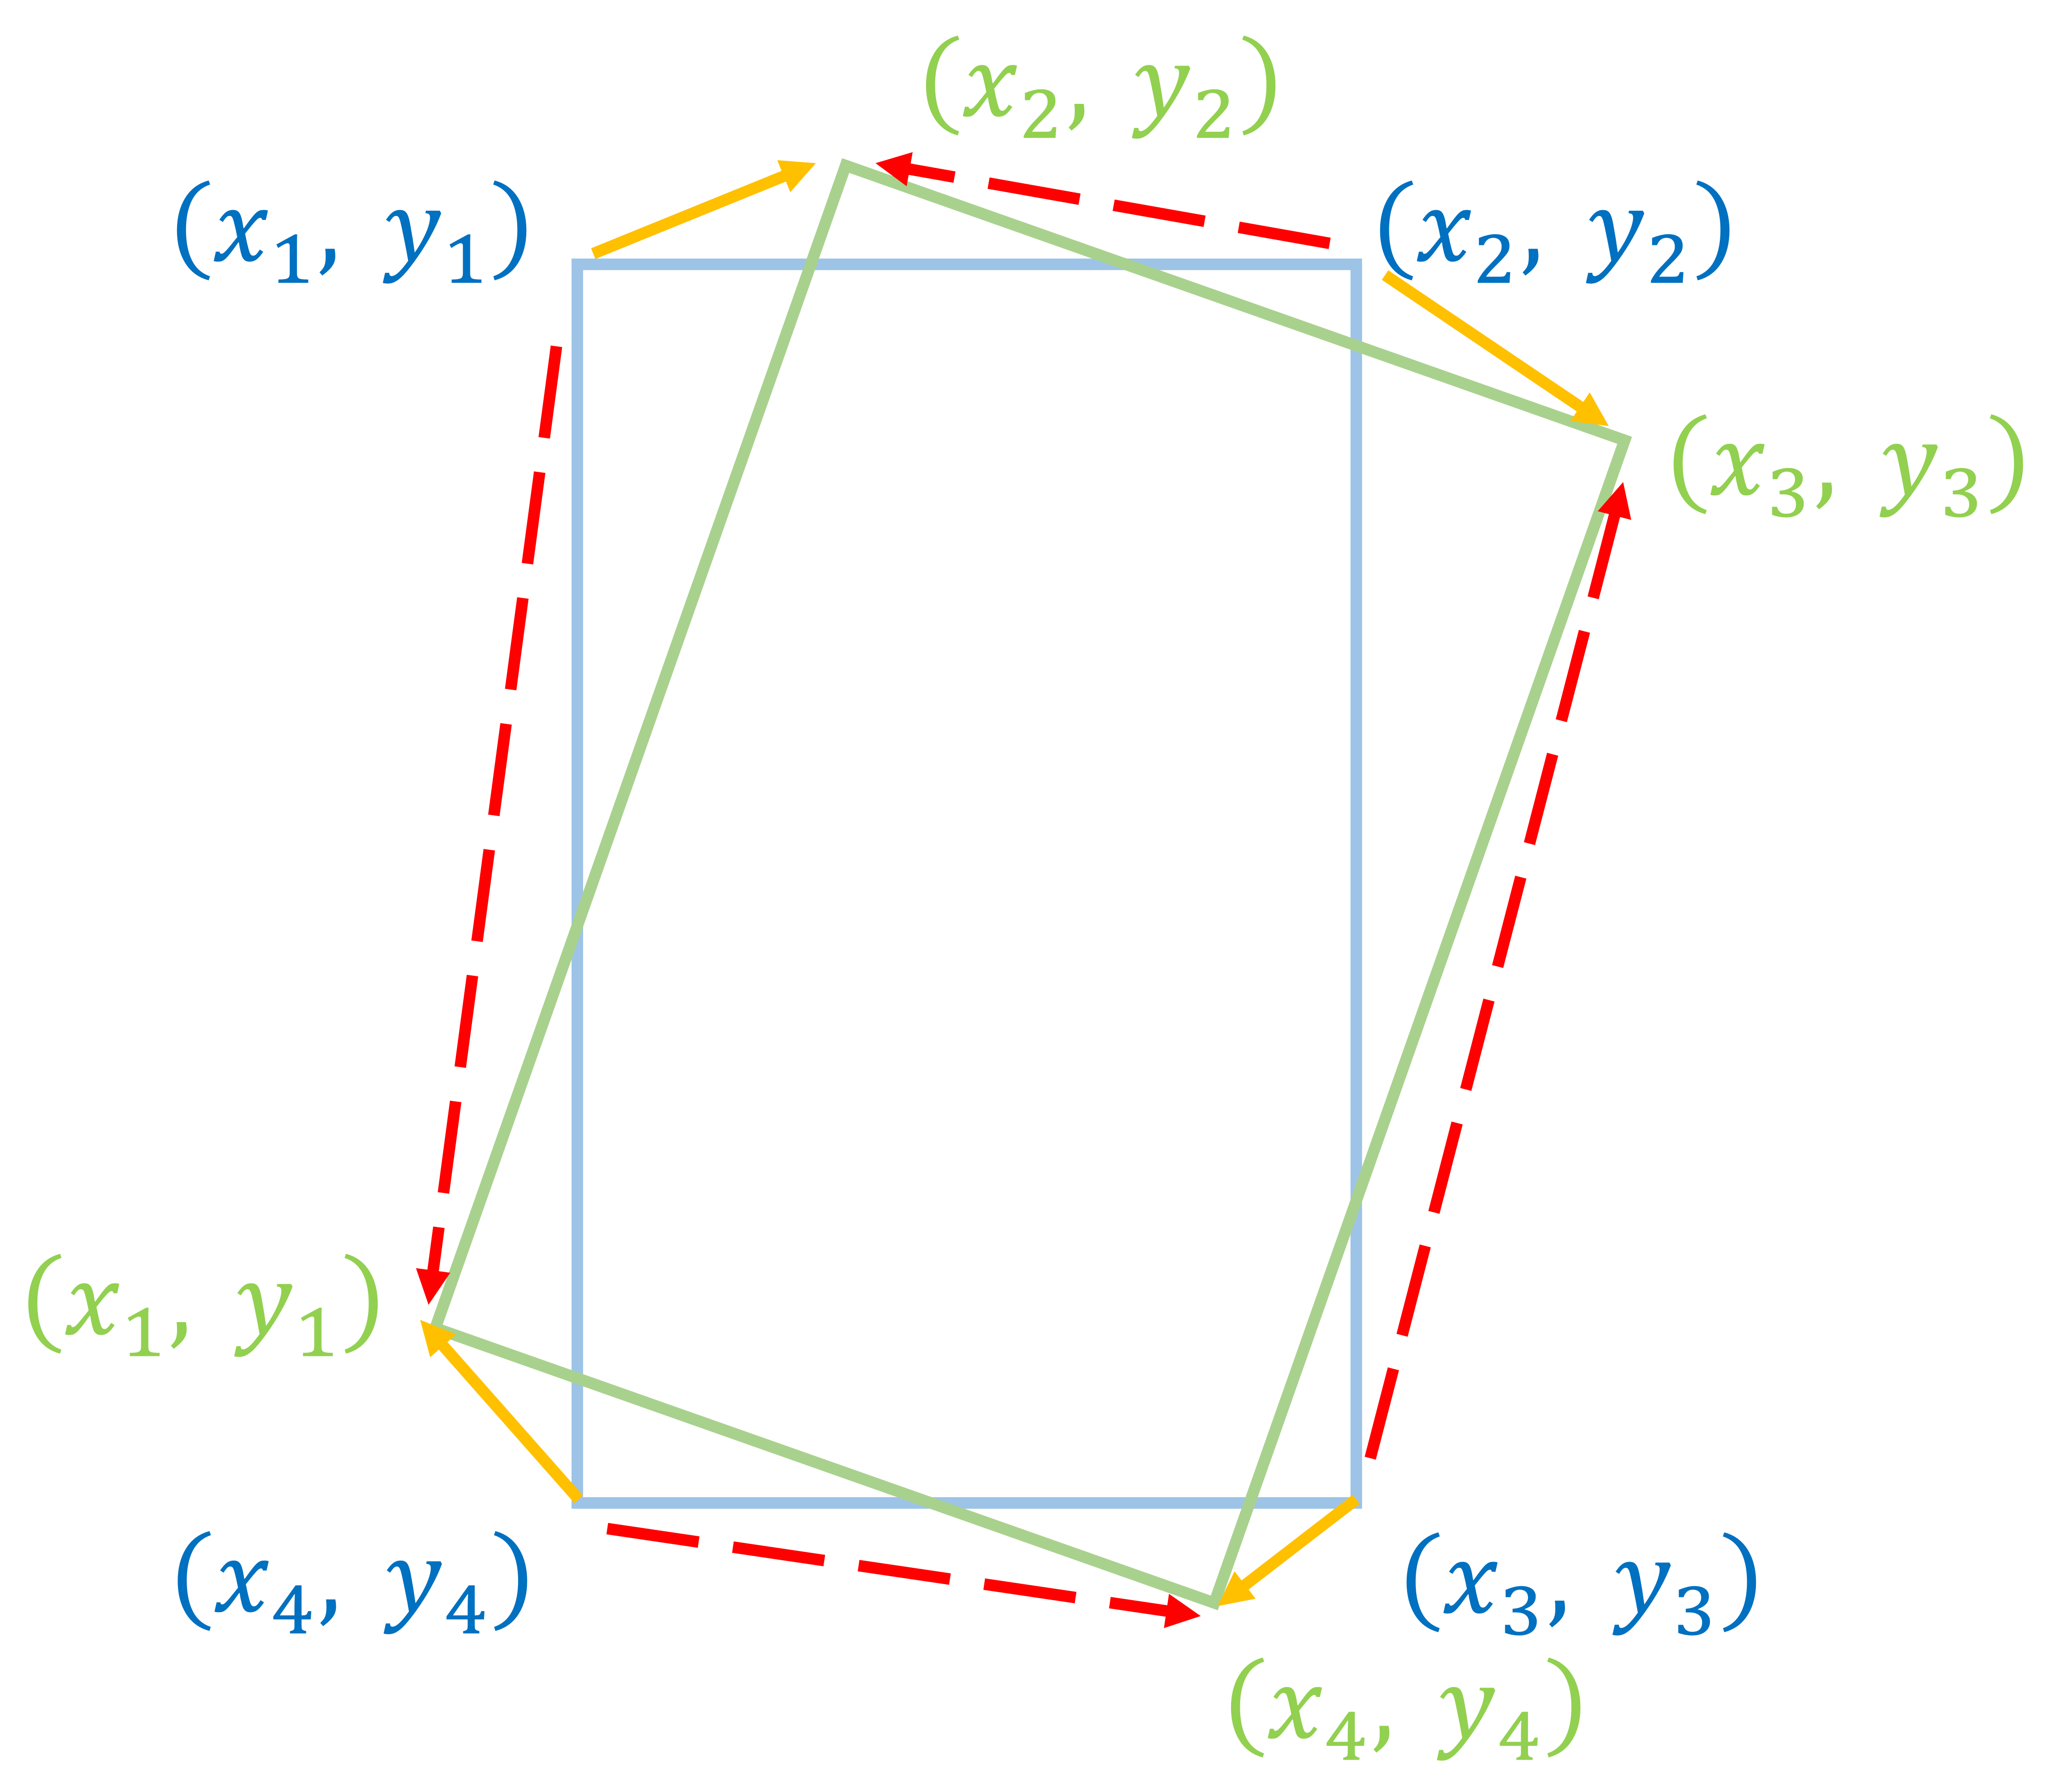
Generally, the anchor box selects the top-left vertex in the image as the starting point. To ensure consistency, the leftmost vertexes of the predicted OBB and the corresponding GT OBB are chosen as the starting point, as shown in Figure 14(b). However, the inappropriate vertex sorting may cause inconsistencies between the vertex sequences of the anchor and the GT OBB, which is known as the vertexes sorting problem or the corners sorting problem (Qian et al., 2021, 2022; Xu et al., 2021a). Figure 15 shows a case of the problem. The anchor and the GT OBB are shown in blue and green respectively, and the dashed line and the solid line denote the actual and ideal vertexes matching during regression. In the ideal setting, the vertexes matching from the anchor to the GT is: . However, in the actual regression, the vertexes matching is: . Such inconsistency causes a large regression loss, confusing the network during the training process. Hence, it is critical to determine the sequence of vertexes in advance to stabilize the training process.
To solve the above problem, an eight-parameter version of modulated loss (Qian et al., 2021, 2022) was devised. Specifically, the order of the four vertices of the predicted box is moved clockwise and counterclockwise by one place respectively. Hence, the corresponding loss can be calculated by:
| (19) | ||||
where and represent the offsets between the -th vertex of the predicted OBB and the GT OBB, respectively. The formula of modulated loss can be expressed as:
| (20) |
Here, is defined in Eq. 18 and adopts the L1 loss.
Xu et al. (2021a) proposed an effective way to avoid sorting vertex, which glides the vertex of the horizontal anchor on each corresponding side. Specifically, it regresses four length ratios representing the gliding offset on each corresponding side, which can eliminate the confusion caused by vertex sorting.
5.3 -based representation vs. Quadrilateral representation
As discussed in this section, an enormous amount of research effort is devoted to resolving the challenges encounter by -based representation and quadrilateral representation. As -based representation is improved from horizontal object representation and can represent a rectangular box, it receives more attention than quadrilateral representation. In contrast, a detector based on quadrilateral representation generally can not generate a rectangular box without a post-processing operator, thus quadrilateral representation is not suitable for a two-stage detector that contains an RRoI operator. As a result, -based representation seems to be a more reasonable representation in oriented object detection. However, quadrilateral representation can represent objects more accurately as not all objects are rectangular.
6 Feature Representations
Extracting powerful feature representations plays a crucial role in high-precision detection (Dalal and Triggs, 2005; Girshick et al., 2014; Simonyan and Zisserman, 2015; He et al., 2016; Zhu et al., 2016), because robust feature representations can promote the precision of localization and the accuracy of classification remarkably. Early efforts focused on designing local feature representations, such as HOG (Dalal and Triggs, 2005), BoW (Fei-Fei and Perona, 2005), and Haar (Leitloff et al., 2010). These features require careful manual feature engineering and considerable domain knowledge. Recently, there are increasing deep learning networks with powerful feature representations springing up thick and fast, which design better network architectures to enhance the capability of feature representations, e.g. AlexNet (Krizhevsky et al., 2012, 2017), VGGNet (Simonyan and Zisserman, 2015), GoogLeNet (Szegedy et al., 2015), Inception series (Ioffe and Szegedy, 2015; Szegedy et al., 2016, 2017), ResNet (He et al., 2016), DenseNet (Huang et al., 2017). For oriented object detection, a great deal of effort is devoted to improving feature representations by extracting rotation-invariant features and feature enhancement.
6.1 Rotation-Invariant Feature
In order to obtain rotation-invariant features, RRoI operators and data augmentation have been fully explored. Specifically, there are various ROI operators have been proposed to extract rotation-invariant features from feature maps, including RRoI Pooling (Ma et al., 2018), RRoI Align (Yang et al., 2018a; Ding et al., 2019), and alignment convolution (Han et al., 2022a). However, since the regular CNN-based blocks are only translation-invariant, the feature maps extracted by these blocks are sensitive to rotation. Therefore, the pipeline composed of regular CNNs and RRoI operators is sub-optimal, even if it can extract approximately rotation-invariant features by adopting large networks trained on an enormous number of samples. To remedy the above shortcomings, random rotation based data augmentation has been adopted during network training, since it can enhance the rotation variations of training samples. Although global generalization can be improved, local rotational information is abandoned to some degree when random rotation being used (Worrall et al., 2017). In addition, it is difficult to quantify and interpret the rotational information extracted by CNN blocks trained with rotation-based data augmentation (Lenc and Vedaldi, 2015).
Therefore, the above methods fail to extract exactly rotation-invariant features (Han et al., 2021c). Recently, group equivariant convolutional neural networks (G-CNN) (Cohen and Welling, 2016) is proposed to achieve rotation equivariance. G-CNN utilizes different channels to represent feature information from different orientations, showing powerful rotation-invariant feature extraction ability on the task of image classification. What’s more, several G-CNN-based variants (Worrall et al., 2017; Marcos et al., 2017; Weiler and Cesa, 2019; Weiler et al., 2018) are proposed to extend rotation equivariance and achieve promising performance on the Rotated MNIST (Liu et al., 2003; Larochelle et al., 2007) dataset. The philosophy of G-CNN and its variants is transforming an image by a transformation and then passing it through the network should give the same result as first extracting image features by the network and then transforming the feature map, which can be expressed as:
| (21) |
where and denote the transformations, while and denotes the input image and the neural network (Cohen and Welling, 2016). Note that the transformation and need not be the same.
Recently, inspired by the achievements of equivariant networks in image classification, some works incorporate rotation-equivariant networks into object detectors, including ReDet (Han et al., 2021a), CHPDet (Zhang et al., 2022). Based on the framework of RoI Transformer (Ding et al., 2019), ReDet adopts rotation-equivariant networks instead of the ordinary ResNet modules (He et al., 2016) as the backbone. Compared to CNNs which adopt translational weight sharing to achieve translation equivariance, rotation-equivariant networks further share weights over filter orientations to encode rotation equivariance. Thus, the orientation-dependent responses for different orientations can be obtained, which is useful for oriented object detection. Besides, the rotational weight sharing can reduce the model size greatly. To obtain the rotation-invariant features in both spatial and orientation dimensions from the rotation-equivariant feature, a Rotation-invariant RoI (RiRoI) Align operator is designed. Specifically, according to the orientation predicted by RoI Transformer (Ding et al., 2019), orientation channels circular switch and interpolation are adopted to transform the rotation-equivariant features into rotation-invariant features.
6.2 Enhanced Feature Representations
In order to accommodate the variations of scale, orientation, appearance, pose and background, a great deal of effort was devoted to enhancing object feature representations.
As discussed in Section 4, two-stage and one-stage frameworks adopt deep CNN modules and FPN architectures to learn robust multi-level feature representations. Such a combination integrates semantic and spatial information from different layers to detect objects in multi-scales. To make full use of the multi-level feature representations extracted by the backbone, recent works have improved the FPN architectures in the tasks of oriented object detection. Yang et al. (2018b) designed a Rotation Dense Feature Pyramid Network, dubbed R-DFPN, which enhances feature fusion and reuses features through a dense connection. To ensure the discriminability of feature maps, RDD (Zhong and Ao, 2020) added a convolutional layer before up-sampling the feature map and a convolutional layer after summing feature maps of the adjacent layers. In addition, there are also a series of works in generic object detection are proposed to develop the variants of FPN architecture, which achieves remarkable advances and can be used in oriented object detection, including PANet (Liu et al., 2018), ASFF (Liu et al., 2019), M2Det (Zhao et al., 2019a), NAS-FPN (Ghiasi et al., 2019), BiFPN (Tan et al., 2020b), and Recursive FPN (Qiao et al., 2021).
On the other hand, attention mechanism shows promising performance in modeling long-range dependencies. It has been widely used in image classification (Mnih et al., 2014), natural language processing (Vaswani et al., 2017), and generic object detection (Yoo et al., 2015; Li et al., 2019; Tian et al., 2022; Yu and Ji, 2022; Wang et al., 2019). In recent years, several attention methods (Pan et al., 2020; Yang et al., 2019a, 2022a) have been proposed to capture more effective feature representations, which usually combines both pixel-level attention network and channel-level attention network to suppress the noise and enhance the object information. SCRDet (Yang et al., 2019a) adopts the pixel attention network to generate a saliency map that can separate foreground from background, and use Squeeze-and-Excitation (SE) blocks (Hu et al., 2020) as the channel attention network to further enhance the saliency map. Pan et al. (2020) designed a feature selection module to adjust receptive fields adaptively, which proposes a channel attention network to fuse the feature extracted by using kernels of different sizes, aspect ratios, and orientations adaptively.
Transformer has first applied to natural language processing (Vaswani et al., 2017), which mainly adopts the self-attention mechanism to capture global feature representations. Recently, such architecture has achieved significant success in the field of computer vision (Dosovitskiy et al., 2021; Liu et al., 2021b; Han et al., 2023). Benefit from the exceptional feature representation capacity, more and more Transformer-based methods are proposed for generic object detection and obtain impressive performance, which is mainly divided into two groups (Han et al., 2023):
1) Transformer-based set prediction, which utilize set prediction to address detection tasks to remove hand-crafted components (e.g., anchor and NMS), including DETR (Carion et al., 2020) and its variants (Zhu et al., 2021; Sun et al., 2021; Gao et al., 2021); Based on DETR (Carion et al., 2020), O2DETR (Ma et al., 2021) was proposed to utilize the Transformer for the oriented object detection task. In addition, the depthwise separable convolutions (Sifre and Mallat, 2013; Chollet, 2017; Haase and Amthor, 2020) is introduced to replace the computationally complex self-attention mechanism, making networks more lightweight and speeding up the training. However, there are several problems with Transformer-based detectors, including misalignment, dense distribution and limited matching. To tackle these issues, Dai et al. (2022) proposed AO2-DETR based on Deformable DETR (Zhu et al., 2021), comprising three components: an oriented proposal generation (OPG) mechanism for generating oriented region proposals as object queries; an adaptive oriented proposal refinement (OPR) module for aligning the convolutional features and adjusting the oriented proposals; and a rotation-aware set matching loss for ensuring the correct match between the predicted OBBs and ground truth.
2) Transformer-based feature representations, which replace some components of existing detection frameworks with Transformer or redesigned Transformer architectures, such as backbone networks (Han et al., 2021b; Wang et al., 2021c), FPN architecture (Zhang et al., 2020b), and prediction head (Hu et al., 2018; Chi et al., 2020). To reduce the computational cost and memory footprint of full attention in ViT (Dosovitskiy et al., 2021; Xu et al., 2021b; Zhang et al., 2023), Wang et al. (2022) design local rotated window attention, named rotated varied-size window attention (RVSA). RVSA can learn trainable scale, offsets and orientation to obtain the locally oriented windows at different sizes, locations and angles adaptively, enabling it to extract more useful feature representations. Furthermore, to explore the effectiveness of unsupervised pretraining, MAE (He et al., 2022) is employed to pretrain the model on the MillionAID dataset (Long et al., 2021). With the pretraining method MAE and RVSA, the detector outperformed all previous methods, achieving and mAP on DOTA-V1.0 and DIOR-R datasets, respectively. However, the main limitation of Transformer is the long training convergence time and heavy computation cost, compared to CNN. The future effort is demanded to explore the potential of Transformer for oriented object detection and solve the speed bottleneck problem.
Learning effective and rich feature representations plays a critical role in the field of oriented object detection. Although current feature representation algorithms have demonstrated effective and powerful performance in recent years, there remains tremendous potential for further development.
7 State-of-the-Art Methods
As a comprehensive survey on oriented object detection, this paper introduces recent advances and provides a structural taxonomy based on meta frameworks, OBB representations, and feature presentations in Sections 4, 5, and 6, respectively. In this section, we select several publicly available detectors to compare them in a unified manner. Specifically, we take DOTA-V1.0 dataset since it contains almost all the typical challenges of this task, including arbitrary orientations, large scale variations, and large aspect ratio. We report the performance of the state-of-the-art detectors in terms of mAP in Table 5. The top three scores in each category are marked in bold, red, and blue, respectively. According to the performance comparison and previous discussion, we concentrate on the key elements that evolved in oriented object detection, including detection frameworks, feature representations, loss functions, and data augmentation.
(1) Detection frameworks: two-stage vs one-stage.
Two-stage detectors achieve the best performance in terms of mAP, since they can extract accurate region-based features which are more suited for the tasks of classification and regression. The typical two-stage oriented object detection methods commonly designed a rotated proposal generation scheme to obtain more accurate proposals, such as RoI Transformer (Ding et al., 2019) and Oriented RCNN (Xie et al., 2021). Similarly, the majority of one-stage detectors introduce a refined stage to align features, including R3Det (Yang et al., 2021b), S2ANet (Han et al., 2022a), CFA (Guo et al., 2021), and Oriented RepPoints (Li et al., 2022b). Benefiting from the additional refined stage and the advanced loss functions, one-stage detectors can also reach approximate accuracy to two-stage detectors.
(2) Feature representations: CNN vs. Transformer.
As one of the most important components in oriented object detection, backbone networks play a critical role in learning high-level semantic feature representation. The most widely used backbone networks include ResNet (He et al., 2016; Xie et al., 2017) series and Transformer architectures (Dosovitskiy et al., 2021; Xu et al., 2021b; Zhang et al., 2023; Liu et al., 2021b). The ResNet-based backbone is normally combined with FPN. Although Transformer-based methods have dominated the majority of computer vision tasks, they slightly outperform CNN-based counterparts in oriented object detection. Specifically, Oriented RCNN-RVSA (Wang et al., 2022), as the top-performing detector based on Transformer, only surpasses Oriented RCNN (Xie et al., 2021) by in terms of mAP. In addition, compared to CNNs, Transformers suffer from longer training convergence time and expensive computing costs.
(3) Loss functions.
Advanced loss functions are conducive to alleviating the problems caused by orientation parameters and achieving better regression in one-stage detectors, including GWD (Yang et al., 2021c), KLD (Yang et al., 2021d), and KFIoU (Yang et al., 2022). As can be seen in the results of multi-scale training and testing, when taking ResNet-152 as the backbone R3Det-GWD, R3Det-KLD, and R3Det-KFIoU outperform R3Det (Yang et al., 2021b) by , , and in terms of mAP, respectively. In particular, for objects with a large aspect ratio, such as bridge (BR) and harbor (HB), as well as objects with a large scale, such as ground track field (GTF) and Roundabout (RA), R3Det with advanced loss functions can achieve approximate mAP improvement. The reason may be that Gaussian distribution based methods can jointly optimize the OBB parameters.
(4) Data augmentation.
The multiscale training and testing (MS) generally first resize the original images to three scales, i.e. , which are then cropped to patches of with a stride of 524. In contrast, the single scale training and testing (SS) only crops the original images to patches of with a stride of 824. As can be seen in Table 5, detectors with MS achieve an average approximate improvement in terms of mAP. For objects with a large scale, such as ground track field (GTF) and soccer ball field (SBF), and objects with small scale and weak features, such as helicopter (HC), MS promotes detectors by in terms of mAP. Extensive experiments have proven that MS is a useful strategy to alleviate scale variations. However, MS suffers from extremely long times for training and inference, which are about 10 times that of SS.
| Method | Backbone | PL1 | BD | BR | GTF | SV | LV | SH | TC | BC | ST | SBF | RA | HA | SP | HC | mAP | |
| Single-scale | ||||||||||||||||||
| One-stage | R3Det (Yang et al., 2021b) | R-101 | 88.76 | 83.09 | 50.91 | 67.27 | 76.23 | 80.39 | 86.72 | 90.78 | 84.68 | 83.24 | 61.98 | 61.35 | 66.91 | 70.63 | 53.94 | 73.79 |
| S2ANet (Han et al., 2022a) | R-101 | 88.70 | 81.41 | 54.28 | 69.75 | 78.04 | 80.54 | 88.04 | 90.69 | 84.75 | 86.22 | 65.03 | 65.81 | 76.16 | 73.37 | 58.86 | 76.11 | |
| CFA∗ (Guo et al., 2021) | R-152 | 89.08 | 83.20 | 54.37 | 66.87 | 81.23 | 80.96 | 87.17 | 90.21 | 84.32 | 86.09 | 52.34 | 69.94 | 75.52 | 80.76 | 67.96 | 76.67 | |
| R3Det-KLD (Yang et al., 2021d) | R-50 | 88.90 | 84.17 | 55.80 | 69.35 | 78.72 | 84.08 | 87.00 | 89.75 | 84.32 | 85.73 | 64.74 | 61.80 | 76.62 | 78.49 | 70.89 | 77.36 | |
| R3Det-GWD (Yang et al., 2021c) | R-152 | 88.74 | 82.63 | 54.88 | 70.11 | 78.87 | 84.59 | 87.37 | 89.81 | 84.79 | 86.47 | 66.58 | 64.11 | 75.31 | 78.43 | 70.87 | 77.57 | |
| Oriented RepPoints∗ (Li et al., 2022b) | Swin-T | 89.11 | 82.32 | 56.71 | 74.95 | 80.70 | 83.73 | 87.67 | 90.81 | 87.11 | 85.85 | 63.60 | 68.60 | 75.95 | 73.54 | 63.76 | 77.63 | |
| Two-stage | ROI Trans. (Ding et al., 2019) | R-101 | 88.64 | 78.52 | 43.44 | 75.92 | 68.81 | 73.68 | 83.59 | 90.74 | 77.27 | 81.46 | 58.39 | 53.54 | 62.83 | 58.93 | 47.67 | 69.56 |
| SCRDet (Yang et al., 2019a) | R-101 | 89.98 | 80.65 | 52.09 | 68.36 | 68.36 | 60.32 | 72.41 | 90.85 | 87.94 | 86.86 | 65.02 | 66.68 | 66.25 | 68.24 | 65.21 | 72.61 | |
| Gliding Vertex (Xu et al., 2021a) | R-50 | 89.64 | 85.00 | 52.26 | 77.34 | 73.01 | 73.14 | 86.82 | 90.74 | 79.02 | 86.81 | 59.55 | 70.91 | 72.94 | 70.86 | 57.32 | 75.02 | |
| AOPG∗ (Cheng et al., 2022a) | R-101 | 89.14 | 82.74 | 51.87 | 69.28 | 77.65 | 82.42 | 88.08 | 90.89 | 86.26 | 85.13 | 60.60 | 66.30 | 74.05 | 67.76 | 58.77 | 75.39 | |
| DODet (Cheng et al., 2022b) | R-101 | 89.61 | 83.10 | 51.43 | 72.02 | 79.16 | 81.99 | 87.71 | 90.89 | 86.53 | 84.56 | 62.21 | 65.38 | 71.98 | 70.79 | 61.93 | 75.89 | |
| SCRDet++ (Yang et al., 2022a) | R-101 | 89.77 | 83.90 | 56.30 | 73.98 | 72.60 | 75.63 | 82.82 | 90.76 | 87.89 | 86.14 | 65.24 | 63.17 | 76.05 | 68.06 | 70.24 | 76.20 | |
| ReDet (Han et al., 2021a) | ReR-50 | 88.79 | 82.64 | 53.97 | 74.00 | 78.13 | 84.06 | 88.04 | 90.89 | 87.78 | 85.75 | 61.76 | 60.39 | 75.96 | 68.07 | 63.59 | 76.25 | |
| Oriented RCNN (Xie et al., 2021) | R-101 | 88.86 | 83.48 | 55.27 | 76.92 | 74.27 | 82.10 | 87.52 | 90.90 | 85.56 | 85.33 | 65.51 | 66.82 | 74.36 | 70.15 | 57.28 | 76.28 | |
| AO2-DETR (Dai et al., 2022) | R-50 | 89.27 | 84.97 | 56.67 | 74.89 | 78.87 | 82.73 | 87.35 | 90.50 | 84.68 | 85.41 | 61.97 | 69.96 | 74.68 | 72.39 | 71.62 | 77.73 | |
| Oriented RCN-RVSA(Wang et al., 2022) | ViTAE | 89.38 | 84.26 | 59.39 | 73.19 | 79.99 | 85.36 | 88.08 | 90.87 | 88.50 | 86.53 | 58.93 | 72.24 | 77.31 | 79.59 | 71.24 | 78.99 | |
| Multi-scale | ||||||||||||||||||
| One-stage | R3Det (Yang et al., 2021b) | R-152 | 89.80 | 83.77 | 48.11 | 66.77 | 78.76 | 83.27 | 87.84 | 90.82 | 85.38 | 85.51 | 65.67 | 62.68 | 67.53 | 78.56 | 72.62 | 76.47 |
| R3Det-DCL (Yang et al., 2021a) | R-152 | 89.26 | 83.60 | 53.54 | 72.76 | 79.04 | 82.56 | 87.31 | 90.67 | 86.59 | 86.98 | 67.49 | 66.88 | 73.29 | 70.56 | 69.99 | 77.37 | |
| S2ANet (Han et al., 2022a) | R-50 | 88.89 | 83.60 | 57.74 | 81.95 | 79.94 | 83.19 | 89.11 | 90.78 | 84.87 | 87.81 | 70.30 | 68.25 | 78.30 | 77.01 | 69.58 | 79.42 | |
| R3Det-GWD (Yang et al., 2021c) | R-152 | 89.66 | 84.99 | 59.26 | 82.19 | 78.97 | 84.83 | 87.70 | 90.21 | 86.54 | 86.85 | 73.47 | 67.77 | 76.92 | 79.22 | 74.92 | 80.23 | |
| R3Det-KLD (Yang et al., 2021d) | R-152 | 89.92 | 85.13 | 59.19 | 81.33 | 78.82 | 84.38 | 87.50 | 89.80 | 87.33 | 87.00 | 72.57 | 71.35 | 77.12 | 79.34 | 78.68 | 80.63 | |
| R3Det-KFIoU (Yang et al., 2022) | R-152 | 88.89 | 85.14 | 60.05 | 81.13 | 81.78 | 85.71 | 88.27 | 90.87 | 87.12 | 87.91 | 69.77 | 73.70 | 79.25 | 81.31 | 74.56 | 81.03 | |
| Two-stage | SCRDet++ (Yang et al., 2022a) | R-101 | 90.05 | 84.39 | 55.44 | 73.99 | 77.54 | 71.11 | 86.05 | 90.67 | 87.32 | 87.08 | 69.62 | 68.90 | 73.74 | 71.29 | 65.08 | 76.81 |
| AO2-DETR (Dai et al., 2022) | R-50 | 89.95 | 84.52 | 56.90 | 74.83 | 80.86 | 83.47 | 88.47 | 90.87 | 86.12 | 88.55 | 63.21 | 65.09 | 79.09 | 82.88 | 73.46 | 79.22 | |
| ReDet (Han et al., 2021a) | ReR-50 | 88.81 | 82.48 | 60.83 | 80.82 | 78.34 | 86.06 | 88.31 | 90.87 | 88.77 | 87.03 | 68.65 | 66.90 | 79.26 | 79.71 | 74.67 | 80.10 | |
| ReDet-DEA (Liang et al., 2022) | ReR-50 | 89.92 | 83.84 | 59.65 | 79.88 | 80.11 | 87.96 | 88.17 | 90.31 | 88.93 | 88.46 | 68.93 | 65.94 | 78.04 | 79.69 | 75.78 | 80.37 | |
| DODet (Cheng et al., 2022b) | R-50 | 89.96 | 85.52 | 58.01 | 81.22 | 78.71 | 85.46 | 88.59 | 90.89 | 87.12 | 87.80 | 70.50 | 71.54 | 82.06 | 77.43 | 74.47 | 80.62 | |
| AOPG∗ (Cheng et al., 2022a) | R-50 | 89.88 | 85.57 | 60.90 | 81.51 | 78.70 | 85.29 | 88.85 | 90.89 | 87.60 | 87.65 | 71.66 | 68.69 | 82.31 | 77.32 | 73.10 | 80.66 | |
| Oriented RCNN (Xie et al., 2021) | R-50 | 89.84 | 85.43 | 61.09 | 79.82 | 79.71 | 85.35 | 88.82 | 90.88 | 86.68 | 87.73 | 72.21 | 70.80 | 82.42 | 78.18 | 74.11 | 80.87 | |
| RoI Trans.-KFIoU (Yang et al., 2022) | Swin-T | 89.44 | 84.41 | 62.22 | 82.51 | 80.10 | 86.07 | 88.68 | 90.90 | 87.32 | 88.38 | 72.80 | 71.95 | 78.96 | 74.95 | 75.27 | 80.93 | |
| Oriented RCNN-RVSA(Wang et al., 2022) | ViTAE | 88.97 | 85.76 | 61.46 | 81.27 | 79.98 | 85.31 | 88.30 | 90.84 | 85.06 | 87.50 | 66.77 | 73.11 | 84.75 | 81.88 | 77.58 | 81.24 | |
-
1
PL: plane. BD: baseball diamond. BR: bridge. GTF: ground track field. SV: small vehicle. LV: large vehicle. SH: ship. TC: tennis court. BC: baseball court. ST: storage tank. SBF: soccer ball field. RA: roundabout. HA: harbor. SP: swimming pool. HC: helicopter.
-
2
The results of these methods are the best reported results from corresponding papers.. ∗ indicates anchor-free methods.
8 Conclusions and Future Directions
Oriented object detection in RS images is an important and challenging task in the field of RS and has been actively investigated. As summarized in this survey, a variety of methods have been developed rapidly in recent years, showing remarkable progress. In this survey, we review firstly problem definition and summarize commonly used datasets and evaluation metrics. Then, we provide a structural taxonomy for detection frameworks and highlight milestone detectors. We also present a detailed elaboration of OBB-based representations and feature representations. Finally, we discuss and compare the excellent methods emerging in recent years.
Despite oriented object detection is conducive to alleviating the difficulties stemming from arbitrary orientations, dense arrangement, large aspect ratio, and the following common challenges in RS are still far from being solved:
Complex background. Due to the wide visual field and complex earth’s surface, RS images typically contain a variety of complex backgrounds, causing significant interference in detection. It is obvious that objects are frequently surrounded by different backgrounds, requiring detectors to possess sufficient discrimination. Besides, there may be backgrounds containing textures and shapes similar to objects, causing a large number of false alarms.
Changing environmental conditions. The image quality can be easily affected by environmental conditions changes such as illumination, weather, seasons, and cloud. The originally clear images may appear as shadows, occlusion, blur, and noise, increasing the challenges of detection.
Scale variations. As the ground sampling distance (GSD) of sensors can vary from a few centimeters to hundreds of meters, the RS images taken by different sensors at the same scene usually have large scale variations. Additionally, while different kinds of objects may have large scale variations, the instances of the same category also vary in size. Therefore, the inter-class and intra-class scale variations pose additional challenges.
Imbalance problems. Firstly, the number of different categories may be imbalanced, i.e. the foreground-foreground imbalance. Thus, categories with more instances will dominate the gradients during training, leading to performance degradation. Secondly, only a small region of RS images contains objects, whereas the majority belongs to the background, resulting in an extreme foreground-background imbalance. As a result, most locations are backgrounds that can not provide useful information, causing inefficient training. Thirdly, the location distributions of objects are not uniform, most current detectors assume each part of the image with equal in weight.
Therefore, based on these challenges, we provide some developing directions for oriented RS object detection on future prospects.
Domain Adaptation. The training process of conventional deep learning based models is generally based on the i.i.d. assumption that the training and testing samples have identical and independent distribution (Schölkopf et al., 2007). Generally, as data-driven techniques, conventional deep learning based methods rely heavily on the diversity of training data to adapt to different scenarios. However, collecting and annotating enough RS images of all possible domains for model training is expensive, time-consuming, and even prohibitively impossible, especially in the military field (Wang and Deng, 2018; Wang et al., 2021a). In real-world RS applications, oriented object detectors may need to process various images collected at different times (day or night, summer or winter), in different sensors (e.g., SAR, optical, LIDAR, infrared), or under different conditions (weather, illuminance, camera pose, image quality), resulting in the domain distribution gaps between training images and testing images and degrading the performance at test time. To this end, it is desirable to investigate useful and efficient domain adaptation theories and techniques that can guide model design and enhance the generalization capability of the detectors. Recently, a large amount of valuable and instructive methods for domain adaptation have achieved many inspiring results on visual tasks, including discrepancy-based methods (Yosinski et al., 2014), adversarial-based methods (Goodfellow et al., 2014; Tzeng et al., 2017), and reconstruction-based methods (Ghifary et al., 2015, 2016). In future work, adopting the above techniques of domain adaptation in oriented object detection is a promising research direction.
Scale Adaption. Significant scale variations of various objects in RS images pose a great challenge for object detection. Especially, the most critical challenge mainly focuses on small object detection due to the following reasons: 1) Insufficient feature information. This is mainly due to the small objects occupying only a small area of the image. 2) Inaccurate localization. The down-sampling operation of backbone networks will lead to inaccurate localization, especially on the tasks of oriented object detection that are highly sensitive to angle regression error. In recent years, a large number of effective strategies have been made to enhance the robustness and adaptability of detectors for objects with various scales, mainly including: 1) Powerful backbone network, FPN (Lin et al., 2017) and its variants, which can generate semantic-strong high-resolution features. 2) Data augmentation methods, e.g., copy-pasting small objects multiple times to enhance the diversity of small objects (Kisantal et al., 2019), multi-scale training and test for improving the scale of small objects (Singh and Davis, 2018; Singh et al., 2018). Despite these advances, there is still a significant gap between the detection accuracy of small and medium or large objects. Besides, due to computational cost, it is difficult to directly apply the above techniques in real-world applications. Therefore, there is still plenty of space to develop scale-adaption methods.
Long-Tailed Oriented Object Detection. To address the problem of extreme class imbalance widely existing in real-world scenarios, several recent efforts start to focus on long-tailed object detection (Gupta et al., 2019; Wang et al., 2021b; Li et al., 2022a). Common methods can be divided into data re-sampling and loss re-weighting. The former is achieved by over-sampling the tail or under-sampling the head classes. Hence, it is limited when encountering extreme class imbalance (Shen et al., 2016; Gupta et al., 2019; Wang et al., 2020). The latter is a popular way that emphasizes the impact of tail categories by modifying the loss function (Tan et al., 2020a; Wang et al., 2021b; Li et al., 2022a). Despite achieving significant success, almost all those methods are developed with horizontal object detectors. Thus, in the RS scenarios which also suffer from severe class imbalance, as shown in Figure 5, long-tailed oriented object detection has not been explored so far.
Multimodal Information Fusion. Multimodal data has become easy to access in both military and civil fields with the rapid development of a variety of RS technologies, such as Global Positioning System (GPS), Inertial Measurement Unit (IMU), UAV, satellite, and various sensors. In recent years, the most popular multimodal information fusion methods are based on attention mechanisms (Nam et al., 2017) and bilinear pooling (Ben-younes et al., 2017), which have provided remarkable improvements for applications related to image captioning (Vinyals et al., 2015), text-to-image generation (Zhu et al., 2019), and visual question answering (Wang et al., 2018b). Although multimodal information fusion methods are attracting growing attention (Zhang et al., 2020a), there are still a number of challenging problems in the fields of RS and oriented object detection that are far from being solved. The first problem is how to integrate various multimodal RS information, including the poses of sensors, multispectral data, and point clouds, to improve detection performance, since these data are drastically different from each other naturally. Furthermore, multimodal information fusion technologies are important in extending oriented object detection to other RS applications, including instance segmentation (Chen et al., 2019) and object tracking (Wen et al., 2021). Finally, transferring well-trained detectors to other modalities is also a challenging task.
Lightweight Methods. The demand for deploying a real-time object detector on resource-constrained mobile devices has grown rapidly. Therefore, achieving a better trade-off between accuracy and efficiency for detectors is of significant importance. To this end, various lightweight architectures have been proposed to reduce computational complexity and spatial complexity without harming accuracy. Several works try to redesign lightweight network architectures based on hand-crafted technologies (Jiang et al., 2022) or Neural Architecture Search (Xiong et al., 2021). Another branch of work presents various compression schemes for compressing network, including parameter pruning (Hanson and Pratt, 1988; Han et al., 2015), quantization (Song et al., 2016), and knowledge distillation (Hinton et al., 2015). Excellent lightweight generic object detection methods (Xiong et al., 2021; Jiang et al., 2022; Mehta and Rastegari, 2021) depend on the ingenious designs of lightweight feature extraction networks and the efficient information transmission mechanism. Such practices provide an enormous reference value for oriented object detection. In addition, different lightweight methods may be synergistic and complementary to each other. Thus, reasonable design and combination can achieve outstanding performance. The development of lightweight methods is conducive to the promotion and real-world application of oriented object detection in the RS field, which drives the requirement for further research.
Video Oriented Object Detection. Aiming at exploiting temporal con-textual information across different frames, video oriented object detector (VO2D) estimates the location of different objects in each frame of a video. An accurate and efficient video object detection method is of great importance for real-time applications in RS scenarios, such as security monitoring and tracking. Nevertheless, VO2D suffers from performance degradation of image quality caused by motion blur, video defocus, scale variation, and occlusion. In addition, the change of viewpoint and scale caused by the pose variations of UAVs can also result in adverse influence and make the task more challenging. To solve the above issues, a vast number of techniques were exploited, including LSTM (Hochreiter and Schmidhuber, 1997; Zhu and Liu, 2018), feature flow (Zhu et al., 2017), feature calibration (Wang et al., 2018c), and features aggregation (Shvets et al., 2019; Chen et al., 2020a; He et al., 2020a). However, existing datasets for video object detection (Russakovsky et al., 2015; Damen et al., 2018) only contain natural scene images and annotate objects with HBBs. As a consequence, the existing video object detectors are not suitable in RS scenarios, due to their challenging characteristics, including scale variation, viewpoint changes, complex background, and arbitrary orientation. Therefore, it is urgent to promote the construction of RS datasets for video object detection and to develop video-oriented object detection algorithms.
Object Instance Segmentation. There are massive RS objects that are irregular, including roads and buildings, only using OBB to annotate them is not precise. To achieve a deeper and more detailed understanding of objects, it is necessary to research pixel-wise object segmentation. Recently, the success of the Segment Anything Model (SAM) shows its huge potential in computer vision tasks (Kirillov et al., 2023). With the support of SAM, pixel-level semantic labels are obtained and large-scale segmentation RS datasets are constructed (Wang et al., 2023). All in all, it is a very promising research direction in the field of RS and can be significant in potential applications.
References
- Ben-younes et al. (2017) Ben-younes, H., Cadene, R., Cord, M., Thome, N., 2017. Mutan: Multimodal tucker fusion for visual question answering, in: Proceedings of the IEEE International Conference on Computer Vision, pp. 2631–2639. doi:10.1109/ICCV.2017.285.
- Benedek et al. (2012) Benedek, C., Descombes, X., Zerubia, J., 2012. Building development monitoring in multitemporal remotely sensed image pairs with stochastic birth-death dynamics. IEEE Transactions on Pattern Analysis and Machine Intelligence. 34, 33–50. doi:10.1109/TPAMI.2011.94.
- Blaschke (2010) Blaschke, T., 2010. Object based image analysis for remote sensing. ISPRS Journal of Photogrammetry and Remote Sensing. 65, 2–16. doi:10.1016/j.isprsjprs.2009.06.004.
- Blaschke et al. (2014) Blaschke, T., Hay, G.J., Kelly, M., Lang, S., Hofmann, P., Addink, E., Queiroz Feitosa, R., van der Meer, F., van der Werff, H., van Coillie, F., Tiede, D., 2014. Geographic object-based image analysis – towards a new paradigm. ISPRS Journal of Photogrammetry and Remote Sensing. 87, 180–191. doi:10.1016/j.isprsjprs.2013.09.014.
- de Boer et al. (2005) de Boer, P.T., Kroese, D.P., Mannor, S., 2005. A tutorial on the cross-entropy method. Annals of Operations Research. 134, 19–67. doi:10.1007/s10479-005-5724-z.
- Brunetti et al. (2018) Brunetti, A., Buongiorno, D., Trotta, G.F., Bevilacqua, V., 2018. Computer vision and deep learning techniques for pedestrian detection and tracking: A survey. Neurocomputing. 300, 17–33. doi:10.1016/j.neucom.2018.01.092.
- Burochin et al. (2014) Burochin, J.P., Vallet, B., Brédif, M., Mallet, C., Brosset, T., Paparoditis, N., 2014. Detecting blind building façades from highly overlapping wide angle aerial imagery. ISPRS Journal of Photogrammetry and Remote Sensing. 96, 193–209. doi:10.1016/j.isprsjprs.2014.07.011.
- Cai and Vasconcelos (2018) Cai, Z., Vasconcelos, N., 2018. Cascade r-cnn: Delving into high quality object detection, in: Proceedings of the IEEE/CVF Conference on Computer Vision and Pattern Recognition, pp. 6154–6162. doi:10.1109/CVPR.2018.00644.
- Carion et al. (2020) Carion, N., Massa, F., Synnaeve, G., Usunier, N., Kirillov, A., Zagoruyko, S., 2020. End-to-end object detection with transformers, in: Proceedings of the European Conference on Computer Vision, pp. 213–229. doi:10.1007/978-3-030-58452-8_13.
- Chavali et al. (2016) Chavali, N., Agrawal, H., Mahendru, A., Batra, D., 2016. Object-proposal evaluation protocol is ‘gameable’, in: Proceedings of the IEEE Conference on Computer Vision and Pattern Recognition, pp. 835–844. doi:10.1109/CVPR.2016.97.
- Chen et al. (2019) Chen, K., Pang, J., Wang, J., Xiong, Y., Li, X., Sun, S., Feng, W., Liu, Z., Shi, J., Ouyang, W., Loy, C.C., Lin, D., 2019. Hybrid task cascade for instance segmentation, in: Proceedings of the IEEE/CVF Conference on Computer Vision and Pattern Recognition, pp. 4969–4978. doi:10.1109/CVPR.2019.00511.
- Chen et al. (2020) Chen, K., Wu, M., Liu, J., Zhang, C., 2020. FGSD: A Dataset for Fine-Grained Ship Detection in High Resolution Satellite Images. arXiv e-prints. , arXiv:2003.06832.
- Chen et al. (2018) Chen, L.C., Papandreou, G., Kokkinos, I., Murphy, K., Yuille, A.L., 2018. Deeplab: Semantic image segmentation with deep convolutional nets, atrous convolution, and fully connected crfs. IEEE Transactions on Pattern Analysis and Machine Intelligence. 40, 834–848. doi:10.1109/TPAMI.2017.2699184.
- Chen et al. (2020a) Chen, Y., Cao, Y., Hu, H., Wang, L., 2020a. Memory enhanced global-local aggregation for video object detection, in: Proceedings of the IEEE/CVF Conference on Computer Vision and Pattern Recognition, pp. 10334–10343. doi:10.1109/CVPR42600.2020.01035.
- Chen et al. (2020b) Chen, Z., Chen, K., Lin, W., See, J., Yu, H., Ke, Y., Yang, C., 2020b. Piou loss: Towards accurate oriented object detection in complex environments, in: Proceedings of the European Conference on Computer Vision, pp. 195–211. doi:10.1007/978-3-030-58558-7_12.
- Cheng and Han (2016) Cheng, G., Han, J., 2016. A survey on object detection in optical remote sensing images. ISPRS Journal of Photogrammetry and Remote Sensing. 117, 11–28. doi:10.1016/j.isprsjprs.2016.03.014.
- Cheng et al. (2014) Cheng, G., Han, J., Zhou, P., Guo, L., 2014. Multi-class geospatial object detection and geographic image classification based on collection of part detectors. ISPRS Journal of Photogrammetry and Remote Sensing 98, 119–132. doi:10.1016/j.isprsjprs.2014.10.002.
- Cheng et al. (2022a) Cheng, G., Wang, J., Li, K., Xie, X., Lang, C., Yao, Y., Han, J., 2022a. Anchor-free oriented proposal generator for object detection. IEEE Transactions on Geoscience and Remote Sensing. 60, 1–11. doi:10.1109/TGRS.2022.3183022.
- Cheng et al. (2022b) Cheng, G., Yao, Y., Li, S., Li, K., Xie, X., Wang, J., Yao, X., Han, J., 2022b. Dual-aligned oriented detector. IEEE Transactions on Geoscience and Remote Sensing. 60, 1–11. doi:10.1109/TGRS.2022.3149780.
- Chi et al. (2020) Chi, C., Wei, F., Hu, H., 2020. Relationnet++: Bridging visual representations for object detection via transformer decoder, in: Advances in Neural Information Processing Systems, pp. 13564–13574. URL: https://proceedings.neurips.cc/paper/2020/file/9d684c589d67031a627ad33d59db65e5-Paper.pdf.
- Chollet (2017) Chollet, F., 2017. Xception: Deep learning with depthwise separable convolutions, in: Proceedings of the IEEE Conference on Computer Vision and Pattern Recognition, pp. 1800–1807. doi:10.1109/CVPR.2017.195.
- Cohen and Welling (2016) Cohen, T.S., Welling, M., 2016. Group equivariant convolutional networks, in: Proceedings of the 33rd International Conference on Machine Learning, pp. 2990–2999. URL: https://proceedings.mlr.press/v48/cohenc16.html.
- Cui et al. (2019) Cui, Y., Jia, M., Lin, T.Y., Song, Y., Belongie, S., 2019. Class-balanced loss based on effective number of samples, in: IEEE/CVF Conference on Computer Vision and Pattern Recognition, pp. 9260–9269. doi:10.1109/CVPR.2019.00949.
- Dai et al. (2016) Dai, J., Li, Y., He, K., Sun, J., 2016. R-fcn: Object detection via region-based fully convolutional networks, in: Proceedings of the 30th International Conference on Neural Information Processing Systems, pp. 379–387. doi:10.5555/3157096.3157139.
- Dai et al. (2017) Dai, J., Qi, H., Xiong, Y., Li, Y., Zhang, G., Hu, H., Wei, Y., 2017. Deformable convolutional networks, in: Proceedings of the IEEE International Conference on Computer Vision, pp. 764–773. doi:10.1109/ICCV.2017.89.
- Dai et al. (2022) Dai, L., Liu, H., Tang, H., Wu, Z., Song, P., 2022. Ao2-detr: Arbitrary-oriented object detection transformer. IEEE Transactions on Circuits and Systems for Video Technology. , 1–1doi:10.1109/TCSVT.2022.3222906.
- Dalal and Triggs (2005) Dalal, N., Triggs, B., 2005. Histograms of oriented gradients for human detection, in: Proceedings of the IEEE Computer Society Conference on Computer Vision and Pattern Recognition, pp. 886–893. doi:10.1109/CVPR.2005.177.
- Damen et al. (2018) Damen, D., Doughty, H., Farinella, G.M., Fidler, S., Furnari, A., Kazakos, E., Moltisanti, D., Munro, J., Perrett, T., Price, W., Wray, M., 2018. Scaling egocentric vision: The dataset, in: Proceedings of the European Conference on Computer Vision, pp. 753–771. doi:10.1007/978-3-030-01225-0_44.
- Ding et al. (2019) Ding, J., Xue, N., Long, Y., Xia, G.S., Lu, Q., 2019. Learning roi transformer for oriented object detection in aerial images, in: Proceedings of the IEEE/CVF Conference on Computer Vision and Pattern Recognition, pp. 2844–2853. doi:10.1109/CVPR.2019.00296.
- Ding et al. (2022) Ding, J., Xue, N., Xia, G.S., Bai, X., Yang, W., Yang, M.Y., Belongie, S., Luo, J., Datcu, M., Pelillo, M., Zhang, L., 2022. Object detection in aerial images: A large-scale benchmark and challenges. IEEE Transactions on Pattern Analysis and Machine Intelligence 44, 7778–7796. doi:10.1109/TPAMI.2021.3117983.
- Dosovitskiy et al. (2021) Dosovitskiy, A., Beyer, L., Kolesnikov, A., Weissenborn, D., Zhai, X., Unterthiner, T., Dehghani, M., Minderer, M., Heigold, G., Gelly, S., 2021. An image is worth 16x16 words: Transformers for image recognition at scale, in: Proceedings of the International Conference on Learning Representations.
- Du et al. (2022) Du, H., Shi, H., Zeng, D., Zhang, X.P., Mei, T., 2022. The elements of end-to-end deep face recognition: A survey of recent advances. ACM Computing Surveys. 54, 1–42. doi:10.1145/3507902.
- Duan et al. (2019) Duan, K., Bai, S., Xie, L., Qi, H., Huang, Q., Tian, Q., 2019. Centernet: Keypoint triplets for object detection, in: Proceedings of the IEEE/CVF International Conference on Computer Vision, pp. 6568–6577. doi:10.1109/ICCV.2019.00667.
- Everingham et al. (2010) Everingham, M., Gool, L.V., Williams, C.K.I., Winn, J., Zisserman, A., 2010. The pascal visual object classes (voc) challenge. International Journal of Computer Vision. 88, 303–338. doi:10.1007/s11263-009-0275-4.
- Fei-Fei and Perona (2005) Fei-Fei, L., Perona, P., 2005. A bayesian hierarchical model for learning natural scene categories, in: Proceedings of the IEEE Computer Society Conference on Computer Vision and Pattern Recognition, pp. 524–531. doi:10.1109/CVPR.2005.16.
- Gao et al. (2021) Gao, P., Zheng, M., Wang, X., Dai, J., Li, H., 2021. Fast convergence of detr with spatially modulated co-attention, in: Proceedings of the IEEE/CVF International Conference on Computer Vision, pp. 3601–3610. doi:10.1109/ICCV48922.2021.00360.
- Ghiasi et al. (2019) Ghiasi, G., Lin, T.Y., Le, Q.V., 2019. Nas-fpn: Learning scalable feature pyramid architecture for object detection, in: Proceedings of the IEEE/CVF Conference on Computer Vision and Pattern Recognition, pp. 7029–7038. doi:10.1109/CVPR.2019.00720.
- Ghifary et al. (2015) Ghifary, M., Kleijn, W.B., Zhang, M., Balduzzi, D., 2015. Domain generalization for object recognition with multi-task autoencoders, in: Proceedings of the IEEE International Conference on Computer Vision, pp. 2551–2559. doi:10.1109/ICCV.2015.293.
- Ghifary et al. (2016) Ghifary, M., Kleijn, W.B., Zhang, M., Balduzzi, D., Li, W., 2016. Deep reconstruction-classification networks for unsupervised domain adaptation, in: Proceedings of the European Conference on Computer Vision, pp. 597–613. doi:10.1007/978-3-319-46493-0_36.
- Girshick (2015) Girshick, R., 2015. Fast r-cnn, in: Proceedings of the IEEE International Conference on Computer Vision, pp. 1440–1448. doi:10.1109/ICCV.2015.169.
- Girshick et al. (2014) Girshick, R., Donahue, J., Darrell, T., Malik, J., 2014. Rich feature hierarchies for accurate object detection and semantic segmentation, in: Proceedings of the IEEE Conference on Computer Vision and Pattern Recognition, pp. 580–587. doi:10.1109/CVPR.2014.81.
- Goodfellow et al. (2014) Goodfellow, I.J., Pouget-Abadie, J., Mirza, M., Xu, B., Warde-Farley, D., Ozair, S., Courville, A., Bengio, Y., 2014. Generative adversarial nets, in: Proceedings of the 27th International Conference on Neural Information Processing Systems - Volume 2, p. 2672–2680. doi:10.5555/2969033.2969125.
- Guan et al. (2021) Guan, Q., Qu, Z., Zeng, M., Shen, J., Du, J., 2021. Cgp box: An effective direction representation strategy for oriented object detection in remote sensing images. International Journal of Remote Sensing. 42, 6666–6687. doi:10.1080/01431161.2021.1941389.
- Guo et al. (2021) Guo, Z., Liu, C., Zhang, X., Jiao, J., Ji, X., Ye, Q., 2021. Beyond bounding-box: Convex-hull feature adaptation for oriented and densely packed object detection, in: Proceedings of the IEEE/CVF Conference on Computer Vision and Pattern Recognition (CVPR), pp. 8788–8797. doi:10.1109/CVPR46437.2021.00868.
- Gupta et al. (2019) Gupta, A., Dollár, P., Girshick, R., 2019. Lvis: A dataset for large vocabulary instance segmentation, in: IEEE/CVF Conference on Computer Vision and Pattern Recognition, pp. 5351–5359. doi:10.1109/CVPR.2019.00550.
- Haase and Amthor (2020) Haase, D., Amthor, M., 2020. Rethinking depthwise separable convolutions: How intra-kernel correlations lead to improved mobilenets, in: Proceedings of the IEEE/CVF Conference on Computer Vision and Pattern Recognition, pp. 14588–14597. doi:10.1109/CVPR42600.2020.01461.
- Han et al. (2022a) Han, J., Ding, J., Li, J., Xia, G.S., 2022a. Align deep features for oriented object detection. IEEE Transactions on Geoscience and Remote Sensing. 60, 1–11. doi:10.1109/TGRS.2021.3062048.
- Han et al. (2022b) Han, J., Ding, J., Li, J., Xia, G.S., 2022b. Align deep features for oriented object detection. IEEE Transactions on Geoscience and Remote Sensing. 60, 1–11. doi:10.1109/TGRS.2021.3062048.
- Han et al. (2021a) Han, J., Ding, J., Xue, N., Xia, G.S., 2021a. Redet: A rotation-equivariant detector for aerial object detection, in: Proceedings of the IEEE/CVF Conference on Computer Vision and Pattern Recognition, pp. 2785–2794. doi:10.1109/CVPR46437.2021.00281.
- Han et al. (2023) Han, K., Wang, Y., Chen, H., Chen, X., Guo, J., Liu, Z., Tang, Y., Xiao, A., Xu, C., Xu, Y., Yang, Z., Zhang, Y., Tao, D., 2023. A survey on vision transformer. IEEE Transactions on Pattern Analysis and Machine Intelligence 45, 87–110. doi:10.1109/TPAMI.2022.3152247.
- Han et al. (2021b) Han, K., Xiao, A., Wu, E., Guo, J., XU, C., Wang, Y., 2021b. Transformer in transformer, in: Proceedings of the Advances in Neural Information Processing Systems, pp. 15908–15919. URL: https://proceedings.neurips.cc/paper/2021/file/854d9fca60b4bd07f9bb215d59ef5561-Paper.pdf.
- Han et al. (2015) Han, S., Pool, J., Tran, J., Dally, W.J., 2015. Learning both weights and connections for efficient neural networks, in: Proceedings of the 28th International Conference on Neural Information Processing Systems - Volume 1, p. 1135–1143. doi:10.5555/2969239.2969366.
- Han et al. (2021c) Han, W., Chen, J., Wang, L., Feng, R., Li, F., Wu, L., Tian, T., Yan, J., 2021c. Methods for small, weak object detection in optical high-resolution remote sensing images: A survey of advances and challenges. IEEE Geoscience and Remote Sensing Magazine. 9, 8–34. doi:10.1109/MGRS.2020.3041450.
- Hanson and Pratt (1988) Hanson, S.J., Pratt, L.Y., 1988. Comparing biases for minimal network construction with back-propagation, in: Proceedings of the 1st International Conference on Neural Information Processing Systems, p. 177–185. doi:10.5555/2969735.2969756.
- He et al. (2020a) He, F., Gao, N., Li, Q., Du, S., Zhao, X., Huang, K., 2020a. Temporal context enhanced feature aggregation for video object detection, in: Proceedings of the AAAI Conference on Artificial Intelligence, pp. 10941–10948. doi:10.1609/aaai.v34i07.6727.
- He et al. (2022) He, K., Chen, X., Xie, S., Li, Y., Dollár, P., Girshick, R., 2022. Masked autoencoders are scalable vision learners, in: Proceedings of the IEEE/CVF Conference on Computer Vision and Pattern Recognition, pp. 15979–15988. doi:10.1109/CVPR52688.2022.01553.
- He et al. (2020b) He, K., Gkioxari, G., Dollár, P., Girshick, R., 2020b. Mask r-cnn. IEEE Transactions on Pattern Analysis and Machine Intelligence. 42, 386–397. doi:10.1109/TPAMI.2018.2844175.
- He et al. (2016) He, K., Zhang, X., Ren, S., Sun, J., 2016. Deep residual learning for image recognition, in: Proceedings of the IEEE Conference on Computer Vision and Pattern Recognition, pp. 770–778. doi:10.1109/CVPR.2016.90.
- He et al. (2021) He, X., Ma, S., He, L., Ru, L., Wang, C., 2021. Learning rotated inscribed ellipse for oriented object detection in remote sensing images. Remote Sensing. 13. doi:10.3390/rs13183622.
- Hei and Jia (2020) Hei, L., Jia, D., 2020. Cornernet: Detecting objects as paired keypoints. International Journal of Computer Vision. 128, 642–656. doi:10.1007/s11263-019-01204-1.
- Hinton and Salakhutdinov (2006) Hinton, G., Salakhutdinov, R., 2006. Reducing the dimensionality of data with neural networks. Science. 313, 504–507. doi:10.1126/science.1127647.
- Hinton et al. (2015) Hinton, G., Vinyals, O., Dean, J., 2015. Distilling the Knowledge in a Neural Network. arXiv e-prints. , arXiv:1503.02531.
- Hochreiter and Schmidhuber (1997) Hochreiter, S., Schmidhuber, J., 1997. Long Short-Term Memory. Neural Computation. 9, 1735–1780. doi:10.1162/neco.1997.9.8.1735.
- Hosang et al. (2016) Hosang, J., Benenson, R., Dollár, P., Schiele, B., 2016. What makes for effective detection proposals? IEEE Transactions on Pattern Analysis and Machine Intelligence. 38, 814–830. doi:10.1109/TPAMI.2015.2465908.
- Hu et al. (2018) Hu, H., Gu, J., Zhang, Z., Dai, J., Wei, Y., 2018. Relation networks for object detection, in: Proceedings of the IEEE/CVF Conference on Computer Vision and Pattern Recognition, pp. 3588–3597. doi:10.1109/CVPR.2018.00378.
- Hu et al. (2020) Hu, J., Shen, L., Albanie, S., Sun, G., Wu, E., 2020. Squeeze-and-excitation networks. IEEE Transactions on Pattern Analysis and Machine Intelligence. 42, 2011–2023. doi:10.1109/TPAMI.2019.2913372.
- Huang et al. (2017) Huang, G., Liu, Z., Van Der Maaten, L., Weinberger, K.Q., 2017. Densely connected convolutional networks, in: Proceedings of the IEEE Conference on Computer Vision and Pattern Recognition, pp. 2261–2269. doi:10.1109/CVPR.2017.243.
- Ioffe and Szegedy (2015) Ioffe, S., Szegedy, C., 2015. Batch normalization: Accelerating deep network training by reducing internal covariate shift, in: Proceedings of the 32nd International Conference on Machine Learning, pp. 448–456. URL: https://proceedings.mlr.press/v37/ioffe15.html.
- Jiang et al. (2022) Jiang, Y., Tan, Z., Wang, J., Sun, X., Lin, M., Li, H., 2022. GiraffeDet: A Heavy-Neck Paradigm for Object Detection. arXiv e-prints. , arXiv:2202.04256.
- Jiao et al. (2019) Jiao, L., Zhang, F., Liu, F., Yang, S., Li, L., Feng, Z., Qu, R., 2019. A survey of deep learning-based object detection. IEEE Access. 7, 128837–128868. doi:10.1109/ACCESS.2019.2939201.
- Kirillov et al. (2023) Kirillov, A., Mintun, E., Ravi, N., Mao, H., Rolland, C., Gustafson, L., Xiao, T., Whitehead, S., Berg, A.C., Lo, W.Y., Dollár, P., Girshick, R., 2023. Segment Anything. arXiv e-prints , arXiv:2304.02643.
- Kisantal et al. (2019) Kisantal, M., Wojna, Z., Murawski, J., Naruniec, J., Cho, K., 2019. Augmentation for small object detection. arXiv e-prints. , arXiv:1902.07296.
- Krizhevsky et al. (2012) Krizhevsky, A., Sutskever, I., Hinton, G.E., 2012. Imagenet classification with deep convolutional neural networks, in: Proceedings of the International Conference on Neural Information Processing Systems, Curran Associates Inc., Red Hook, NY, USA. pp. 1097–1105.
- Krizhevsky et al. (2017) Krizhevsky, A., Sutskever, I., Hinton, G.E., 2017. Imagenet classification with deep convolutional neural networks. Communications of the ACM. 60, 84–90. doi:10.1145/3065386.
- Kuznetsova et al. (2020) Kuznetsova, A., Rom, H., Alldrin, N., Uijlings, J., Krasin, I., Pont-Tuset, J., Kamali, S., Popov, S., Malloci, M., Kolesnikov, A., Duerig, T., Ferrari, V., 2020. The open images dataset v4: Unified image classification, object detection, and visual relationship detection at scale. International Journal of Computer Vision. , 1956–1981doi:10.1007/S11263-020-01316-Z.
- Lam et al. (2018) Lam, D., Kuzma, R., McGee, K., Dooley, S., Laielli, M., Klaric, M., Bulatov, Y., McCord, B., 2018. xView: Objects in Context in Overhead Imagery. arXiv e-prints. , arXiv:1802.07856.
- Larochelle et al. (2007) Larochelle, H., Erhan, D., Courville, A., Bergstra, J., Bengio, Y., 2007. An empirical evaluation of deep architectures on problems with many factors of variation, in: Proceedings of the 24th International Conference on Machine Learning, p. 473–480.
- LeCun et al. (2015) LeCun, Y., Bengio, Y., Hinton, G., 2015. Deep learning. Nature. 521, 436–444. doi:10.1038/nature14539.
- Leitloff et al. (2010) Leitloff, J., Hinz, S., Stilla, U., 2010. Vehicle detection in very high resolution satellite images of city areas. IEEE Transactions on Geoscience and Remote Sensing. 48, 2795–2806. doi:10.1109/TGRS.2010.2043109.
- Lenc and Vedaldi (2015) Lenc, K., Vedaldi, A., 2015. Understanding image representations by measuring their equivariance and equivalence, in: Proceedings of the IEEE Conference on Computer Vision and Pattern Recognition, pp. 991–999. doi:10.1109/CVPR.2015.7298701.
- Li et al. (2021) Li, B., Xie, X., Wei, X., Tang, W., 2021. Ship detection and classification from optical remote sensing images: A survey. Chinese Journal of Aeronautics. 34, 145–163. doi:10.1016/j.cja.2020.09.022.
- Li et al. (2022a) Li, B., Yao, Y., Tan, J., Zhang, G., Yu, F., Lu, J., Luo, Y., 2022a. Equalized focal loss for dense long-tailed object detection, in: IEEE/CVF Conference on Computer Vision and Pattern Recognition, pp. 6980–6989. doi:10.1109/CVPR52688.2022.00686.
- Li et al. (2020) Li, K., Wan, G., Cheng, G., Meng, L., Han, J., 2020. Object detection in optical remote sensing images: A survey and a new benchmark. ISPRS Journal of Photogrammetry and Remote Sensing. 159, 296–307. doi:10.1016/j.isprsjprs.2019.11.023.
- Li et al. (2019) Li, L., Xu, M., Wang, X., Jiang, L., Liu, H., 2019. Attention based glaucoma detection: A large-scale database and cnn model, in: Proceedings of the IEEE/CVF Conference on Computer Vision and Pattern Recognition, pp. 10563–10572. doi:10.1109/CVPR.2019.01082.
- Li et al. (2022b) Li, W., Chen, Y., Hu, K., Zhu, J., 2022b. Oriented reppoints for aerial object detection, in: Proceedings of the IEEE/CVF Conference on Computer Vision and Pattern Recognition, pp. 1819–1828. doi:10.1109/CVPR52688.2022.00187.
- Liang et al. (2022) Liang, D., Geng, Q., Wei, Z., Vorontsov, D.A., Kim, E.L., Wei, M., Zhou, H., 2022. Anchor retouching via model interaction for robust object detection in aerial images. IEEE Transactions on Geoscience and Remote Sensing. 60, 1–13. doi:10.1109/TGRS.2021.3136350.
- Liao et al. (2018) Liao, M., Zhu, Z., Shi, B., Xia, G.s., Bai, X., 2018. Rotation-sensitive regression for oriented scene text detection, in: Proceedings of the IEEE/CVF Conference on Computer Vision and Pattern Recognition, pp. 5909–5918. doi:10.1109/CVPR.2018.00619.
- Lin et al. (2017) Lin, T.Y., Dollár, P., Girshick, R., He, K., Hariharan, B., Belongie, S., 2017. Feature pyramid networks for object detection, in: Proceedings of the IEEE Conference on Computer Vision and Pattern Recognition (CVPR), pp. 936–944. doi:10.1109/CVPR.2017.106.
- Lin et al. (2020) Lin, T.Y., Goyal, P., Girshick, R., He, K., Dollár, P., 2020. Focal loss for dense object detection. IEEE Transactions on Pattern Analysis and Machine Intelligence. 42, 318–327. doi:10.1109/TPAMI.2018.2858826.
- Lin et al. (2014) Lin, T.Y., Maire, M., Belongie, S., Hays, J., Perona, P., Ramanan, D., Dollár, P., Zitnick, C.L., 2014. Microsoft coco: Common objects in context, in: Proceedings of the European Conference on Computer Vision, pp. 740–755. doi:10.1007/978-3-319-10602-1_48.
- Lin et al. (2019) Lin, Y., Feng, P., Guan, J., Wang, W., Chambers, J., 2019. IENet: Interacting Embranchment One Stage Anchor Free Detector for Orientation Aerial Object Detection. arXiv e-prints. , arXiv:1912.00969.
- Liu et al. (2003) Liu, C.L., Nakashima, K., Sako, H., Fujisawa, H., 2003. Handwritten digit recognition: benchmarking of state-of-the-art techniques. Pattern Recognition. 36, 2271–2285. doi:https://doi.org/10.1016/S0031-3203(03)00085-2.
- Liu and Mattyus (2015) Liu, K., Mattyus, G., 2015. Fast multiclass vehicle detection on aerial images. IEEE Geoscience and Remote Sensing Letters. 12, 1938–1942. doi:10.1109/LGRS.2015.2439517.
- Liu et al. (2020) Liu, L., Ouyang, W., Wang, X., Fieguth, P., Chen, J., Liu, X., Pietikäinen, M., 2020. Deep learning for generic object detection: A survey. International Journal of Computer Vision. 128, 261–318. doi:10.1007/s11263-019-01247-4.
- Liu et al. (2019) Liu, S., Huang, D., Wang, Y., 2019. Learning Spatial Fusion for Single-Shot Object Detection. arXiv e-prints. .
- Liu et al. (2018) Liu, S., Qi, L., Qin, H., Shi, J., Jia, J., 2018. Path aggregation network for instance segmentation, in: Proceedings of the IEEE/CVF Conference on Computer Vision and Pattern Recognition, pp. 8759–8768. doi:10.1109/CVPR.2018.00913.
- Liu et al. (2016a) Liu, W., Anguelov, D., Erhan, D., Szegedy, C., Reed, S., Fu, C.Y., Berg, A.C., 2016a. Ssd: Single shot multibox detector, in: Proceedings of the European Conference on Computer Vision, pp. 21–37. doi:10.1007/978-3-319-46448-0_2.
- Liu et al. (2022) Liu, W., Zhang, T., Huang, S., Li, K., 2022. A hybrid optimization framework for uav reconnaissance mission planning. Computers & Industrial Engineering. 173, 108653. doi:10.1016/j.cie.2022.108653.
- Liu et al. (2021a) Liu, Y., Sun, P., Wergeles, N., Shang, Y., 2021a. A survey and performance evaluation of deep learning methods for small object detection. Expert Systems with Applications. 172, 114602. doi:10.1016/j.eswa.2021.114602.
- Liu et al. (2021b) Liu, Z., Lin, Y., Cao, Y., Hu, H., Wei, Y., Zhang, Z., Lin, S., Guo, B., 2021b. Swin transformer: Hierarchical vision transformer using shifted windows, in: Proceedings of the IEEE/CVF International Conference on Computer Vision, pp. 9992–10002. doi:10.1109/ICCV48922.2021.00986.
- Liu et al. (2016b) Liu, Z., Wang, H., Weng, L., Yang, Y., 2016b. Ship rotated bounding box space for ship extraction from high-resolution optical satellite images with complex backgrounds. IEEE Geoscience and Remote Sensing Letters. 13, 1074–1078. doi:10.1109/LGRS.2016.2565705.
- Long et al. (2017) Long, Y., Gong, Y., Xiao, Z., Liu, Q., 2017. Accurate object localization in remote sensing images based on convolutional neural networks. IEEE Transactions on Geoscience and Remote Sensing 55, 2486–2498. doi:10.1109/TGRS.2016.2645610.
- Long et al. (2021) Long, Y., Xia, G.S., Li, S., Yang, W., Yang, M.Y., Zhu, X.X., Zhang, L., Li, D., 2021. On creating benchmark dataset for aerial image interpretation: Reviews, guidances, and million-aid. IEEE Journal of Selected Topics in Applied Earth Observations and Remote Sensing. 14, 4205–4230. doi:10.1109/JSTARS.2021.3070368.
- Ma et al. (2018) Ma, J., Shao, W., Ye, H., Wang, L., Wang, H., Zheng, Y., Xue, X., 2018. Arbitrary-oriented scene text detection via rotation proposals. IEEE Transactions on Multimedia. 20, 3111–3122. doi:10.1109/TMM.2018.2818020.
- Ma et al. (2021) Ma, T., Mao, M., Zheng, H., Gao, P., Wang, X., Han, S., Ding, E., Zhang, B., Doermann, D., 2021. Oriented Object Detection with Transformer. arXiv e-prints. , arXiv:2106.03146.
- Marcos et al. (2017) Marcos, D., Volpi, M., Komodakis, N., Tuia, D., 2017. Rotation equivariant vector field networks, in: Proceedings of the IEEE International Conference on Computer Vision, pp. 5058–5067. doi:10.1109/ICCV.2017.540.
- Mehta and Rastegari (2021) Mehta, S., Rastegari, M., 2021. MobileViT: Light-weight, General-purpose, and Mobile-friendly Vision Transformer. arXiv e-prints. , arXiv:2110.02178.
- Mnih et al. (2014) Mnih, V., Heess, N., Graves, A., Kavukcuoglu, K., 2014. Recurrent models of visual attention, in: Proceedings of the 27th International Conference on Neural Information Processing Systems - Volume 2, pp. 2204–2212.
- Mondal (2020) Mondal, A., 2020. Camouflaged object detection and tracking: A survey. International Journal of Image & Graphics. 20, 2050028. doi:10.1142/S021946782050028X.
- Nam et al. (2017) Nam, H., Ha, J.W., Kim, J., 2017. Dual attention networks for multimodal reasoning and matching, in: Proceedings of the IEEE Conference on Computer Vision and Pattern Recognition, pp. 2156–2164. doi:10.1109/CVPR.2017.232.
- Pan et al. (2020) Pan, X., Ren, Y., Sheng, K., Dong, W., Yuan, H., Guo, X., Ma, C., Xu, C., 2020. Dynamic refinement network for oriented and densely packed object detection, in: Proceedings of the IEEE/CVF Conference on Computer Vision and Pattern Recognition, pp. 11204–11213. doi:10.1109/CVPR42600.2020.01122.
- Qian et al. (2021) Qian, W., Yang, X., Peng, S., Yan, J., Guo, Y., 2021. Learning modulated loss for rotated object detection, in: Proceedings of the AAAI Conference on Artificial Intelligence, pp. 2458–2466. doi:10.1609/aaai.v35i3.16347.
- Qian et al. (2022) Qian, W., Yang, X., Peng, S., Zhang, X., Yan, J., 2022. Rsdet++: Point-based modulated loss for more accurate rotated object detection. IEEE Transactions on Circuits and Systems for Video Technology. 32, 7869–7879. doi:10.1109/TCSVT.2022.3186070.
- Qiao et al. (2021) Qiao, S., Chen, L.C., Yuille, A., 2021. Detectors: Detecting objects with recursive feature pyramid and switchable atrous convolution, in: Proceedings of the IEEE/CVF Conference on Computer Vision and Pattern Recognition, pp. 10208–10219. doi:10.1109/CVPR46437.2021.01008.
- Razakarivony and Jurie (2016) Razakarivony, S., Jurie, F., 2016. Vehicle detection in aerial imagery : A small target detection benchmark. Journal of Visual Communication and Image Representation. 34, 187–203. doi:10.1016/j.jvcir.2015.11.002.
- Redmon et al. (2016) Redmon, J., Divvala, S., Girshick, R., Farhadi, A., 2016. You only look once: Unified, real-time object detection, in: Proceedings of the IEEE Conference on Computer Vision and Pattern Recognition, pp. 779–788. doi:10.1109/CVPR.2016.91.
- Redmon and Farhadi (2017) Redmon, J., Farhadi, A., 2017. Yolo9000: Better, faster, stronger, in: Proceedings of the IEEE Conference on Computer Vision and Pattern Recognition, pp. 6517–6525. doi:10.1109/CVPR.2017.690.
- Ren et al. (2017) Ren, S., He, K., Girshick, R., Sun, J., 2017. Faster r-cnn: Towards real-time object detection with region proposal networks. IEEE Transactions on Pattern Analysis and Machine Intelligence. 39, 1137–1149. doi:10.1109/TPAMI.2016.2577031.
- Rezatofighi et al. (2019) Rezatofighi, H., Tsoi, N., Gwak, J., Sadeghian, A., Reid, I., Savarese, S., 2019. Generalized intersection over union: A metric and a loss for bounding box regression, in: Proceedings of the IEEE/CVF Conference on Computer Vision and Pattern Recognition, pp. 658–666. doi:10.1109/CVPR.2019.00075.
- Russakovsky et al. (2015) Russakovsky, O., Deng, J., Su, H., Krause, J., Satheesh, S., Ma, S., Huang, Z., Karpathy, A., Khosla, A., Bernstein, M., Berg, A.C., Fei-Fei, L., 2015. Imagenet large scale visual recognition challenge. International Journal of Computer Vision. 115, 211–252. doi:10.1007/s11263-015-0816-y.
- Salvoldi et al. (2022) Salvoldi, M., Cohen-Zada, A.L., Karnieli, A., 2022. Using the venµs super-spectral camera for detecting moving vehicles. ISPRS Journal of Photogrammetry and Remote Sensing. 192, 33–48. doi:10.1016/j.isprsjprs.2022.08.005.
- Schölkopf et al. (2007) Schölkopf, B., Platt, J., Hofmann, T., 2007. Analysis of representations for domain adaptation, in: Proceedings of the Advances in Neural Information Processing Systems, pp. 137–144.
- Shen et al. (2016) Shen, L., Lin, Z., Huang, Q., 2016. Relay backpropagation for effective learning of deep convolutional neural networks, in: Leibe, B., Matas, J., Sebe, N., Welling, M. (Eds.), Proceedings of the European Conference on Computer Vision, pp. 467–482. doi:10.1007/978-3-319-46478-7_29.
- Shvets et al. (2019) Shvets, M., Liu, W., Berg, A., 2019. Leveraging long-range temporal relationships between proposals for video object detection, in: Proceedings of the IEEE/CVF International Conference on Computer Vision, pp. 9755–9763. doi:10.1109/ICCV.2019.00985.
- Sifre and Mallat (2013) Sifre, L., Mallat, S., 2013. Rotation, scaling and deformation invariant scattering for texture discrimination, in: Proceedings of the IEEE Conference on Computer Vision and Pattern Recognition, pp. 1233–1240. doi:10.1109/CVPR.2013.163.
- Simonyan and Zisserman (2015) Simonyan, K., Zisserman, A., 2015. Very Deep Convolutional Networks for Large-Scale Image Recognition, in: Proceedings of the International Conference on Learning Representations.
- Singh and Davis (2018) Singh, B., Davis, L.S., 2018. An analysis of scale invariance in object detection - snip, in: Proceedings of the IEEE/CVF Conference on Computer Vision and Pattern Recognition, pp. 3578–3587. doi:10.1109/CVPR.2018.00377.
- Singh et al. (2018) Singh, B., Najibi, M., Davis, L.S., 2018. Sniper: Efficient multi-scale training, in: Proceedings of the Advances in Neural Information Processing Systems. URL: https://proceedings.neurips.cc/paper/2018/file/166cee72e93a992007a89b39eb29628b-Paper.pdf.
- Song et al. (2016) Song, H., Mao, H., Dally, W.J., 2016. Deep compression: Compressing deep neural networks with pruning, trained quantization and huffman coding, in: Proceedings of the International Conference on Learning Representations.
- Stankov and He (2013) Stankov, K., He, D.C., 2013. Building detection in very high spatial resolution multispectral images using the hit-or-miss transform. IEEE Geoscience and Remote Sensing Letters. 10, 86–90. doi:10.1109/LGRS.2012.2193552.
- Sun et al. (2021) Sun, Z., Cao, S., Yang, Y., Kitani, K., 2021. Rethinking transformer-based set prediction for object detection, in: Proceedings of the IEEE/CVF International Conference on Computer Vision, pp. 3591–3600. doi:10.1109/ICCV48922.2021.00359.
- Szegedy et al. (2017) Szegedy, C., Ioffe, S., Vanhoucke, V., Alemi, A., 2017. Inception-v4, inception-resnet and the impact of residual connections on learning, in: Proceedings of the AAAI Conference on Artificial Intelligence. doi:10.1609/aaai.v31i1.11231.
- Szegedy et al. (2015) Szegedy, C., Liu, W., Jia, Y., Sermanet, P., Reed, S., Anguelov, D., Erhan, D., Vanhoucke, V., Rabinovich, A., 2015. Going deeper with convolutions, in: Proceedings of the IEEE Conference on Computer Vision and Pattern Recognition, pp. 1–9. doi:10.1109/CVPR.2015.7298594.
- Szegedy et al. (2016) Szegedy, C., Vanhoucke, V., Ioffe, S., Shlens, J., Wojna, Z., 2016. Rethinking the inception architecture for computer vision, in: Proceedings of the IEEE Conference on Computer Vision and Pattern Recognition, pp. 2818–2826. doi:10.1109/CVPR.2016.308.
- Tan et al. (2020a) Tan, J., Wang, C., Li, B., Li, Q., Ouyang, W., Yin, C., Yan, J., 2020a. Equalization loss for long-tailed object recognition, in: IEEE/CVF Conference on Computer Vision and Pattern Recognition, pp. 11659–11668. doi:10.1109/CVPR42600.2020.01168.
- Tan et al. (2020b) Tan, M., Pang, R., Le, Q.V., 2020b. Efficientdet: Scalable and efficient object detection, in: Proceedings of the IEEE/CVF Conference on Computer Vision and Pattern Recognition, pp. 10778–10787. doi:10.1109/CVPR42600.2020.01079.
- Tian et al. (2022) Tian, S., Kang, L., Xing, X., Tian, J., Fan, C., Zhang, Y., 2022. A relation-augmented embedded graph attention network for remote sensing object detection. IEEE Transactions on Geoscience and Remote Sensing. 60, 1–18. doi:10.1109/TGRS.2021.3073269.
- Tong et al. (2020) Tong, K., Wu, Y., Zhou, F., 2020. Recent advances in small object detection based on deep learning: A review. Image and Vision Computing. 97, 103910. doi:10.1016/j.imavis.2020.103910.
- Tzeng et al. (2017) Tzeng, E., Hoffman, J., Saenko, K., Darrell, T., 2017. Adversarial discriminative domain adaptation, in: Proceedings of the IEEE Conference on Computer Vision and Pattern Recognition, pp. 2962–2971. doi:10.1109/CVPR.2017.316.
- Vaswani et al. (2017) Vaswani, A., Shazeer, N., Parmar, N., Uszkoreit, J., Jones, L., Gomez, A.N., Kaiser, L., Polosukhin, I., 2017. Attention is all you need, in: Proceedings of the 31st International Conference on Neural Information Processing Systems, pp. 6000–6010.
- Vinyals et al. (2015) Vinyals, O., Toshev, A., Bengio, S., Erhan, D., 2015. Show and tell: A neural image caption generator, in: Proceedings of the IEEE Conference on Computer Vision and Pattern Recognition, pp. 3156–3164. doi:10.1109/CVPR.2015.7298935.
- Wang et al. (2023) Wang, D., Zhang, J., Du, B., Tao, D., Zhang, L., 2023. Scaling-up Remote Sensing Segmentation Dataset with Segment Anything Model. arXiv e-prints , arXiv:2305.02034.
- Wang et al. (2022) Wang, D., Zhang, Q., Xu, Y., Zhang, J., Du, B., Tao, D., Zhang, L., 2022. Advancing plain vision transformer towards remote sensing foundation model. IEEE Transactions on Geoscience and Remote Sensing. , 1–1doi:10.1109/TGRS.2022.3222818.
- Wang et al. (2021a) Wang, J., Lan, C., Liu, C., Ouyang, Y., Qin, T., 2021a. Generalizing to unseen domains: A survey on domain generalization, in: Proceedings of the Thirtieth International Joint Conference on Artificial Intelligence, pp. 4627–4635. doi:10.24963/ijcai.2021/628.
- Wang and Deng (2018) Wang, M., Deng, W., 2018. Deep visual domain adaptation: A survey. Neurocomputing. 312, 135–153. doi:10.1016/j.neucom.2018.05.083.
- Wang et al. (2018a) Wang, N., Gao, X., Tao, D., Yang, H., Li, X., 2018a. Facial feature point detection: A comprehensive survey. Neurocomputing. 275, 50–65. doi:10.1016/j.neucom.2017.05.013.
- Wang et al. (2018b) Wang, P., Wu, Q., Shen, C., Dick, A., van den Hengel, A., 2018b. Fvqa: Fact-based visual question answering. IEEE Transactions on Pattern Analysis and Machine Intelligence. 40, 2413–2427. doi:10.1109/TPAMI.2017.2754246.
- Wang et al. (2018c) Wang, S., Zhou, Y., Yan, J., Deng, Z., 2018c. Fully motion-aware network for video object detection, in: Proceedings of the European Conference on Computer Vision, pp. 557–573. doi:10.1007/978-3-030-01261-8_33.
- Wang et al. (2020) Wang, T., Li, Y., Kang, B., Li, J., Liew, J., Tang, S., Hoi, S., Feng, J., 2020. The devil is in classification: A simple framework for long-tail instance segmentation, in: Vedaldi, A., Bischof, H., Brox, T., Frahm, J.M. (Eds.), Proceedings of the European Conference on Computer Vision, pp. 728–744. doi:10.1007/978-3-030-58568-6_43.
- Wang et al. (2021b) Wang, T., Zhu, Y., Zhao, C., Zeng, W., Wang, J., Tang, M., 2021b. Adaptive class suppression loss for long-tail object detection, in: IEEE/CVF Conference on Computer Vision and Pattern Recognition, pp. 3102–3111. doi:10.1109/CVPR46437.2021.00312.
- Wang et al. (2021c) Wang, W., Xie, E., Li, X., Fan, D.P., Song, K., Liang, D., Lu, T., Luo, P., Shao, L., 2021c. Pyramid vision transformer: A versatile backbone for dense prediction without convolutions, in: Proceedings of the IEEE/CVF International Conference on Computer Vision, pp. 548–558. doi:10.1109/ICCV48922.2021.00061.
- Wang et al. (2019) Wang, X., Cai, Z., Gao, D., Vasconcelos, N., 2019. Towards universal object detection by domain attention, in: Proceedings of the IEEE/CVF Conference on Computer Vision and Pattern Recognition (CVPR), pp. 7281–7290. doi:10.1109/CVPR.2019.00746.
- Wei et al. (2020) Wei, H., Zhang, Y., Chang, Z., Li, H., Wang, H., Sun, X., 2020. Oriented objects as pairs of middle lines. ISPRS Journal of Photogrammetry and Remote Sensing. 169, 268–279. doi:https://doi.org/10.1016/j.isprsjprs.2020.09.022.
- Weiler and Cesa (2019) Weiler, M., Cesa, G., 2019. General e(2)-equivariant steerable cnns, in: Proceedings of the Advances in Neural Information Processing Systems. URL: https://proceedings.neurips.cc/paper/2019/file/45d6637b718d0f24a237069fe41b0db4-Paper.pdf.
- Weiler et al. (2018) Weiler, M., Hamprecht, F.A., Storath, M., 2018. Learning steerable filters for rotation equivariant cnns, in: Proceedings of the IEEE/CVF Conference on Computer Vision and Pattern Recognition, pp. 849–858. doi:10.1109/CVPR.2018.00095.
- Wen et al. (2021) Wen, L., Du, D., Zhu, P., Hu, Q., Wang, Q., Bo, L., Lyu, S., 2021. Detection, tracking, and counting meets drones in crowds: A benchmark, in: Proceedings of the IEEE/CVF Conference on Computer Vision and Pattern Recognition, pp. 7808–7817. doi:10.1109/CVPR46437.2021.00772.
- Worrall et al. (2017) Worrall, D.E., Garbin, S.J., Turmukhambetov, D., Brostow, G.J., 2017. Harmonic networks: Deep translation and rotation equivariance, in: Proceedings of the IEEE Conference on Computer Vision and Pattern Recognition, pp. 7168–7177. doi:10.1109/CVPR.2017.758.
- Wright et al. (2009) Wright, J., Yang, A.Y., Ganesh, A., Sastry, S.S., Ma, Y., 2009. Robust face recognition via sparse representation. IEEE Transactions on Pattern Analysis and Machine Intelligence. 31, 210–227. doi:10.1109/TPAMI.2008.79.
- Wu et al. (2020) Wu, X., Sahoo, D., Hoi, S.C., 2020. Recent advances in deep learning for object detection. Neurocomputing. 396, 39–64. doi:10.1016/j.neucom.2020.01.085.
- Wu and Ji (2019) Wu, Y., Ji, Q., 2019. Facial landmark detection: A literature survey. International Journal of Computer Vision. 127, 115–142. doi:10.1007/s11263-018-1097-z.
- Xia et al. (2018) Xia, G.S., Bai, X., Ding, J., Zhu, Z., Belongie, S., Luo, J., Datcu, M., Pelillo, M., Zhang, L., 2018. Dota: A large-scale dataset for object detection in aerial images, in: Proceedings of the IEEE/CVF Conference on Computer Vision and Pattern Recognition, pp. 3974–3983. doi:10.1109/CVPR.2018.00418.
- Xiao et al. (2020a) Xiao, Y., Tian, Z., Yu, J., Y., Z., S., D., X., L., 2020a. A review of object detection based on deep learning. Multimedia Tools and Applications. 79, 23729–23791. doi:10.1007/s11042-020-08976-6.
- Xiao et al. (2015) Xiao, Z., Liu, Q., Tang, G., Zhai, X., 2015. Elliptic fourier transformation-based histograms of oriented gradients for rotationally invariant object detection in remote-sensing images. International Journal of Remote Sensing 36, 618–644. doi:10.1080/01431161.2014.999881.
- Xiao et al. (2020b) Xiao, Z., Qian, L., Shao, W., Tan, X., Wang, K., 2020b. Axis learning for orientated objects detection in aerial images. Remote Sensing. 12. doi:10.3390/rs12060908.
- Xie et al. (2017) Xie, S., Girshick, R., Dollár, P., Tu, Z., He, K., 2017. Aggregated residual transformations for deep neural networks, in: Proceedings of the IEEE Conference on Computer Vision and Pattern Recognition, pp. 5987–5995. doi:10.1109/CVPR.2017.634.
- Xie et al. (2021) Xie, X., Cheng, G., Wang, J., Yao, X., Han, J., 2021. Oriented r-cnn for object detection, in: Proceedings of the IEEE/CVF International Conference on Computer Vision, pp. 3500–3509. doi:10.1109/ICCV48922.2021.00350.
- Xiong et al. (2021) Xiong, Y., Liu, H., Gupta, S., Akin, B., Bender, G., Wang, Y., Kindermans, P.J., Tan, M., Singh, V., Chen, B., 2021. Mobiledets: Searching for object detection architectures for mobile accelerators, in: Proceedings of the IEEE/CVF Conference on Computer Vision and Pattern Recognition, pp. 3824–3833. doi:10.1109/CVPR46437.2021.00382.
- Xu et al. (2021a) Xu, Y., Fu, M., Wang, Q., Wang, Y., Chen, K., Xia, G.S., Bai, X., 2021a. Gliding vertex on the horizontal bounding box for multi-oriented object detection. IEEE Transactions on Pattern Analysis and Machine Intelligence. 43, 1452–1459. doi:10.1109/TPAMI.2020.2974745.
- Xu et al. (2021b) Xu, Y., Zhang, Q., Zhang, J., Tao, D., 2021b. Vitae: Vision transformer advanced by exploring intrinsic inductive bias, in: Proceedings of the Advances in Neural Information Processing Systems. URL: https://openreview.net/pdf?id=_RnHyIeu5Y5.
- Yang et al. (2021a) Yang, X., Hou, L., Zhou, Y., Wang, W., Yan, J., 2021a. Dense label encoding for boundary discontinuity free rotation detection, in: Proceedings of the IEEE/CVF Conference on Computer Vision and Pattern Recognition, pp. 15814–15824. doi:10.1109/CVPR46437.2021.01556.
- Yang et al. (2018a) Yang, X., Sun, H., Fu, K., Yang, J., Sun, X., Yan, M., Guo, Z., 2018a. Automatic ship detection in remote sensing images from google earth of complex scenes based on multiscale rotation dense feature pyramid networks. Remote Sensing. 10. doi:10.3390/rs10010132.
- Yang et al. (2018b) Yang, X., Sun, H., Fu, K., Yang, J., Sun, X., Yan, M., Guo, Z., 2018b. Automatic ship detection in remote sensing images from google earth of complex scenes based on multiscale rotation dense feature pyramid networks. Remote Sensing. 10. doi:10.3390/rs10010132.
- Yang and Yan (2020) Yang, X., Yan, J., 2020. Arbitrary-oriented object detection with circular smooth label, in: Proceedings of the European Conference on Computer Vision, pp. 677–694. doi:10.1007/978-3-030-58598-3_40.
- Yang et al. (2021b) Yang, X., Yan, J., Feng, Z.and He, T., 2021b. R3det: Refined single-stage detector with feature refinement for rotating object, in: Proceedings of the AAAI Conference on Artificial Intelligence, pp. 3163–3171. doi:10.1609/aaai.v35i4.16426.
- Yang et al. (2022a) Yang, X., Yan, J., Liao, W., Yang, X., Tang, J., He, T., 2022a. Scrdet++: Detecting small, cluttered and rotated objects via instance-level feature denoising and rotation loss smoothing. IEEE Transactions on Pattern Analysis and Machine Intelligence. , 1–1doi:10.1109/TPAMI.2022.3166956.
- Yang et al. (2021c) Yang, X., Yan, J., Ming, Q., Wang, W., Zhang, X., Tian, Q., 2021c. Rethinking rotated object detection with gaussian wasserstein distance loss, in: Proceedings of the 38th International Conference on Machine Learning, pp. 11830–11841. URL: https://proceedings.mlr.press/v139/yang21l.html.
- Yang et al. (2019a) Yang, X., Yang, J., Yan, J., Zhang, Y., Zhang, T., Guo, Z., Sun, X., Fu, K., 2019a. Scrdet: Towards more robust detection for small, cluttered and rotated objects, in: Proceedings of the IEEE/CVF International Conference on Computer Vision, pp. 8231–8240. doi:10.1109/ICCV.2019.00832.
- Yang et al. (2021d) Yang, X., Yang, X., Yang, J., Ming, Q., Wang, W., Tian, Q., Yan, J., 2021d. Learning high-precision bounding box for rotated object detection via kullback-leibler divergence, in: Proceedings of the Advances in Neural Information Processing Systems, pp. 18381–18394. URL: https://proceedings.neurips.cc/paper/2021/file/98f13708210194c475687be6106a3b84-Paper.pdf.
- Yang et al. (2022b) Yang, X., Zhang, G., Yang, X., Zhou, Y., Wang, W., Tang, J., He, T., Yan, J., 2022b. Detecting rotated objects as gaussian distributions and its 3-d generalization. IEEE Transactions on Pattern Analysis and Machine Intelligence. , 1–18doi:10.1109/TPAMI.2022.3197152.
- Yang et al. (2022) Yang, X., Zhou, Y., Zhang, G., Yang, J., Wang, W., Yan, J., Zhang, X., Tian, Q., 2022. The KFIoU Loss for Rotated Object Detection. arXiv e-prints. , arXiv:2201.12558.
- Yang et al. (2019b) Yang, Z., Liu, S., Hu, H., Wang, L., Lin, S., 2019b. Reppoints: Point set representation for object detection, in: Proceedings of the IEEE/CVF International Conference on Computer Vision, pp. 9656–9665. doi:10.1109/ICCV.2019.00975.
- Ye and Doermann (2015) Ye, Q., Doermann, D., 2015. Text detection and recognition in imagery: A survey. IEEE Transactions on Pattern Analysis and Machine Intelligence. 37, 1480–1500. doi:10.1109/TPAMI.2014.2366765.
- Yi et al. (2021) Yi, J., Wu, P., Liu, B., Huang, Q., Qu, H., Metaxas, D., 2021. Oriented object detection in aerial images with box boundary-aware vectors, in: Proceedings of the IEEE Winter Conference on Applications of Computer Vision, pp. 2149–2158. doi:10.1109/WACV48630.2021.00220.
- Yin et al. (2016) Yin, X.C., Zuo, Z.Y., Tian, S., Liu, C.L., 2016. Text detection, tracking and recognition in video: A comprehensive survey. IEEE Transactions on Image Processing. 25, 2752–2773. doi:10.1109/TIP.2016.2554321.
- Yoo et al. (2015) Yoo, D., Park, S., Lee, J.Y., Paek, A.S., Kweon, I.S., 2015. Attentionnet: Aggregating weak directions for accurate object detection, in: Proceedings of the IEEE International Conference on Computer Vision, pp. 2659–2667. doi:10.1109/ICCV.2015.305.
- Yosinski et al. (2014) Yosinski, J., Clune, J., Bengio, Y., Lipson, H., 2014. How transferable are features in deep neural networks?, in: Proceedings of the 27th International Conference on Neural Information Processing Systems - Volume 2, p. 3320–3328. doi:10.5555/2969033.2969197.
- Yu and Ji (2022) Yu, D., Ji, S., 2022. A new spatial-oriented object detection framework for remote sensing images. IEEE Transactions on Geoscience and Remote Sensing. 60, 1–16. doi:10.1109/TGRS.2021.3127232.
- Yu and Da (2022) Yu, Y., Da, F., 2022. Phase-Shifting Coder: Predicting Accurate Orientation in Oriented Object Detection. arXiv e-prints. , arXiv:2211.06368.
- Zafeiriou et al. (2015) Zafeiriou, S., Zhang, C., Zhang, Z., 2015. A survey on face detection in the wild: Past, present and future. Computer Vision and Image Understanding. 138, 1–24. doi:10.1016/j.cviu.2015.03.015.
- Zhang et al. (2020a) Zhang, C., Yang, Z., He, X., Deng, L., 2020a. Multimodal intelligence: Representation learning, information fusion, and applications. IEEE Journal of Selected Topics in Signal Processing. 14, 478–493. doi:10.1109/JSTSP.2020.2987728.
- Zhang et al. (2020b) Zhang, D., Zhang, H., Tang, J., Wang, M., Hua, X., Sun, Q., 2020b. Feature pyramid transformer, in: Proceedings of the European Conference on Computer Vision, pp. 323–339. doi:10.1007/978-3-030-58604-1_20.
- Zhang et al. (2022) Zhang, F., Wang, X., Zhou, S., Wang, Y., Hou, Y., 2022. Arbitrary-oriented ship detection through center-head point extraction. IEEE Transactions on Geoscience and Remote Sensing. 60, 1–14. doi:10.1109/TGRS.2021.3120411.
- Zhang et al. (2023) Zhang, Q., Xu, Y., Zhang, J., Tao, D., 2023. Vitaev2: Vision transformer advanced by exploring inductive bias for image recognition and beyond. International Journal of Computer Vision. , 1573–1405doi:10.1007/s11263-022-01739-w.
- Zhang et al. (2020c) Zhang, S., Chi, C., Yao, Y., Lei, Z., Li, S.Z., 2020c. Bridging the gap between anchor-based and anchor-free detection via adaptive training sample selection, in: Proceedings of the IEEE/CVF Conference on Computer Vision and Pattern Recognition, pp. 9756–9765. doi:10.1109/CVPR42600.2020.00978.
- Zhang et al. (2021a) Zhang, T., Zhang, X., Liu, C., Shi, J., Wei, S., Ahmad, I., Zhan, X., Zhou, Y., Pan, D., Li, J., Su, H., 2021a. Balance learning for ship detection from synthetic aperture radar remote sensing imagery. ISPRS Journal of Photogrammetry and Remote Sensing. 182, 190–207. doi:10.1016/j.isprsjprs.2021.10.010.
- Zhang et al. (2019) Zhang, Y., Yuan, Y., Feng, Y., Lu, X., 2019. Hierarchical and robust convolutional neural network for very high-resolution remote sensing object detection. IEEE Transactions on Geoscience and Remote Sensing. 57, 5535–5548. doi:10.1109/TGRS.2019.2900302.
- Zhang et al. (2018) Zhang, Z., Guo, W., Zhu, S., Yu, W., 2018. Toward arbitrary-oriented ship detection with rotated region proposal and discrimination networks. IEEE Geoscience and Remote Sensing Letters. 15, 1745–1749. doi:10.1109/LGRS.2018.2856921.
- Zhang et al. (2021b) Zhang, Z., Zhang, L., Wang, Y., Feng, P., He, R., 2021b. Shiprsimagenet: A large-scale fine-grained dataset for ship detection in high-resolution optical remote sensing images. IEEE Journal of Selected Topics in Applied Earth Observations and Remote Sensing. 14, 8458–8472. doi:10.1109/JSTARS.2021.3104230.
- Zhao et al. (2018) Zhao, F., Xia, L., Kylling, A., Li, R., Shang, H., Xu, M., 2018. Detection flying aircraft from landsat 8 oli data. ISPRS Journal of Photogrammetry and Remote Sensing. 141, 176–184. doi:10.1016/j.isprsjprs.2018.05.001.
- Zhao et al. (2021) Zhao, P., Qu, Z., Bu, Y., Tan, W., Guan, Q., 2021. Polardet: a fast, more precise detector for rotated target in aerial images. International Journal of Remote Sensing. 42, 5831–5861. doi:10.1080/01431161.2021.1931535.
- Zhao et al. (2019a) Zhao, Q., Sheng, T., Wang, Y., Tang, Z., Chen, Y., Cai, L., Ling, H., 2019a. M2det: A single-shot object detector based on multi-level feature pyramid network, in: Proceedings of the Thirty-Third AAAI Conference on Artificial Intelligence, pp. 9259–9266. doi:10.1609/aaai.v33i01.33019259.
- Zhao et al. (2019b) Zhao, Z.Q., Zheng, P., Xu, S.T., Wu, X., 2019b. Object detection with deep learning: A review. IEEE Transactions on Neural Networks and Learning Systems. 30, 3212–3232. doi:10.1109/TNNLS.2018.2876865.
- Zheng et al. (2020) Zheng, Z., Wang, P., Liu, W., Li, J., Ye, R., Ren, D., 2020. Distance-iou loss: Faster and better learning for bounding box regression, in: Proceedings of the AAAI Conference on Artificial Intelligence, pp. 12993–13000. doi:10.1609/aaai.v34i07.6999.
- Zhong and Ao (2020) Zhong, B., Ao, K., 2020. Single-stage rotation-decoupled detector for oriented object. Remote Sensing. 12. doi:10.3390/rs12193262.
- Zhou et al. (2020) Zhou, L., Wei, H., Li, H., Zhao, W., Zhang, Y., Zhang, Y., 2020. Arbitrary-oriented object detection in remote sensing images based on polar coordinates. IEEE Access. 8, 223373–223384. doi:10.1109/ACCESS.2020.3041025.
- Zhou et al. (2019) Zhou, X., Zhuo, J., Krähenbühl, P., 2019. Bottom-up object detection by grouping extreme and center points, in: Proceedings of the IEEE/CVF Conference on Computer Vision and Pattern Recognition, pp. 850–859. doi:10.1109/CVPR.2019.00094.
- Zhou et al. (2017) Zhou, Y., Ye, Q., Qiu, Q., Jiao, J., 2017. Oriented response networks, in: Proceedings of the IEEE Conference on Computer Vision and Pattern Recognition, pp. 4961–4970. doi:10.1109/CVPR.2017.527.
- Zhu et al. (2015) Zhu, H., Chen, X., Dai, W., Fu, K., Ye, Q., Jiao, J., 2015. Orientation robust object detection in aerial images using deep convolutional neural network, in: 2015 IEEE International Conference on Image Processing, pp. 3735–3739. doi:10.1109/ICIP.2015.7351502.
- Zhu and Liu (2018) Zhu, M., Liu, M., 2018. Mobile video object detection with temporally-aware feature maps, in: Proceedings of the IEEE/CVF Conference on Computer Vision and Pattern Recognition, pp. 5686–5695. doi:10.1109/CVPR.2018.00596.
- Zhu et al. (2019) Zhu, M., Pan, P., Chen, W., Yang, Y., 2019. Dm-gan: Dynamic memory generative adversarial networks for text-to-image synthesis, in: Proceedings of the IEEE/CVF Conference on Computer Vision and Pattern Recognition, pp. 5795–5803. doi:10.1109/CVPR.2019.00595.
- Zhu et al. (2021) Zhu, X., Su, W., Lu, L., Li, B., Wang, X., Dai, J., 2021. Deformable detr: Deformable transformers for end-to-end object detection, in: Proceedings of the International Conference on Learning Representations.
- Zhu et al. (2016) Zhu, X., Vondrick, C., Fowlkes, C.C., Ramanan, D., 2016. Do we need more training data? International Journal of Computer Vision. 119, 76–92. doi:10.1007/s11263-015-0812-2.
- Zhu et al. (2017) Zhu, X., Xiong, Y., Dai, J., Yuan, L., Wei, Y., 2017. Deep feature flow for video recognition, in: Proceedings of the IEEE Conference on Computer Vision and Pattern Recognition, pp. 4141–4150. doi:10.1109/CVPR.2017.441.
- Zou and Shi (2018) Zou, Z., Shi, Z., 2018. Random access memories: A new paradigm for target detection in high resolution aerial remote sensing images. IEEE Transactions on Image Processing. 27, 1100–1111. doi:10.1109/TIP.2017.2773199.