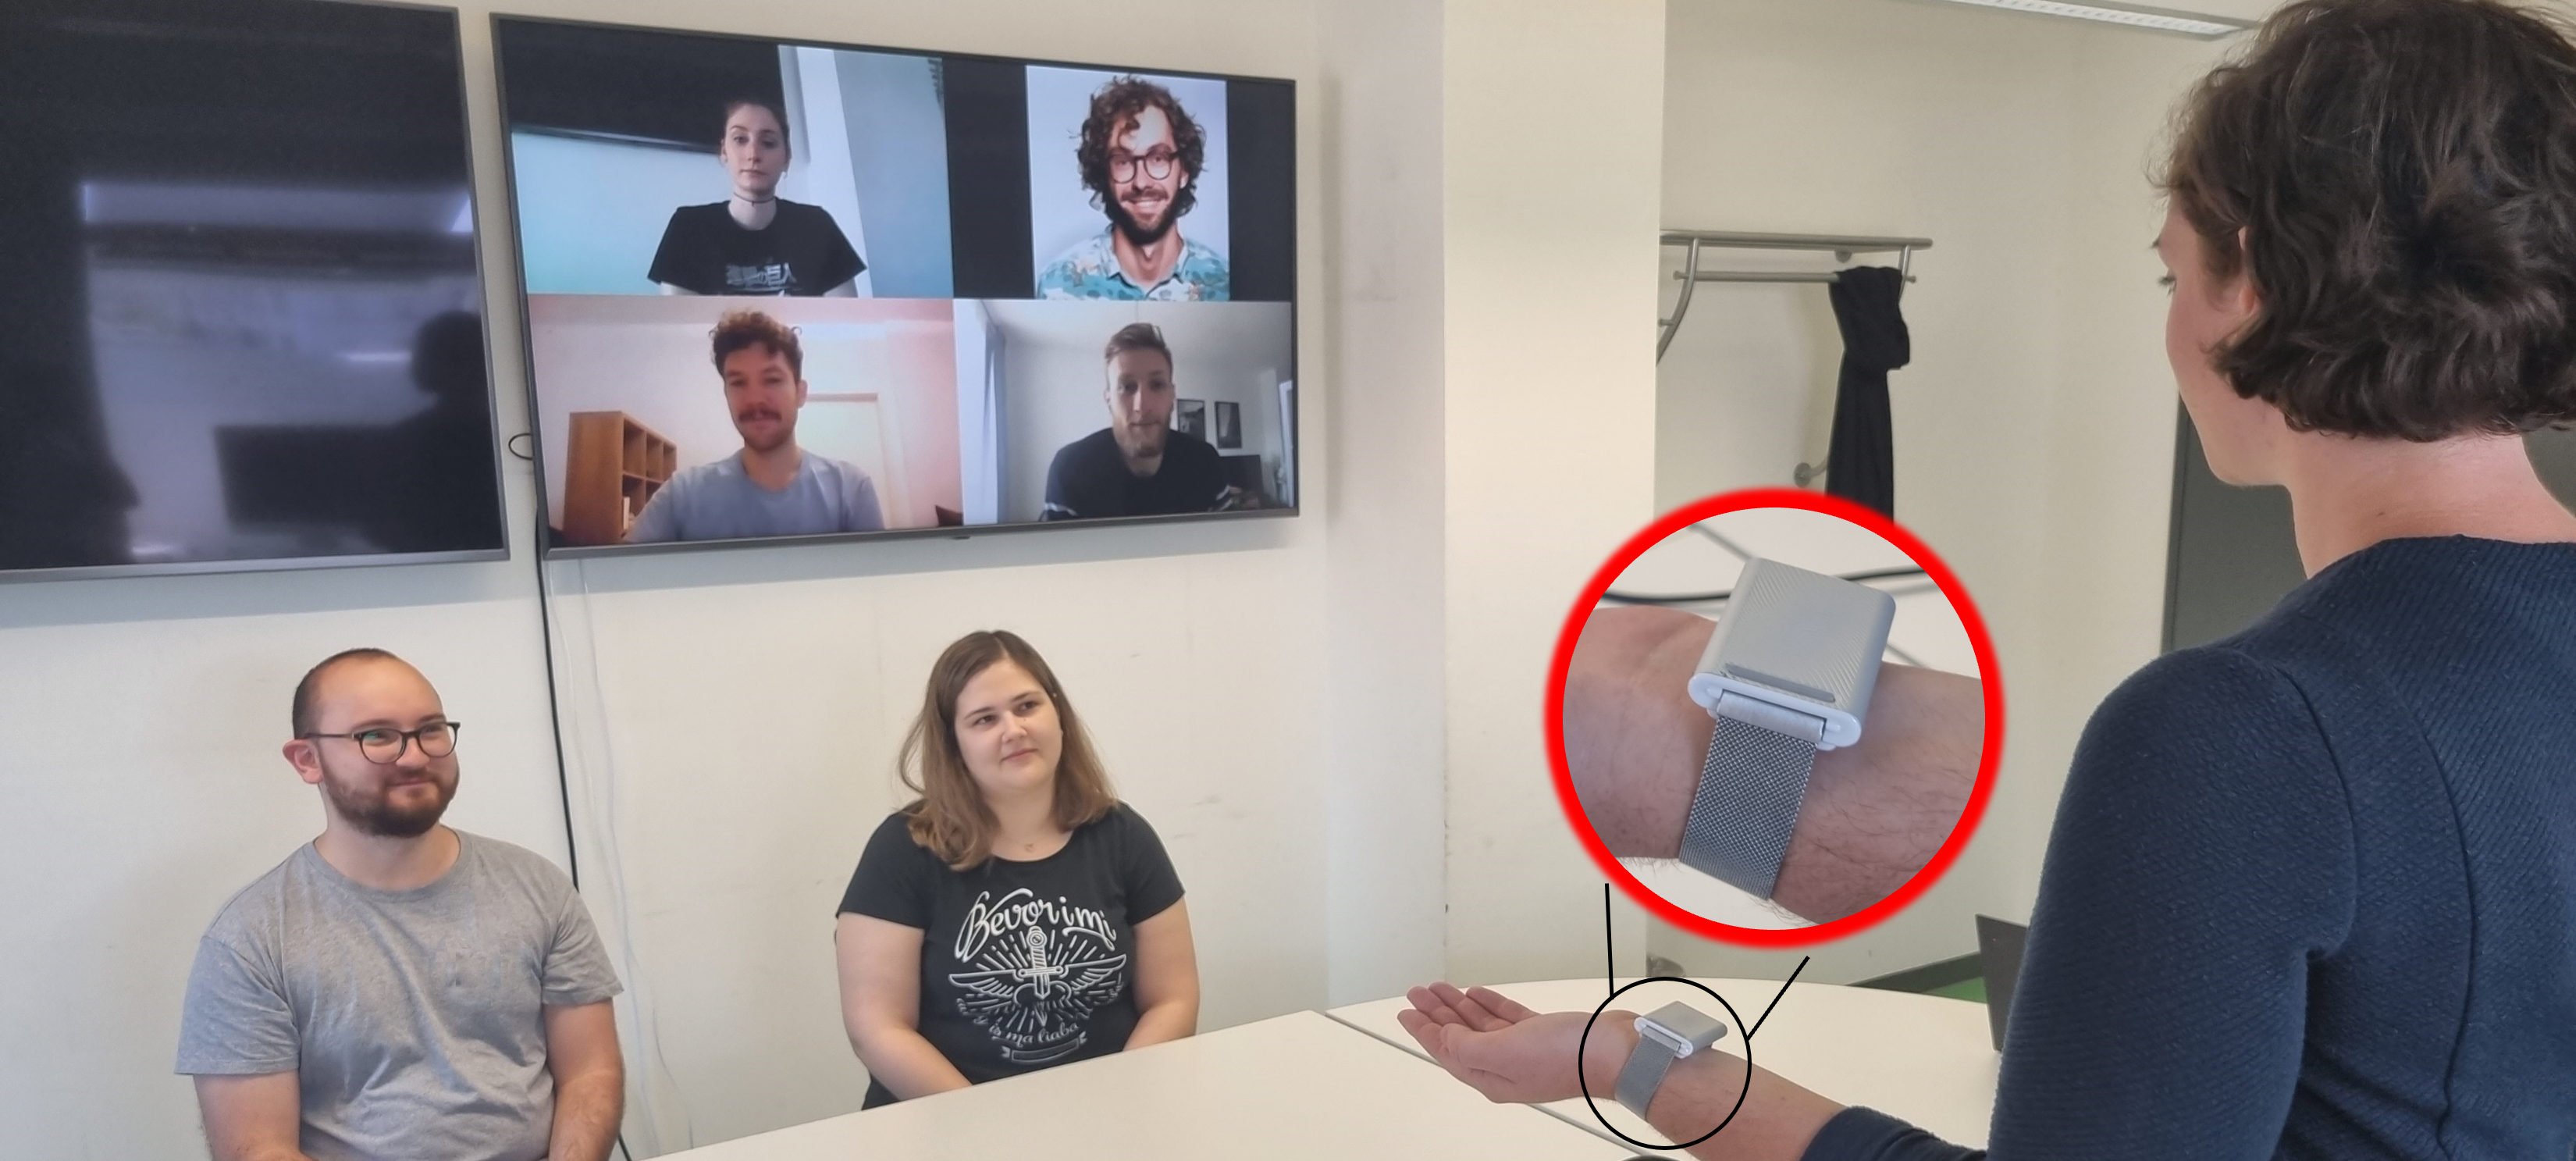
An image showing a participant wearing the thermal bracelet, presenting to a hybrid audience with two in-person audience members and four virtual.
Feeling the Temperature of the Room: Unobtrusive Thermal Display of Engagement during Group Communication
Abstract.
Thermal signals have been explored in HCI for emotion-elicitation and enhancing two-person communication, showing that temperature invokes social and emotional signals in individuals. Yet, extending these findings to group communication is missing. We investigated how thermal signals can be used to communicate group affective states in a hybrid meeting scenario to help people feel connected over a distance. We conducted a lab study (=20 participants) and explored wrist-worn thermal feedback to communicate audience emotions. Our results show that thermal feedback is an effective method of conveying audience engagement without increasing workload and can help a presenter feel more in tune with the audience. We outline design implications for real-world wearable social thermal feedback systems for both virtual and in-person communication that support group affect communication and social connectedness. Thermal feedback has the potential to connect people across distances and facilitate more effective and dynamic communication in multiple contexts.
1. Introduction
“Feeling the temperature of the room” is a common metaphor in western languages that relates a group of people’s mood to a temperature scale, because temperature is linked to socio-emotional experiences. In line with this, psychological research has shown that physical warmth promotes feelings of closeness to others (IJzerman et al., 2014) and communicates presence (Wilson et al., 2016), while cold induces feelings of separation (IJzerman and Semin, 2009) and absence (Wilson et al., 2016). Thus, temperature can be mapped to social emotions (IJzerman et al., 2012) and judgments of others (Asch, 1961; IJzerman and Semin, 2010).
Online communication is becoming increasingly ubiquitous, yet it omits many social and non-verbal aspects of communication (Saatçi et al., 2019). As a consequence, recent work in HCI has explored embodied and tangible designs to connect remote communication partners (van Dijk, 2022). Similarly, recent works in Empathic Computing have attempted to share emotions to foster social connections between people (Kim et al., 2019; Piumsomboon et al., 2017; Reichherzer et al., 2021). In this context, socio-thermal mappings have been applied to enhance the communication of emotions. Prior work used temperature, for example, to send asynchronous emotional signals (Fujita and Nishimoto, 2004; Lee and Lim, 2010) and to augment text messages (Tewell, 2018). To date, research has been limited to the case of sharing emotions between two users. We explore how thermal signals can be used to enhance real-time, spatially distributed communication with a group, extending what was once a one-to-one communication method to an n-to-one system.
In this paper, we explore thermal feedback for connecting groups across a distance by communicating group affect within the context of unobtrusive audience-speaker communication. We conducted a lab study (=20) in which participants were given a series of personalized warming and cooling thermal stimuli representing audience engagement to the wrist while giving a presentation in front of a simulated hybrid audience. We collected data using questionnaires, an eye tracker, and semi-structured interviews. With this study, we aim to address the research question: To what extent can thermal signals be used to communicate group affect and increase feelings of social connectedness over a distance?
Our results show that the socio-thermal signals are easy to understand and do not increase workload during presentations. We also found that thermal signals can promote audience awareness in the presenter and creates a correlation between social connectedness and presentation quality. However, the suitability of thermal signals varied for (dis)-engagement levels of the audience. Participants found thermal signals that show engagement encouraging and useful, while negative feedback (e.g., cold) was deemed distracting.
Overall, this paper contributes an exploration of thermal signals to communicate group affect in a hybrid presentation scenario and design recommendations for future design and research projects that use thermal signals for group communication. In particular, we derive seven design recommendations in total regarding group affect communication, social connectedness, and the implementation of a real-world system. This work extends the design space of thermal feedback to group communication and also adds a new modality to the space of audience-speaker communication. Our findings indicate that thermal feedback has the potential to facilitate more effective and dynamic communication and enhance social connectedness in both in-person and virtual contexts.
2. Related Work
In this section, we first present prior work on socio-thermal mapping and look at how thermal feedback has been explored in Human Computer Interaction (HCI). Next, we introduce relevant work on presentations and the communication of audience engagement. Finally, we provide a brief overview of unobtrusive interfaces and implicit interaction.
2.1. Socio-Thermal Mapping
Our social relations, i.e., interpersonal feelings and associations between two or more people, can be expressed on a temperature scale. Warmth indicates a reduction of psychological distance (e.g., “warming up to someone”) and coldness to an increase (e.g., “being cold towards someone”) (IJzerman et al., 2014). Indeed, the concept of warmth, along with competency, has been used effectively in social psychology to describe impressions of others (Asbrock, 2010; Brambilla et al., 2010). Asch (1961) showed in that a warm person is construed to be “sociable”, “popular”, and “happy”, while opposing qualities, such as “ruthlessness” or “unpopular” refer to a cold person. This can be understood in terms of embodied realism, where direct perceptual experiences, temperature perception in this case, are tied to more abstract concepts, such as impression formation (Lakoff and Johnson, 1999). Therefore, temperature can be seen as a readily accessible metaphor for the way we perceive and judge the affective state of others.
Research on embodied perception (Niedenthal et al., 2005) indicates that the expression of a socio-thermal relation can be taken literally (IJzerman and Semin, 2009). On the one hand, social exclusion is associated with a reduction of skin temperature (IJzerman et al., 2012) and estimates of room temperature (Zhong and Leonardelli, 2008). On the other hand, physical warmth prompts favorable evaluations of others (Williams and Bargh, 2008) and closeness (IJzerman and Semin, 2010). The socio-thermal mapping has also been found to be contagious; participants who watch others experience cold or warm temperatures experience the sensation themselves (Cooper et al., 2014). Thus, the socio-thermal relation can be considered a tightly coupled and bi-directional link that affects perception, motivation, physiology, and behavior.
In our work, we directly apply the socio-thermal mapping by having participants map an engaged or disengaged audience to a hot-cold scale. Prior research suggests that warmth equates to physical closeness, so we explore using thermal sensations to provide users with an indication of the attentiveness of an audience.
2.2. Thermal Feedback in HCI
HCI researchers (e.g., (Wilson et al., 2015, 2016; Umair et al., 2021)) have used temperature as a signal to understand elicited emotions and communicate information. There are several studies by Wilson et al. (2015, 2016) exploring the relationship between temperature and elicited emotions. They found a distribution of arousal and valence values assigned to various temperature inputs (Wilson et al., 2016) and reported that most participants related warmth to presence and high quality of content while cold meant absence and poor quality of content (Wilson et al., 2015). A recent study by Umair and colleagues (Umair et al., 2021) asked participants to choose a thermal signal to receive when they were stressed, and half the participants chose cold while the other half chose warm. Umair recommends that individual personalization is crucial to making temperature signals understandable. In our work, we draw on the thermal associations of Wilson (Wilson et al., 2015, 2016), e.g., warmth is happy, satisfied, and excited while cold is tired, bored, and annoyed, but also allow for personalization of the direction mapping as recommended by Umair (Umair et al., 2021) to ensure that the temperature signaling of affective states are understandable for all participants.
Previous work has identified locations on the body that are best suited to thermal feedback. Several groups have compared temperature sensitivity and device usability on multiple body parts (Maeda and Kurahashi, 2019; Kappers and Plaisier, 2019; Wilson et al., 2011). In general, hand (Zhu et al., 2019; Wilson et al., 2011) and wrist-worn (Maeda and Kurahashi, 2019; Kappers and Plaisier, 2019; Wilson et al., 2011; Song et al., 2015) devices were found to be effective and usable and have therefore been used in a range of application scenarios. Researchers have used thermal signals to communicate non-verbal messages to a partner (Fujita and Nishimoto, 2004; Lee and Lim, 2010), to communicate color to visually impaired people (Bartolome et al., 2020), as mobile icons (Wilson et al., 2012), and as a mobile display (Wettach et al., 2007). In a more abstract approach, Poguntke et al. (2018) used thermal feedback to communicate weather information and stress (Poguntke et al., 2019). In general, researchers have found that temperature can be a useful modality but it is not suitable for communicating complex (i.e. high-bandwidth) messages (Kappers and Plaisier, 2019). Rather than using temperature on its own, several groups have also used it to augment other forms of communication. Tewell et al. (2017) used temperature to add arousal information to text messages, while Akazue et al. (2017) augmented images. El Ali et al. (2020) used temperature to add arousal to voice messages for individuals with emotional prosody impairments. In all cases, temperature was an effective method of adding emotional signal to standard forms of communication.
2.3. Augmenting Presentations and Communicating Engagement
Humans normally gauge how interested an audience is through a combination of explicit (e.g., applause) and implicit non-verbal (Knapp et al., 2013) (e.g., eye contact and posture) signals. However, with large or virtual audiences, non-verbal cues are often lacking (Saatçi et al., 2019), so researchers have explored automatic systems for communicating audience feedback. Most of the prior work in the field has focused on measuring the affective state of the audience. Researchers have used explicit feedback methods such as the Live Interest Meter by Rivera-Pelayo (Rivera-Pelayo et al., 2013), where the presenter periodically polls the audience for feedback. HCI researchers have also explored the extent to which technology can be used to implicitly measure engagement (Stevens et al., 2007). Numerous physiological measurements have been used to quantify engagement, such as electroencephalography (EEG) (Zhang et al., 2014), accelerometers (Martella et al., 2015; Englebienne and Hung, 2012), cameras (Fujii et al., 2018; Hernandez et al., 2013), electrodermal activity (EDA) (Garbarino et al., 2014), galvanic skin response (GSR) (Latulipe et al., 2011), and heart rate (Atroszko et al., 2014). Heart rate (Konvalinka et al., 2011), EDA (Jaimovich et al., 2010; Gashi et al., 2019) and breathing rate (Bachrach et al., 2015) have been used to measure synchrony (i.e., the development of interdependent physiological states) between presenter and audience.
Despite the plethora of work that focused on measuring engagement and synchrony, very few researchers have addressed the issue of communicating this information to the presenter. Hassib and colleagues (Hassib et al., 2018) outlined a design space for audience sensing and feedback with dimensions: sender and receiver cardinality (i.e. the number of people being sensed or receiving feedback), location of audience (collocated or distributed), feedback synchronicity (synchronous or asynchronous), sensor location (on-body or environment), and feedback sensing style (implicit or implicit). As an extension of this work, they developed the EngageMeter (Hassib et al., 2017), which uses EEG to measure audience engagement implicitly and provide both live and post-hoc visual feedback. Similarly, Murali et al. (Murali et al., 2021) implemented a visual spotlight system for virtual meetings that highlights audience affective states. In both cases, the assistive technology was perceived as useful and helped the presenter understand their audience (Hassib et al., 2017; Murali et al., 2021), but both use visual feedback, which has been shown to demand attention and be distracting (Lavie, 2005).
To our knowledge, the usage of real-time non-visual feedback as a modality to communicate audience affective states to a presenter is yet to be explored. Given the high attentive demand of visual stimuli (Lavie, 2005) and the emotional metaphors associated with temperature (Wilson et al., 2016), thermal feedback is a promising modality for this use case.
2.4. Unobtrusive Design
Unobtrusive design enables the user to easily ignore an interface and to keep it in the periphery of their attention (Bakker, 2013; Weiser and Brown, 1997). Research about peripheral and implicit interactions aims to reduce stress (Ledzińska and Postek, 2017; Kiss and Schmidt, 2019) and avoid information overflow and interruptions (Weiser and Brown, 1997; Raudanjoki et al., 2020; Kim and Lee, 2009; Bakker et al., 2016). Thus, users can concentrate on their main task at hand (Hausen, 2012; Hausen et al., 2014).
Designing for peripheral interaction means designing for attention-inviting and non-demanding interfaces (Bakker et al., 2016). A shift in attention can be triggered by, among other things, evoking positive or negative emotions, but these also require personalization (Bakker, 2013). Thus, designing for implicit interaction means enabling secondary activities to run in the background of attention, often in parallel to explicit tasks (Serim and Jacucci, 2019; Ju and Leifer, 2008). Interactive wearables are also often considered unobtrusive (Rekimoto, 2001; Zheng et al., 2014; Gashi et al., 2019; Lietz et al., 2019; Di Lascio et al., 2018) as long as they are adapted to the user’s skin and temperature sensitivity and stay non-disruptive to movement (Genaro Motti and Caine, 2015), and prior work has explored novel affective wearable displays, such as chronometry (Umair et al., 2019). Costa et al. (Costa et al., 2016) have shown that wearable affective feedback systems can be effectively implemented with minimal impact on attention. Researchers are increasingly studying emotions elicited by unobtrusive wearables using thermal feedback (c.f., (Gradl et al., 2019; Nasser et al., 2019; Suen et al., 2021)). Such interfaces, including the one used in our study, aim to not pose additional cognitive load by their unobtrusive design and provide a peripheral interaction that is easy to ignore if desired.
3. Method
We conducted a within-subjects lab study to explore thermal feedback for communicating group affective information in the context of presentations. Each participant delivered two presentations to a hybrid audience based on one-page prompts. One presentation was delivered with thermal feedback and one without. The order was counter-balanced using a Latin Square (Bradley, 1958). This study design was chosen so that each participant would experience thermal feedback as an affect-communication modality in a controlled scenario, enabling us to investigate the technology in an exploratory manner.
3.1. Apparatus
All experiments took place in a conference room equipped with large wall-mounted screens and a meeting table. Each participant sat on one side of the table while the in-person audience sat on the opposite side, and the virtual audience was displayed on the screen on the wall opposite the presenter (see Figure 1).
We used an Embr Wave111https://embrlabs.com/ thermal wristband to provide thermal feedback to the participants. The device has a resolution of approximately 0.1°C and can be adjusted with a rate of change of 0.1–1 °C/s (Smith et al., 2017). The Embr Wave device operates by selecting a temperature offset, rather than an objective temperature set point, and the device pulses to this temperature offset. This model has previously been used in HCI studies to provide a thermal signal (Umair et al., 2021; Smith et al., 2017).
We also equipped participants with a wearable Pupil Labs222https://pupil-labs.com/ Pupil Core eye tracker, which has commonly been used to capture unconstrained eye motion (Kassner et al., 2014; Jungwirth et al., 2018; Santini et al., 2018).
3.2. Task
The primary experimental task was for each participant to give two 3-minute presentations. Although 3 minutes is a relatively short presentation window in which to engage an audience, it is representative of multiple real life scenarios such as startup pitches in entrepreneurship (typically 1-5 minutes) or academic 3-minute-thesis formats. Since the aim of the task was for participants to give a presentation with very little information, we opted for this short but applicable timescale. The participants were given a one-page prompt for each presentation with information about a fundraiser333The prompts are included in the supplementary material.. Additionally, we provided them with materials to take notes and as much time as they wished to prepare for the presentations. We asked them to imagine that they were raising money for each of the fundraisers and gave all participants the same two topics — a new magazine to empower young girls and a newly invented automated toothbrush. The two topics were based on real, successful Kickstarter444https://www.kickstarter.com/projects/amabrush/amabrush-worlds-first-automatic-toothbrush and https://www.kickstarter.com/projects/2110119100/kazoo-magazine, last accessed campaigns.
All participants presented to a hybrid audience consisting of four virtual and two in-person audience members (see Figure 1). This setup was chosen because hybrid events are becoming increasingly ubiquitous and often lack non-verbal cues (Saatçi et al., 2019). We recorded two reaction videos of the virtual audience before the study, which consisted of three real people and one “camera off” person. The virtual audience members were displayed as individual panels in “gallery view”, as is common in many commercial video conferencing systems. While recording the videos, the virtual audience was instructed to act engaged or disengaged according to predefined timings. One author was present in the call as the “camera off” person and verbally communicated to the virtual audience members when it was time to act engaged or disengaged throughout the recording process. During the presentations, the reaction video was played without sound. The full timeline of both temperature and facial expressions is shown in Figure 3. During the actual task, each participant was presented with the pre-recorded virtual audience videos while they delivered their presentations. Two authors were also present as in-person audience members and reacted according to the same script timing as the virtual audience. We chose to use audience facial reactions (without thermal feedback) as the control condition since this is the most common type of immediate feedback experienced during presentations.
The task, as designed, uses a Wizard of Oz approach since the feedback from the audience is simulated. This approach was chosen primarily to reduce the variability between the feedback each participant receives. Since this is the first investigation into thermal feedback as a mechanism to communicate group affect during presentations, it was most important to have each participant experience a range of audience feedback that stays consistent across participants. We aimed to investigate how users perceive both positive and negative feedback and how they could imagine integrating such feedback into their presentations.
3.3. Experimental Procedure
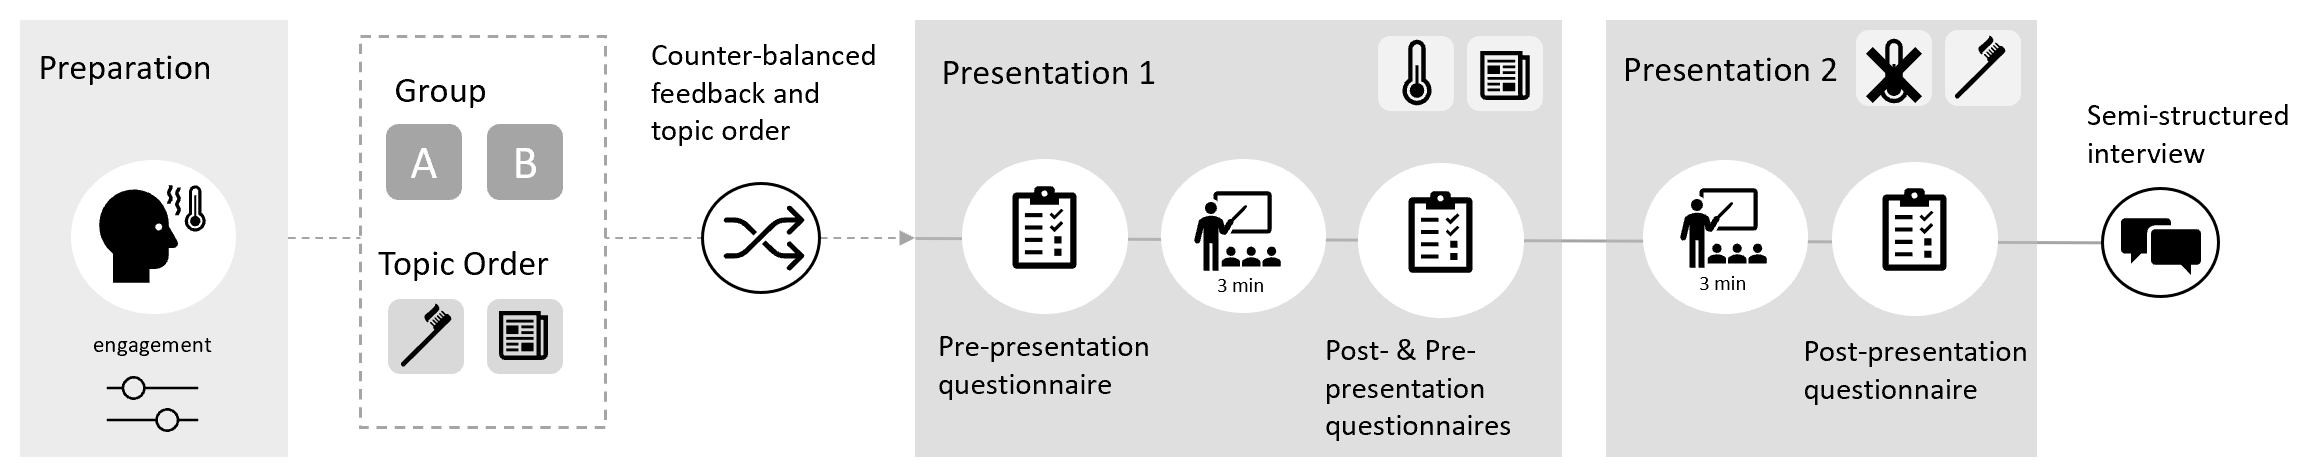
Diagram showing the overview of the experimental protocol. As a preparation, the thermal feedback is personalized to participants’ sensation. The participants give one presentation with and one presentation without thermal feedback in a counter-balanced order.
The experiment consisted of two distinct phases. In the first phase, we personalized the socio-thermal mapping and calibrated the equipment for each participant. In the second phase, the participants held two presentations in front of a hybrid audience with the aim of raising funds based on real organizations — a social magazine and a toothbrush company. The experimental protocol is shown in Figure 2.
3.3.1. Preparation Phase: Personalization and Calibration
After introducing the study and obtaining informed consent, we equipped the participants with the Pupil Labs eye tracker. We first calibrated the eye tracker using the standard procedure outlined by the manufacturer and the associated Pupil Capture software and let participants get accustomed to having the device present in their peripheral vision.
Following the eye tracker setup, we equipped the participants with an Embr Wave thermal wristband (Umair et al., 2021; Smith et al., 2017). The participants were instructed to place the wristband on whichever wrist they preferred, with the thermal module on the inner side of the wrist. We personalized the thermal feedback for each participant according to the recommendation by Umair (Umair et al., 2021). The participants could chose a maximum threshold they were comfortable with, up to C. The C maximum range was based on common values used in prior work (Wilson et al., 2015; Umair et al., 2021). The participants were presented with the thermal signals in each direction in a counter-balanced order. The participants were then asked to choose one end of the scale (Completely Engaged to Completely Disengaged) to associate with each endpoint.
We constructed a linear 5-point mapping between temperature and engagement based on the end-points established in the personalization step. For example, if a participant was comfortable with the initial temperature range and associated +8C with a Completely Engaged audience and -8C with a Completely Disengaged audience, we would construct the mapping depicted in Table 1. To confirm the mapping, we presented participants with the thermal feedback again and asked them to recall the associated mapping. We gave the participants the opportunity to change their mapping if the signal did not comply with their expectations. The aim of this process was to ensure that participants knew the mapping between temperature and engagement level and understood the thermal signal before starting the main phase of the study.
| Engagement Level | Temperature |
|---|---|
| Completely Disengaged | -8C |
| Disengaged | -4C |
| Neutral | 0C |
| Engaged | 4C |
| Completely Engaged | 8C |
Before moving on to the main experiment task, we measured the temperature of the room using a Bosch UniversalTemp infrared thermometer and asked the participants for their subjective perception of the room temperature. The average room temperature during experiments was 26.8C (SD=1.1). None of the participants felt cold during the study. 35% felt neutral, 50% felt warm and 15% felt hot.
3.3.2. Main Phase: Presentations
Following the personalization phase, every participant took part in both experimental conditions: (1) presenting with thermal feedback and (2) presenting without thermal feedback. Participants received facial reactions from the hybrid audience members in both conditions. The audience was introduced to the participants as a ‘simulated audience’ to communicate that the reactions were pre-recorded and consequently they could not interact with the audience. This was communicated to prevent an interruption in flow for the scenario where participants might try to ask the audience to react in a specific way (e.g., raising their hands). The order of the conditions and the topics were counter-balanced using a Latin Square (Bradley, 1958), resulting in four different combinations of topics and feedback availability. Each participant delivered two total presentations, one with thermal feedback and one without.
3.4. Measures
We are investigating a novel feedback modality for presentations and therefore collected both quantitative and qualitative data from multiple sources to understand the user experience and the impact on the user. As such, we collected eye tracker data as a proxy for distraction, questionnaire responses for usability and social connection, and user interviews for deeper qualitative insights.
We used the Pupil Capture software to collect data from the eye tracker. The eye tracker was used to detect glances at the thermal feedback device, which would indicate that the feedback drew the participant’s attention. The thermal bracelet was controlled with a custom Python script, which also logged timestamps for the thermal signals. The thermal feedback followed the same script as the audience reactions.
The participants completed questionnaires before and after each presentation to capture perceptions on performance, workload, usability, and connection. Before each presentation, the participants were asked about their expected performance: “How well do you think you will do during your talk?”. Following each presentation, the participants responded to a questionnaire with standardized scales for workload (NASA-TLX (Hart and Staveland, 1988; Hart, 2006)), usability (AttrakDiff (Hassenzahl et al., 2003)), and presentation confidence (PRCS (Hook et al., 2008)), as well as subjective Social Connectedness and Perceived Presentation Quality questions from Murali’s work on audience communication (Murali et al., 2021) and perceived stress (Thomée et al., 2007). We also collected basic demographics at the end of the final questionnaire.
As a final step, every participant completed a semi-structured interview to gather qualitative data. We had guided questions, such as asking participants about their feelings towards the thermal feedback, whether they found it distracting, how usable they found it, and how they would imagine using such a system in a real presentation.
3.5. Analysis
We collected data from questionnaires, interviews, and an eye tracker. Each of these data sources has a separate method of analysis.
We analyzed the standard scales (e.g. NASA-TLX (Hart and Staveland, 1988; Hart, 2006)) according to their original documentation. We performed t-tests when normality was satisfied according to Shapiro-Wilk tests and performed paired Wilcoxon signed-rank tests with Bonferroni corrections on all other questionnaire responses.
The audio from each semi-structured interview was recorded and transcribed verbatim. As a first step, the interview transcripts were coded using open coding by two authors. After a discussion, we identified themes in the responses and completed a second pass with a focus on specific questions from the interview protocol, such as whether the participants prefer the aggregated signal showing mean affect or some alternative. Three authors discussed and agreed on the final high-level themes.
For the eye tracker, we correlated fixation events with different thermal signal levels to analyze whether the bracelet was distracting. For our purpose, we define distraction as a shift in attention from the primary task, while disruption is defined as when the primary task is interrupted by a distraction (Graydon and Eysenck, 1989). As such, if we record moments where the user’s attention is drawn to the bracelet to the extent that they look at it, we would classify this as a disruption due to strong distraction. We recorded timestamps for the thermal signal provided by the Embr Wave bracelet and the facial feedback of the virtual audience. We checked these recordings to ensure that the signals matched our predefined script and used the timeline when analyzing the data from the eye tracker. The second author coded the eye tracker videos and labeled each time the participant glanced at the thermal bracelet. The initial analysis step was a manual control for device glances and fixations. One author looked at the recordings for all presentations with thermal feedback at two times speed using the Pupil Player v3.3.0 software. Within this software, eye gaze was visualized as a closed gaze circle of radius 20 and gaze movement was indicated using a gaze polyline of thickness 2. We used the fixation detector plugin, which calculates fixations based on the positional angle of the eyes, with default parameters for the dispersion threshold parameter, minimum duration, and maximum duration.
3.6. Participants
We recruited =20 participants, aged 22-55, =27, = 6.97 (13 female, 7 male). Sixteen of the participants had a bachelors level of education or higher, one completed vocational training, and three have a high school diploma. Participants give an average of 1.5 presentations per week. Most of the participants had little to no experience with thermal feedback. The compensation was based on an hourly rate of 10 €/hour. The only prerequisite for participation was proficiency in English. The study was approved by the ethics committee within the University Faculty555Details removed for anonymization purposes. Below, we will refer to participants with their study ID (e.g. P5).
4. Results
We present both the qualitative and quantitative results clustered by the themes identified in the interview responses, first discussing the validity of the experiment and then providing evidence in the themes of distraction, social connectedness, and usability. Figure 3 shows an overview of the experimental procedure including a sample audience member, the thermal signal, and eye tracker information.
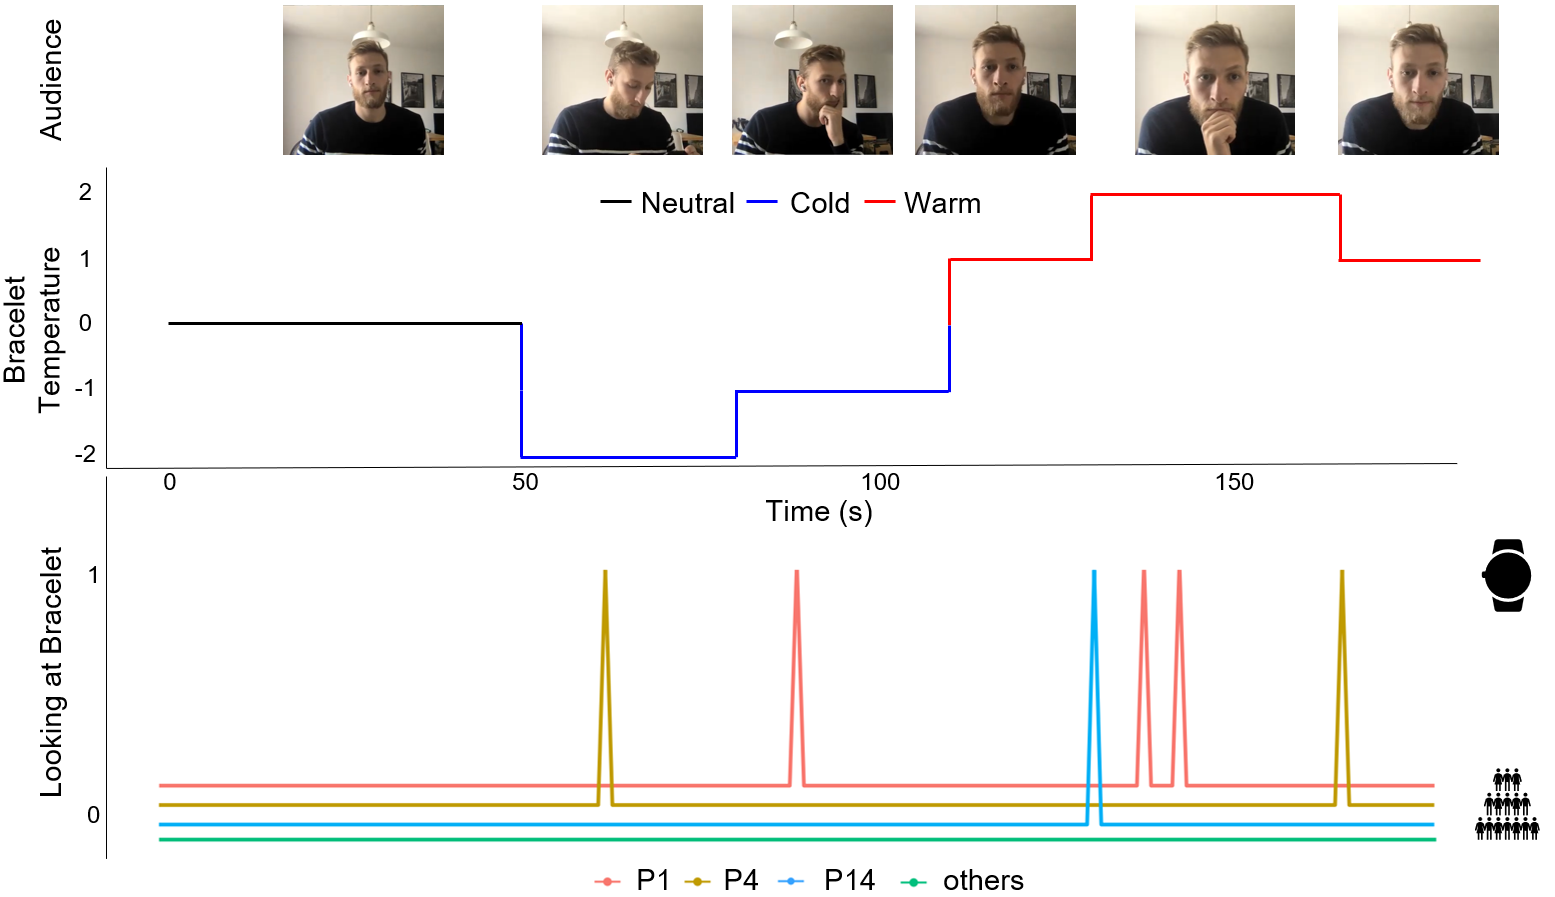
. All photos are used with the express written consent of the subjects. \DescriptionThe figure shows an overview of the experiment timeline. The plot shows example audience engagement expressions, the normalized temperature level in the thermal feedback condition, and the times that participants looked at the thermal bracelet.
4.1. Validation
Participants were consistent with their interpretation of the thermal signals. 90% of the participants interpreted the signals as expected and associated an increased temperature with an engaged audience and a decreased temperature with a disengaged audience. Among those who chose the opposite mapping (i.e. set cold as engaged and warm as disengaged), P10 said that they dislike the feeling of warmth and disengagement is negative, thus assigning it the negative feeling of a disengaged audience. P4 mapped warmth to arousal and cold to focus.
The temperature range from 8°C to 8°C was comfortable for 17 of 20 participants. The coldest signal was uncomfortable for two participants, so they used a range of -6°C to 8°C, while one participant found the warmest signal uncomfortable and chose a range of -8°C to 6°C. When we presented the participants with the thermal feedback and asked them to recall their associated mapping, all 20 participants did so without errors.
Although the thermal mapping worked for communicating engagement, some participants found it counterproductive in the context of presentations; giving a presentation can be stressful (Merz et al., 2019), and stress is associated with heat (Wilson et al., 2016). For one participant, the thermal mapping to stress was more dominant than the mapping to engagement confirming the importance of personalization:
“If I get nervous or flustered during a talk […] when it went hot […] it was simulating that and it would make me maybe a bit more nervous […]. The cold kind of did the opposite, it calmed me down a little bit.” (P17)
The perceived stress was not normally distributed (, ), and Wilcoxon signed-rank tests with Bonferroni corrections indicate that there was no significant difference in stress between presenting with or without thermal feedback (, , , ). Further, the workload according to the NASA-TLX was normally distributed (, ) and showed no significant difference with or without thermal feedback according to a t-test (, , ).
Participants’ expected performance was not normally distributed (, ), so we performed Wilcoxon signed-rank tests with Bonferroni corrections. The participants did not expect to perform significantly better or worse during their talk with thermal feedback (, , , ), which affirms that we did not artificially prime them with false confidence. There was also no significant difference in expected performance between topic conditions (, , , ). Additionally, there were no significant correlations between the participants’ average number of presentations per week and any of expected performance (, ), perceived connectedness (, ), or perceived quality (, ), so the results do not appear to be biased by prior presentation experience.
Regarding the feedback setup, we asked participants in the interview whether they would like the option to have additional channels representing individual members or segments of the audience. All of the participants indicated that the current setup, with a single aggregated channel representing the mean audience affect, was preferred as additional information “would be more distracting” (P17).
4.2. Distraction and Unobtrusiveness
All participants said they perceived the device and feedback to be unobtrusive and would not expect others to notice it. We asked each participant whether the audience would be able to notice the feedback: 85% noted that the signal itself is not detectable by others and 25% mentioned that the device resembles a smartwatch so they would be comfortable wearing it during a real presentation.
Although there was no significant increase in workload, seven participants voiced in the interview that they found the thermal feedback a bit distracting, and three quite distracting. Negative thermal feedback was mentioned as being particularly distracting because it caused participants to think about changing their talk.
Based on the eye tracking data, visualized in Figure 3, only three participants looked at the thermal feedback device, one of them three times. They glanced at the device briefly but did not fixate for more than 400ms. Thus, the signal was not distracting to the point where participants were visually disrupted. The participants looked at the device mostly during very warm and very cold thermal feedback. The remaining participants did not find the thermal feedback distracting. Participants mentioned that they were able to detect the thermal feedback and understand its meaning without it interrupting them:
“I noticed it and I tried to adapt but it didn’t bother me.” (P7)
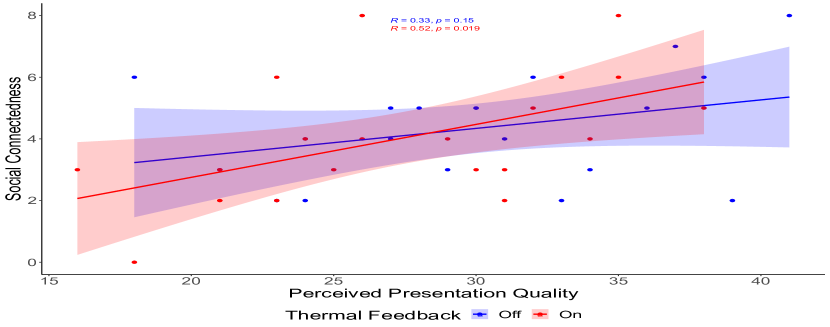
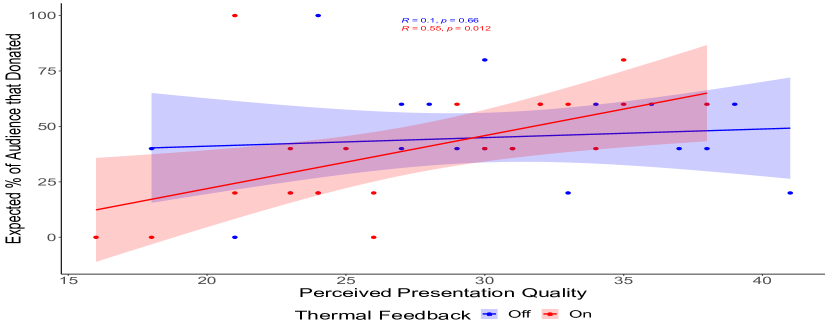
Two scatter plots showing the correlation between Social Connectedness and Perceived Presentation Quality as well as Donations and Perceived Presentation Quality. In both cases there is a significant correlation when using thermal feedback, and uncorrelated without.
As a novel device and experience, participants said that the thermal feedback drew their attention. However, participants also expected that the thermal feedback would fade into the background with practice:
“At some point, you’re going to still feel, but you’re so used to it that you’re not going to think about it anymore. It’s like an intuition.” (P9)
Participants found thermal feedback to be the most adequate modality they could imagine for communicating audience engagement, since other modalities would be more distracting:
“I think nothing that is sound or too visual because that would put me off track for the presentation. What I liked about the temperature is that it’s subtle.” (P18)
4.3. Social Connectedness
Questionnaire responses related to social connectedness varied depending on whether the participant was receiving positive or negative feedback. According to our results, participants felt reassured when they received positive thermal feedback and felt anxious when they received negative feedback. Participants also reported that, in general, the thermal feedback helped them feel more aware of and connected to the audience:
“Thermal feedback really did a great job in raising my awareness of the audience and also increases connectedness to my audience.” (P3)
Participants found the positive feedback reassuring and confidence inspiring:
“It was a bit calming because when it was warm, I knew that I was doing all right.” (P19)
As mentioned in subsection 4.2, participants found negative feedback more distracting than positive feedback. One participant mentioned that they “cannot really change anything at the moment” (P5), while others noted that the negative feedback was demotivating:
“If I’m already doing bad, I don’t need to have someone tell me I’m doing bad. It’s just demotivating.” (P19)
Based on these responses, we hypothesized that participants would feel more positively about a good presentation with the thermal feedback than without, and more negatively about a bad presentation with thermal feedback than without. To test this hypothesis, we calculated Pearson’s product-moment correlations for Social Connectedness and Perceived Presentation Quality. Social Connectedness, in this case, was measured by questions about how close or distant the participant felt from their audience. Further, we asked participants how many audience members they thought would donate to their simulated fundraiser and calculated Pearson’s product-moment correlations for Donations and Perceived Presentation Quality.
As shown in 4(a), Social Connectedness is significantly positively correlated (, ) with Perceived Presentation Quality when the participants had thermal feedback. Without thermal feedback, there was no significant correlation (, ).
Similarly, 4(b) shows that the expected number of Donations is significantly positively correlated (, ) with Perceived Presentation Quality only when participants received thermal feedback (, without thermal feedback).
4.4. Usability and Contexts for Use
The results of the AttrakDiff questionnaire, shown in Figure 5, indicate that participants found the device to be usable. Aggregated participant responses indicate that overall thermal feedback was rated positively in terms of Pragmatic Quality (i.e. usefulness and efficiency), Hedonic Quality (i.e. joy of use), and Attractiveness. The confidence rectangle does not fall completely within any block, although it trends towards self-oriented, desired, neutral, and task oriented.
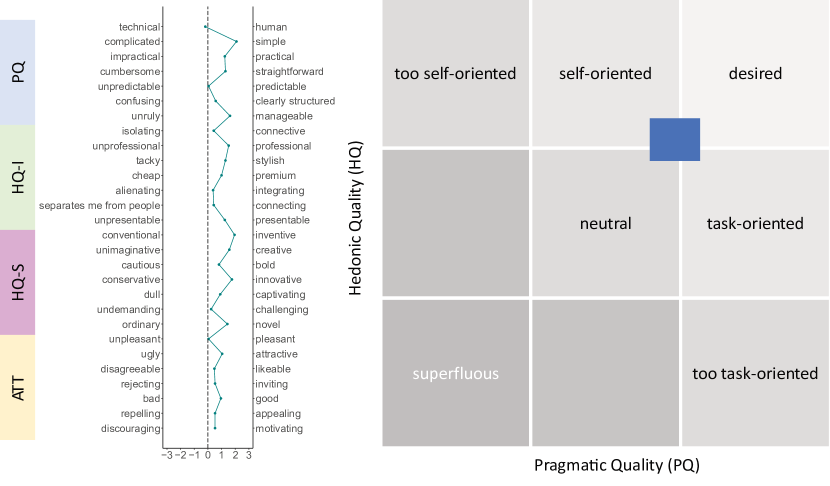
The results of the AttrakDiff questionnaire. The response categories are labeled Pragmatic Quality (PQ), Hedonic Quality Identity (HQ-I), Hedonic Quality Simulation (HQ-S) and Attractiveness (ATT). Hedonic Quality (HQ) = HQ-I + HQ-S.
We asked all participants about the scenarios in which thermal feedback would be useful. Three participants mentioned that thermal feedback would be particularly useful for in-person scenarios because visual feedback would make them “lose your eye contact” (P12), while in online presentations they are “already looking at the screen” (P20). However, 40% of participants felt that thermal feedback was best suited to online presentations and 35% stated that it would be useful for both:
“I think it’s probably more useful for online [presentations] because you don’t get really much feedback at all. You can’t hear people rustling in their chairs or anything like that.” (P17)
Participants mentioned that for small in-person presentations or meetings the device would not be useful, since they would be able to understand audience engagement implicitly. However, participants mentioned that thermal feedback would be useful for in-person presentations in front of a large audience.
Finally, participants highlighted practice talks as a useful context. They stated that they would a similar system when giving a talk more than once so they could identify good and bad segments and iterate over their presentation:
“I think it would be really helpful if I’m practicing for a bigger presentations […] I would practice and then the group of audience would give me feedback through this.” (P14)
In this context, participants felt that the device could help a presenter “to get better, and learn from your faults” (P15).
5. Discussion
In this study, we sought to answer the research question: To what extent can thermal signals be used to communicate group affect and increase feelings of social connectedness over a distance? We will therefore discuss how our findings relate to designing thermal systems for group settings, how thermal signals impact social connectedness, and implementing real-world audience feedback systems.
5.1. Implications for Designing Thermal Feedback for Group Affect
5.1.1. Thermal Feedback Should Represent Dual Meanings at Most
Our study explored thermal feedback of group affect in the context of audience engagement. Although audience engagement can be complicated to measure (Stevens et al., 2007), the information that is being communicated to the presenter is simple. The thermal device communicates a two-sided signal, with one end being “engaged”, the other being “disengaged”, and no signal representing “neutral”. This is in line with recommendations from both Kappers and Plaisier (2019) and Song et al. (2015) recommendation that temperature is not suitable to communicate complex messages. Based on our study as well as previous work, we recommend that future designers do not use a thermal signal to represent information that is more complex than a two-sided signal.
5.1.2. Thermal Mapping Should be Personalized for Easy Understanding
It is crucial that the user understands and embodies the thermal mapping that is being communicated by the temperature signal in order to effectively use the system. Our results indicate that participants had no trouble internalizing the mapping that they chose for themselves, and although most agreed on the same mapping, there were two participants who chose the opposite. Our results are, therefore, in line with the results of Umair (Umair et al., 2021) and can underline that personalization is important for thermal displays for one-to-one and n-to-one communication in HCI.
5.1.3. Negative Thermal Feedback Distracts While Positive Feedback Encourages
When receiving negative feedback, participants tried to think of ways to change their presentation on the fly. In our study scenario, the participants had limited time to prepare their talk and had limited options for adapting their task based on audience feedback while talking. We expect that negative feedback could be effectively used if a presenter designed their presentation in advance with the intention of using an engagement-feedback system. However, based on the results of our study, we would recommend to design a feedback system that focuses on positive reinforcement if the goal is to improve social connectedness between the presenter and audience without distracting the presenter. Negative feedback should only be included in the system if the participants have the capacity to adapt to a negative signal, i.e., for proficient speakers, or to practice spontaneous adaptation.
5.2. Social Connectedness
5.2.1. Thermal Feedback Connects the Presenter to the Audience.
When participants received thermal feedback, Social Connectedness and Perceived Presentation Quality as well as Donations and Perceived Presentation Quality covaried, while the same measures do not covary without thermal feedback. Although this does not necessarily indicate causation, the results show that the higher participants estimated their performance in their presentation, the more socially connected they felt while wearing the device. They also felt more distant from the audience when they did poorly only while wearing the device. The same holds true for Donations, which we used as a proxy for how well the presenter felt the audience would rate their presentation. This indicates that the connective function of the thermal feedback is not only present in participants qualitative statements but also increases awareness of group-communicative processes. Thus, enhancing the perception of group-affective states. It also highlights the suitability of the thermal signals to represent socio-emotional experiences, which is consistent with prior work showing that the temperature-emotion experience is contagious (Cooper et al., 2014) and that the socio-thermal mapping is tightly coupled (IJzerman and Semin, 2009).
5.2.2. Feedback is Useful for Disconnected Groups
This paper targeted thermal feedback for communicating group affect, which differentiates from prior work that commonly explores one-to-one communication. Our participants highlighted that thermal feedback would be particularly useful for large audiences instead of more direct communication, since common non-verbal signals are easily accessible when presenting to a single person or a sufficiently small group. As such, the feedback from our participants motivates further research into the group context. The participants also mentioned that the feedback is well suited to communicating affect from online group members. It is more difficult to read non-verbal signals from online members, and at the extreme they may have their camera off and therefore give no opportunity for feedback. Past work has already investigated using thermal feedback to communicate between users at a distance through smartphones (Wilson et al., 2012, 2011), so these findings could be extended to synchronous virtual communication. The participants indicated that they were satisfied with a single aggregated channel that communicates the mean affect of the audience, but further research in other application scenarios may reveal that different communication strategies may be appropriate for certain tasks. For example, a teacher may be more concerned about outliers in their class (e.g., is there a student who is losing interest), rather than the average level of engagement, while an entertainer might be more concerned with maintaining a high average engagement.
5.3. Towards Implementing a Real-World System
Prior to this paper there was a multitude of research on measuring audience feedback (e.g. (Rivera-Pelayo et al., 2013; Murali et al., 2021; Hassib et al., 2017; Martella et al., 2015), but very little on unobtrusively communicating this feedback to the presenter. Related prior work (Costa et al., 2016) has also shown that wearable affective feedback devices can be effectively employed to impact affect with low attention requirements. By combining prior work on measuring audience engagement with our findings on providing feedback to presenters, all of the components required to implement a system in the real-world are now understood. Our system can scale to large audiences depending only on the limits of the chosen audience measuring system, so we could effectively transform what has been a one-to-one communication channel to be n-to-one.
Previous research in measuring and communicating audience engagement, such as Murali et al. (2021) and Hassib et al. (2017), commonly used visual methods, such as charts and bars, to represent the affective information from the audience. Future work should investigate how thermal and visual representations could be combined. For example, the discrete nature of thermal signals could be used during a presentation, while a detailed visual representation could be provided afterwards to encourage reflection and improvement over time.
5.3.1. Users Expect Our Thermal Feedback System to Unobtrusively Support Their Main Task in the Real-World
Our study used a Wizard of Oz approach to generate a thermal signal rather than measuring actual audience engagement. To employ a socio-thermal feedback system in the wild, our feedback setup should be combined with prior work in measuring audience engagement, such as the facial expression recognition system from Murali et al. (2021) for a virtual audience or the EngageMeter from Hassib et al. (2017) for an in-person audience. Our participants reported that the device could be worn in a real group scenario without being detected, and they expected the signal to fade into the background over time. Moving technology into the periphery of attention is the primary focus of unobtrusive design (Bakker, 2013; Weiser and Brown, 1997), so we expect that our system can be implemented in the real world unobtrusively.
5.3.2. Combining Thermal Feedback with Implicit Audience Measurement May Facilitate Non-verbal Remote Communication
According to the design space proposed by Hassib et al. (Hassib et al., 2018), an implicit and synchronous feedback system would be most appropriate to combine with thermal feedback since it supplies an embodied continuous signal. As mentioned in the previous section, our system could be combined with implicit audience measurement systems such as Murali et al. (2021) for virtual audiences or Hassib et al. (2017) for in-person scenarios. The combination of thermal feedback with implicit audience measurement has the potential to overcome the lack of non-verbal cues associated with online and hybrid presentation settings (Saatçi et al., 2019) by providing a feasible, unobtrusive system that enhances social connectedness between presenters and their audience without increasing workload.
5.4. Limitations & Future Work
One potential limitation of our study is the influence of the novelty effect (Kormi-Nouri et al., 2005). The participants were not accustomed to interacting with thermal signals, so the device was a novel experience. If the participants were to use the device over time, the signal would likely become more implicit and less distracting.
Another limitation of our study is that we used an eye tracker to identify moments where participants were distracted to the point that they looked at the bracelet. These disruption events likely do not fully describe the level of distraction that the participants experienced. However, we captured more detailed subjective responses regarding distraction in the interviews, where participants reported that negative feedback was distracting. Future work could characterize the level of distraction caused by the thermal device in more detail using, for example, EEG (Thiruchselvam et al., 2011).
Additionally, the use of a recorded audience can be considered a limitation of our study. Since the audience was pre-recorded, their reactions were not necessarily aligned with the quality of each presentation. However, the recorded audience was a more controlled condition than a live audience. Since our study is the first to explore the communication of social signals with temperature in a group communication setting, we decided that the controlled condition was more appropriate. Also, the focus of our study was to explore the display of group-affective states, rather than the measurement of those states. Still, there is an opportunity for future research to implement our system in the wild to gain further understanding of how thermal feedback could be employed in real group communication. In such an in-the-wild experiment, it would also be interesting to investigate different methods of audience feedback, such as implicit sensing or periodic explicit responses, to see which paradigm best integrates with the thermal feedback.
Finally, the inability of participants to adapt their talks can be considered a limitation. Providing all participants with the same two topics established controlled experimental conditions, but future work may benefit from letting participants present topics they are familiar with, allowing them to adapt their talks. Exploring longer-format presentations, such as teaching, could also give participants more opportunity to adapt to the thermal feedback they receive.
6. Conclusion
Our research and the presented study provide the first experimental exploration of thermal feedback to communicate group affect in the context of hybrid presentations. We contribute empirically validated knowledge that informs designers of social-emotional feedback systems that use temperature as a modality. Our findings indicate that temperature can be an effective and usable way to communicate audience engagement to a presenter and increase their feeling of connection to the audience without increasing workload. Our research shows that personalization of the thermal feedback is crucial and that users can quickly learn an established mapping and to effectively use the system. In general, participants found positive (warm) feedback to be encouraging and useful while (cold) negative feedback was seen as distracting. Our findings lay the foundation for engineering thermal feedback systems and show that such systems have the potential to enhance socio-emotional connectedness in virtual and hybrid meetings, where users currently feel disconnected. Furthermore, our work is valuable for practitioners and researchers who aim to implicitly increase social connectedness through technology.
Acknowledgements.
This work was supported by the Bavarian Research Alliance association ForDigitHealth, by the European Union’s Horizon 2020 Programme under ERCEA grant no. 683008 AMPLIFY, and by the Munich Center for Machine Learning (MCML). We also want to thank Matt Smith from Embr Labs for showing an interest in our research and providing the Embr Wave bracelets for our study.References
- (1)
- Akazue et al. (2017) Moses Akazue, Martin Halvey, and Lynne Baillie. 2017. Using Thermal Stimuli to Enhance Photo-Sharing in Social Media. Proceedings of the ACM on Interactive, Mobile, Wearable and Ubiquitous Technologies 1, 2 (June 2017), 4:1–4:21. https://doi.org/10.1145/3090050
- Asbrock (2010) Frank Asbrock. 2010. Stereotypes of Social Groups in Germany in Terms of Warmth and Competence. Social Psychology 41, 2 (Jan. 2010), 76–81. https://doi.org/10.1027/1864-9335/a000011 Publisher: Hogrefe Publishing.
- Asch (1961) Solomon E. Asch. 1961. Forming Impressions of Personality. In Documents of Gestalt Psychology. University of California Press, Berkeley, 237–285. https://doi.org/10.1525/9780520313514-018
- Atroszko et al. (2014) Paweł Atroszko, Jacek Kowalczyk, and Joanna Trochimowicz. 2014. Cardiovascular Reactivity During Oral Presentation in Female Students. In Reviewed Proceedings of the Interdisciplinary Scientific International Conference for PhD students and assistants, Vol. 4. Quaere, Hradec Kralove, 997–1002.
- Bachrach et al. (2015) Asaf Bachrach, Yann Fontbonne, Coline Joufflineau, and José Luis Ulloa. 2015. Audience entrainment during live contemporary dance performance: physiological and cognitive measures. Frontiers in Human Neuroscience 9, 179 (2015), 13. https://doi.org/10.3389/fnhum.2015.00179 Publisher: Frontiers.
- Bakker et al. (2016) Saskia Bakker, Doris Hausen, and Ted Selker. 2016. Introduction: Framing Peripheral Interaction. In Peripheral Interaction: Challenges and Opportunities for HCI in the Periphery of Attention, Saskia Bakker, Doris Hausen, and Ted Selker (Eds.). Springer International Publishing, Cham, 1–10. https://doi.org/10.1007/978-3-319-29523-7_1
- Bakker (2013) S Saskia Bakker. 2013. Design for peripheral interaction. Doctoral Thesis. Technical University of Eindhoven, Eindhoven, Netherlands. https://research.tue.nl/en/publications/design-for-peripheral-interaction(2c04024d-c17b-4cdf-92cc-7fec452a6e4f).html Publisher: Technische Universiteit Eindhoven.
- Bartolome et al. (2020) Jorge David Iranzo Bartolome, Luis Cavazos Quero, Jundong Cho, and Sunggi Jo. 2020. Exploring Thermal Interaction for Visual Art Color Appreciation for the Visually Impaired People. In 2020 International Conference on Electronics, Information, and Communication (ICEIC). IEEE, Barcelona, Spain, 1–5. https://doi.org/10.1109/ICEIC49074.2020.9051245
- Bradley (1958) James V. Bradley. 1958. Complete Counterbalancing of Immediate Sequential Effects in a Latin Square Design. J. Amer. Statist. Assoc. 53, 282 (June 1958), 525–528. https://doi.org/10.1080/01621459.1958.10501456 Publisher: Taylor & Francis _eprint: https://www.tandfonline.com/doi/pdf/10.1080/01621459.1958.10501456.
- Brambilla et al. (2010) Marco Brambilla, Simona Sacchi, Federica Castellini, and Paola Riva. 2010. The Effects of Status on Perceived Warmth and Competence. Social Psychology 41, 2 (Jan. 2010), 82–87. https://doi.org/10.1027/1864-9335/a000012 Publisher: Hogrefe Publishing.
- Cooper et al. (2014) Ella A. Cooper, John Garlick, Eric Featherstone, Valerie Voon, Tania Singer, Hugo D. Critchley, and Neil A. Harrison. 2014. You Turn Me Cold: Evidence for Temperature Contagion. PLOS ONE 9, 12 (Dec. 2014), e116126. https://doi.org/10.1371/journal.pone.0116126 Publisher: Public Library of Science.
- Costa et al. (2016) Jean Costa, Alexander T. Adams, Malte F. Jung, François Guimbretière, and Tanzeem Choudhury. 2016. EmotionCheck: leveraging bodily signals and false feedback to regulate our emotions. In Proceedings of the 2016 ACM International Joint Conference on Pervasive and Ubiquitous Computing. ACM, Heidelberg Germany, 758–769. https://doi.org/10.1145/2971648.2971752
- Di Lascio et al. (2018) Elena Di Lascio, Shkurta Gashi, and Silvia Santini. 2018. Unobtrusive Assessment of Students’ Emotional Engagement during Lectures Using Electrodermal Activity Sensors. Proceedings of the ACM on Interactive, Mobile, Wearable and Ubiquitous Technologies 2, 3 (Sept. 2018), 103:1–103:21. https://doi.org/10.1145/3264913
- El Ali et al. (2020) Abdallah El Ali, Xingyu Yang, Swamy Ananthanarayan, Thomas Röggla, Jack Jansen, Jess Hartcher-O’Brien, Kaspar Jansen, and Pablo Cesar. 2020. ThermalWear: Exploring Wearable On-chest Thermal Displays to Augment Voice Messages with Affect. In Proceedings of the 2020 CHI Conference on Human Factors in Computing Systems (CHI ’20). Association for Computing Machinery, New York, NY, USA, 1–14. https://doi.org/10.1145/3313831.3376682
- Englebienne and Hung (2012) Gwenn Englebienne and Hayley Hung. 2012. Mining for motivation: using a single wearable accelerometer to detect people’s interests. In Proceedings of the 2nd ACM international workshop on Interactive multimedia on mobile and portable devices (IMMPD ’12). Association for Computing Machinery, New York, NY, USA, 23–26. https://doi.org/10.1145/2390821.2390829
- Fujii et al. (2018) Katsuya Fujii, Plivelic Marian, Dav Clark, Yoshi Okamoto, and Jun Rekimoto. 2018. Sync Class: Visualization System for In-Class Student Synchronization. In Proceedings of the 9th Augmented Human International Conference (AH ’18). Association for Computing Machinery, New York, NY, USA, 1–8. https://doi.org/10.1145/3174910.3174927
- Fujita and Nishimoto (2004) Hidenori Fujita and Kazushi Nishimoto. 2004. Lovelet: a heartwarming communication tool for intimate people by constantly conveying situation data. In Extended abstracts of the 2004 conference on Human factors and computing systems - CHI ’04. ACM Press, Vienna, Austria, 1553. https://doi.org/10.1145/985921.986129
- Garbarino et al. (2014) Maurizio Garbarino, Matteo Lai, Simone Tognetti, Rosalind Picard, and Daniel Bender. 2014. Empatica E3 - A wearable wireless multi-sensor device for real-time computerized biofeedback and data acquisition. In Proceedings of the 4th International Conference on Wireless Mobile Communication and Healthcare - ”Transforming healthcare through innovations in mobile and wireless technologies”. ICST, Athens, Greece, 39–42. https://doi.org/10.4108/icst.mobihealth.2014.257418
- Gashi et al. (2019) Shkurta Gashi, Elena Di Lascio, and Silvia Santini. 2019. Using Unobtrusive Wearable Sensors to Measure the Physiological Synchrony Between Presenters and Audience Members. Proceedings of the ACM on Interactive, Mobile, Wearable and Ubiquitous Technologies 3, 1 (March 2019), 13:1–13:19. https://doi.org/10.1145/3314400
- Genaro Motti and Caine (2015) Vivian Genaro Motti and Kelly Caine. 2015. An overview of wearable applications for healthcare: requirements and challenges. In Adjunct Proceedings of the 2015 ACM International Joint Conference on Pervasive and Ubiquitous Computing and Proceedings of the 2015 ACM International Symposium on Wearable Computers (UbiComp/ISWC’15 Adjunct). Association for Computing Machinery, New York, NY, USA, 635–641. https://doi.org/10.1145/2800835.2809436
- Gradl et al. (2019) Stefan Gradl, Markus Wirth, Robert Richer, Nicolas Rohleder, and Bjoern M. Eskofier. 2019. An Overview of the Feasibility of Permanent, Real-Time, Unobtrusive Stress Measurement with Current Wearables. In Proceedings of the 13th EAI International Conference on Pervasive Computing Technologies for Healthcare (PervasiveHealth’19). Association for Computing Machinery, New York, NY, USA, 360–365. https://doi.org/10.1145/3329189.3329233
- Graydon and Eysenck (1989) Jan Graydon and Michael W. Eysenck. 1989. Distraction and cognitive performance. European Journal of Cognitive Psychology 1, 2 (June 1989), 161–179. https://doi.org/10.1080/09541448908403078
- Hart (2006) Sandra G. Hart. 2006. Nasa-Task Load Index (NASA-TLX); 20 Years Later. Proceedings of the Human Factors and Ergonomics Society Annual Meeting 50, 9 (Oct. 2006), 904–908. https://doi.org/10.1177/154193120605000909 Publisher: SAGE Publications Inc.
- Hart and Staveland (1988) Sandra G. Hart and Lowell E. Staveland. 1988. Development of NASA-TLX (Task Load Index): Results of Empirical and Theoretical Research. In Advances in Psychology, Peter A. Hancock and Najmedin Meshkati (Eds.). Human Mental Workload, Vol. 52. North-Holland, Amsterdam, 139–183. https://doi.org/10.1016/S0166-4115(08)62386-9
- Hassenzahl et al. (2003) Marc Hassenzahl, Michael Burmester, and Franz Koller. 2003. AttrakDiff: Ein Fragebogen zur Messung wahrgenommener hedonischer und pragmatischer Qualität. In Mensch & Computer 2003: Interaktion in Bewegung, Gerd Szwillus and Jürgen Ziegler (Eds.). Vieweg+Teubner Verlag, Wiesbaden, 187–196. https://doi.org/10.1007/978-3-322-80058-9_19
- Hassib et al. (2017) Mariam Hassib, Stefan Schneegass, Philipp Eiglsperger, Niels Henze, Albrecht Schmidt, and Florian Alt. 2017. EngageMeter: A System for Implicit Audience Engagement Sensing Using Electroencephalography. In Proceedings of the 2017 CHI Conference on Human Factors in Computing Systems (CHI ’17). ACM, New York, NY, USA, 5114–5119. https://doi.org/10.1145/3025453.3025669 event-place: Denver, Colorado, USA.
- Hassib et al. (2018) Mariam Hassib, Stefan Schneegass, Niels Henze, Albrecht Schmidt, and Florian Alt. 2018. A Design Space for Audience Sensing and Feedback Systems. In Extended Abstracts of the 2018 CHI Conference on Human Factors in Computing Systems (CHI EA ’18). Association for Computing Machinery, New York, NY, USA, 1–6. https://doi.org/10.1145/3170427.3188569
- Hausen (2012) Doris Hausen. 2012. Peripheral interaction: facilitating interaction with secondary tasks. In Proceedings of the Sixth International Conference on Tangible, Embedded and Embodied Interaction (TEI ’12). Association for Computing Machinery, Kingston, Ontario, Canada, 387–388. https://doi.org/10.1145/2148131.2148227
- Hausen et al. (2014) Doris Hausen, Sebastian Loehmann, and Marie Lehmann. 2014. Everyday peripheral tasks vs. digital peripheral tasks. In CHI ’14 Extended Abstracts on Human Factors in Computing Systems (CHI EA ’14). Association for Computing Machinery, New York, NY, USA, 2545–2550. https://doi.org/10.1145/2559206.2581271
- Hernandez et al. (2013) Javier Hernandez, Zicheng Liu, Geoff Hulten, Dave DeBarr, Kyle Krum, and Zhengyou Zhang. 2013. Measuring the engagement level of TV viewers. In 2013 10th IEEE International Conference and Workshops on Automatic Face and Gesture Recognition (FG). IEEE, Shanghai, China, 1–7. https://doi.org/10.1109/FG.2013.6553742
- Hook et al. (2008) Julie N. Hook, Clifford A. Smith, and David P. Valentiner. 2008. A short-form of the Personal Report of Confidence as a Speaker. Personality and Individual Differences 44, 6 (April 2008), 1306–1313. https://doi.org/10.1016/j.paid.2007.11.021
- IJzerman et al. (2012) Hans IJzerman, Marcello Gallucci, Wim T. J. L. Pouw, Sophia C. Weissgerber, Niels J. Van Doesum, and Kipling D. Williams. 2012. Cold-blooded loneliness: Social exclusion leads to lower skin temperatures. Acta Psychologica 140, 3 (July 2012), 283–288. https://doi.org/10.1016/j.actpsy.2012.05.002
- IJzerman et al. (2014) Hans IJzerman, Angela K. y. Leung, and Lay See Ong. 2014. Perceptual symbols of creativity: Coldness elicits referential, warmth elicits relational creativity. Acta Psychologica 148 (May 2014), 136–147. https://doi.org/10.1016/j.actpsy.2014.01.013
- IJzerman and Semin (2009) Hans IJzerman and Gün R. Semin. 2009. The Thermometer of Social Relations: Mapping Social Proximity on Temperature. Psychological Science 20, 10 (Oct. 2009), 1214–1220. https://doi.org/10.1111/j.1467-9280.2009.02434.x Publisher: SAGE Publications Inc.
- IJzerman and Semin (2010) Hans IJzerman and Gün R. Semin. 2010. Temperature perceptions as a ground for social proximity. Journal of Experimental Social Psychology 46, 6 (Nov. 2010), 867–873. https://doi.org/10.1016/j.jesp.2010.07.015
- Jaimovich et al. (2010) J. Jaimovich, Niall Coghlan, and R. Benjamin Knapp. 2010. Contagion of Physiological Correlates of Emotion between Performer and Audience: An Exploratory Study. In Bio-inspired Human-Machine Interfaces and Healthcare Applications. BIOSTEC, Valencia, Spain, 67–74. https://eprints.dkit.ie/275/
- Ju and Leifer (2008) Wendy Ju and Larry Leifer. 2008. The Design of Implicit Interactions: Making Interactive Systems Less Obnoxious. Design Issues 24, 3 (July 2008), 72–84. https://doi.org/10.1162/desi.2008.24.3.72
- Jungwirth et al. (2018) Florian Jungwirth, Michael Haslgrübler, Michaela Murauer, Benedikt Gollan, Pratheeban Elancheliyan, and Alois Ferscha. 2018. EyeControl: Towards Unconstrained Eye Tracking in Industrial Environments. In Proceedings of the Symposium on Spatial User Interaction (SUI ’18). Association for Computing Machinery, New York, NY, USA, 177. https://doi.org/10.1145/3267782.3274673
- Kappers and Plaisier (2019) Astrid Maria Louise Kappers and Myrthe A. Plaisier. 2019. Thermal Perception and Thermal Devices Used on Body Parts Other Than Hand or Face. IEEE Transactions on Haptics 12, 4 (Oct. 2019), 386–399. https://doi.org/10.1109/TOH.2019.2925339 Conference Name: IEEE Transactions on Haptics.
- Kassner et al. (2014) Moritz Kassner, William Patera, and Andreas Bulling. 2014. Pupil: an open source platform for pervasive eye tracking and mobile gaze-based interaction. In Proceedings of the 2014 ACM International Joint Conference on Pervasive and Ubiquitous Computing: Adjunct Publication (UbiComp ’14 Adjunct). Association for Computing Machinery, New York, NY, USA, 1151–1160. https://doi.org/10.1145/2638728.2641695
- Kim and Lee (2009) Hyunjung Kim and Woohun Lee. 2009. Designing unobtrusive interfaces with minimal presence. In CHI ’09 Extended Abstracts on Human Factors in Computing Systems. Association for Computing Machinery, New York, NY, USA, 3673–3678. http://doi.org/10.1145/1520340.1520553
- Kim et al. (2019) Seungwon Kim, Mark Billinghurst, Gun Lee, Mitchell Norman, Weidong Huang, and Jian He. 2019. Sharing Emotion by Displaying a Partner Near the Gaze Point in a Telepresence System. In 2019 23rd International Conference in Information Visualization – Part II. IEEE, Adelaide, SA, Australia, 86–91. https://doi.org/10.1109/IV-2.2019.00026
- Kiss and Schmidt (2019) Francisco Kiss and Albrecht Schmidt. 2019. Stressed by Design? The Problems of Transferring Interaction Design from Workstations to Mobile Interfaces. In Proceedings of the 13th EAI International Conference on Pervasive Computing Technologies for Healthcare (PervasiveHealth’19). Association for Computing Machinery, New York, NY, USA, 377–382. https://doi.org/10.1145/3329189.3329232
- Knapp et al. (2013) Mark L. Knapp, Judith A. Hall, and Terrence G. Horgan. 2013. Nonverbal Communication in Human Interaction. Cengage Learning, Boston, MA, USA. Google-Books-ID: rWoWAAAAQBAJ.
- Konvalinka et al. (2011) Ivana Konvalinka, Dimitris Xygalatas, Joseph Bulbulia, Uffe Schjødt, Else-Marie Jegindø, Sebastian Wallot, Guy Van Orden, and Andreas Roepstorff. 2011. Synchronized arousal between performers and related spectators in a fire-walking ritual. Proceedings of the National Academy of Sciences 108, 20 (May 2011), 8514–8519. https://doi.org/10.1073/pnas.1016955108 Publisher: National Academy of Sciences Section: Biological Sciences.
- Kormi-Nouri et al. (2005) Reza Kormi-Nouri, Lars-Göran Nilsson, and Nobuo Ohta. 2005. The novelty effect: Support for the Novelty-Encoding Hypothesis. Scandinavian Journal of Psychology 46, 2 (2005), 133–143. https://doi.org/10.1111/j.1467-9450.2005.00443.x _eprint: https://onlinelibrary.wiley.com/doi/pdf/10.1111/j.1467-9450.2005.00443.x.
- Lakoff and Johnson (1999) George Lakoff and Mark Johnson. 1999. Philosophy in the flesh: The embodied mind and its challenge to western thought. Vol. 640. Basic books New York, New York, NY, USA.
- Latulipe et al. (2011) Celine Latulipe, Erin A. Carroll, and Danielle Lottridge. 2011. Love, hate, arousal and engagement: exploring audience responses to performing arts. In Proceedings of the SIGCHI Conference on Human Factors in Computing Systems. Association for Computing Machinery, New York, NY, USA, 1845–1854. http://doi.org/10.1145/1978942.1979210
- Lavie (2005) Nilli Lavie. 2005. Distracted and confused?: selective attention under load. Trends in Cognitive Sciences 9, 2 (Feb. 2005), 75–82. https://doi.org/10.1016/j.tics.2004.12.004
- Ledzińska and Postek (2017) Maria Ledzińska and Sławomir Postek. 2017. From metaphorical information overflow and overload to real stress: Theoretical background, empirical findings, and applications. European Management Journal 35, 6 (Dec. 2017), 785–793. https://doi.org/10.1016/j.emj.2017.07.002
- Lee and Lim (2010) Wonjun Lee and Youn-kyung Lim. 2010. Thermo-message: exploring the potential of heat as a modality of peripheral expression. In CHI ’10 Extended Abstracts on Human Factors in Computing Systems (CHI EA ’10). Association for Computing Machinery, New York, NY, USA, 4231–4236. https://doi.org/10.1145/1753846.1754131
- Lietz et al. (2019) Rebecca Lietz, Meaghan Harraghy, James Brady, Diane Calderon, Joe Cloud, and Fillia Makedon. 2019. A wearable system for unobtrusive mood detection. In Proceedings of the 12th ACM International Conference on PErvasive Technologies Related to Assistive Environments (PETRA ’19). Association for Computing Machinery, New York, NY, USA, 329–330. https://doi.org/10.1145/3316782.3322743
- Maeda and Kurahashi (2019) Tomosuke Maeda and Tetsuo Kurahashi. 2019. TherModule: Wearable and Modular Thermal Feedback System Based on a Wireless Platform. In Proceedings of the 10th Augmented Human International Conference 2019 (AH2019). ACM, New York, NY, USA, 14:1–14:8. https://doi.org/10.1145/3311823.3311826 event-place: Reims, France.
- Martella et al. (2015) Claudio Martella, Ekin Gedik, Laura Cabrera-Quiros, Gwenn Englebienne, and Hayley Hung. 2015. How Was It? Exploiting Smartphone Sensing to Measure Implicit Audience Responses to Live Performances. In Proceedings of the 23rd ACM international conference on Multimedia (MM ’15). Association for Computing Machinery, New York, NY, USA, 201–210. https://doi.org/10.1145/2733373.2806276
- Merz et al. (2019) Christian Josef Merz, Bianca Hagedorn, and Oliver Tobias Wolf. 2019. An oral presentation causes stress and memory impairments. Psychoneuroendocrinology 104 (June 2019), 1–6. https://doi.org/10.1016/j.psyneuen.2019.02.010
- Murali et al. (2021) Prasanth Murali, Javier Hernandez, Daniel McDuff, Kael Rowan, Jina Suh, and Mary Czerwinski. 2021. AffectiveSpotlight: Facilitating the Communication of Affective Responses from Audience Members during Online Presentations. In Proceedings of the 2021 CHI Conference on Human Factors in Computing Systems. Association for Computing Machinery, New York, NY, USA, 1–13. http://doi.org/10.1145/3411764.3445235
- Nasser et al. (2019) Arshad Nasser, Kening Zhu, and Sarah Wiseman. 2019. Thermo-haptic Earable Display for the Hearing and Visually Impaired. In The 21st International ACM SIGACCESS Conference on Computers and Accessibility (ASSETS ’19). Association for Computing Machinery, New York, NY, USA, 630–632. https://doi.org/10.1145/3308561.3354636
- Niedenthal et al. (2005) Paula M. Niedenthal, Lawrence W. Barsalou, Piotr Winkielman, Silvia Krauth-Gruber, and François Ric. 2005. Embodiment in Attitudes, Social Perception, and Emotion. Personality and Social Psychology Review 9, 3 (Aug. 2005), 184–211. https://doi.org/10.1207/s15327957pspr0903_1 Publisher: SAGE Publications Inc.
- Piumsomboon et al. (2017) Thammathip Piumsomboon, Youngho Lee, Gun A. Lee, Arindam Dey, and Mark Billinghurst. 2017. Empathic Mixed Reality: Sharing What You Feel and Interacting with What You See. In 2017 International Symposium on Ubiquitous Virtual Reality (ISUVR). IEEE, Nara, Japan, 38–41. https://doi.org/10.1109/ISUVR.2017.20
- Poguntke et al. (2019) Romina Poguntke, Jonathan Ilk, Albrecht Schmidt, and Yomna Abdelrahman. 2019. Designing Thermal Feedback for Notifying Users About Stress. In Proceedings of the 13th EAI International Conference on Pervasive Computing Technologies for Healthcare - Demos and Posters. EAI, Trento, Italy, 5\. https://doi.org/10.4108/eai.20-5-2019.2283340
- Poguntke et al. (2018) Romina Poguntke, Francisco Kiss, Ayhan Kaplan, Albrecht Schmidt, and Stefan Schneegass. 2018. RainSense: exploring the concept of a sense for weather awareness. In Proceedings of the 20th International Conference on Human-Computer Interaction with Mobile Devices and Services Adjunct (MobileHCI ’18). Association for Computing Machinery, New York, NY, USA, 9–15. https://doi.org/10.1145/3236112.3236114
- Raudanjoki et al. (2020) Özge Raudanjoki, Jonna Häkkilä, Kuisma Hurtig, and Ashley Colley. 2020. Perceptions of human shadow manipulation as an ambient display. In Proceedings of the 9TH ACM International Symposium on Pervasive Displays (PerDis ’20). Association for Computing Machinery, New York, NY, USA, 71–77. https://doi.org/10.1145/3393712.3395180
- Reichherzer et al. (2021) Carolin Reichherzer, Andrew Cunningham, Tracey Coleman, Ruochen Cao, Kurt McManus, Dion Sheppard, Mark Kohler, Mark Billinghurst, and Bruce H Thomas. 2021. Bringing the Jury to the Scene of the Crime: Memory and Decision-Making in a Simulated Crime Scene. In Proceedings of the 2021 CHI Conference on Human Factors in Computing Systems. Association for Computing Machinery, New York, NY, USA, 1–12. https://doi.org/10.1145/3411764.3445464
- Rekimoto (2001) J. Rekimoto. 2001. GestureWrist and GesturePad: unobtrusive wearable interaction devices. In Proceedings Fifth International Symposium on Wearable Computers. IEEE, Zurich, Switzerland, 21–27. https://doi.org/10.1109/ISWC.2001.962092 ISSN: 1530-0811.
- Rivera-Pelayo et al. (2013) Verónica Rivera-Pelayo, Johannes Munk, Valentin Zacharias, and Simone Braun. 2013. Live interest meter: learning from quantified feedback in mass lectures. In Proceedings of the Third International Conference on Learning Analytics and Knowledge - LAK ’13. ACM Press, Leuven, Belgium, 23. https://doi.org/10.1145/2460296.2460302
- Saatçi et al. (2019) Banu Saatçi, Roman Rädle, Sean Rintel, Kenton O’Hara, and Clemens Nylandsted Klokmose. 2019. Hybrid Meetings in the Modern Workplace: Stories of Success and Failure. In Collaboration Technologies and Social Computing (Lecture Notes in Computer Science). Springer International Publishing, Cham, 45–61. https://doi.org/10.1007/978-3-030-28011-6_4
- Santini et al. (2018) Thiago Santini, Hanna Brinkmann, Luise Reitstätter, Helmut Leder, Raphael Rosenberg, Wolfgang Rosenstiel, and Enkelejda Kasneci. 2018. The art of pervasive eye tracking: unconstrained eye tracking in the Austrian Gallery Belvedere. In Proceedings of the 7th Workshop on Pervasive Eye Tracking and Mobile Eye-Based Interaction (PETMEI ’18). Association for Computing Machinery, New York, NY, USA, 1–8. https://doi.org/10.1145/3208031.3208032
- Serim and Jacucci (2019) Barış Serim and Giulio Jacucci. 2019. Explicating ”Implicit Interaction”: An Examination of the Concept and Challenges for Research. In Proceedings of the 2019 CHI Conference on Human Factors in Computing Systems. Association for Computing Machinery, New York, NY, USA, 1–16. http://doi.org/10.1145/3290605.3300647
- Smith et al. (2017) Matthew J. Smith, Kristen Warren, David Cohen-Tanugi, Sam Shames, Kelly Sprehn, Jana L. Schwartz, Hui Zhang, and Ed Arens. 2017. Augmenting Smart Buildings and Autonomous Vehicles with Wearable Thermal Technology. In Human-Computer Interaction. Interaction Contexts (Lecture Notes in Computer Science), Masaaki Kurosu (Ed.). Springer International Publishing, Cham, 550–561. https://doi.org/10.1007/978-3-319-58077-7_44
- Song et al. (2015) Sunghyun Song, Geeyoung Noh, Junwoo Yoo, Ian Oakley, Jundong Cho, and Andrea Bianchi. 2015. Hot & Tight: Exploring Thermo and Squeeze Cues Recognition on Wrist Wearables. In Proceedings of the 2015 ACM International Symposium on Wearable Computers (ISWC ’15). ACM, New York, NY, USA, 39–42. https://doi.org/10.1145/2802083.2802092 event-place: Osaka, Japan.
- Stevens et al. (2007) Catherine Stevens, Renee Glass, Emery Schubert, Johnson Chen, and Heather Winskel. 2007. Methods for Measuring Audience Reactions. In Proceedings of the inaugural International Conference on Music Communication Science. ARC Research Network in Human Communication Science (HCSNet), Sydney, Australia, 155–158.
- Ströckl et al. (2020) Daniela Ströckl, Elena Oberrauner, Daniela Krainer, Lukas Wohofsky, and Johannes Oberzaucher. 2020. Hedonic and Pragmatic Qualities of AAL Pilot Region Technologies: Evaluation with the AttrakDiff Survey:. In Proceedings of the 6th International Conference on Information and Communication Technologies for Ageing Well and e-Health. SCITEPRESS - Science and Technology Publications, Prague, Czech Republic, 187–193. https://doi.org/10.5220/0009575701870193
- Suen et al. (2021) Wing Sze Suen, Guanghan Huang, Zhanxiao Kang, Yuheng Gu, Jintu Fan, and Dahua Shou. 2021. Development of wearable air-conditioned mask for personal thermal management. Building and Environment 205 (Nov. 2021), 108236. https://doi.org/10.1016/j.buildenv.2021.108236
- Tewell et al. (2017) Jordan Tewell, Jon Bird, and George R. Buchanan. 2017. The Heat is On: A Temperature Display for Conveying Affective Feedback. In Proceedings of the 2017 CHI Conference on Human Factors in Computing Systems (CHI ’17). Association for Computing Machinery, New York, NY, USA, 1756–1767. https://doi.org/10.1145/3025453.3025844
- Tewell (2018) J. R. Tewell. 2018. Augmenting communication technologies with non-primary sensory modalities. Ph.D. City, University of London. https://openaccess.city.ac.uk/id/eprint/20153/ Accepted: 2018.
- Thiruchselvam et al. (2011) Ravi Thiruchselvam, Jens Blechert, Gal Sheppes, Anders Rydstrom, and James J. Gross. 2011. The temporal dynamics of emotion regulation: An EEG study of distraction and reappraisal. Biological Psychology 87, 1 (April 2011), 84–92. https://doi.org/10.1016/j.biopsycho.2011.02.009
- Thomée et al. (2007) Sara Thomée, Mats Eklöf, Ewa Gustafsson, Ralph Nilsson, and Mats Hagberg. 2007. Prevalence of perceived stress, symptoms of depression and sleep disturbances in relation to information and communication technology (ICT) use among young adults – an explorative prospective study. Computers in Human Behavior 23, 3 (May 2007), 1300–1321. https://doi.org/10.1016/j.chb.2004.12.007
- Umair et al. (2021) Muhammad Umair, Corina Sas, Niaz Chalabianloo, and Cem Ersoy. 2021. Exploring Personalized Vibrotactile and Thermal Patterns for Affect Regulation. In Designing Interactive Systems Conference 2021. ACM, Virtual, 24.
- Umair et al. (2019) Muhammad Umair, Corina Sas, and Muhammad Hamza Latif. 2019. Towards Affective Chronometry: Exploring Smart Materials and Actuators for Real-time Representations of Changes in Arousal. In Proceedings of the 2019 on Designing Interactive Systems Conference (DIS ’19). Association for Computing Machinery, New York, NY, USA, 1479–1494. https://doi.org/10.1145/3322276.3322367
- van Dijk (2022) Jelle van Dijk. 2022. Zooming in on embodied social sensemaking: Mapping the design space in the context of videoconferencing. In Sixteenth International Conference on Tangible, Embedded, and Embodied Interaction (TEI ’22). Association for Computing Machinery, New York, NY, USA, 1–10. https://doi.org/10.1145/3490149.3501324
- Weiser and Brown (1997) Mark Weiser and John Seely Brown. 1997. The Coming Age of Calm Technology. In Beyond Calculation: The Next Fifty Years of Computing, Peter J. Denning and Robert M. Metcalfe (Eds.). Springer, New York, NY, 75–85. https://doi.org/10.1007/978-1-4612-0685-9_6
- Wettach et al. (2007) Reto Wettach, Christian Behrens, Adam Danielsson, and Thomas Ness. 2007. A thermal information display for mobile applications. In Proceedings of the 9th international conference on Human computer interaction with mobile devices and services (MobileHCI ’07). Association for Computing Machinery, New York, NY, USA, 182–185. https://doi.org/10.1145/1377999.1378004
- Williams and Bargh (2008) Lawrence E. Williams and John A. Bargh. 2008. Experiencing Physical Warmth Promotes Interpersonal Warmth. Science 322, 5901 (Oct. 2008), 606–607. https://doi.org/10.1126/science.1162548 Publisher: American Association for the Advancement of Science Section: Report.
- Wilson et al. (2012) Graham Wilson, Stephen Brewster, Martin Halvey, and Stephen Hughes. 2012. Thermal icons: evaluating structured thermal feedback for mobile interaction. In Proceedings of the 14th international conference on Human-computer interaction with mobile devices and services (MobileHCI ’12). Association for Computing Machinery, New York, NY, USA, 309–312. https://doi.org/10.1145/2371574.2371621
- Wilson et al. (2015) Graham Wilson, Gavin Davidson, and Stephen A. Brewster. 2015. In the Heat of the Moment: Subjective Interpretations of Thermal Feedback During Interaction. In Proceedings of the 33rd Annual ACM Conference on Human Factors in Computing Systems (CHI ’15). Association for Computing Machinery, New York, NY, USA, 2063–2072. https://doi.org/10.1145/2702123.2702219
- Wilson et al. (2016) Graham Wilson, Dobromir Dobrev, and Stephen A. Brewster. 2016. Hot Under the Collar: Mapping Thermal Feedback to Dimensional Models of Emotion. In Proceedings of the 2016 CHI Conference on Human Factors in Computing Systems. Association for Computing Machinery, New York, NY, USA, 4838–4849. http://doi.org/10.1145/2858036.2858205
- Wilson et al. (2011) Graham Wilson, Martin Halvey, Stephen A. Brewster, and Stephen A. Hughes. 2011. Some like it hot: thermal feedback for mobile devices. In Proceedings of the SIGCHI Conference on Human Factors in Computing Systems (CHI ’11). Association for Computing Machinery, New York, NY, USA, 2555–2564. https://doi.org/10.1145/1978942.1979316
- Zhang et al. (2014) John R. Zhang, Jason Sherwin, Jacek Dmochowski, Paul Sajda, and John R. Kender. 2014. Correlating Speaker Gestures in Political Debates with Audience Engagement Measured via EEG. In Proceedings of the 22nd ACM international conference on Multimedia (MM ’14). Association for Computing Machinery, New York, NY, USA, 387–396. https://doi.org/10.1145/2647868.2654909
- Zheng et al. (2014) Ya-Li Zheng, Xiao-Rong Ding, Carmen Chung Yan Poon, Benny Ping Lai Lo, Heye Zhang, Xiao-Lin Zhou, Guang-Zhong Yang, Ni Zhao, and Yuan-Ting Zhang. 2014. Unobtrusive Sensing and Wearable Devices for Health Informatics. IEEE Transactions on Biomedical Engineering 61, 5 (May 2014), 1538–1554. https://doi.org/10.1109/TBME.2014.2309951 Conference Name: IEEE Transactions on Biomedical Engineering.
- Zhong and Leonardelli (2008) Chen-Bo Zhong and Geoffrey J. Leonardelli. 2008. Cold and Lonely: Does Social Exclusion Literally Feel Cold? Psychological Science 19, 9 (Sept. 2008), 838–842. https://doi.org/10.1111/j.1467-9280.2008.02165.x Publisher: SAGE Publications Inc.
- Zhu et al. (2019) Kening Zhu, Simon Perrault, Taizhou Chen, Shaoyu Cai, and Roshan Lalintha Peiris. 2019. A sense of ice and fire: Exploring thermal feedback with multiple thermoelectric-cooling elements on a smart ring. International Journal of Human-Computer Studies 130 (Oct. 2019), 234–247. https://doi.org/10.1016/j.ijhcs.2019.07.003