Redshift evolution of the dark matter haloes shapes
Abstract
In this work, we aim at investigating the morphology evolution of Milky Way mass-like dark matter haloes selected from the cielo and IllustrisTNG Projects. The connection between halo shapes and their environment has been studied in previous works at z=0 but their connection remains yet to be fully understood. We focus on the evolution across cosmic time of the halo shapes and the relation with the infalling material, using hydrodynamical simulations. Our findings show that haloes tend to be more triaxial at earlier times as a consequence of stronger accretion in the direction of the filaments. As the haloes evolve towards a dominant isotropic accretion mode and relaxation, their shape at 20 percent of the virial mass becomes more spherical. In agreement with previous results, baryons have an important effect within the inner regions of the haloes, driving them from triaxial to rounder shapes. We also find a correlation between the strength of the quadrupole infalling mode and the degree of ellipticity of the haloes: as the filament strength decreases steadily with redshift, the haloes became more spherical and less elliptical.
keywords:
galaxies: clusters: general - galaxies: haloes - cosmology: theory - dark matter - methods: numerical1 Introduction
In the current cosmological paradigm -CDM model, dark matter (DM) and dark energy are the main ingredients that drive the formation and evolution of cosmic structures. In particular, DM haloes grow hierarchically and continuously by successive mergers and accretion (Zel’dovich, 1970), embedded within the filamentary structures of the cosmic web (e.g. White & Rees, 1978; Peebles, 1980; Ghigna et al., 1998; Springel et al., 2008).
The characteristic structures of DM haloes have been studied extensively using cosmological simulations. Early N-body simulations show that DM haloes can be described by a universal radial density profile (NFW, Navarro et al. 1997), while their shape tends to be triaxial and prolate in the inner regions (e.g. Frenk et al., 1988; Jing & Suto, 2002; Allgood, 2005; Stadel et al., 2009). Cosmological hydrodynamical simulations, which account for the DM assembly together with galaxy formation have proved to be of great help to investigate the impact of baryons on different properties of the haloes (Tissera et al., 2010). In fact, baryons and the physics processes associated to their evolution can modify the shape of DM haloes sphericalizing them (Tissera & Dominguez-Tenreiro, 1998; Kazantzidis et al., 2004; Zemp et al., 2012; Zhu et al., 2017; Chua et al., 2019; Cataldi et al., 2020), change the distribution of the DM in the inner regions (Governato et al., 2012; Di Cintio et al., 2014; Artale et al., 2019) and change their specific angular momentum (Pedrosa et al., 2010; Zavala et al., 2016; Lagos et al., 2017).
Regarding the mass density profile, Tollet et al. (2016) investigated the properties of haloes with virial masses in the range of , finding that in the central regions of the halo, the inner DM density slope depends on the stellar-to-halo mass ratio at all analysed redshifts, in agreement with Di Cintio et al. (2014) which investigate this dependence at .
More recently, Artale et al. (2019), inspecting the mass accretion history (MAH) of the DM haloes selected from a cosmological hydrodynamical simulation, showed that they assemble earlier that their dark matter only (DMo) counterparts. This change in formation history was explained since baryons make haloes more concentrated and in turn more massive than their DMo counterparts, reporting a close connection between the MAH, the amount of baryons, and the evolution of the DM density profiles.
The spherical collapse and gaussian random fields model of halo formation (Press & Schechter, 1974) needs a extending as the mass accretion on the haloes falls along a preferential direction (mostly along the filaments Zel’dovich, 1970) and tends to be clumpy. Given this preferential direction in the accretion along filaments, DM haloes show mostly non-spherical symmetry, especially if their relaxation times are no larger than the time between mergers or accretion events. In contrast, early-formed objects were weakly connected to their environment and were highly relaxed (Gouin et al., 2021).
Ludlow et al. (2014) and Bonamigo et al. (2015) studying DMo simulations, used the dimensionless parameter peak height, , to characterise the shape of haloes within a wide range of masses and redshifts. They found that DM haloes are triaxial with a tendency to be prolate. In particular, more massive objects are less spherical than low mass haloes, essentially because high mass haloes formed later on (Despali et al., 2017). This increase in triaxiality, correlates both with mass and with redshift because haloes seem to be affected by the direction of the last major merger accreted along the filaments around them (Jing & Suto, 2002; Allgood, 2005; Vega-Ferrero et al., 2017). Following the same approach as Bonamigo et al. (2015), Vega-Ferrero et al. (2017) found that minor-to-major axis ratio can be expressed by a universal function in terms of .
It has been reported (Oguri et al., 2005; Giocoli et al., 2012a, b; Wojtak, 2013; Lau et al., 2021) a close connection between the triaxiality of DM haloes and the cluster mass and concentration and the inner slope of the DM density profile, with consequences on the strong lensing cross-sections. Satellite galaxies are preferentially accreted along filaments (Libeskind et al., 2014; Tempel et al., 2015). Because infall is driven by the surrounding large-scale structure, we expect a significant correlation between the halo shapes and their environment (Vera-Ciro et al., 2011, reference within). Governato et al. (2012) found that haloes tend to point their minor axes perpendicular to the infall (filament) direction. Additionally, subhalos are predominantly accreted along the major axis of the host halo, and the alignment increases with the host halo mass (Kang & Wang, 2015).
At later times the cross-section of the filaments becomes larger than the typical size of the MW-mass haloes and, as a result, accretion turns more isotropic and the objects evolve into a more oblate configuration. Interestingly, haloes retain memory of their structure at earlier times (Vera-Ciro et al., 2011). This is imprinted in their present-day shape dependency with radius, which changes from typically prolate in the inner (earlier collapsed) regions to a triaxial in the outskirts (corresponding to the shells that have last collapsed and are now at about the virial radius).
In the case of MW-like galaxies, Shao et al. (2021) investigated how the disc of satellite galaxies can be used to infer the orientation and some aspects of the formation history of the Galactic DM halo, using the EAGLE simulation. These authors found that the normal to the common orbital plane of satellites, as well as the central stellar disc, is well aligned with the minor axis of the DM host halo. Also, Shao et al. (2021) found that the DM halo of each of their MW-analogue is "twisted" such that the orientation of the outer halo is perpendicular to that of the inner halo. This occurs because the inner halo is aligned with the central disc, whereas the outer halo is nearly perpendicular to the stellar disc, with a tight alignment towards the filamentary network along which mass is accreted .
Observational studies based on using X-ray data (Fabricant et al., 1984; Buote & Canizares, 1996; Kawahara, 2010; Lau et al., 2013), Sunyaev Zel’dovich (Sayers et al., 2011) and strong and weak gravitational lensing methods (Soucail et al., 1987; Evans & Bridle, 2009; Oguri et al., 2010; Oguri et al., 2012) indicate that cluster-size DM haloes are often not spherical. However, the observational determination of the shapes of DM haloes is quite challenging. Few studies attempted to infer the shape and orientation of the galactic DM halo. Preferably dynamical tracers at large radii are to be used, in which many cases, by definition are rare (Vera-Ciro et al., 2011). Dynamical tracers such as kinematics and morphology of the HI layer have been used to impose constraints on the halo morphology (Becquaert & Combes, 1997; Swaters et al., 1997), also the temperature profile of X-ray isophotes (Buote & Canizares, 1998; Buote et al., 2002), gravitational lensing (Hoekstra et al., 2004) and the spatial distribution of galaxies within groups (Paz et al., 2006; Robotham et al., 2008). The general trend of all these studies is that haloes tend to be roughly oblate, with the smallest axis pointing perpendicular to the symmetry plane defined by the stellar component.
In the case of the MW, the shape constraints often rely on the kinematics of stars, which include the proper motions of hypervelocity stars (Gnedin et al., 2005) or the dynamics of stellar streams (Koposov et al., 2010). These studies show a nearly spherical Galactic halo (Ibata et al., 2001; Law et al., 2005, 2009; Law & Majewski, 2010; Bovy et al., 2016; Malhan & Ibata, 2019), in agreement with numerical studies (e.g. Chua et al., 2019; Cataldi et al., 2020).
Studying the shape, the MAH and the concentration of haloes provides an opportunity to learn about individual growth histories and the connection between them and the properties of their host galaxy. (Drakos et al., 2019). Measurements of structural properties for large, well-defined samples of haloes may also provide new cosmological tests (see e.g. Taylor, 2011, for discussion).
In this paper, we use a set of haloes identified from the cielo and IllustrisTNG projects to deepen the impact of different sub-grid models and different cosmic environments might have on the DM halo morphologies. These results extend and strengthen previous studies on halo shapes (Cataldi et al., 2020; Cataldi et al., 2022), by including now the temporal evolution of the analysed properties.
The paper is structured as follows. Section 2 reviews the simulations setup and sample selection. Section 3 presents the results on the evolution of DM structure divided into: subsection 3.1 focuses on analyzing the mass accretion history and halo size evolution, subsection 3.2 analyze the shape profiles evolution and their dependence with merger events, and subsection 3.3 studies the impact of the infall matter configurations on the shape analysis. Finally, conclusions are summarized in Section 4.
2 Simulations
Here we use two simulation suites, namely the cielo and IllustrisTNG (Nelson et al., 2019) simulations which were run with different prescriptions for the baryonic processes involved in galaxy formation. We summarize the main features of each case.
2.0.1 cielo simulations
The Chemo-dynamIcal propertiEs of gaLaxies and the cOsmic web, cielo, is a project aimed to study the formation of galaxies in different environments, with virial mass haloes within the range (Rodríguez et al., 2022). It also includes two Local Group (LG) analogues. The cielo simulations assume a -CDM universe model with a cosmology consistent with Planck Collaboration et al. (2014), given by , , and .
cielo was run with a version of GADGET-3 based on GADGET-2 (Springel & Hernquist, 2003; Springel, 2005). It includes a multi-phase model for the gas component metal-dependant cooling, star formation and energy feedback Type II and Type Ia Supernovae (SNeII and SNeIa, respectively), as described by Scannapieco et al. (2005) and Scannapieco et al. (2006). The cielo simulations assume an Initial Mass Function of Chabrier (2003). The chemical evolution model included follows the enrichment by SNII and SNIa types, keeping track of 12 different chemical elements (Mosconi et al., 2001). This version of GADGET-3 has been previously used by Pedrosa & Tissera (2015) to study the mass-size relation and specific angular momentum content of galaxies, and by Tissera et al. (2016a); Tissera et al. (2016b) to investigate the origin of the metallicity gradients of the gas-phase components and stellar population of galaxies in the Fenix simulation.
The initial conditions of the cielo simulations were taken from a DMo run of a cosmological periodic cubic box of side length . The MUSIC code (Hahn & Abel, 2011), which computes multi-scale cosmological initial conditions under different approximations and transfer functions, was applied to extract the object and increase the numerical resolution. A first set of 20 LG analogues were initially selected and two pairs of them (LG1 and LG2) were chosen by imposing constraints on the relative velocity, separation and the mass of the DM haloes (see, Rodríguez et al., 2022).The two LG selected were re-run with a DM particle resolution of . Baryons were added with an initial gas mass of .
2.0.2 IllustrisTNG simulations
The Next Generation Illustris Simulation (IllustrisTNG) suite is a set of cosmological simulations that were run with the AREPO code (Weinberger et al., 2020). The IllustrisTNG simulation follows an updated model of galaxy formation based on the results from the original Illustris simulation, which includes subgrid models to account for different baryonic processes such as star formation, stellar feedback, gas cooling and AGN feedback (see Weinberger et al., 2017; Pillepich et al., 2018; Nelson et al., 2019). The updated model of IllustrisTNG includes cosmic magnetic fields and adopts a cosmology consistent with Planck Collaboration et al. (2016), given by , , , , , .
The initial conditions of IllustrisTNG were generated with the Zel’dovich approximation (Zel’dovich, 1970). Here we use the highest resolution available for IllustrisTNG 50 (hereafter, TNG50). The TNG50 consists of a periodic box size of . TNG50 contains DM particles and the same initial number of gas cells. The mass of the DM particles is uniform, , and the average mass of the gas cells (and stellar particles) is .
2.1 Haloes selection
In cielo simulations, galaxies are identified by using a Friends-of-Friends and SUBFIND algorithms. Among them, we select for this study the most massive central galaxies from simulated LG1 and LG2. In particular, LG1 was previously analysed by Rodríguez et al. (2022) to study the evolution of infalling disc satellites and by Tapia et al. (2022) to analyse the metallicity gradients of the central galaxies.
In the case of TNG50, we select haloes from the simulated box, restricting the stellar masses of the host galaxy of the haloes to the range of , with a star formation rate and metallicity above zero. In this work, we use the virial radius, , and the virial mass, , as the radius and mass within a sphere containing times the cosmic critical matter density at the corresponding redshift.
From the 517 haloes fulfilling the aforementioned conditions in TNG50, we remove those with a recent major merger. For this purpose, we select galaxies with minor mergers since , with the stellar mass ratio . This constraint follows recent studies of Helmi et al. (2018) and Belokurov et al. (2018) who inferred that the Galaxy has undergone the last major merger event around at by using data from Gaia mission (Gaia Collaboration et al., 2018). From our main sample, we found 15 MW-like haloes that fulfill all selection criteria adopted. For the TNG50 selection, we do not impose environment constraints such as physical separation or relative velocity on other nearby simulated galaxies.
Since the main purpose of this work is to follow in time the evolution of halo morphologies, we made use of the subhalo merger tree catalogue available in each simulation. The cielo simulations have a merger tree computed using the MergerTree routine of the Amiga Halo Finder (Knollmann & Knebe, 2009) and in the case of TNG50, the IllustrisTNG simulation data base provides a merger trees computed with SubLink algorithm (Rodriguez-Gomez et al., 2015), which we use in order to select and follow back the main branch of subhaloes chosen at .
| cielo | ||||
| h4337 | ||||
| h4469 | ||||
| h87 | ||||
| h115 | ||||
| TNG50 | ||||
| h476266 | ||||
| h533590 | ||||
| h593480 | ||||
| h631558 | ||||
| h649627 | ||||
| h656142 |
Therefore the haloes from cielo simulations analysed were h4337 (LG1), h87 (LG2) and h115 (LG2). In the case of TNG50, we opt to analyse one-third of the selection, 5 of them with halo IDs h533690, h593480, h631558, h649627 and h656142, as we want to focus on the detailed individual changes of their structure evolution. Table 1 summarises the main properties of the MW-like analogues. We kept for comparison analysis, two haloes without constraints in merger activity. From cielo, LG1-h4469, which had a major mass accretion due to a closed interaction at and from TNG50, h476266, which presents intermediate merger events since . Both haloes are indicated in Table 1 with boldface.
Although the nearly identical cosmologies between TNG50 and cielo, we chose to show the quantities in terms of to compare results between simulations.
3 Results
3.1 The mass density profile evolution
Firstly, we study the DM density profile of the individual haloes selected at different redshifts. We estimate the halo structural parameters by fitting to the mass profile the NFW model (Navarro et al., 1997):
| (1) |
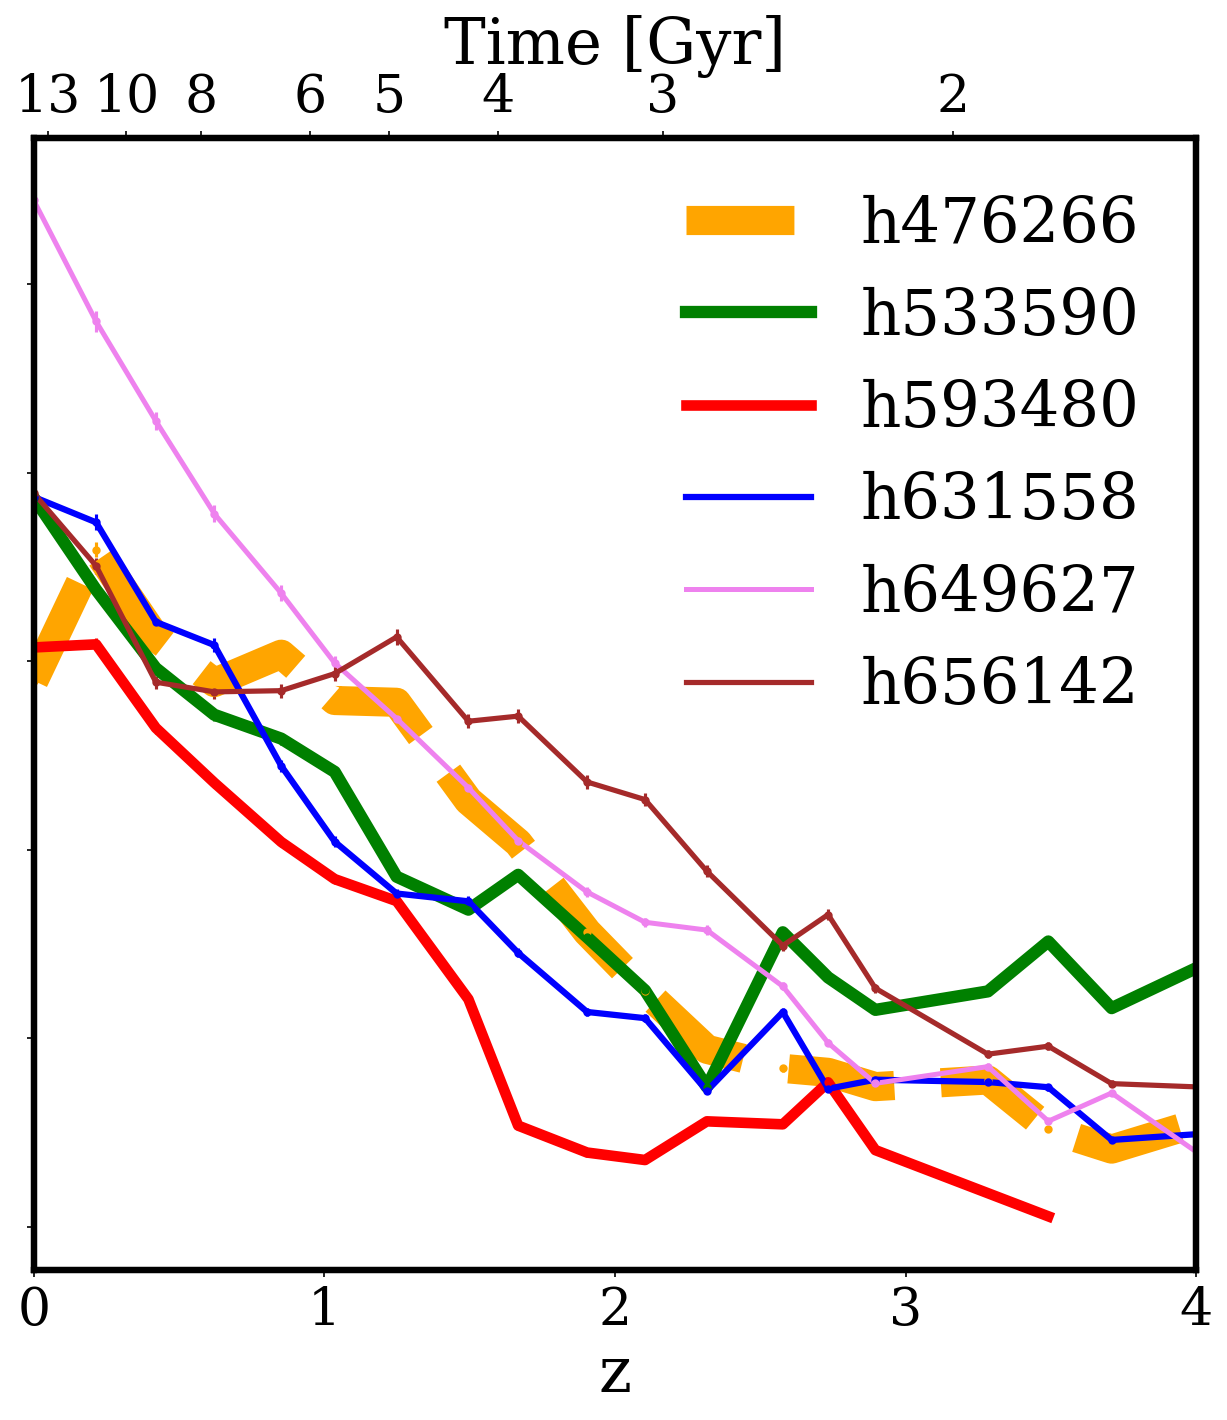
where and are the scale radius and density. In general, the NFW profile provides a good fit to the spherically-averaged profiles. In fact, for all redshift analysed, we estimate the standard error associated with the parameter . In both simulations, the fitting errors were below . The best-fit NFW profiles yield estimates of the halo structural parameters and for each halo in our sample, which we use in turn to estimate the concentration parameter , shown in Fig. 1.
Overall, we find that the concentration parameter evolves towards higher values (i.e. more concentrated) in time for both the cielo and TNG50 haloes in agreement with previous works (Gao et al., 2008; Ludlow et al., 2014). Fig. 1 also show, in terms of line widths in the plots, the relation of the halo mass with . We do not find a clear dependence in both halo selections between halo mass and concentration. Ludlow et al. (2014) found that the concentration is a monotonic but weak function of mass, varying by only a factor of 4 over a mass range of at . Our halo selection only changes one decade in mass, which can explain our results. This seemingly complex mass-redshift-concentration dependence has been described using the dimensionless ’peak height’ mass parameter , where is the linear fluctuation at in spheres of mass (Ludlow et al., 2014).
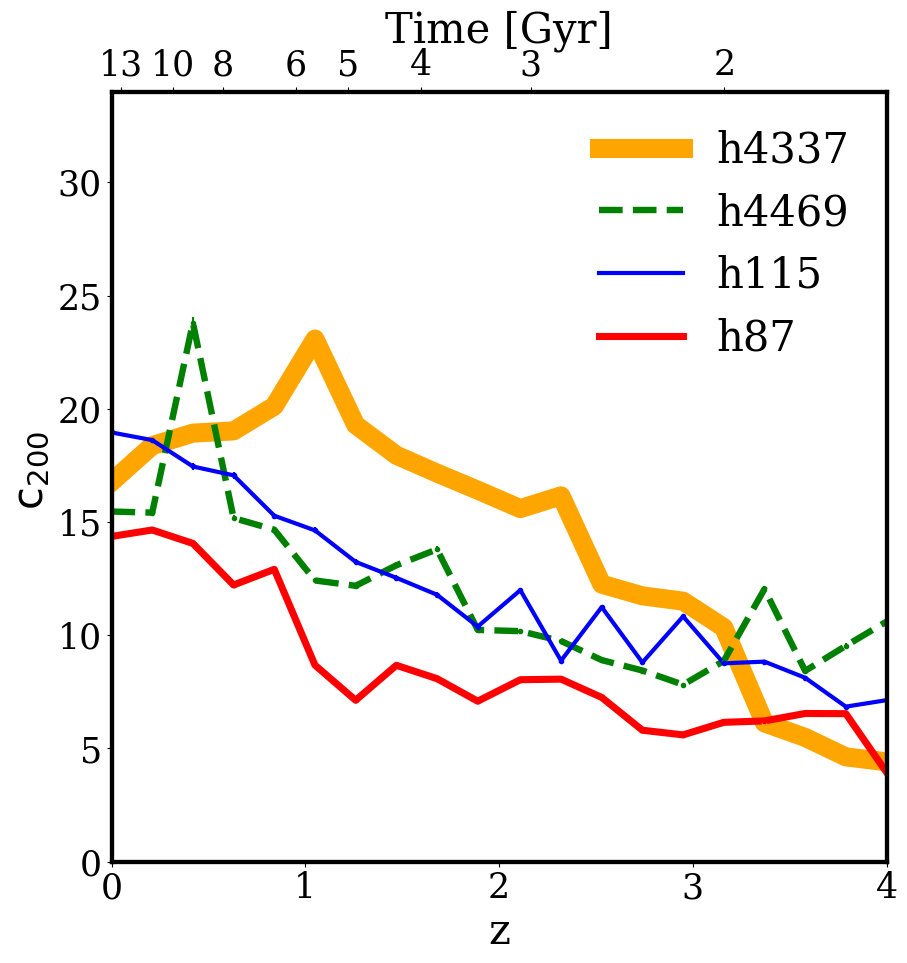
Additionally, the evolution of baryon accretion contributes to contract the inner region of haloes (see Fig. A2, to follow the MAH of baryons). The evolution of halo concentration is better reproduced by models that link the concentration of a halo with its mass accretion history. The concentration is empirically found to trace the time when halos transition from a period of “fast growth” to another where mass is accreted more gradually. (Wechsler et al., 2002; Zhao et al., 2003; Lu et al., 2006).
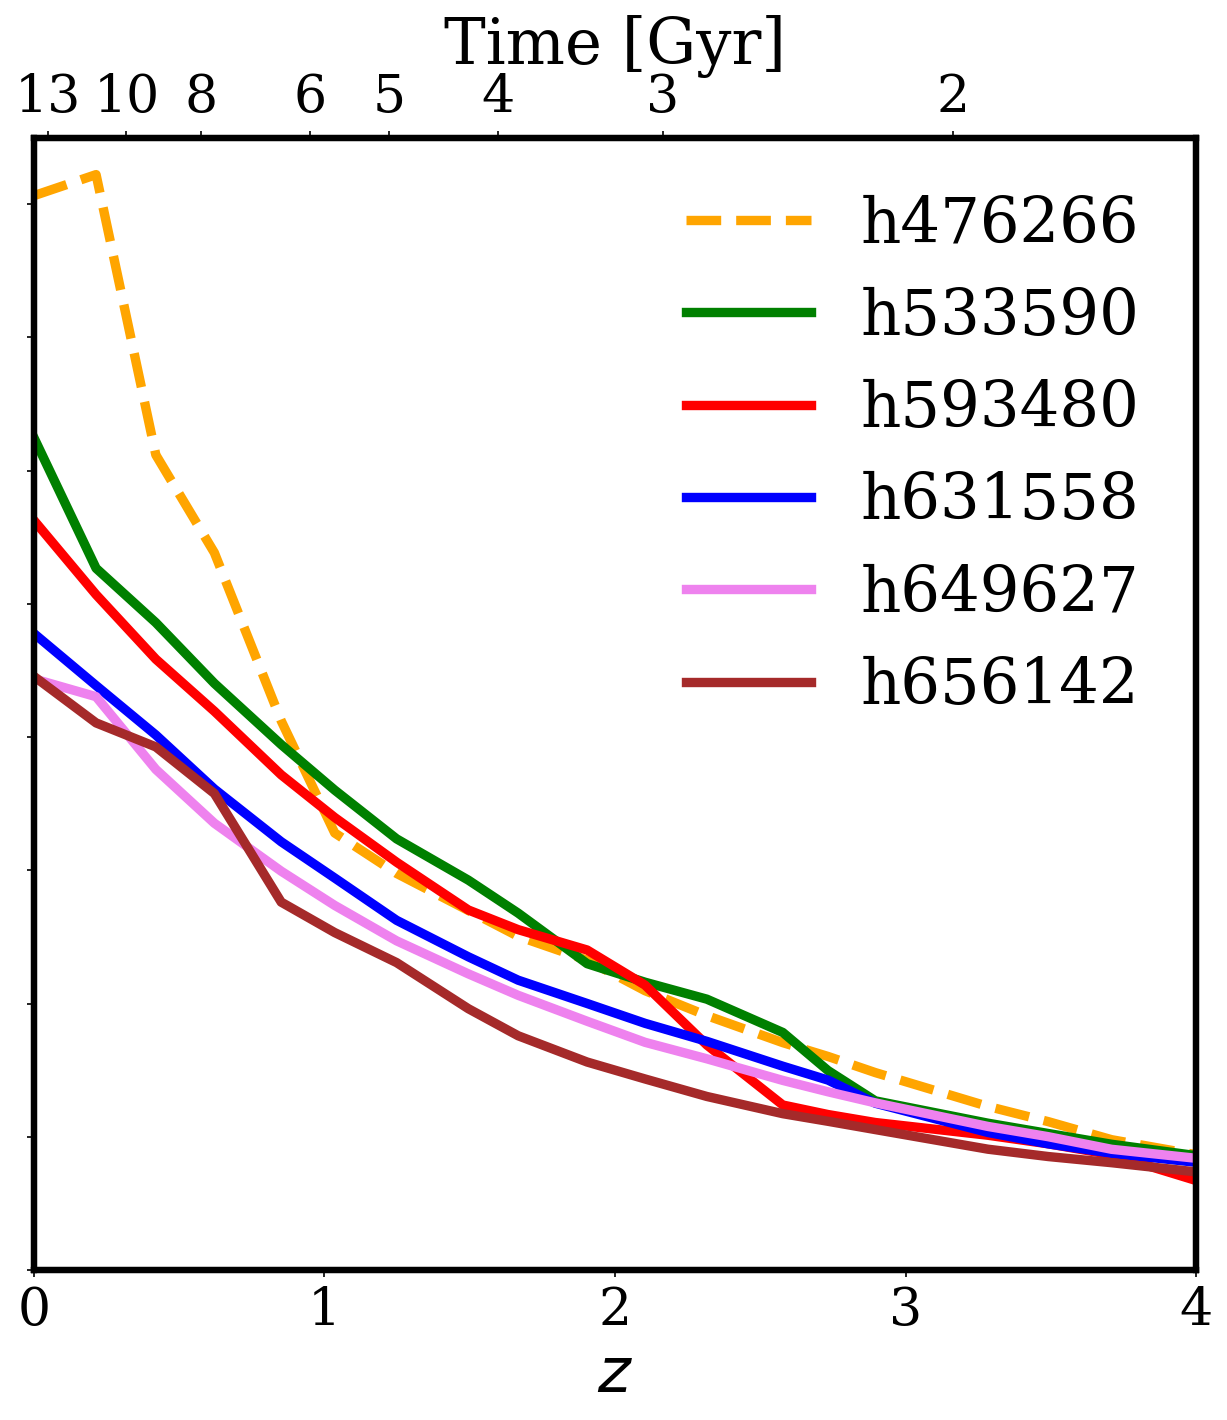
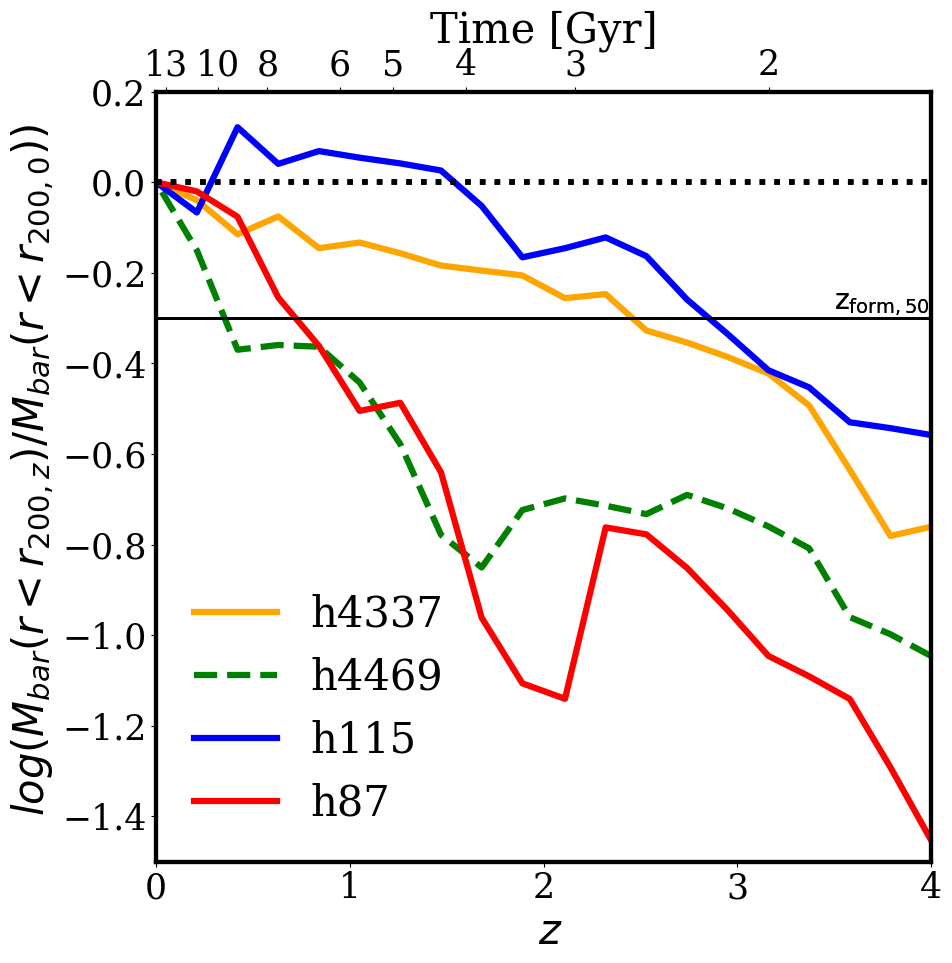
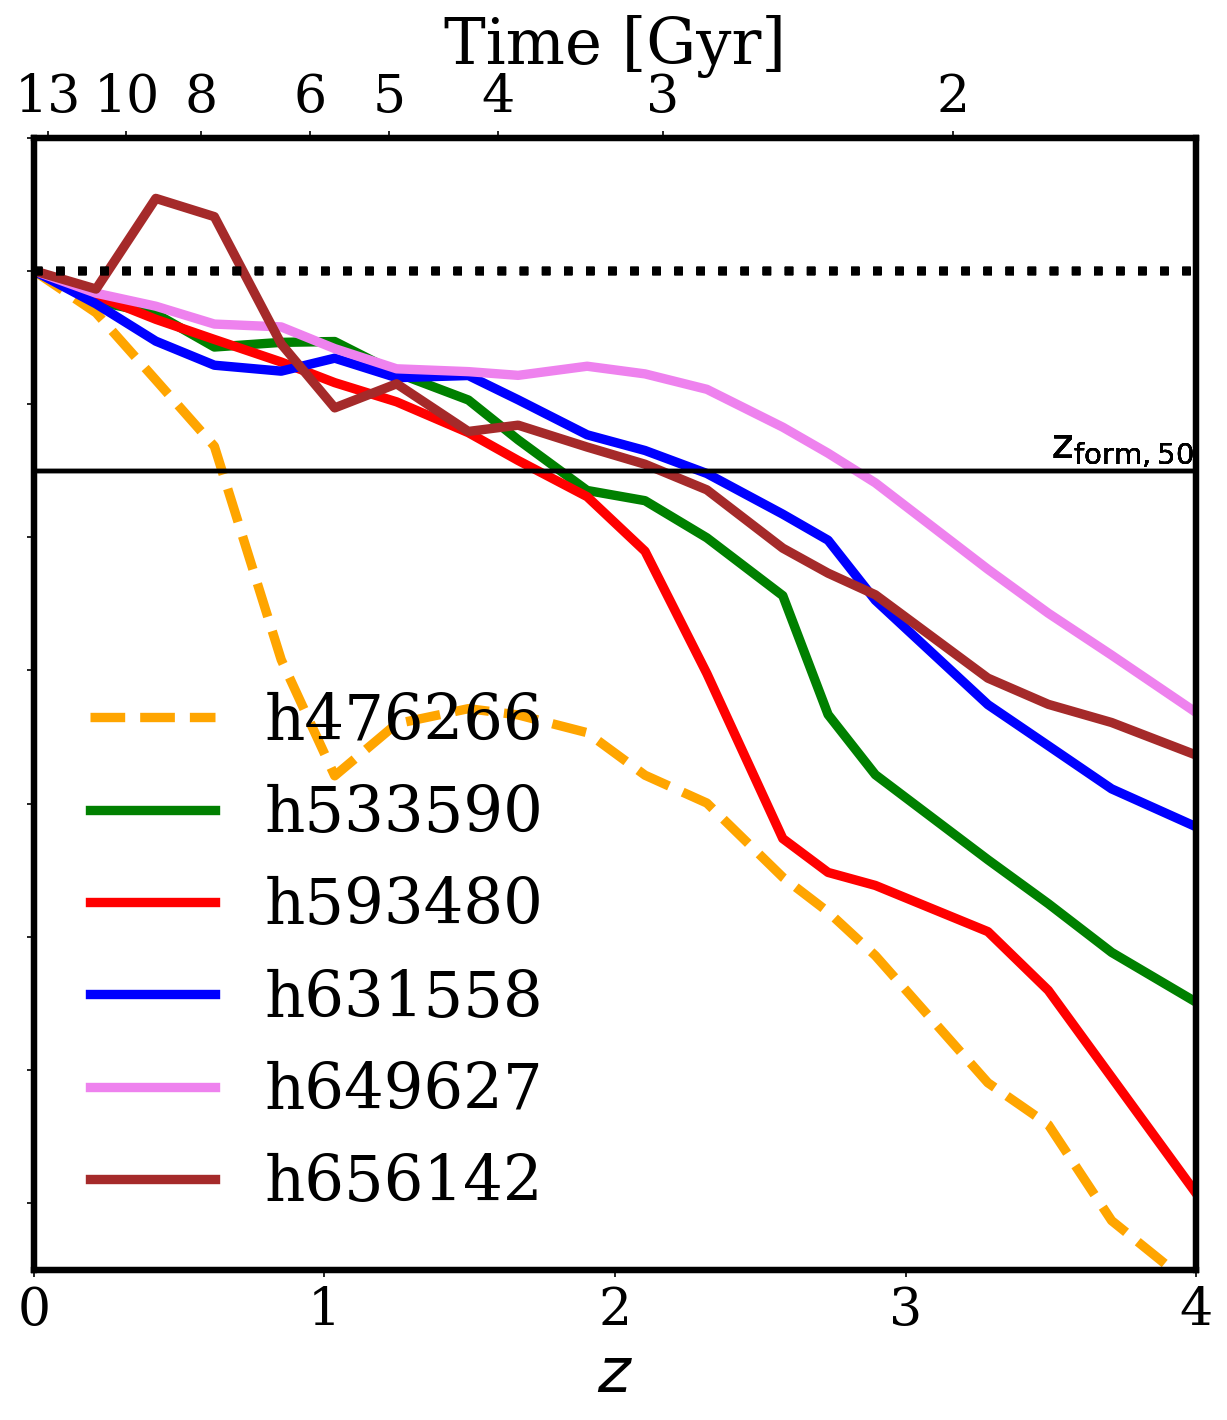
Motivated by these findings, in Fig. 2 we show the MAH of DM within the virial radius (filled lines) and the correspondent inside the (dotted lines). The black horizontal lines indicate when the halo reaches half of its final mass at (). The effects of major accretion due to material stripped from a close satellite (h4469) or due to merger activity (h476266) in recent times appears as sudden peaks in the curve of MAH, a product of a gain or loss in mass. Merger events can also be spot at with smoother changes with respect to the outer regions of the haloes. There is a general trend of haloes increasing their mass over time as expected, with haloes with lower merger activity in recent times reaching sooner their in comparison with the ones with major accretion at (h4469 and h476266). The latter have to gain most of their final mass until late times.
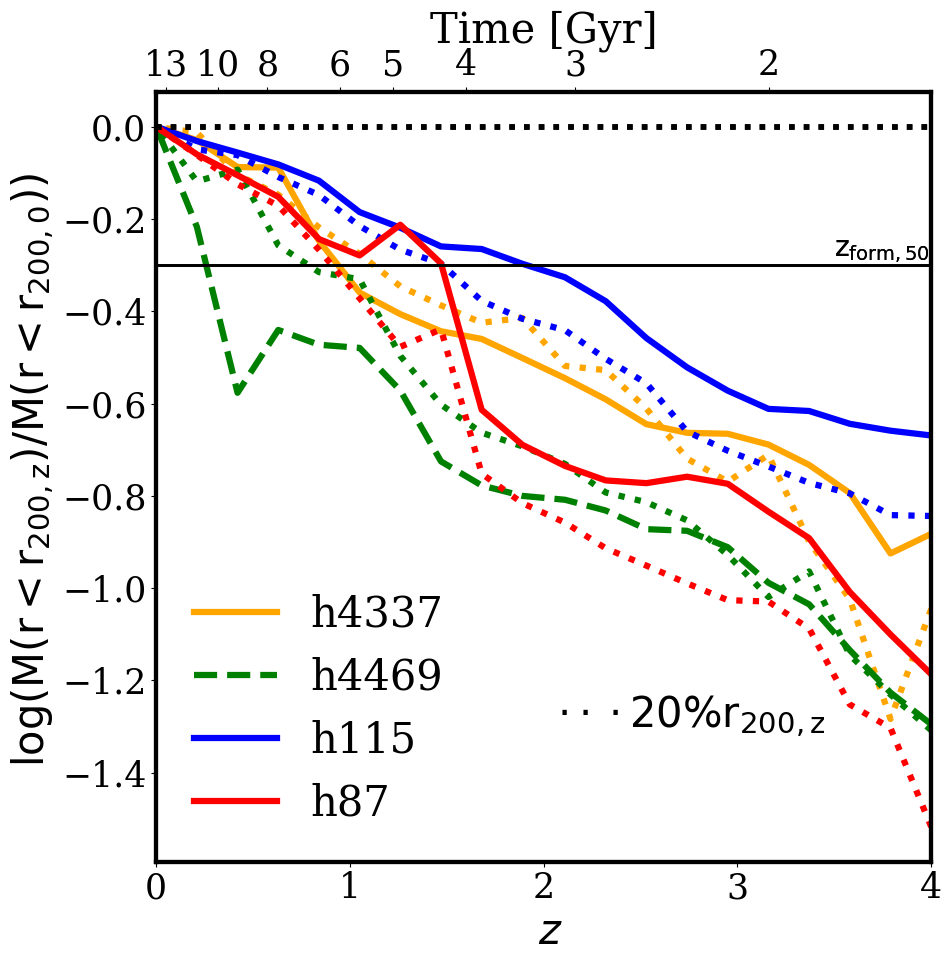
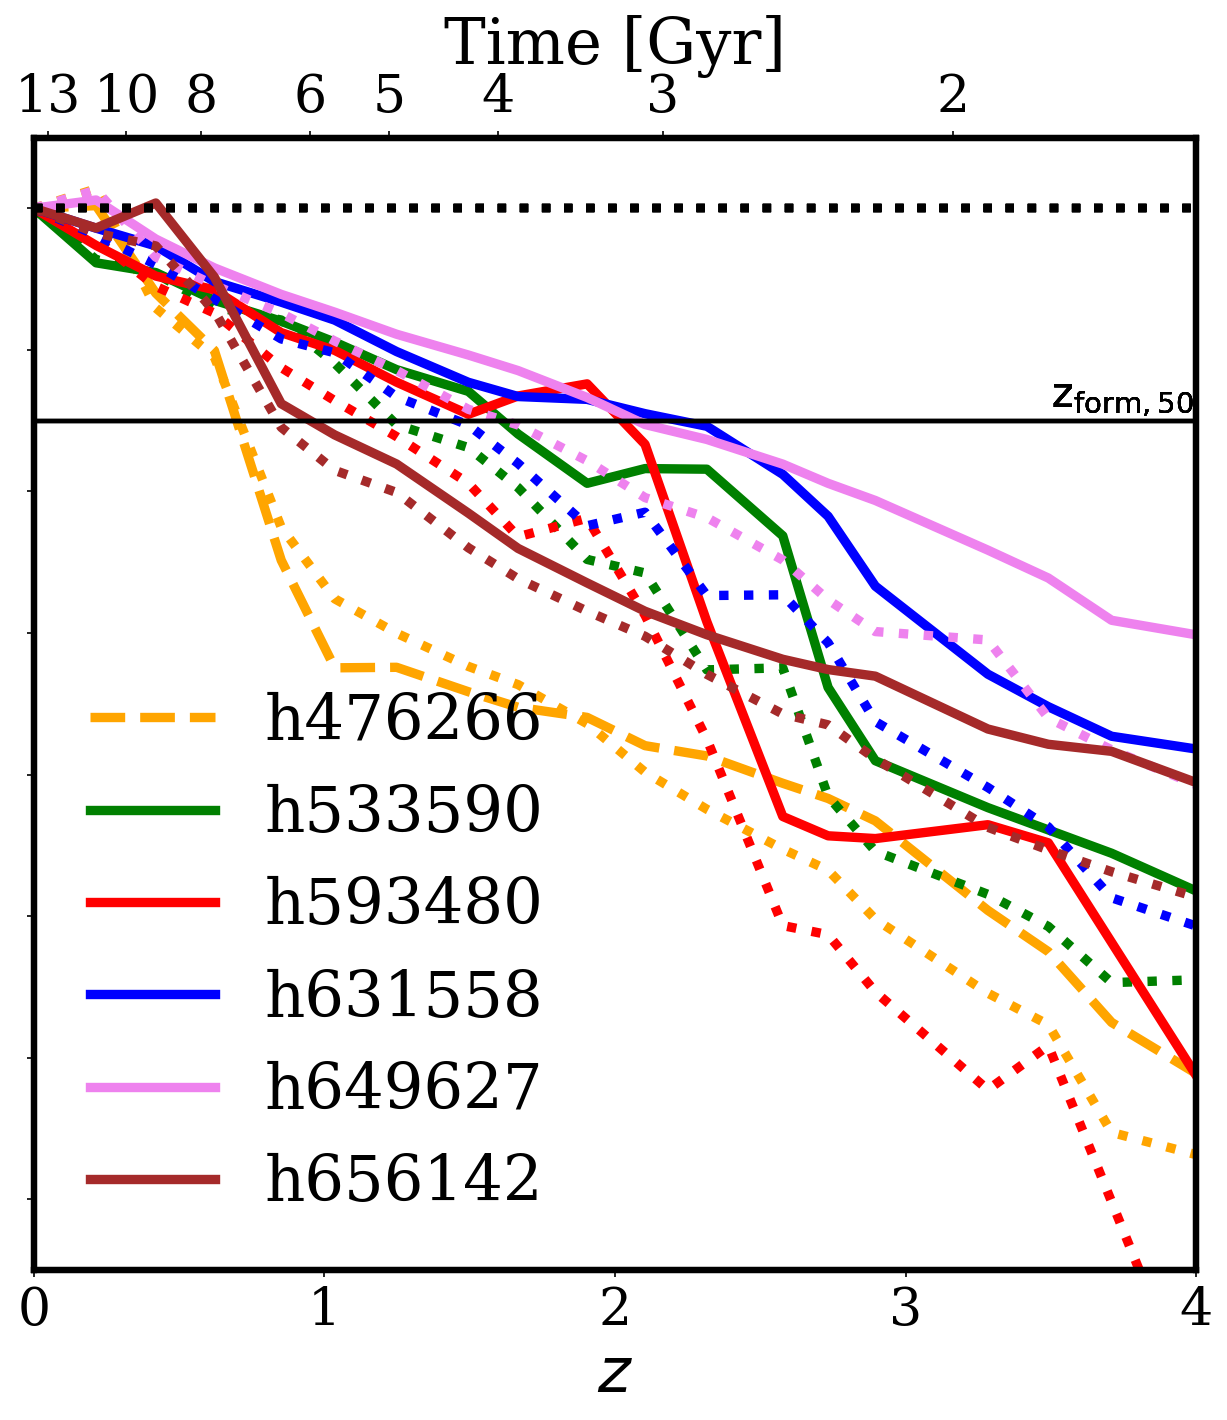
The increment of mass in recent times can be studied in Fig. A3 and in Tab. A1 in the Appendix section, inspecting the instantaneous halo growth at (i.e. ) and the formation redshift at (). Haloes with merger activity at late time report the higher and later formation redshifts, , among the halo selection.
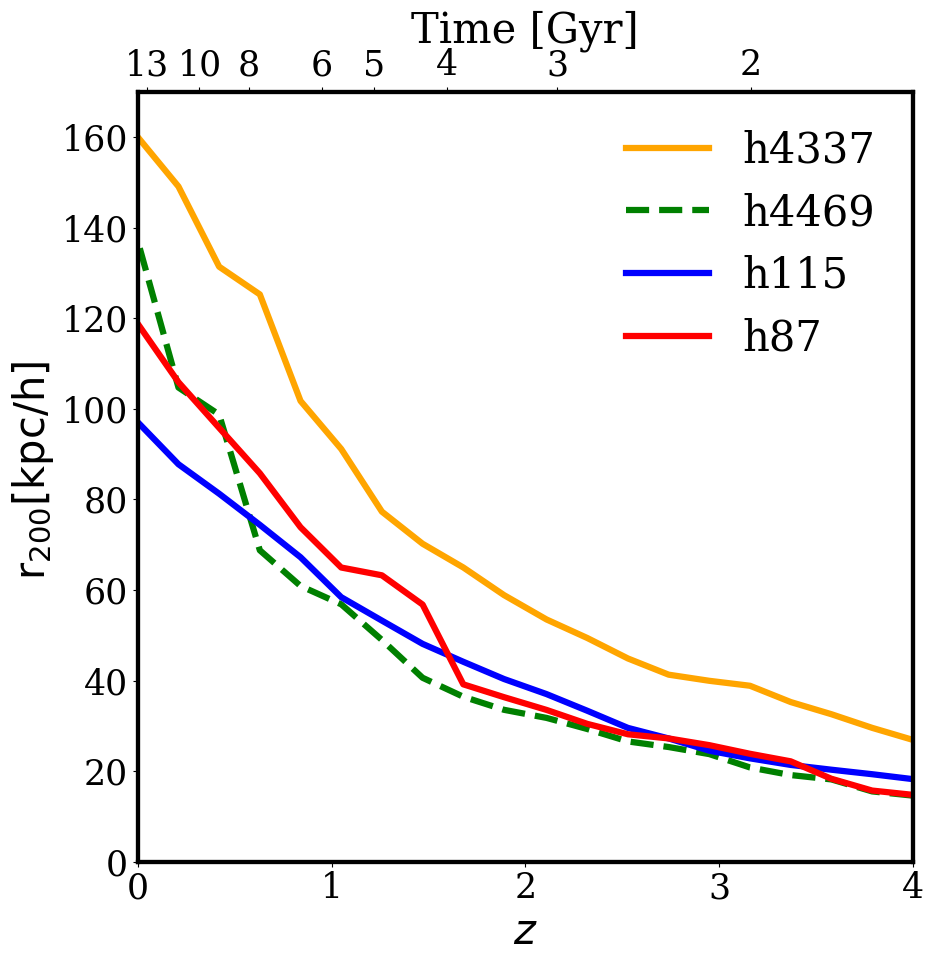
In agreement with Zavala et al. (2016) and Lagos et al. (2017) we observe two different regimes in the evolution of the virial radius as we can see in Fig. A1 in the Appendix section. First, a slow increase of halo size over time, up to followed by an acceleration in the increasing of , showing the turnaround point. Before that point in time, the DM halo gain angular momentum through tidal torques from their environment until maximum expansion (turnaround point), and afterward the halo collapse into virialized structures that conserve their angular momentum (Doroshkevich, 1970; White, 1984; Catelan & Theuns, 1996b, a).
3.2 Halo morphology evolution
In Cataldi et al. (2020) we find that for EAGLE and Fenix haloes, baryons have a significant impact on the shape of the inner halo, mainly within 20 percent of the virial radius. In order to dig into the evolution of halo shape, we compute the shapes of our selected halo sample and focus the analysis mainly at .
We describe them using the semi-axes of the triaxial ellipsoids, , where , and are the major, intermediate and minor axis respectively of the shape tensor (e.g. Bailin & Steinmetz, 2005; Zemp et al., 2011). Here we use an iterative method that starts with particles within a spherical shell (i.e. Dubinski & Carlberg, 1991; Curir et al., 1993).
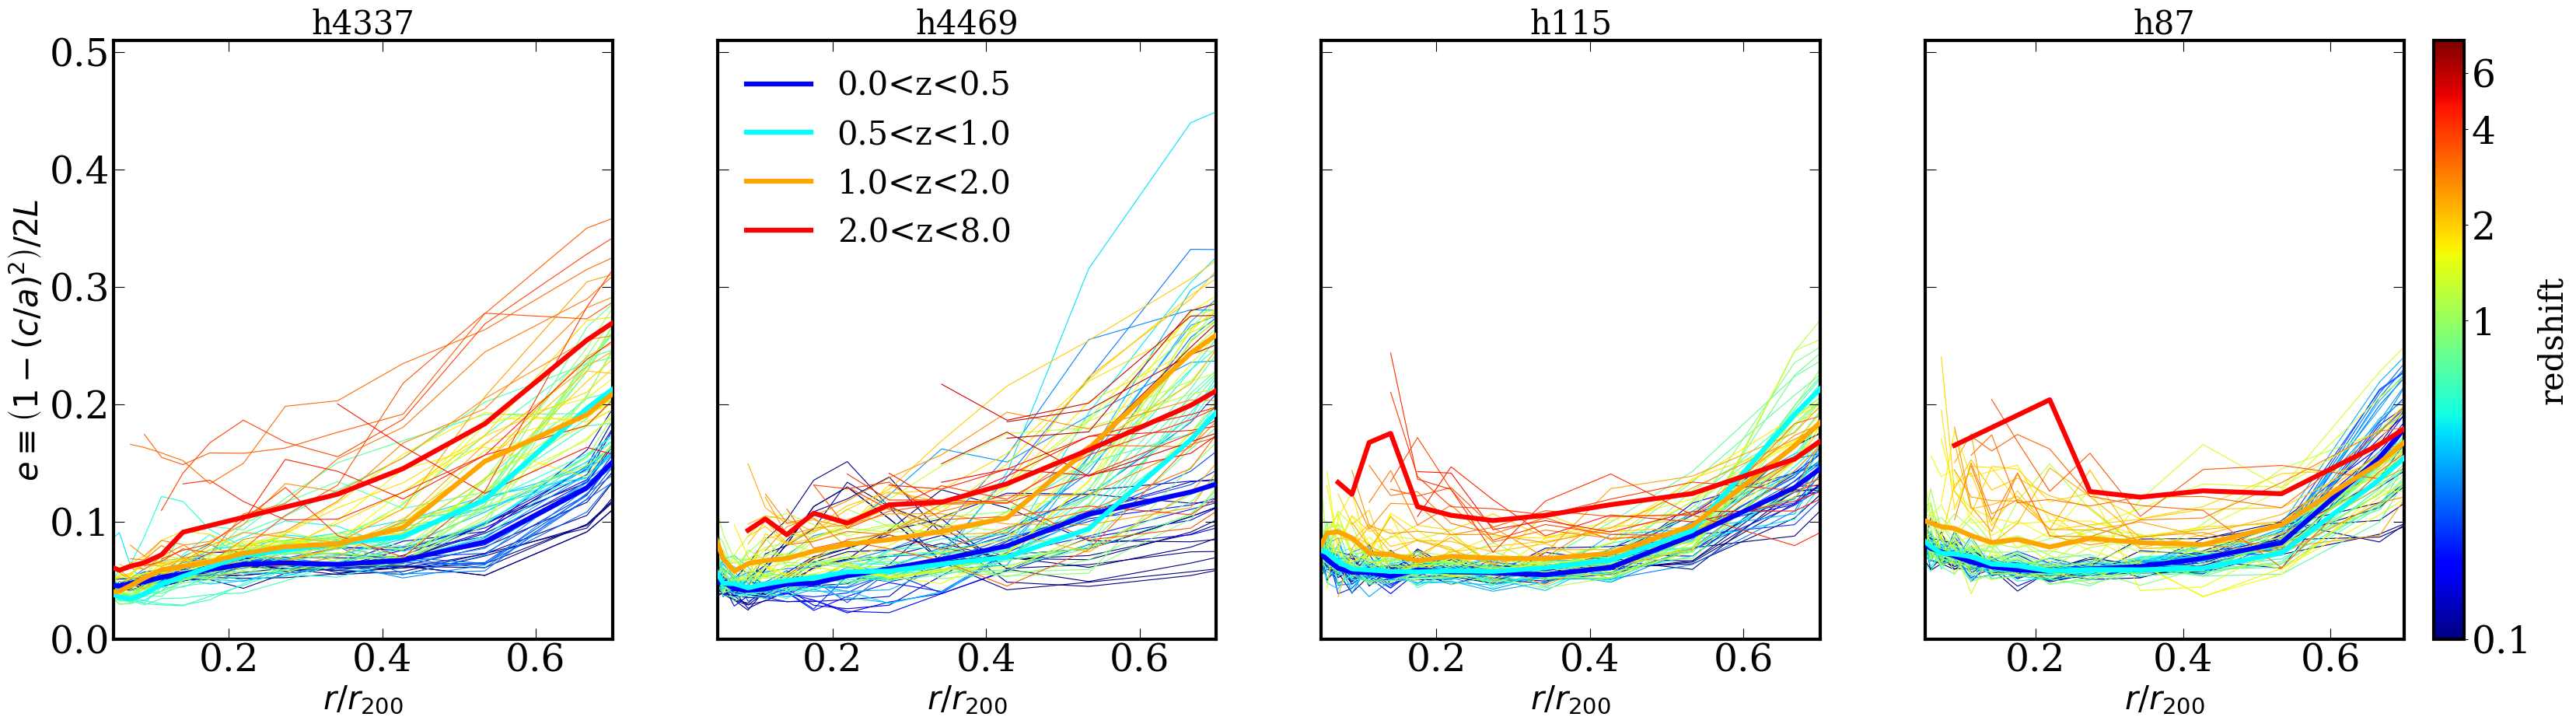
To obtain the ratios and , we diagonalise the reduced inertia tensor to compute the eigenvectors and eigenvalues, as in Tissera & Dominguez-Tenreiro (1998). Traditionally the shape parameter has been used as a measure of halo sphericity (e.g. Allgood, 2005; Vera-Ciro et al., 2014; Chua et al., 2019). We adopted the triaxiality parameter, defined as , which quantifies the degree of prolatness or oblatness: describes a completely prolate halo () while describes a completely oblate halo (). Haloes with are considered prolate and haloes with oblates, while those with are considered triaxial (Allgood, 2005; Artale et al., 2019). We define the ellipticity as,
| (2) |
where . The condition implies that the domain of e is the range .
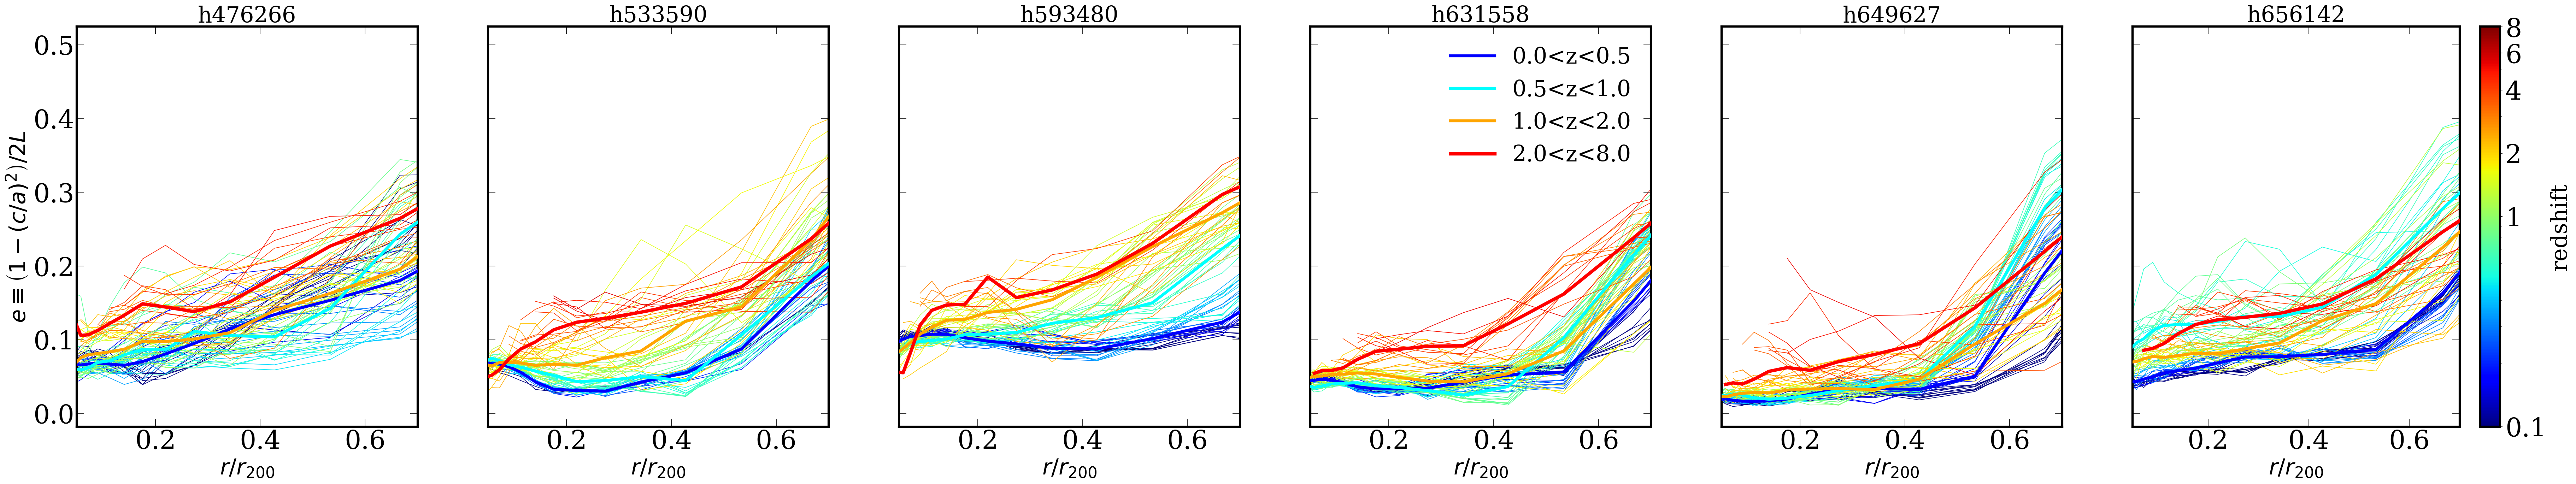
In Fig. 3, we show the evolution of the ellipticity as a function of the distance to the halo center. To inspect the evolution in further detail, we extend the range of redshift up to . For more recent redshifts, the haloes become less elliptical and in correspondence, more spherical. For earlier times, haloes present triaxial shapes, while as they evolve in time their ellipticity decreases. This result is in agreement with previous works (Allgood, 2005; Chua et al., 2019; Cataldi et al., 2020). Interestingly, the morphologies of cielo haloes present a more ordered trend in their decrease of ellipticity with redshift in comparison with TNG50 haloes, which report a weaker trend in their decrease of ellipticity.
A useful way to study the shape evolution of the DM haloes with time and radii is the plane proposed by Trayford et al. (2019), also applied in previous studies (see, Cataldi et al., 2020; Cataldi et al., 2022). However, we modify it to visualize the evolution of the halo axis ratios at different radii. Fig. 4 and Fig. 5 present the results for the cielo and TNG50 haloes samples, respectively, at . In our representation, the upper right corner, and , correspond to spherical haloes. The spherical, prolate, triaxial, and oblate regions are labeled correspondingly, and the color code indicates the distance to the halo center.
For cielo, all haloes morphology tends to be more triaxial for the outer radii and more spherical in the inner regions. In the case of TNG50, haloes in the central regions are distributed between spherical and oblate (h593480) shapes. However, the evolution path to this shape configurations is remarkably different in each case. Chua et al. (2022) studied the halo morphology dependence on radii and for different mass resolution in the TNG50 suite. These authors reported spherical and oblate shapes for haloes at central radii and a small tendency for haloes of TNG50 to be more spherical and oblate than the lower mass resolution simulations of the suite.
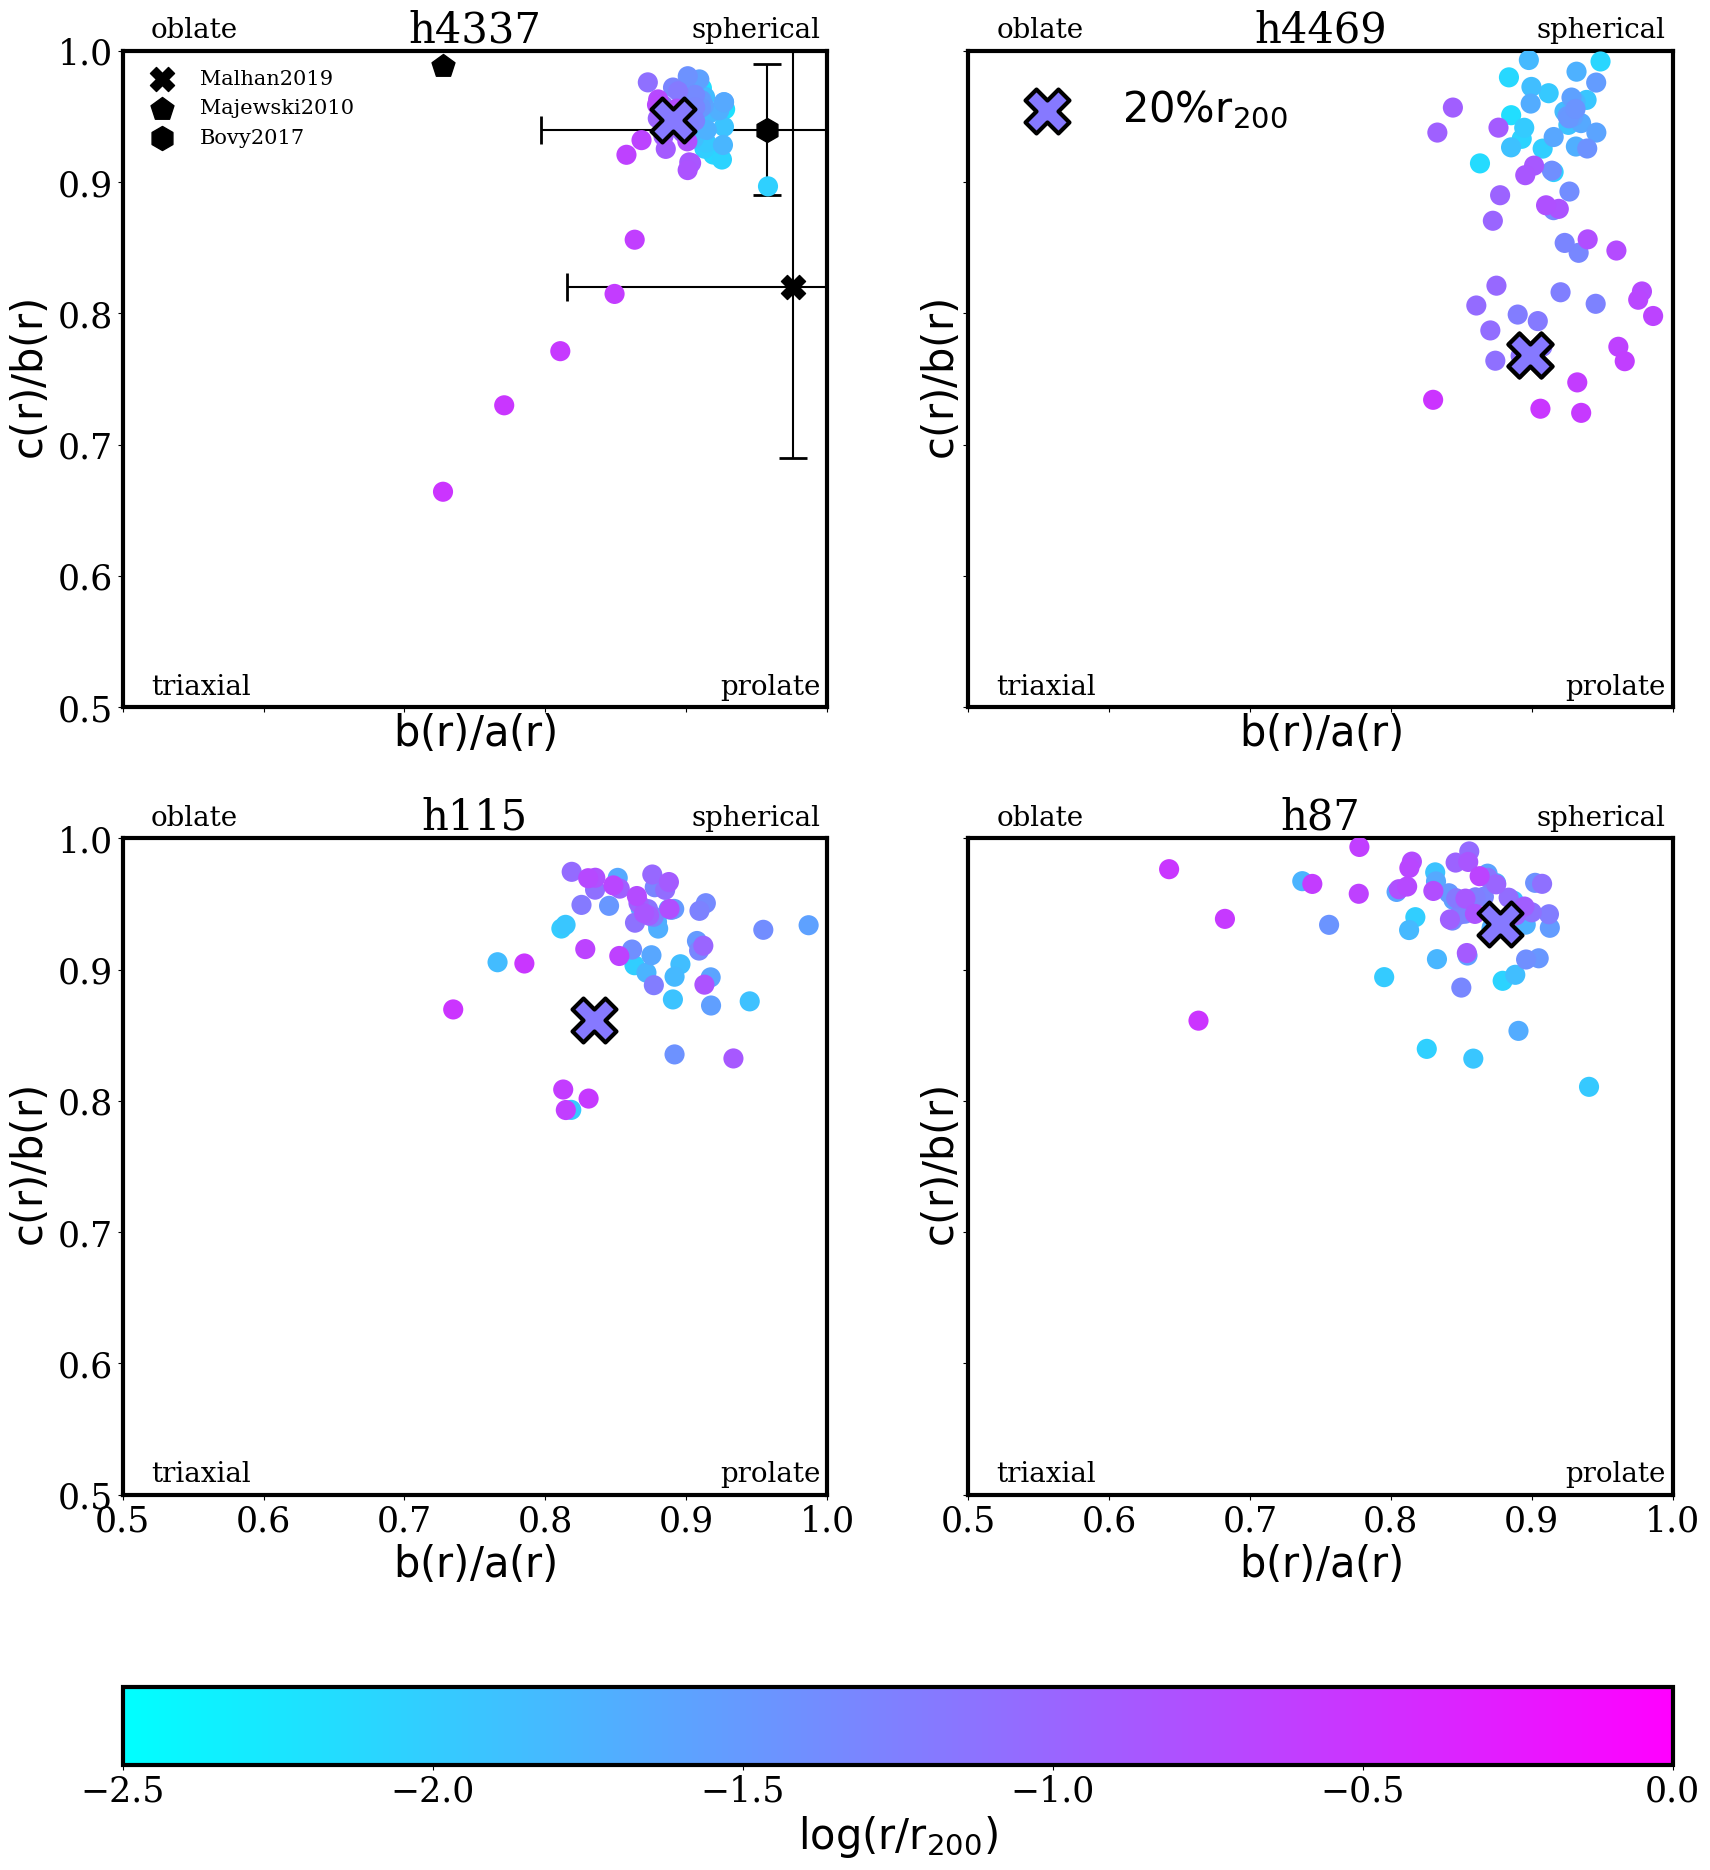
The configuration goes from typically spherical in the inner regions (related to the collapse of matter in earlier times) to a triaxial shape in the outskirts (corresponding to the shells that have collapsed more recently through a preferred direction). As the haloes evolve with time, there is also the effect of baryonic condensation to form the galaxy at the inner region of the halo (see Fig. A2). This baryonic concentration contributes to rounding up the halo morphology.
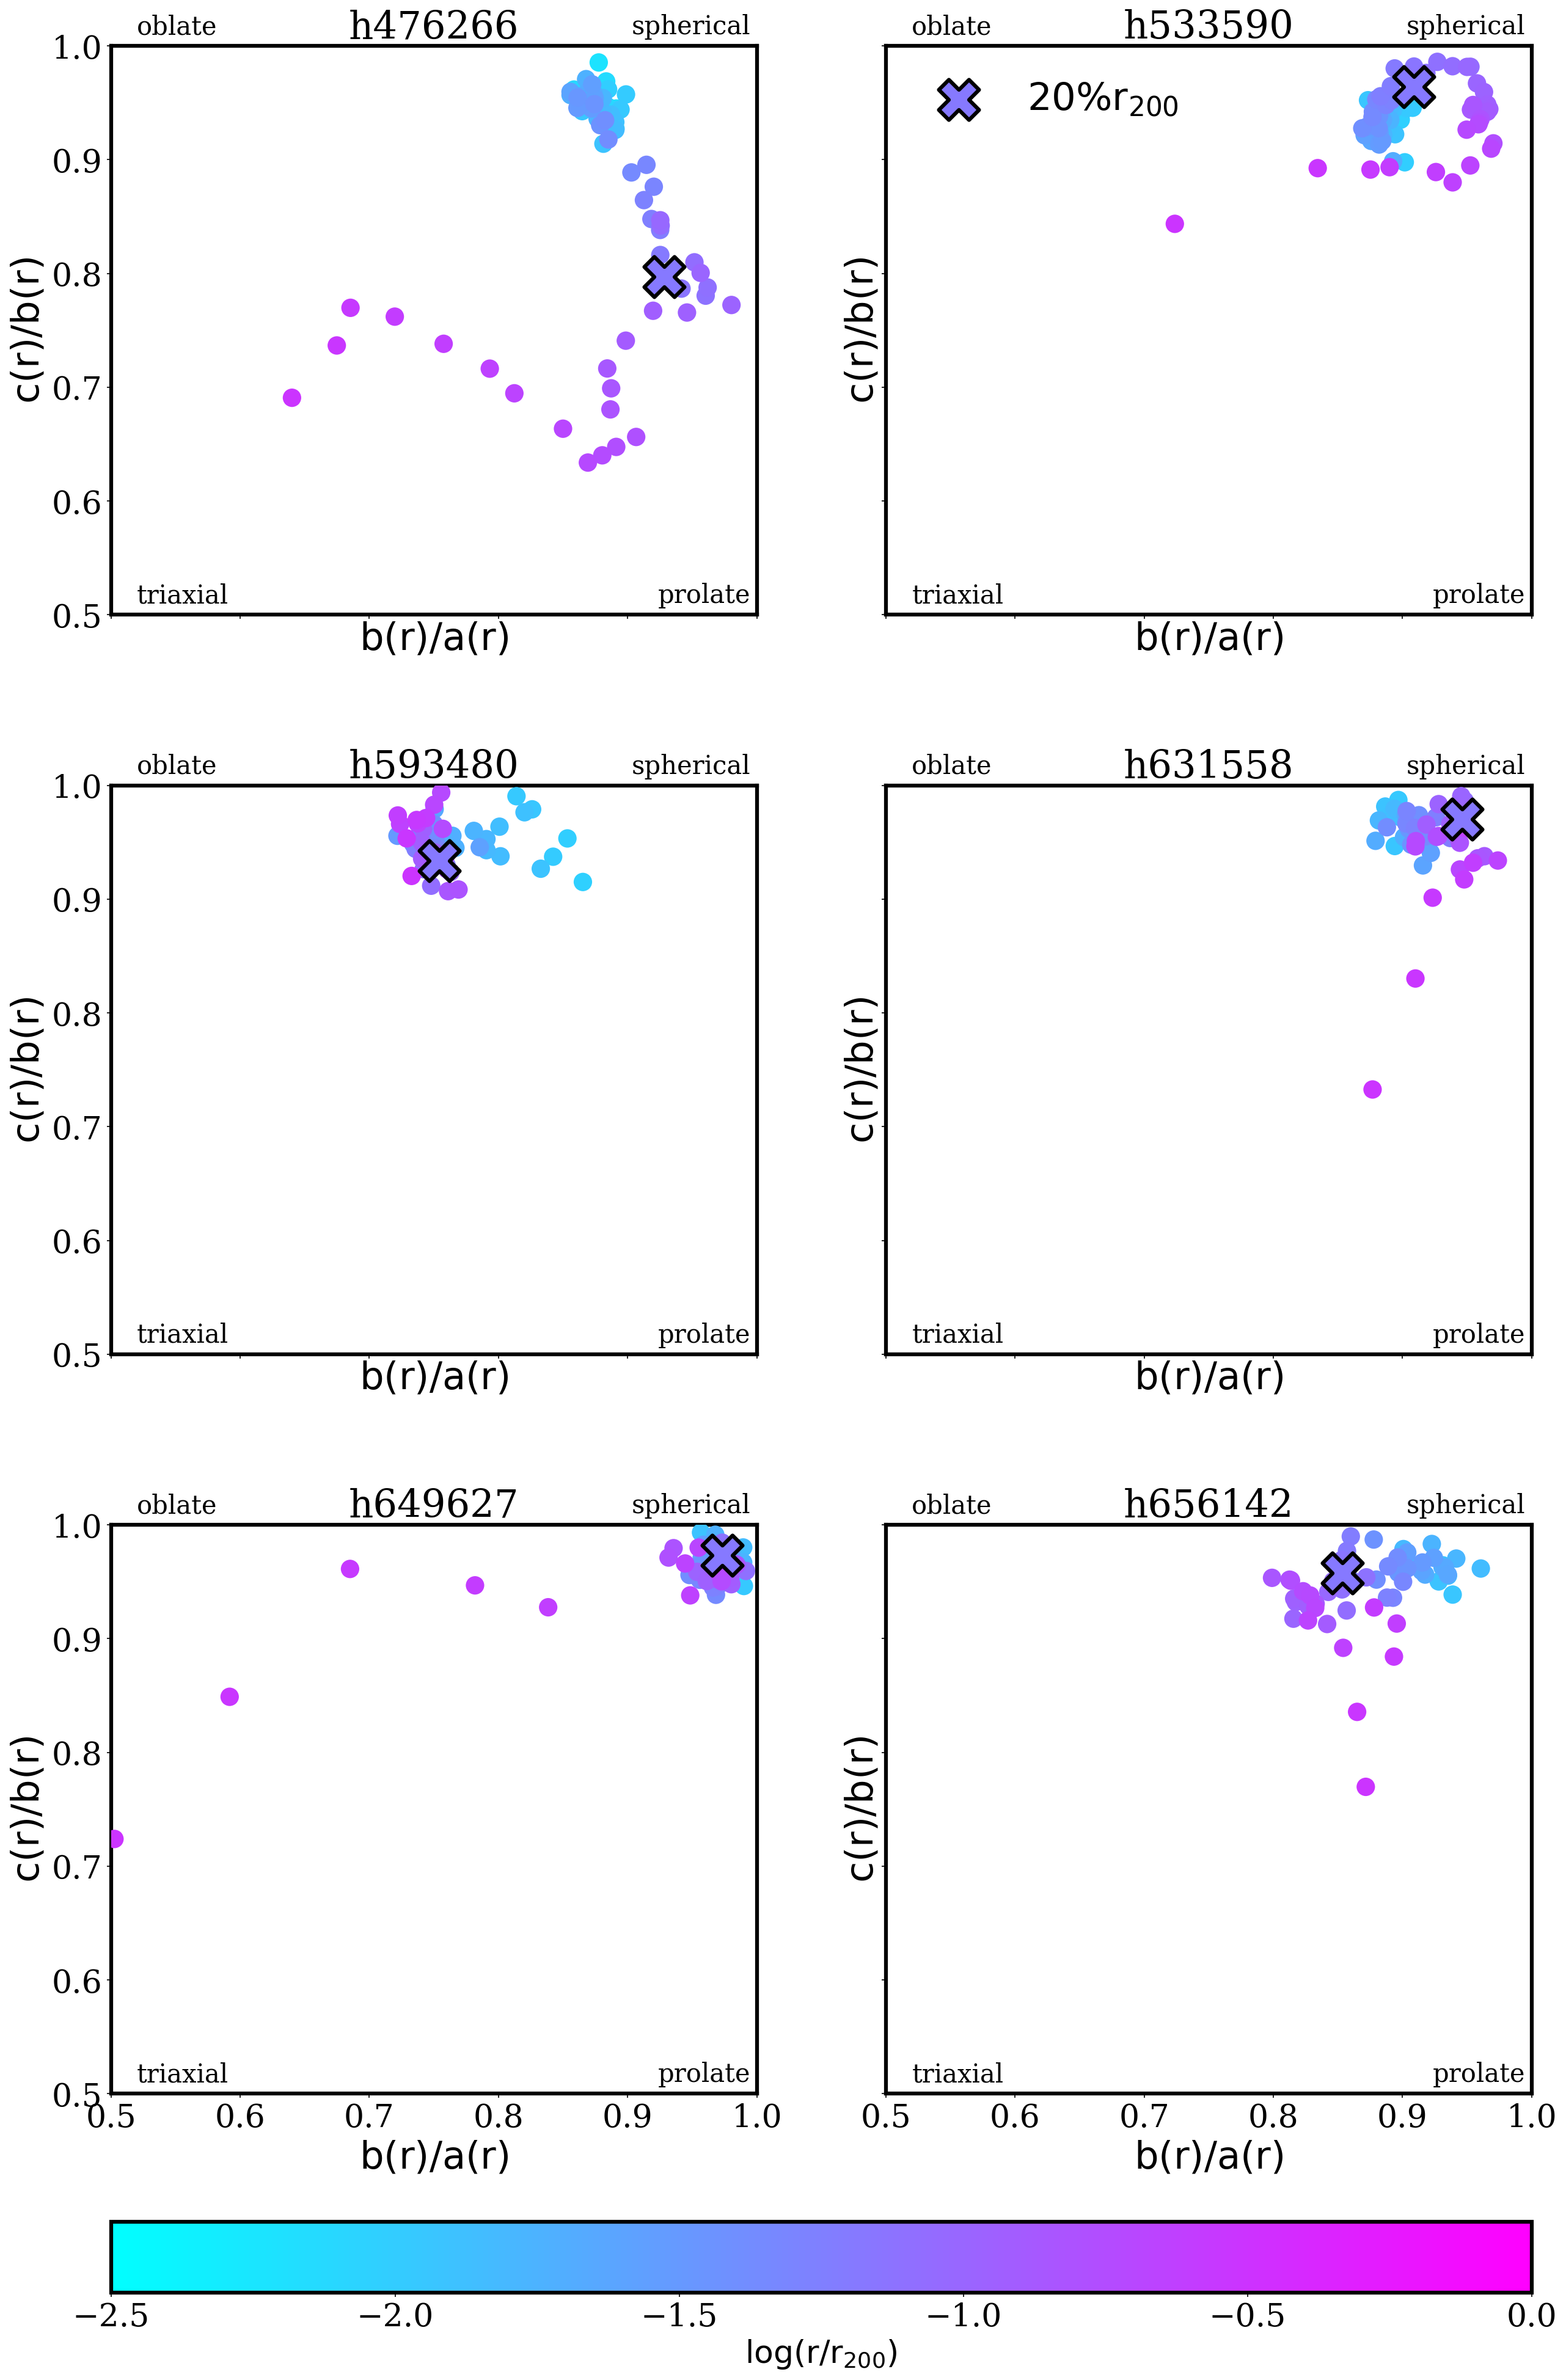
The halo shape structure at earlier times is imprinted in the present day () shape trends with radius (Vera-Ciro et al., 2011). Therefore, the different paths to sphericity can be studied analyzing the evolution of halo morphologies. In Fig. 4 and Fig. 5 we also show the halo shape at with cross symbols. We compare the shapes at the galactocentric radii, where the stellar disc is located, which is the radius that maximize the effects of baryonic concentration (Cataldi et al., 2020).
To shed light on this, we analyse the correlation between merger events and the resulting morphology in Fig. 6 and Fig. 7. We show the axial ratios vs. within . Here each point is colored according to the redshift. The size of the dots is proportional to the ratio , a quantitative measure of the merger events at a given redshift.
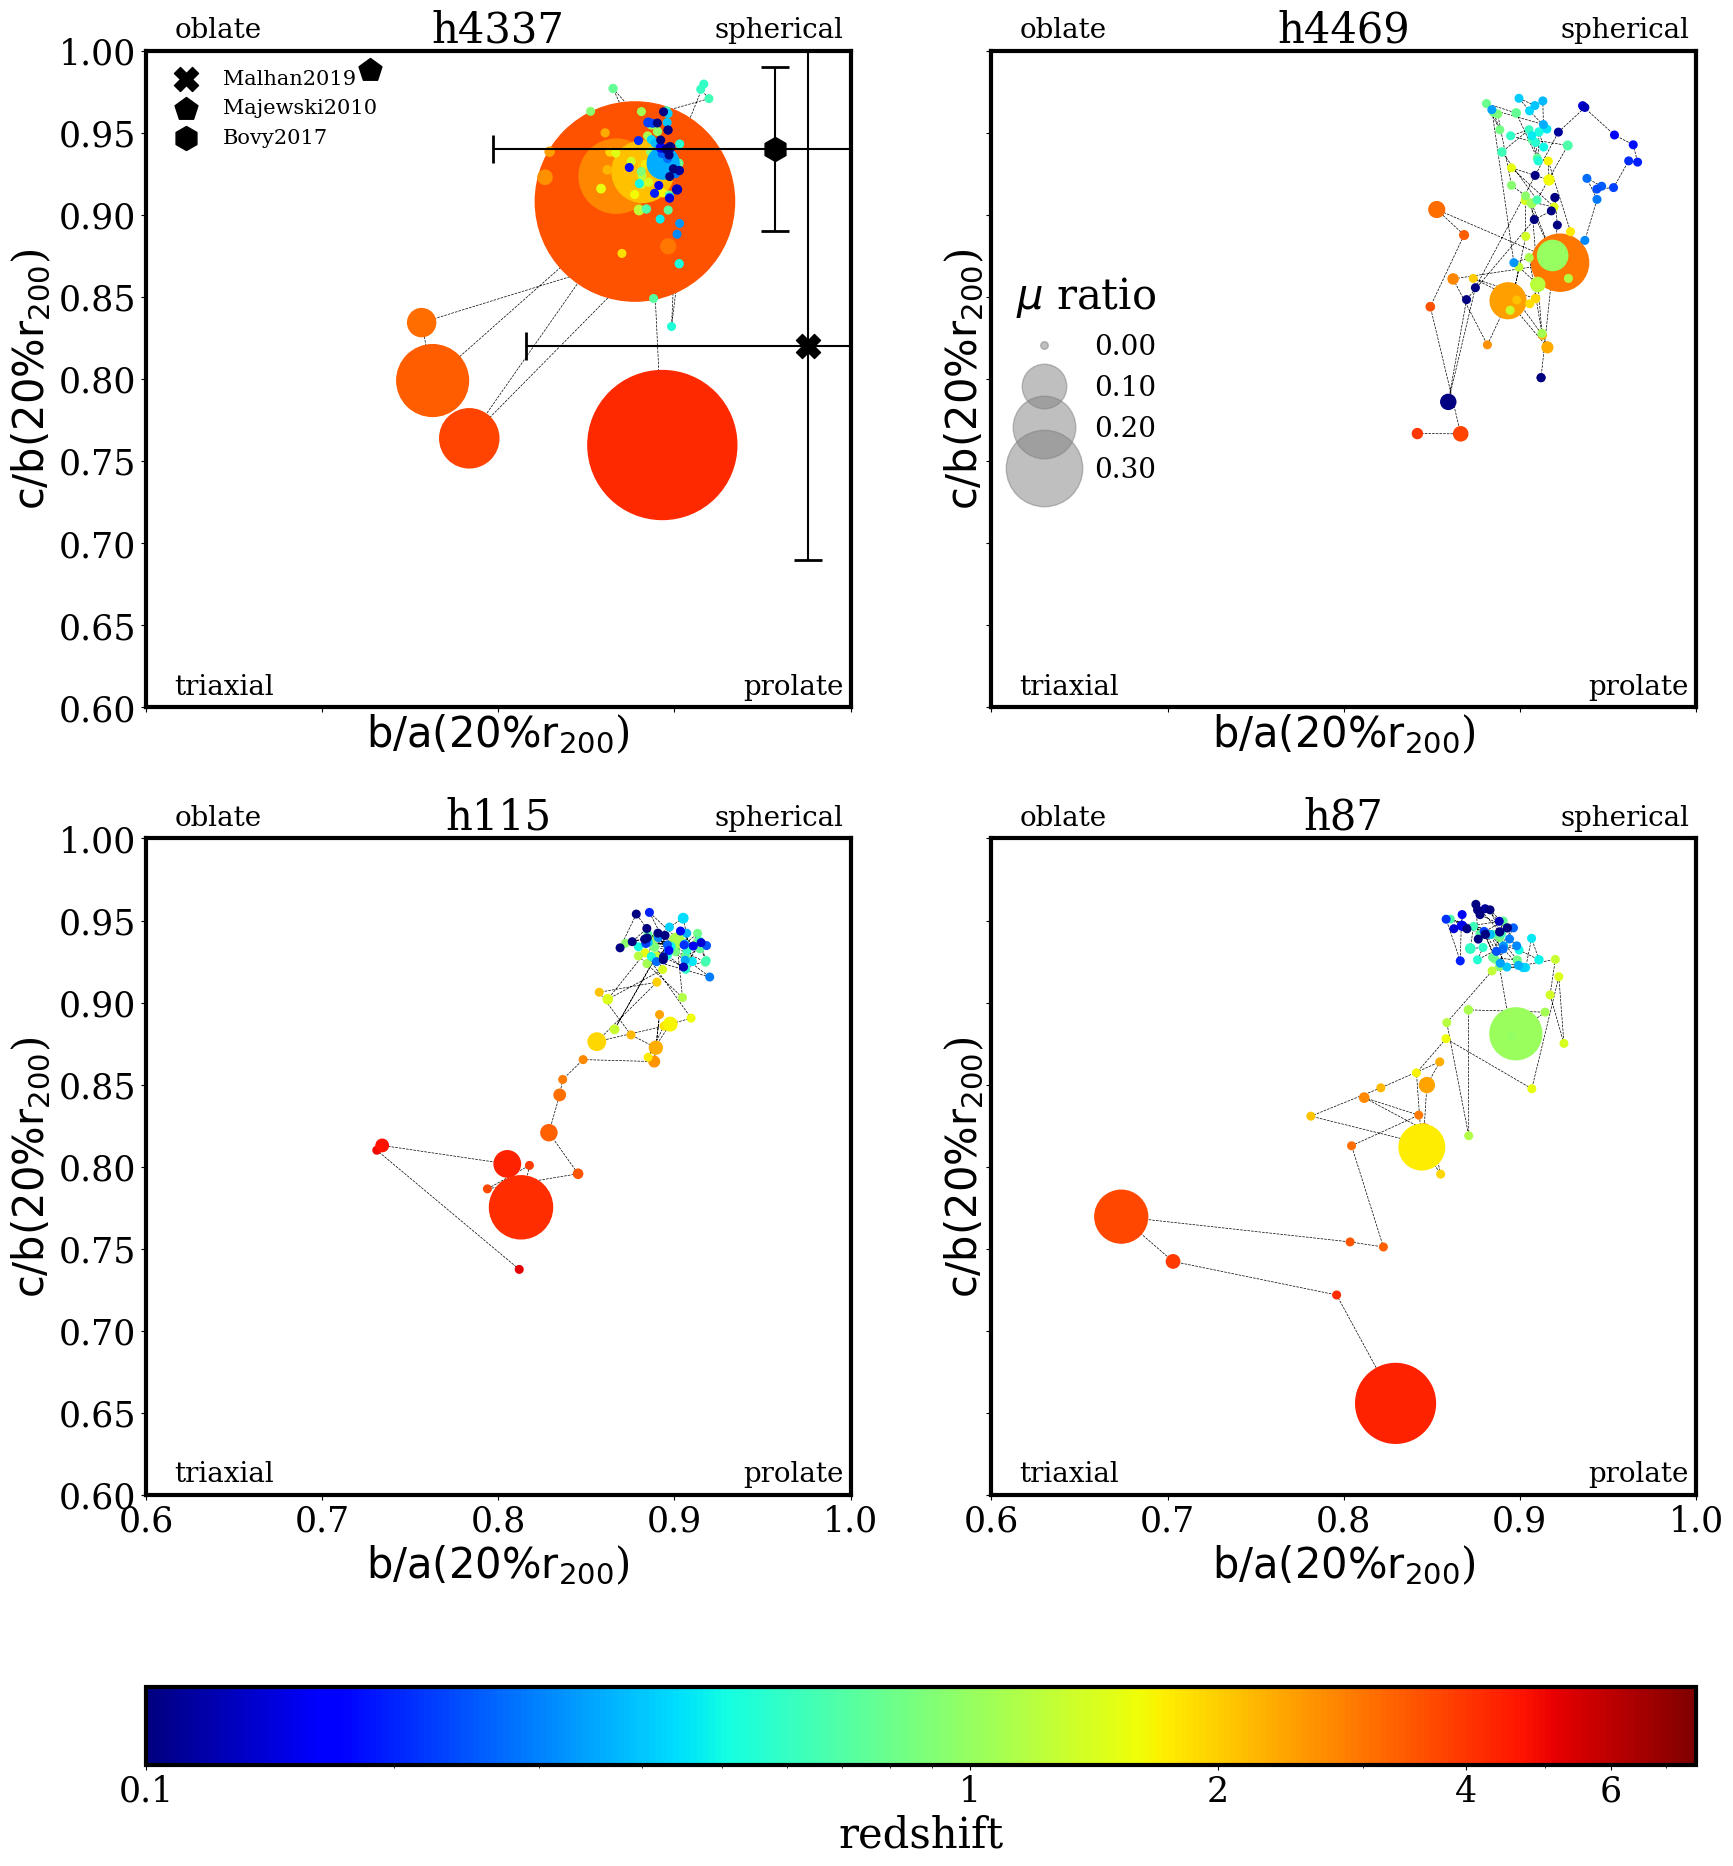
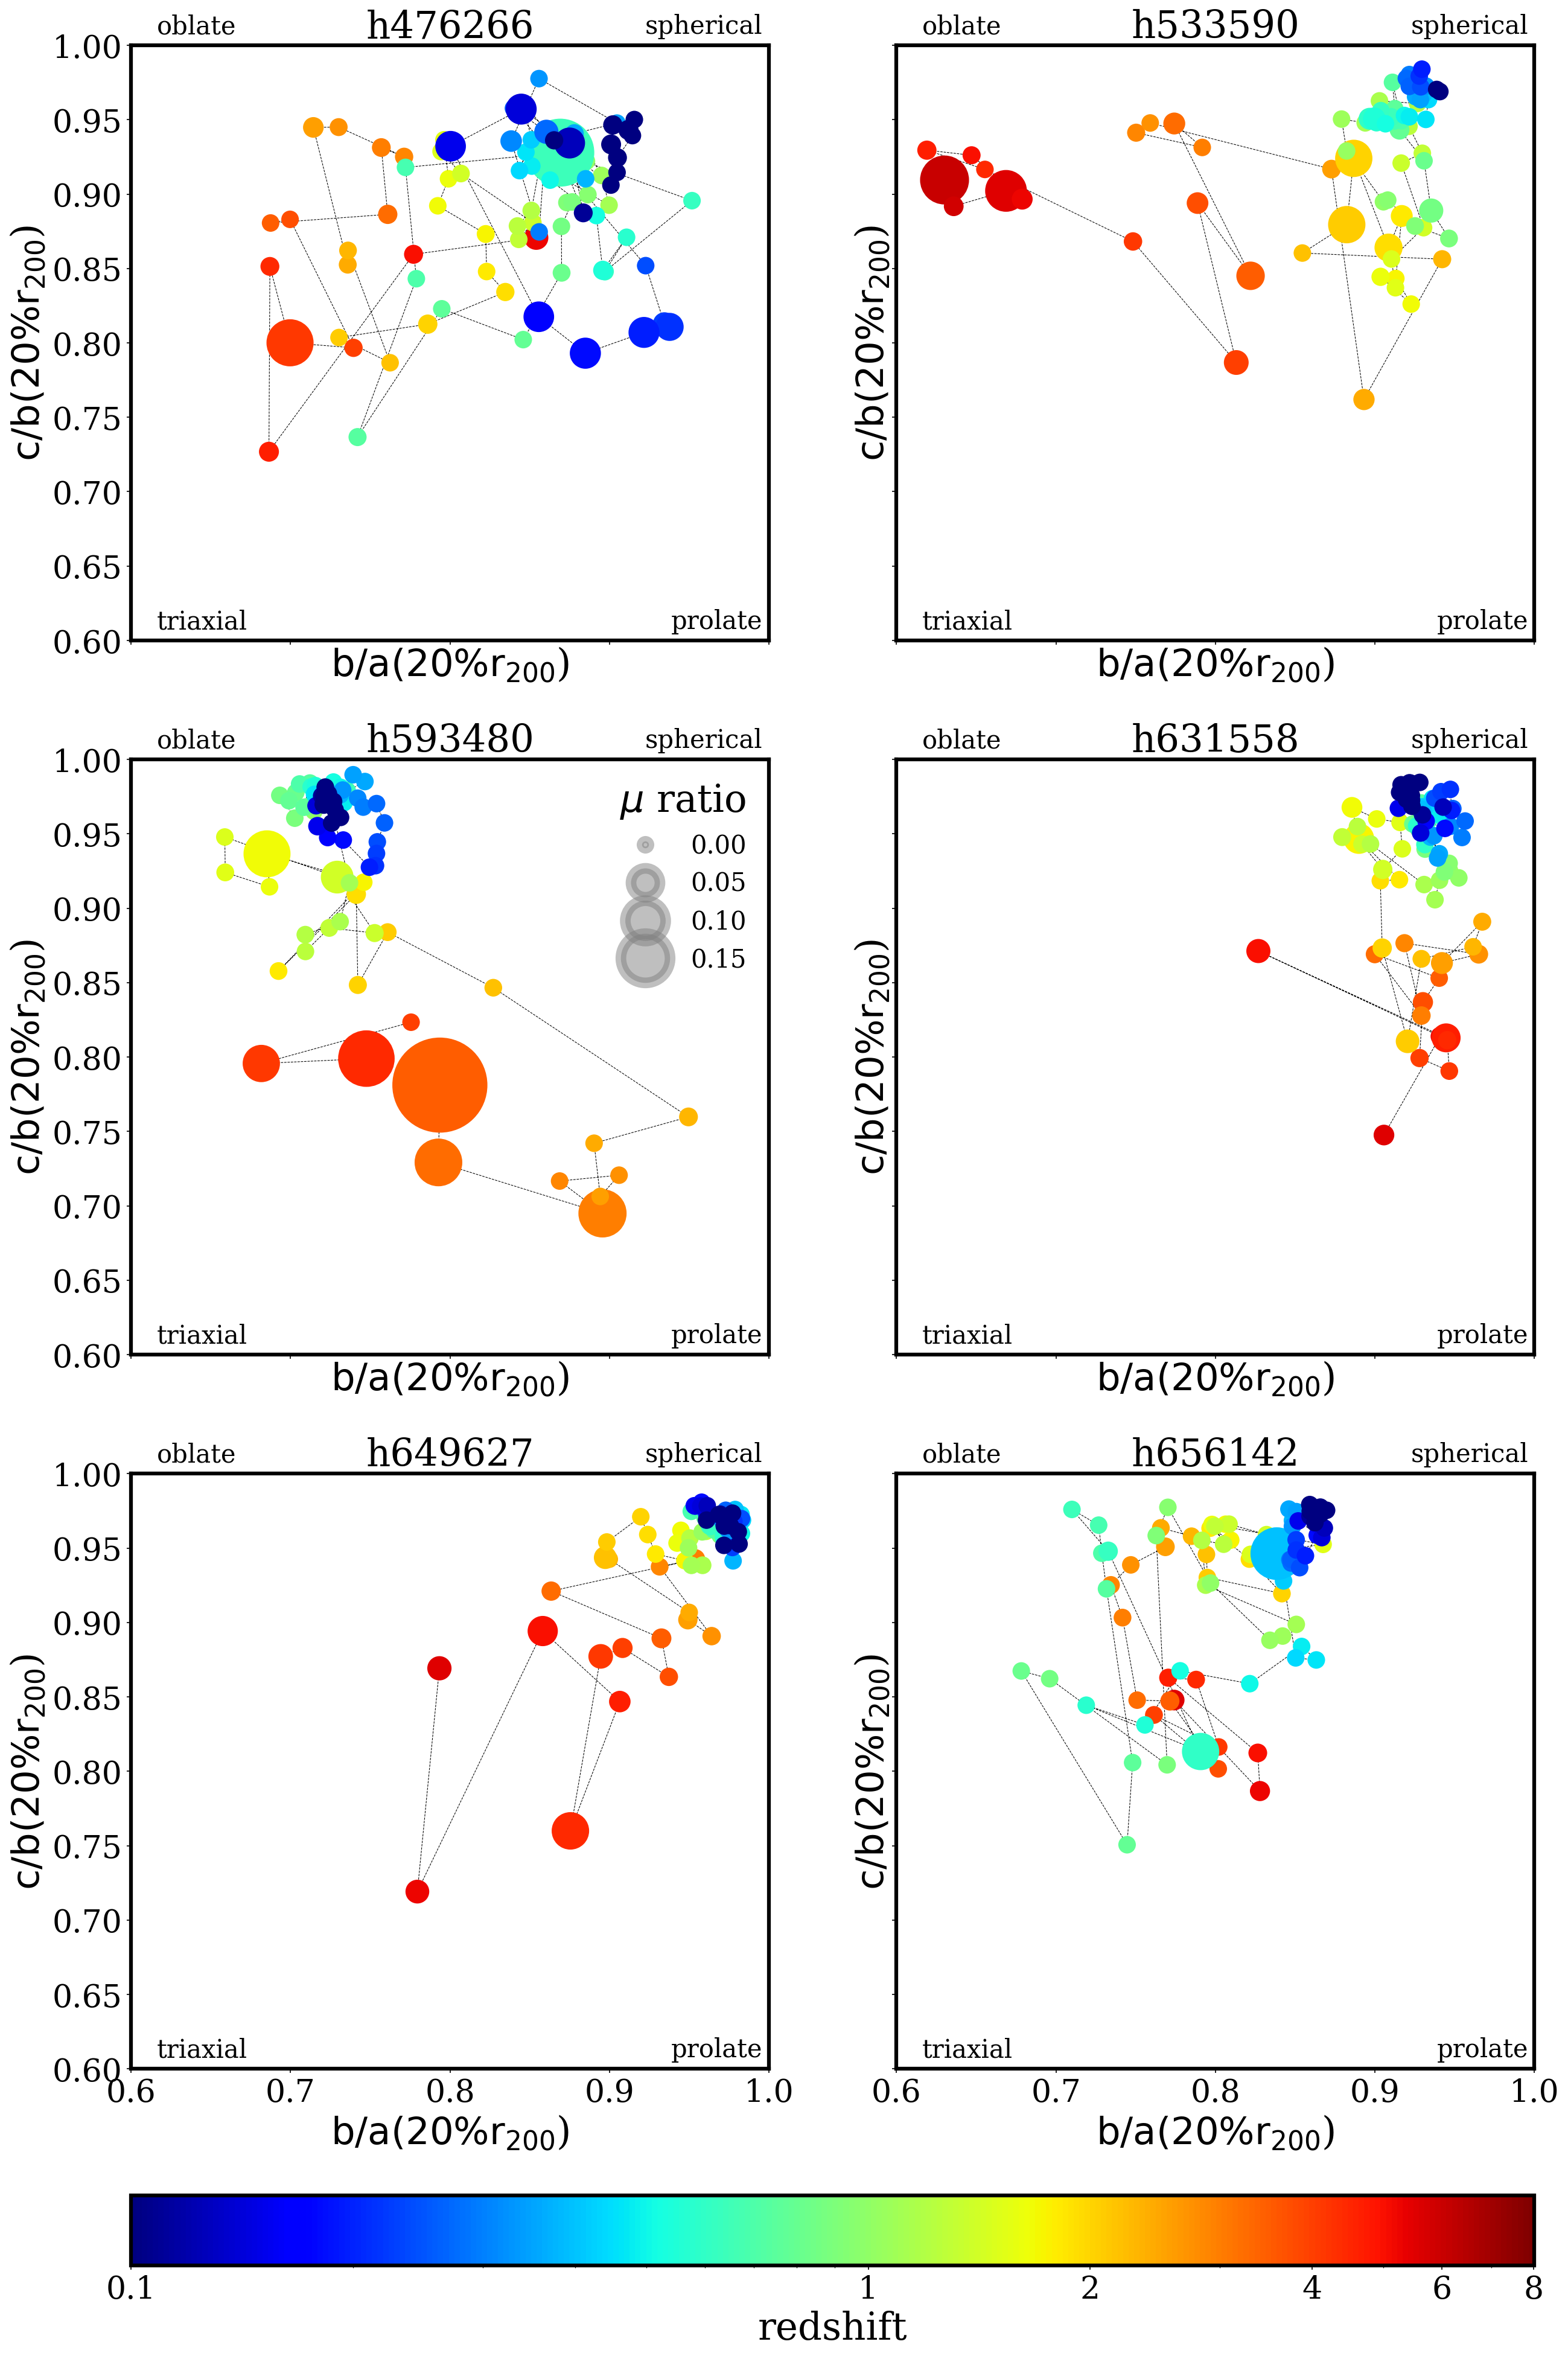
The morphology of DM haloes, although varies greatly, presents a trend in the sense of haloes being more spherical in more recent times. These trends are clearer in cielo than TNG50 samples. The effects of recent major accretion (h4469) and recent merger activity (h47626) were found with larger dispersion reaching lower redshifts, although with a path to more spherical shapes.
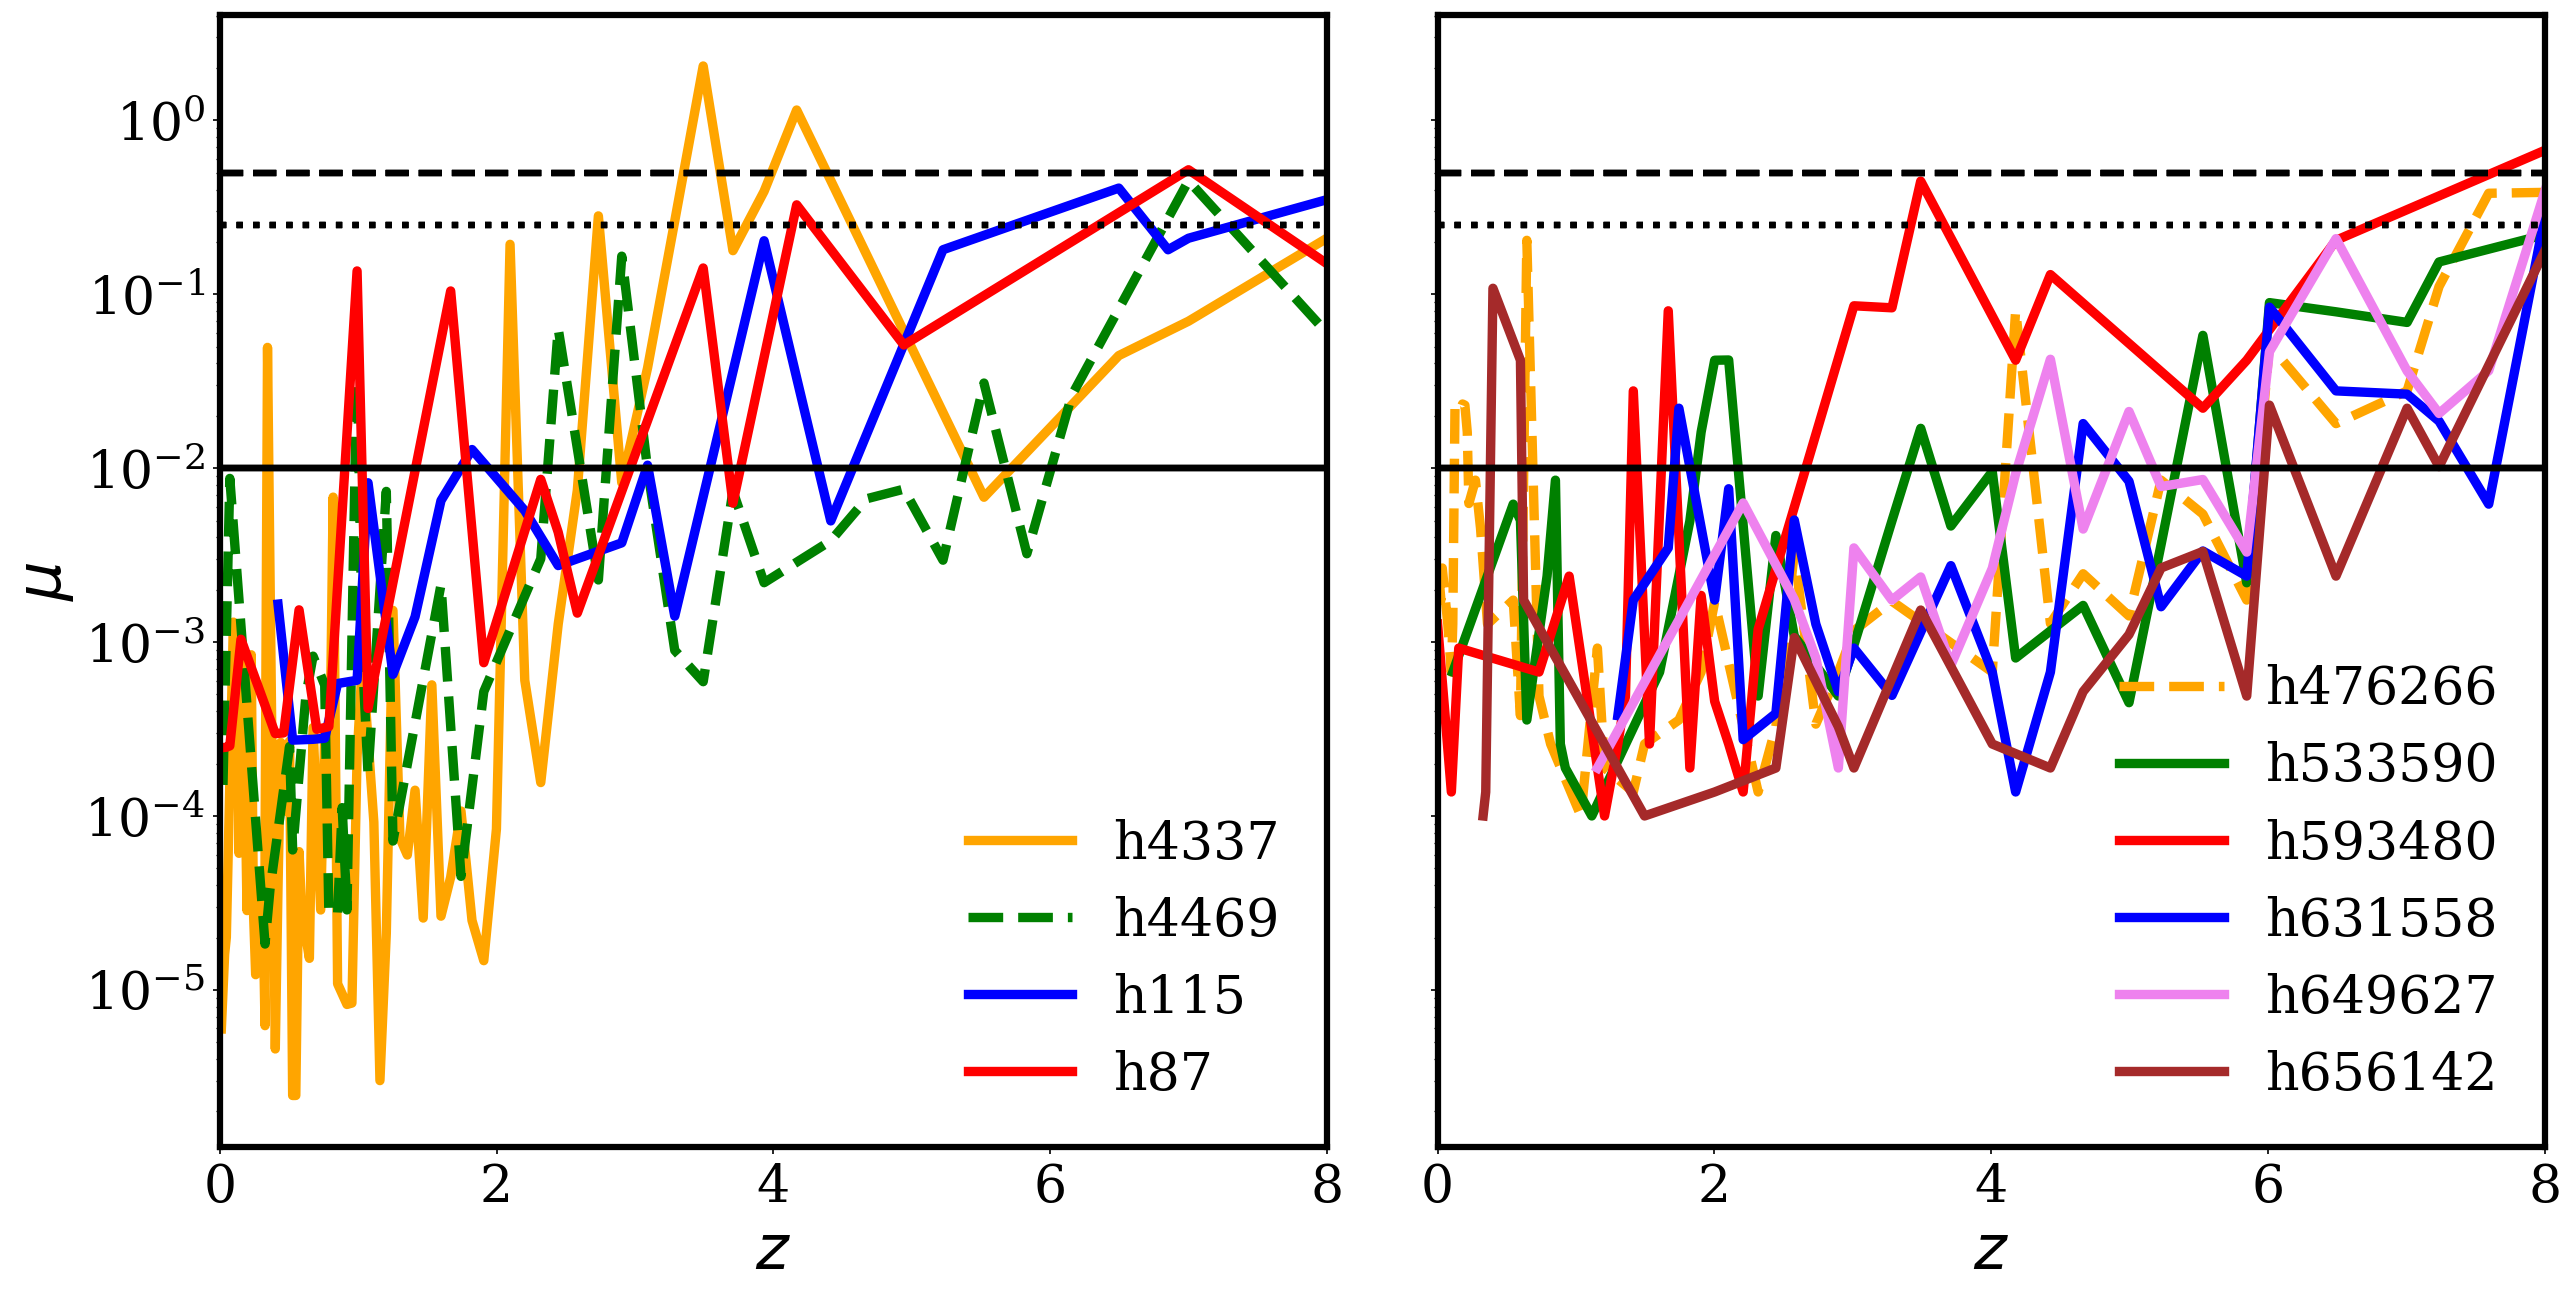
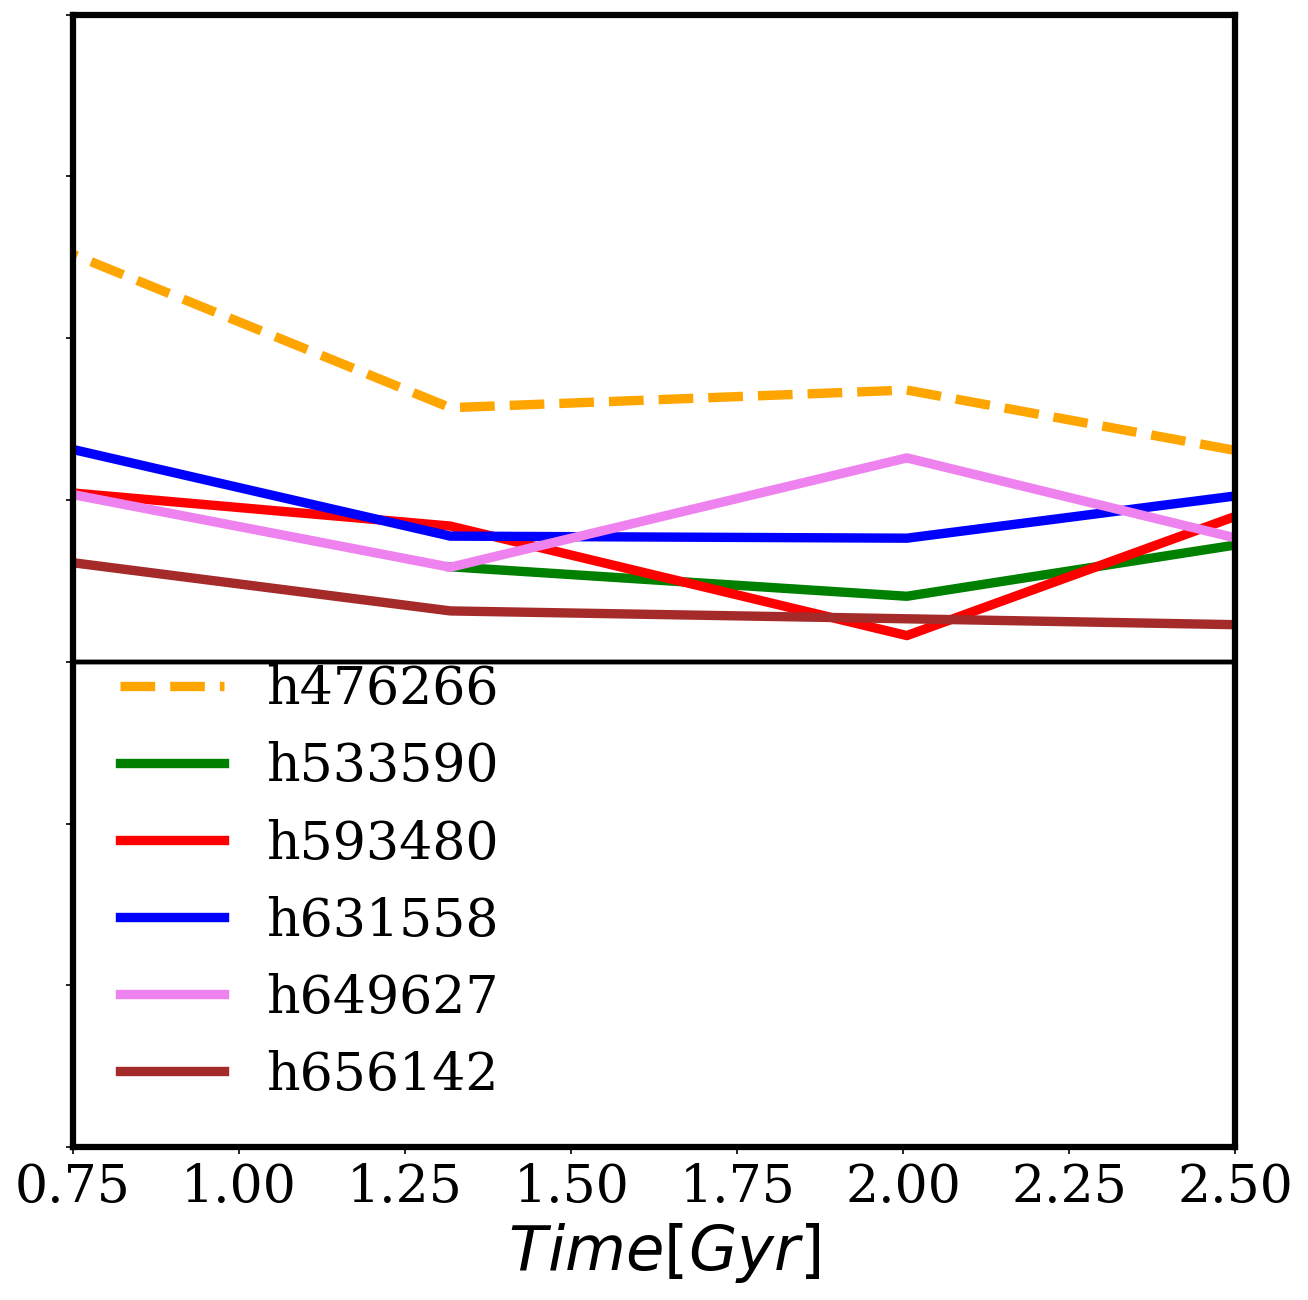
Fig. 8 shows the evolution of the merger stellar ratio, , across cosmic time for all selected haloes in each simulation. The last major events () occurred at in the case of h4437 and at for the rest of cielo haloes. In the case of TNG50, the last major event is reported at for h593480 and at for the rest of the selection.
The differences in merger histories between cielo and TNG50 could be explained due to the different environments for halo selection. cielo haloes were chosen to correspond to an analogue environment of the Local Group. In the case of TNG50 haloes, there were no environmental constraints. The difference in where the haloes were embedded in the cosmic web, leads to a higher merger activity for the TNG50 at late times, which results in a much wider variety of morphologies configuration at .
Although being evident that recent major merger affects DM shapes, the exact connection is not yet fully understood. However, it is clear that the structure of individual haloes is closely related to their merger history. Shape changes, for instance, have been linked to the properties of the last major merger (e.g. Despali et al., 2017) and the remnant has been found to be elongated along the merger axis (e.g. Macciò et al., 2007; Vera-Ciro et al., 2011).
We also find that haloes with greater changes in morphology through redshift are correlated with the number and importance of the merger events. This effect is even more significant for h476266 in TNG50 with recent merger activity. Mergers can be followed by slow accretion along filaments until the cluster ends up in a relatively viralized final phase with a nearly regular and spherical shape. For recent redshifts (see blue dots Fig. 6 and Fig. 7), the merger activity weakens for both simulations and in consequence the relaxation times increase, contributing to more spherical shapes.
3.3 Effects of mass infall
In the previous section, we discussed two main physical processes that contribute to halo shape evolution: the condensation of baryons in the inner regions and the infall of matter in the outer shells of the halo. While the presence of baryons tends to round up the halo, the infall through filaments produces differences in axis length and, in consequence, contributes to more elongated ones (Despali et al., 2014; Gouin et al., 2021). In this section, we discuss the influence of the cosmic web environment on the DM halo shapes.
Using N-body simulations, previous studies investigate the correlation between the environment and shape of haloes (e.g. Libeskind et al., 2011; Vera-Ciro et al., 2011). DM haloes grow over time fed by the surrounding density field, through continuous injection of matter. This accretion may be secular or in a series of more violent mergers.
Through the virialization process, each halo acquires a new equilibrium configuration as new material is accreted into the gravitational potential well. The preferential direction of the infalling material in the cosmic environment is usually given by the filaments, whereas a more isotropic mode is expected when the halo is embedded in a large structure (e.g Wang et al., 2011; Vera-Ciro et al., 2011; Shao et al., 2021; Baptista et al., 2022).
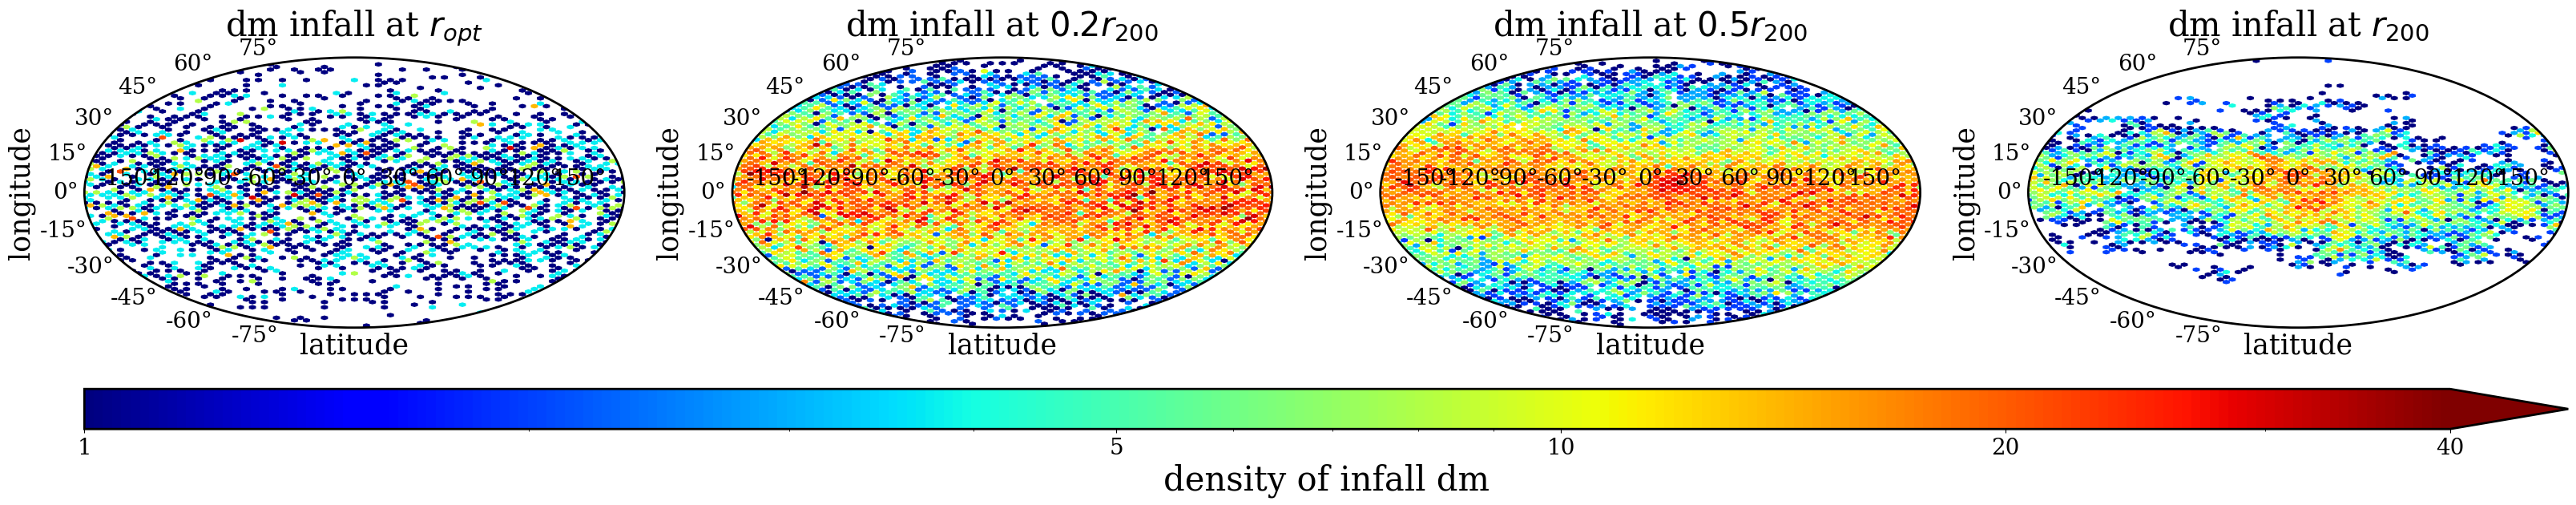
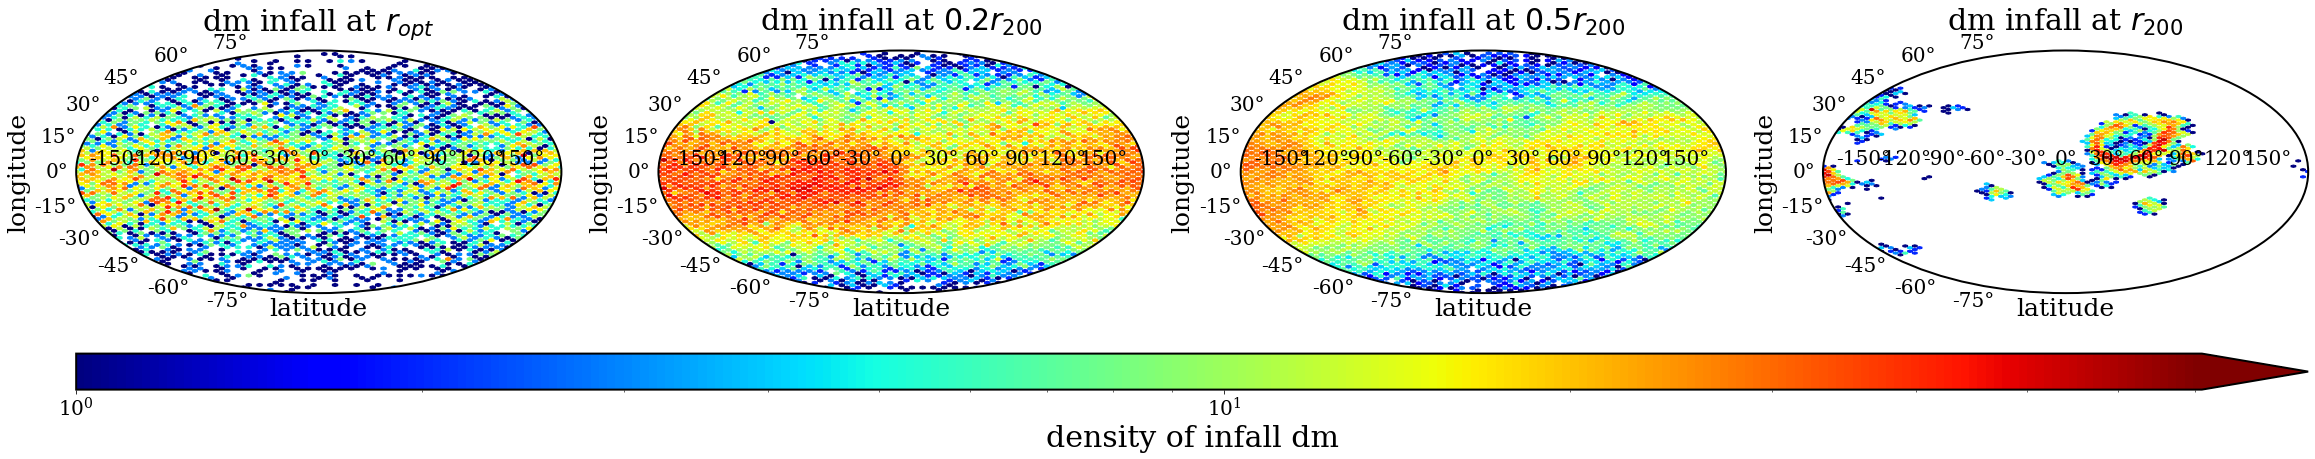
As an example of the aforementioned, we show in Fig. 9 the Aitoff map of the projected DM particles infall at for two haloes, h4377 from cielo (top panel) and h593480 from TNG50 (bottom panel). The map projected is centered around the stellar disc frame. At each output time, we select particles with negative radial velocity pointing towards the center of mass of a halo, (infalling particle), in different spherical shells: 111The optical radius, , is define as the radius that encloses 80 percent of the baryonic mass (gas and stars) of the galaxy., , and .
Regions, where the infalling material is larger at a given redshift, correspond to regions with a major overdensity (e.g., Libeskind et al., 2011). As a result of this, the density retains the configuration of where the mass was accreted. Albeit weaker with decreasing radii, the self-similar patterns across the four shells are present, as the accreted material goes from outer radii to more central regions.
This different form of material infall to the haloes structure follows a specific distribution on the sky. For instance, whereas isotropic accretion would indicate a uniform signal in the sky, a bi-modal distribution of points in two opposite directions would lead to the presence of a thin filament (Tormen, 1997; Colberg et al., 1999; Libeskind et al., 2011; Vera-Ciro et al., 2011). A multipole expansion of the infalling particles in the sky at a given time could be quantified through the power spectrum for the mode :
| (3) |
where the expansion coefficients are,
| (4) |
where the subscript indicates the -th particle crossing the chosen shell in the specific angular position, with a negative radial velocity (). The number of particles, N, can be represented with .
The term is the monopole, representing in this scheme the isotropic accretion. The corresponds to the quadrupolar moment, meaning that the accretion occurs through a well-defined direction in the space. Similarly, accretion corresponding to more than one preferential direction will shift the power towards higher moments. When a satellite occupies a large area of the sky the configuration will then resemble a dipole and the power spectrum will exhibit higher power in the mode (Vera-Ciro et al., 2011).
We describe the infall of DM particles and the self-similar distribution across a large radial extent. We take the outskirts of the chosen shells (at ) and compute the corresponding amplitude () of the spherical distribution. For a given DM infall particle with coordinates, (longitude) and (latitude), we evaluate the spherical harmonic function for a given . The distribution of the infall particles can be approximated by a smooth angular surface density constructed by summing over all and up to according to the following equation
| (5) |
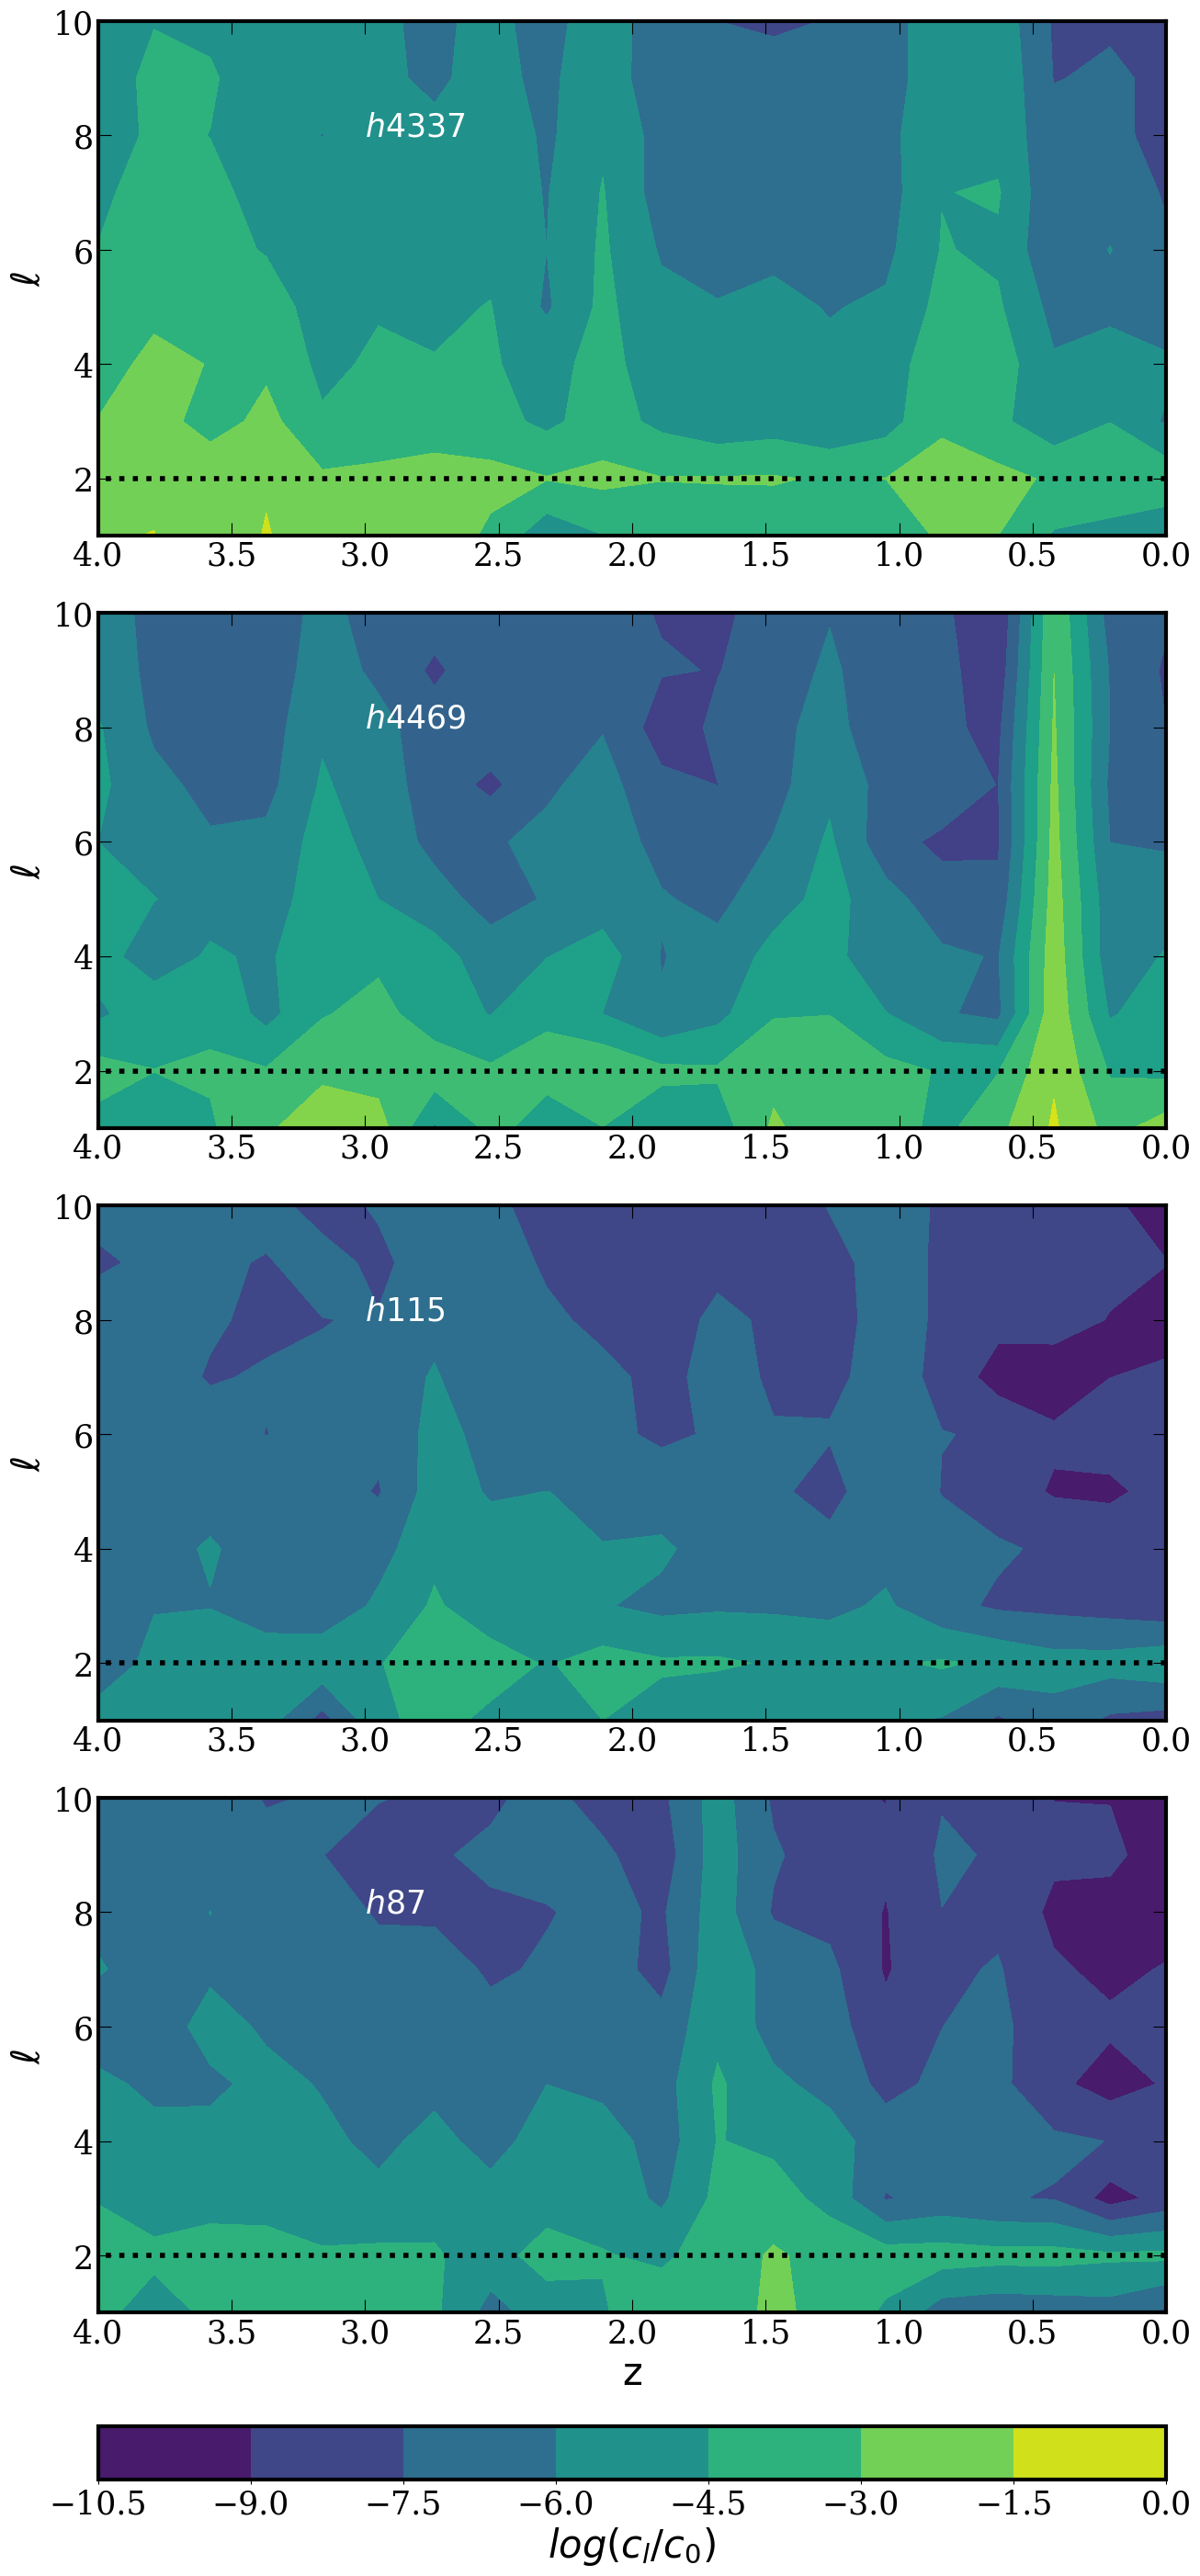
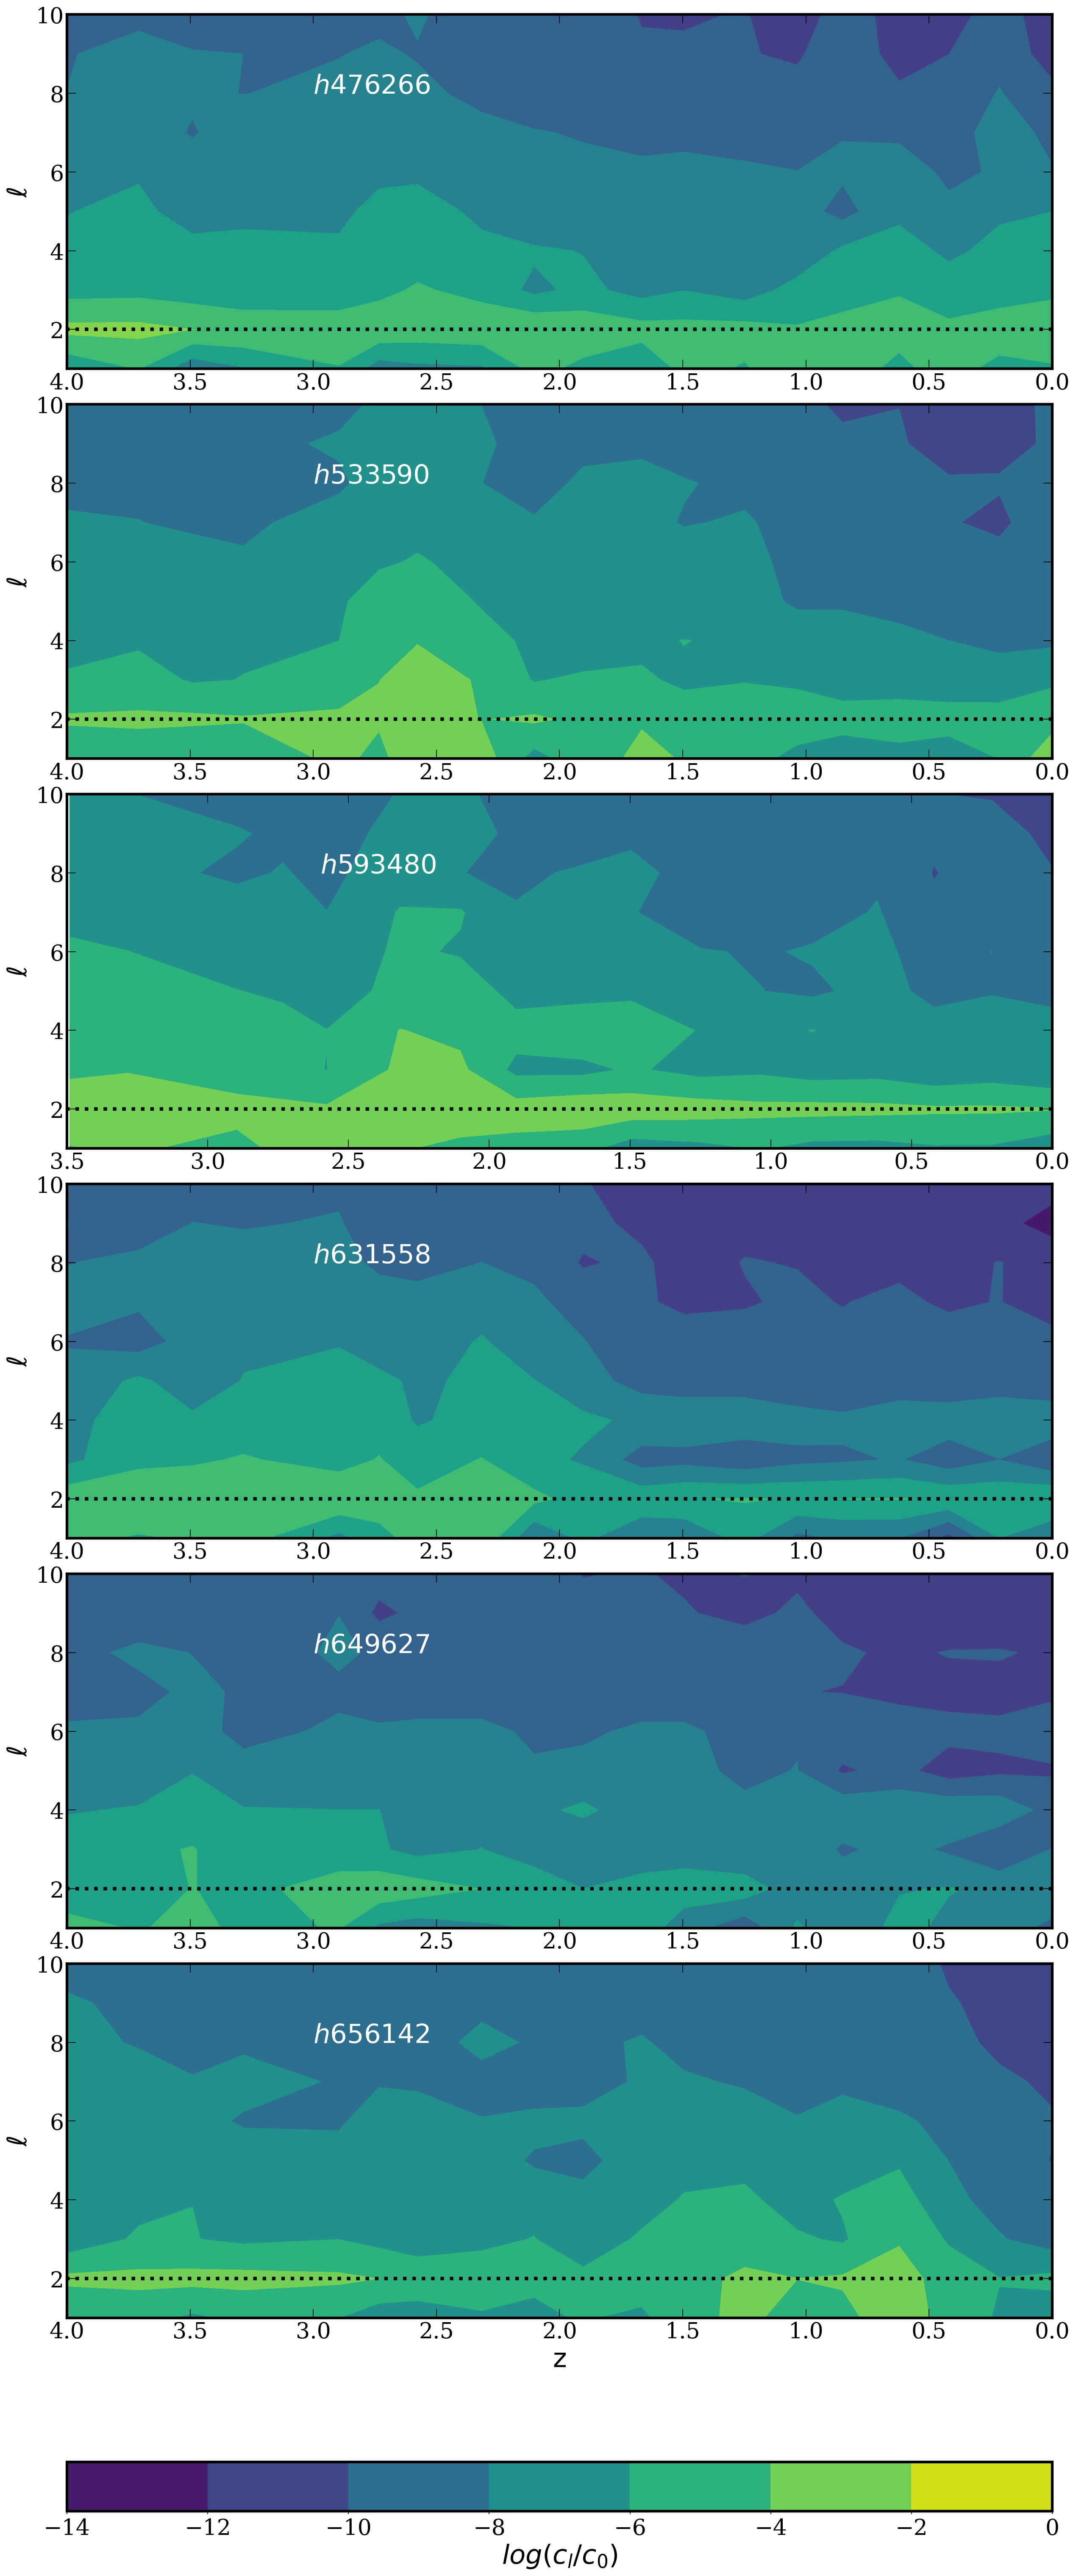
In Fig. 10 and Fig. 11 we show the multipole expansion of the infalling material () in the region as a function of redshift for cielo and TNG50 haloes. The color map are coded in terms of ). In all haloes, the monopole mode is the dominant configuration of infalling material, followed by the quadrupole (, i.e filaments). The strength of the filament varies across haloes and redshift. Compared to the smooth accretion, we expect that satellite infall events to excite a wide range of modes with similar power. Major accretion such as that of halo h4469 at is reflected by a rapid peak excitement across all modes (see also Figure 8).
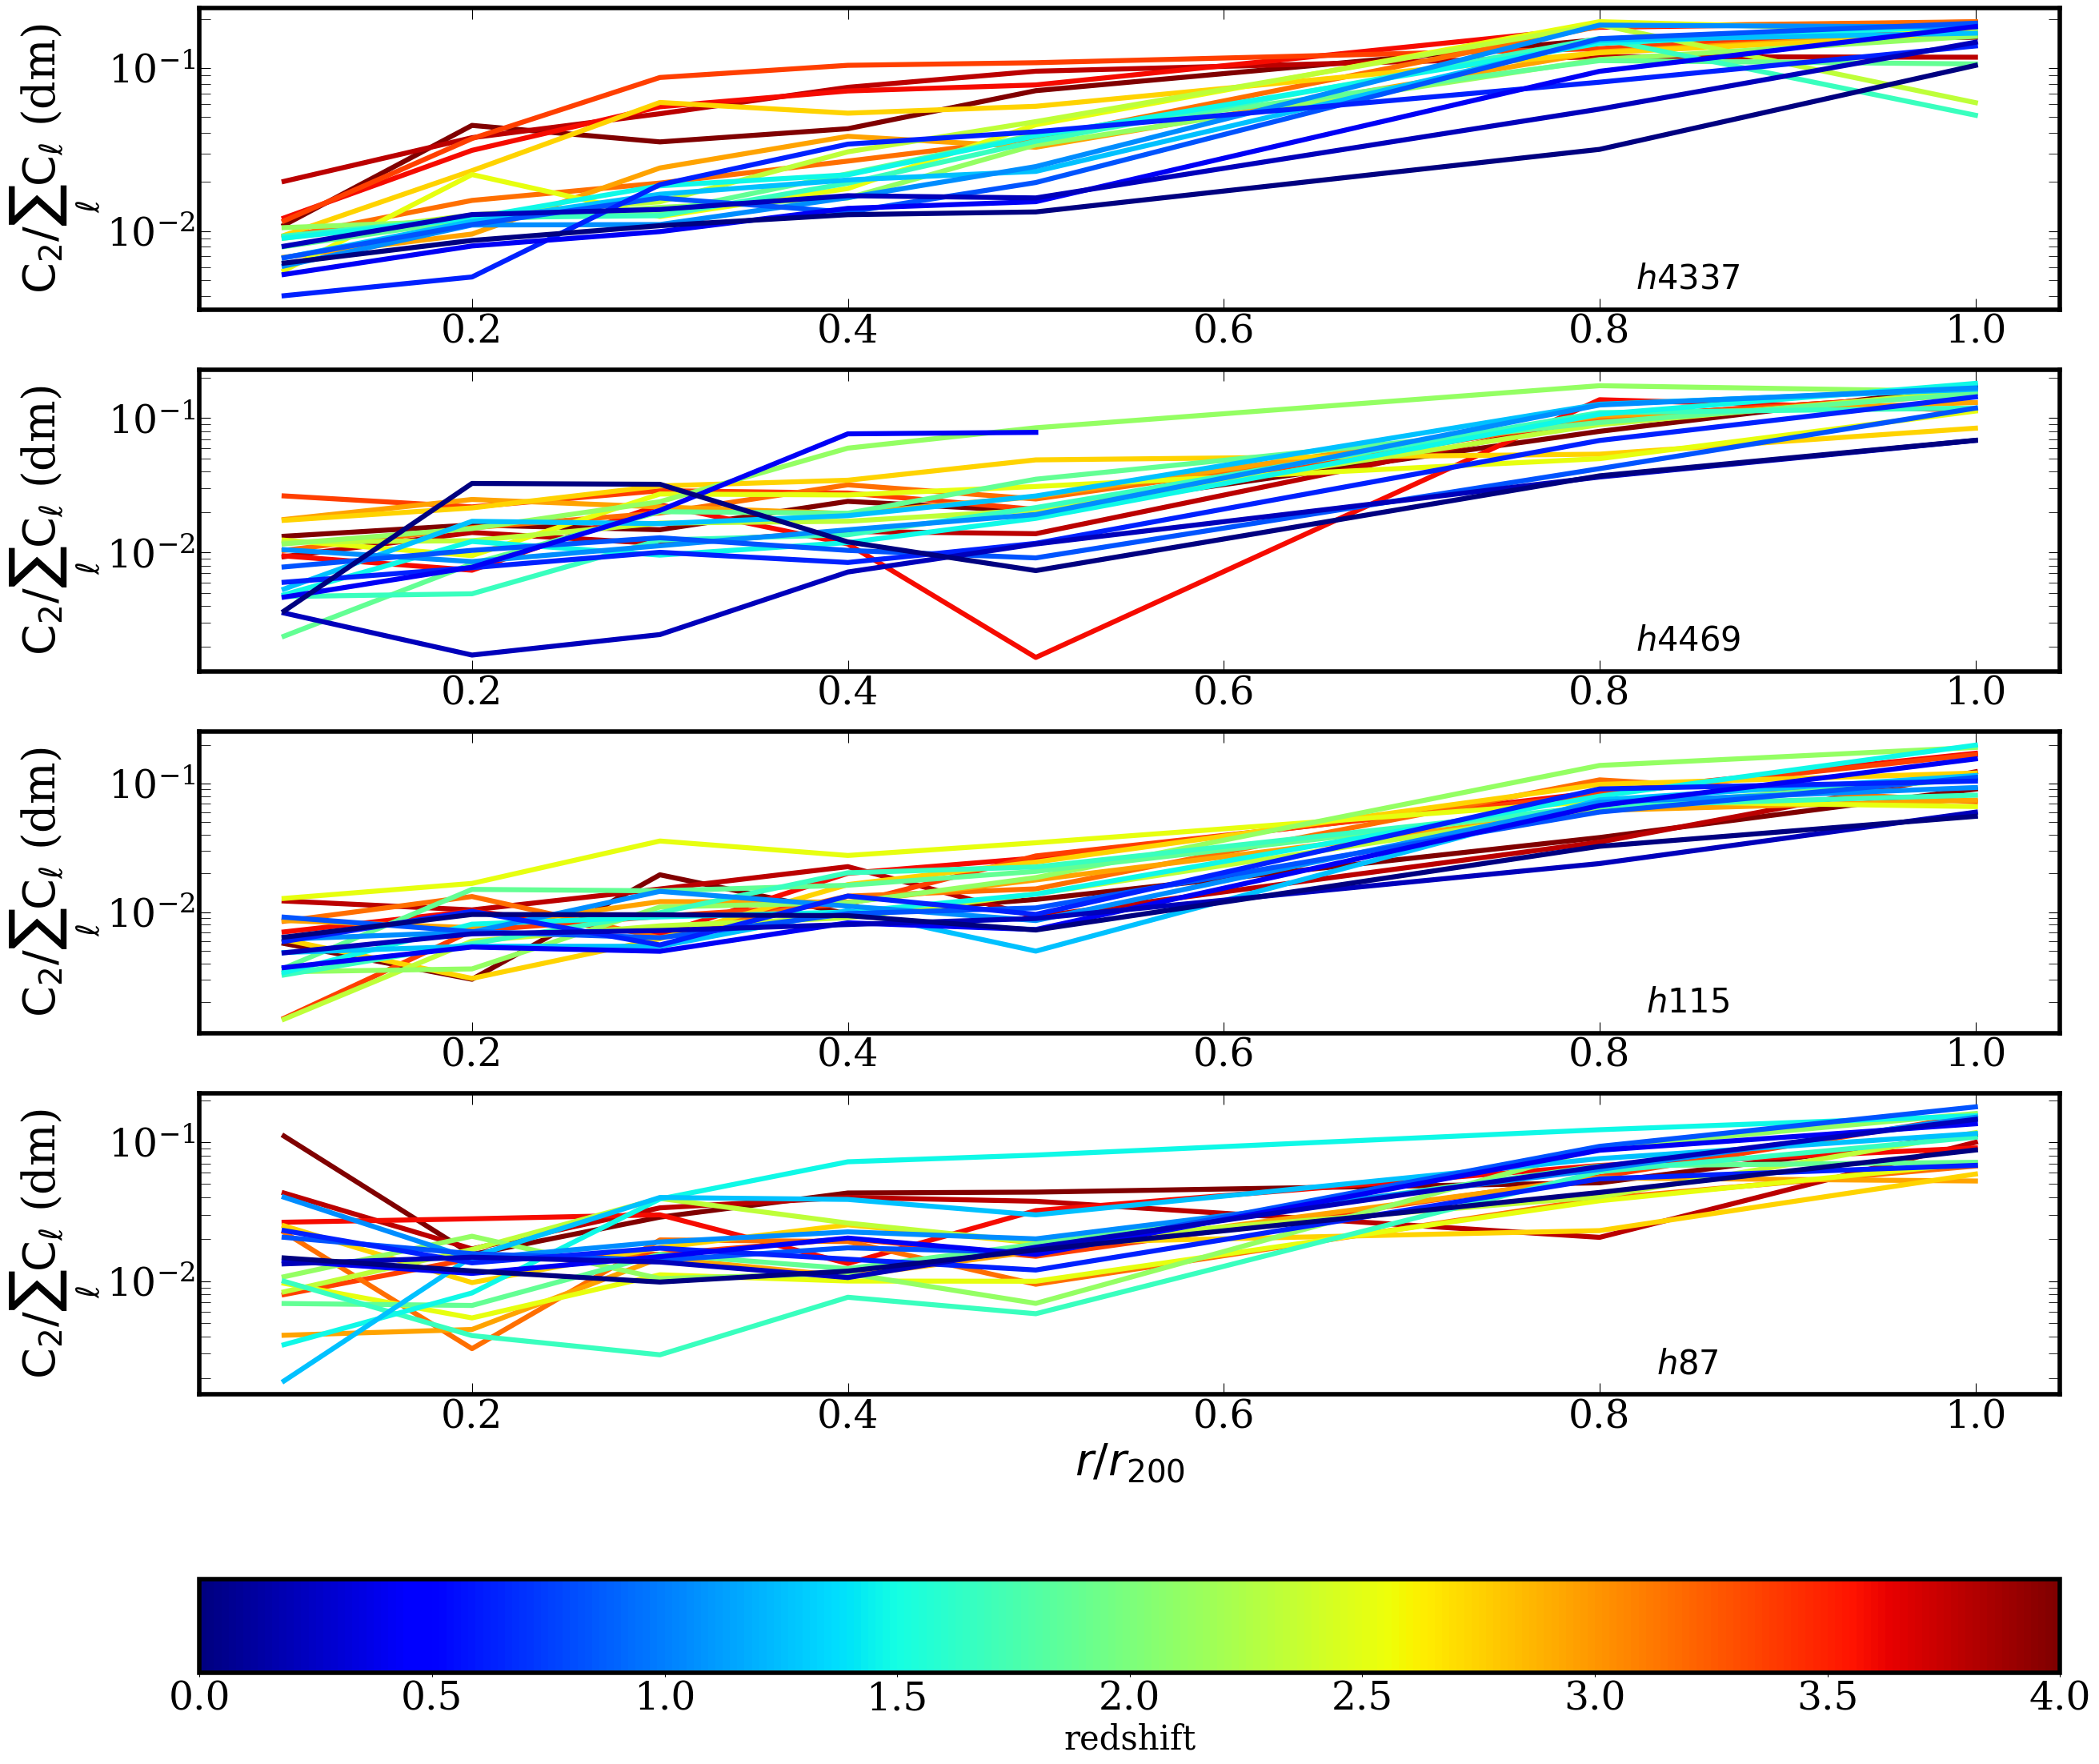
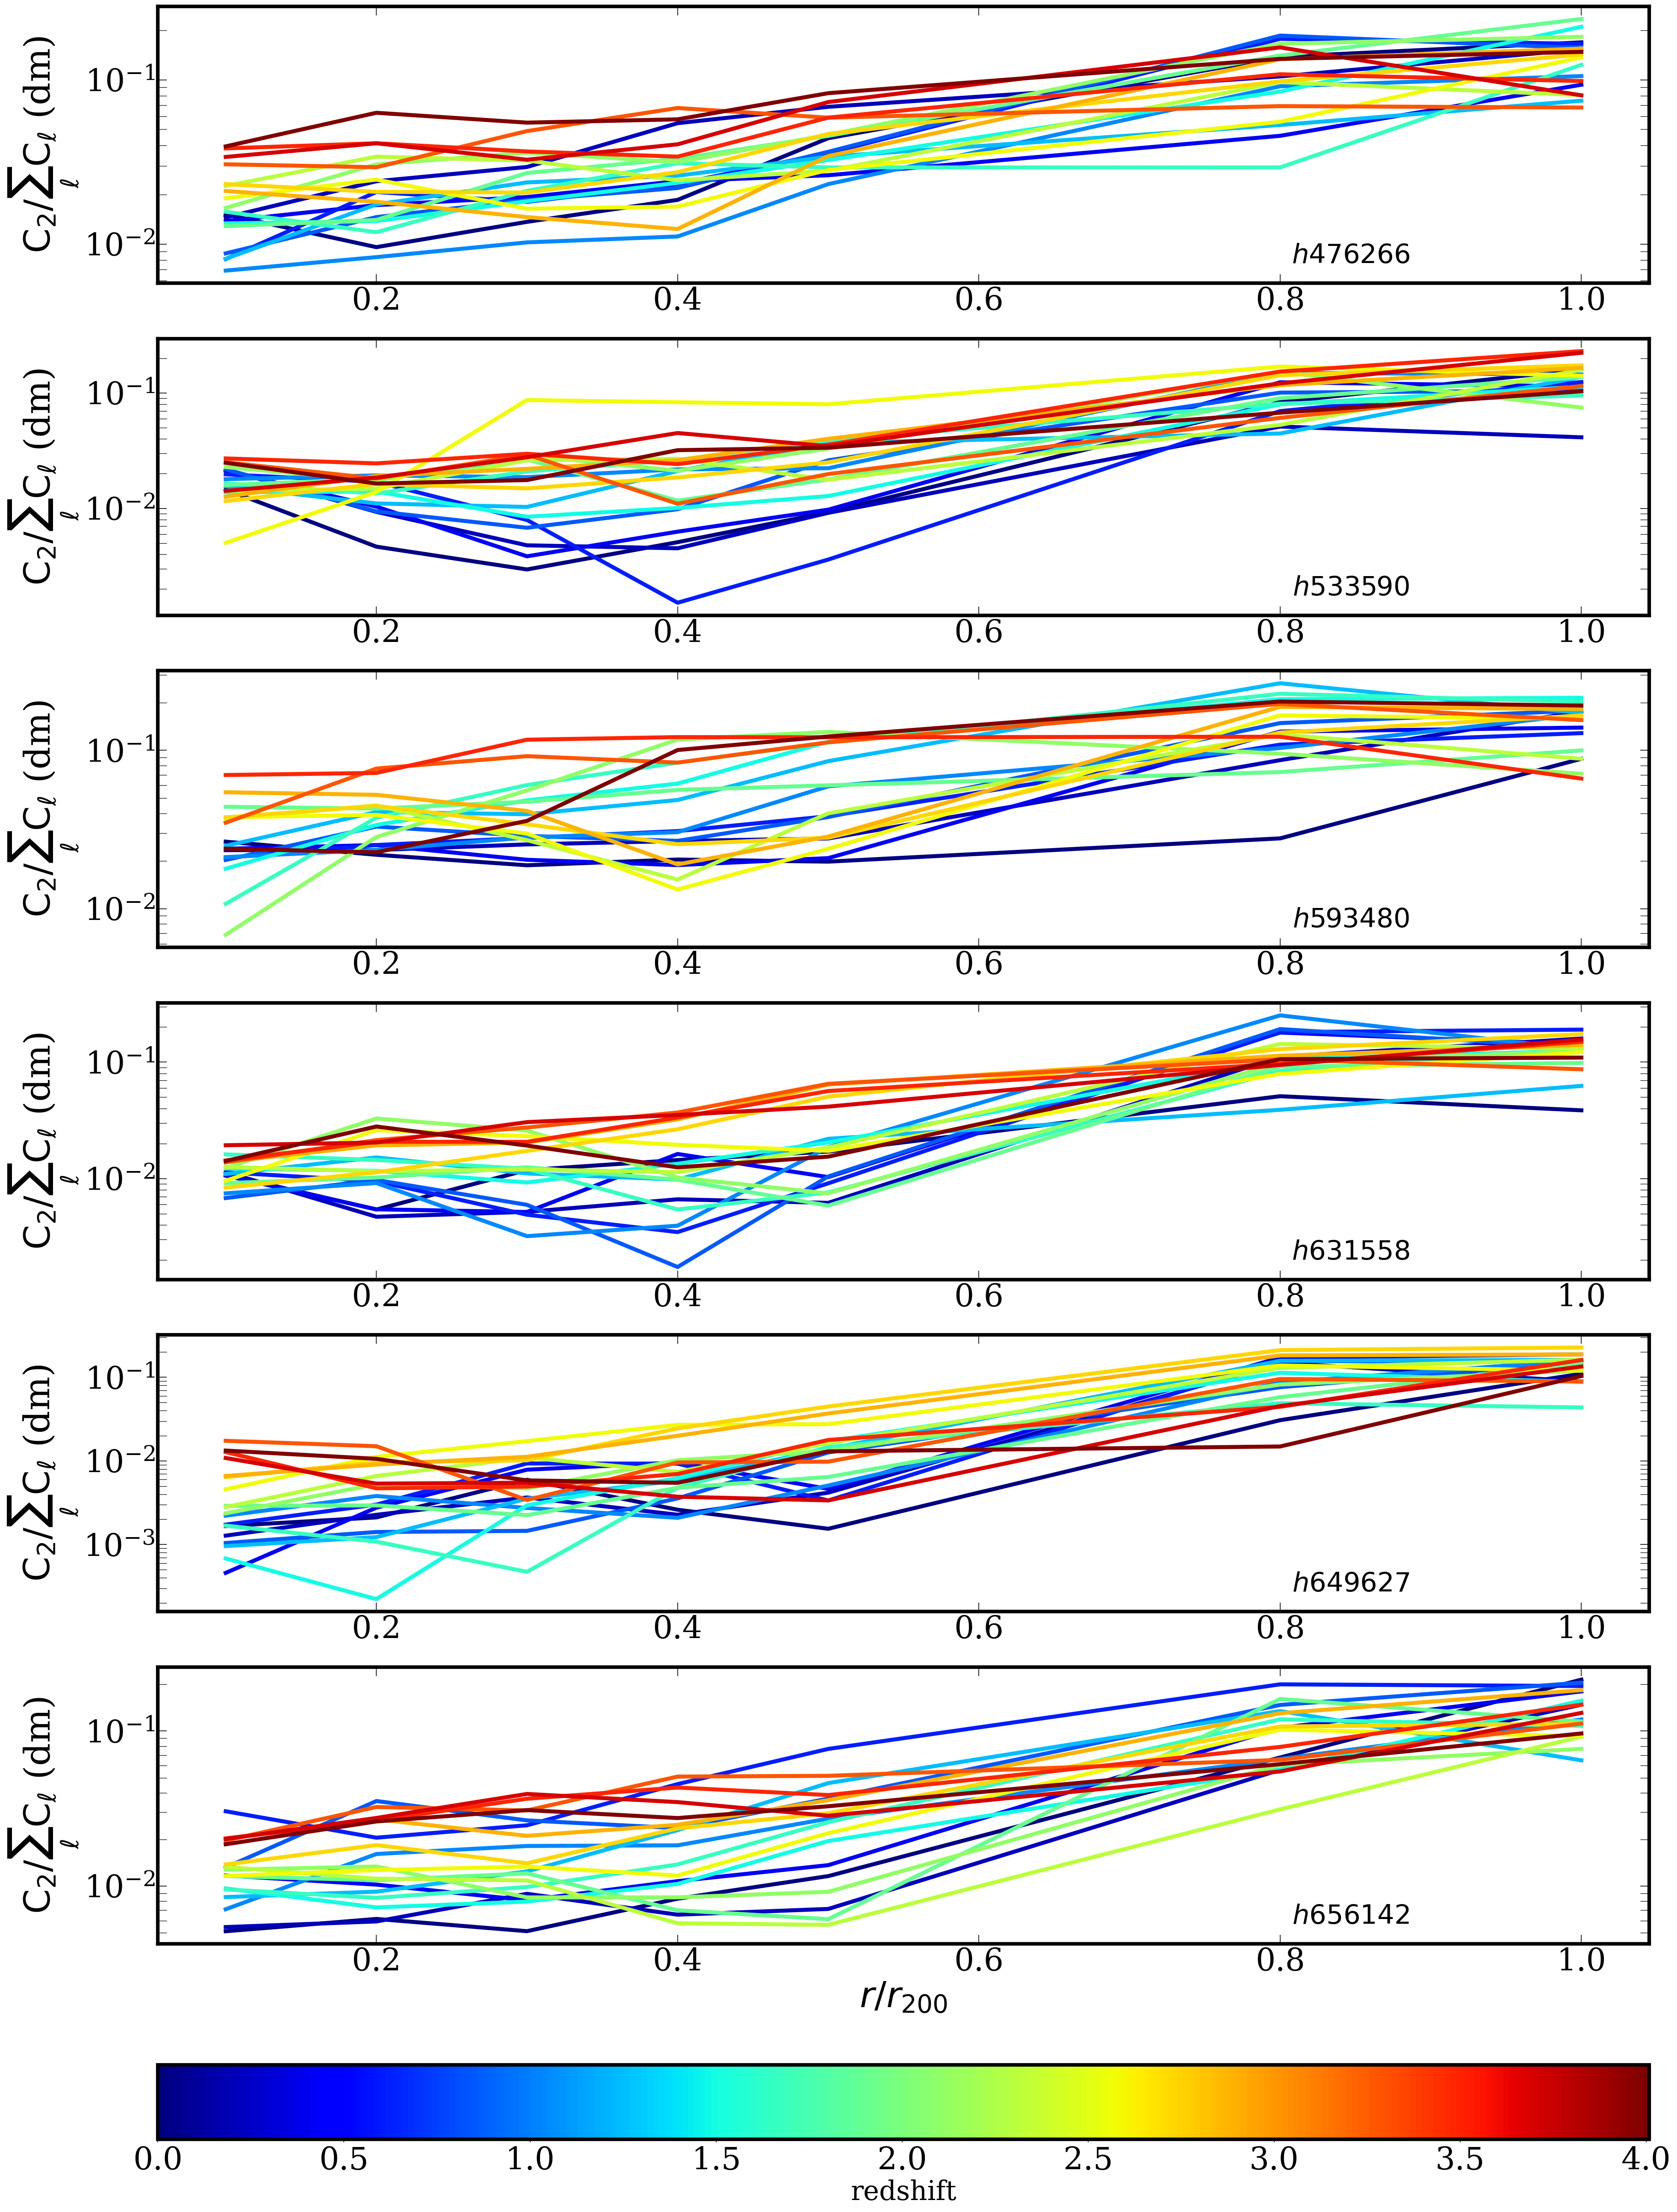
Fig. 12 and Fig. 13 show the evolution of filament strength by quantifying the relative contribution of the mode to the total power spectrum () as a function of . In each panel, the lines represent different redshifts. The quadrupole strength decrease with radii. In central regions, the motion of the DM particles is expected to be dominated by other velocities configurations (e.g. tube orbits Zhu et al., 2017). Additionally, in Fig. 12 and Fig. 13, at , the quadrupole strength decreases steadily with redshift.
The filamentary structures and the connectivity of the more massive hence largest and latest formed haloes decrease over time (Choi et al., 2010; Codis et al., 2018; Kraljic et al., 2020). For our selected sample, the accretion tends to be more isotropic over time, with a tendency to become more spherical. Even though the filamentary accretion importance weakens with time, haloes with recent merger activity, still accrete at a higher rate than the rest of haloes (see the instantaneous logarithmic growth rate and the formation redshift presented in Fig. A3 in the Appendix section A).
Different physical processes intervene in the evolution in the accretion of mass and in the merger rate: the initial mass and statistics of the primordial density field (Bond et al., 1991), mass and kinematic of subhaloes (e.g. Zhao et al., 2003), and tidal forces (Lapi & Cavaliere, 2011), which are possibly conditioned by dark energy (Pace et al., 2019). The filament () higher strength at higher redshifts can be explain due to the effect of satellite haloes closer to the main one during the late stage of evolution before virialisation (Schimd & Sereno, 2021).
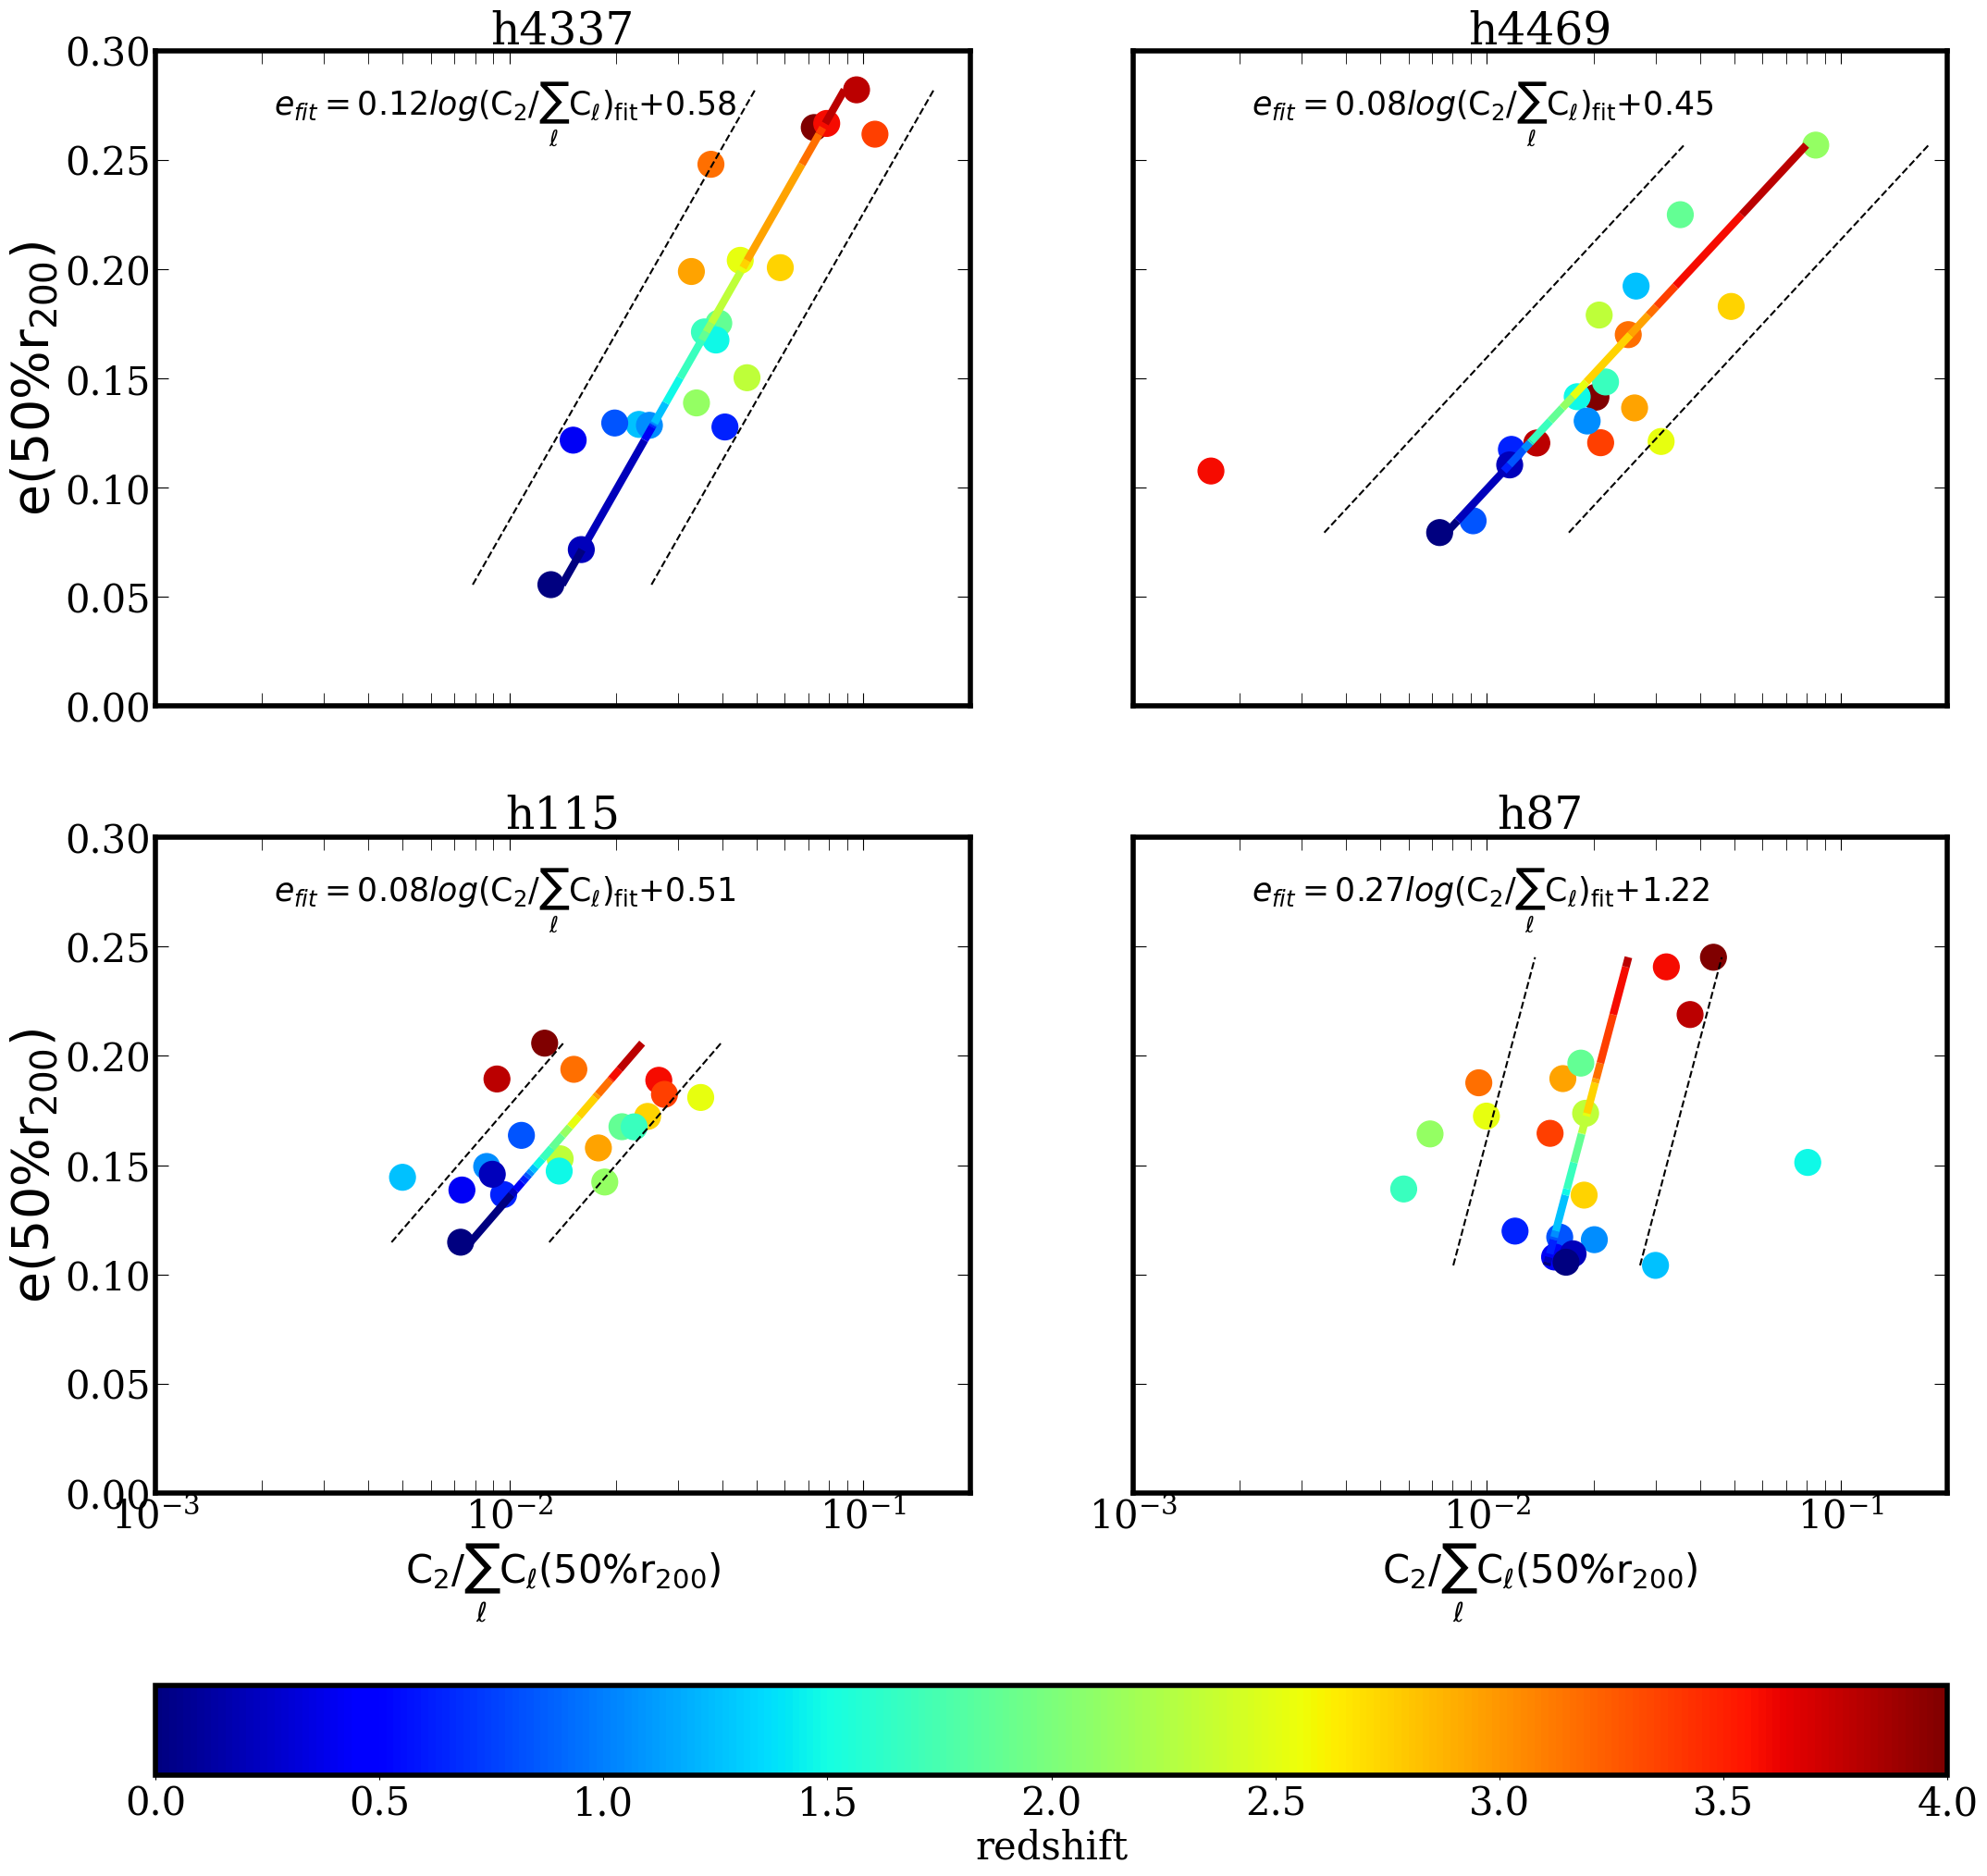
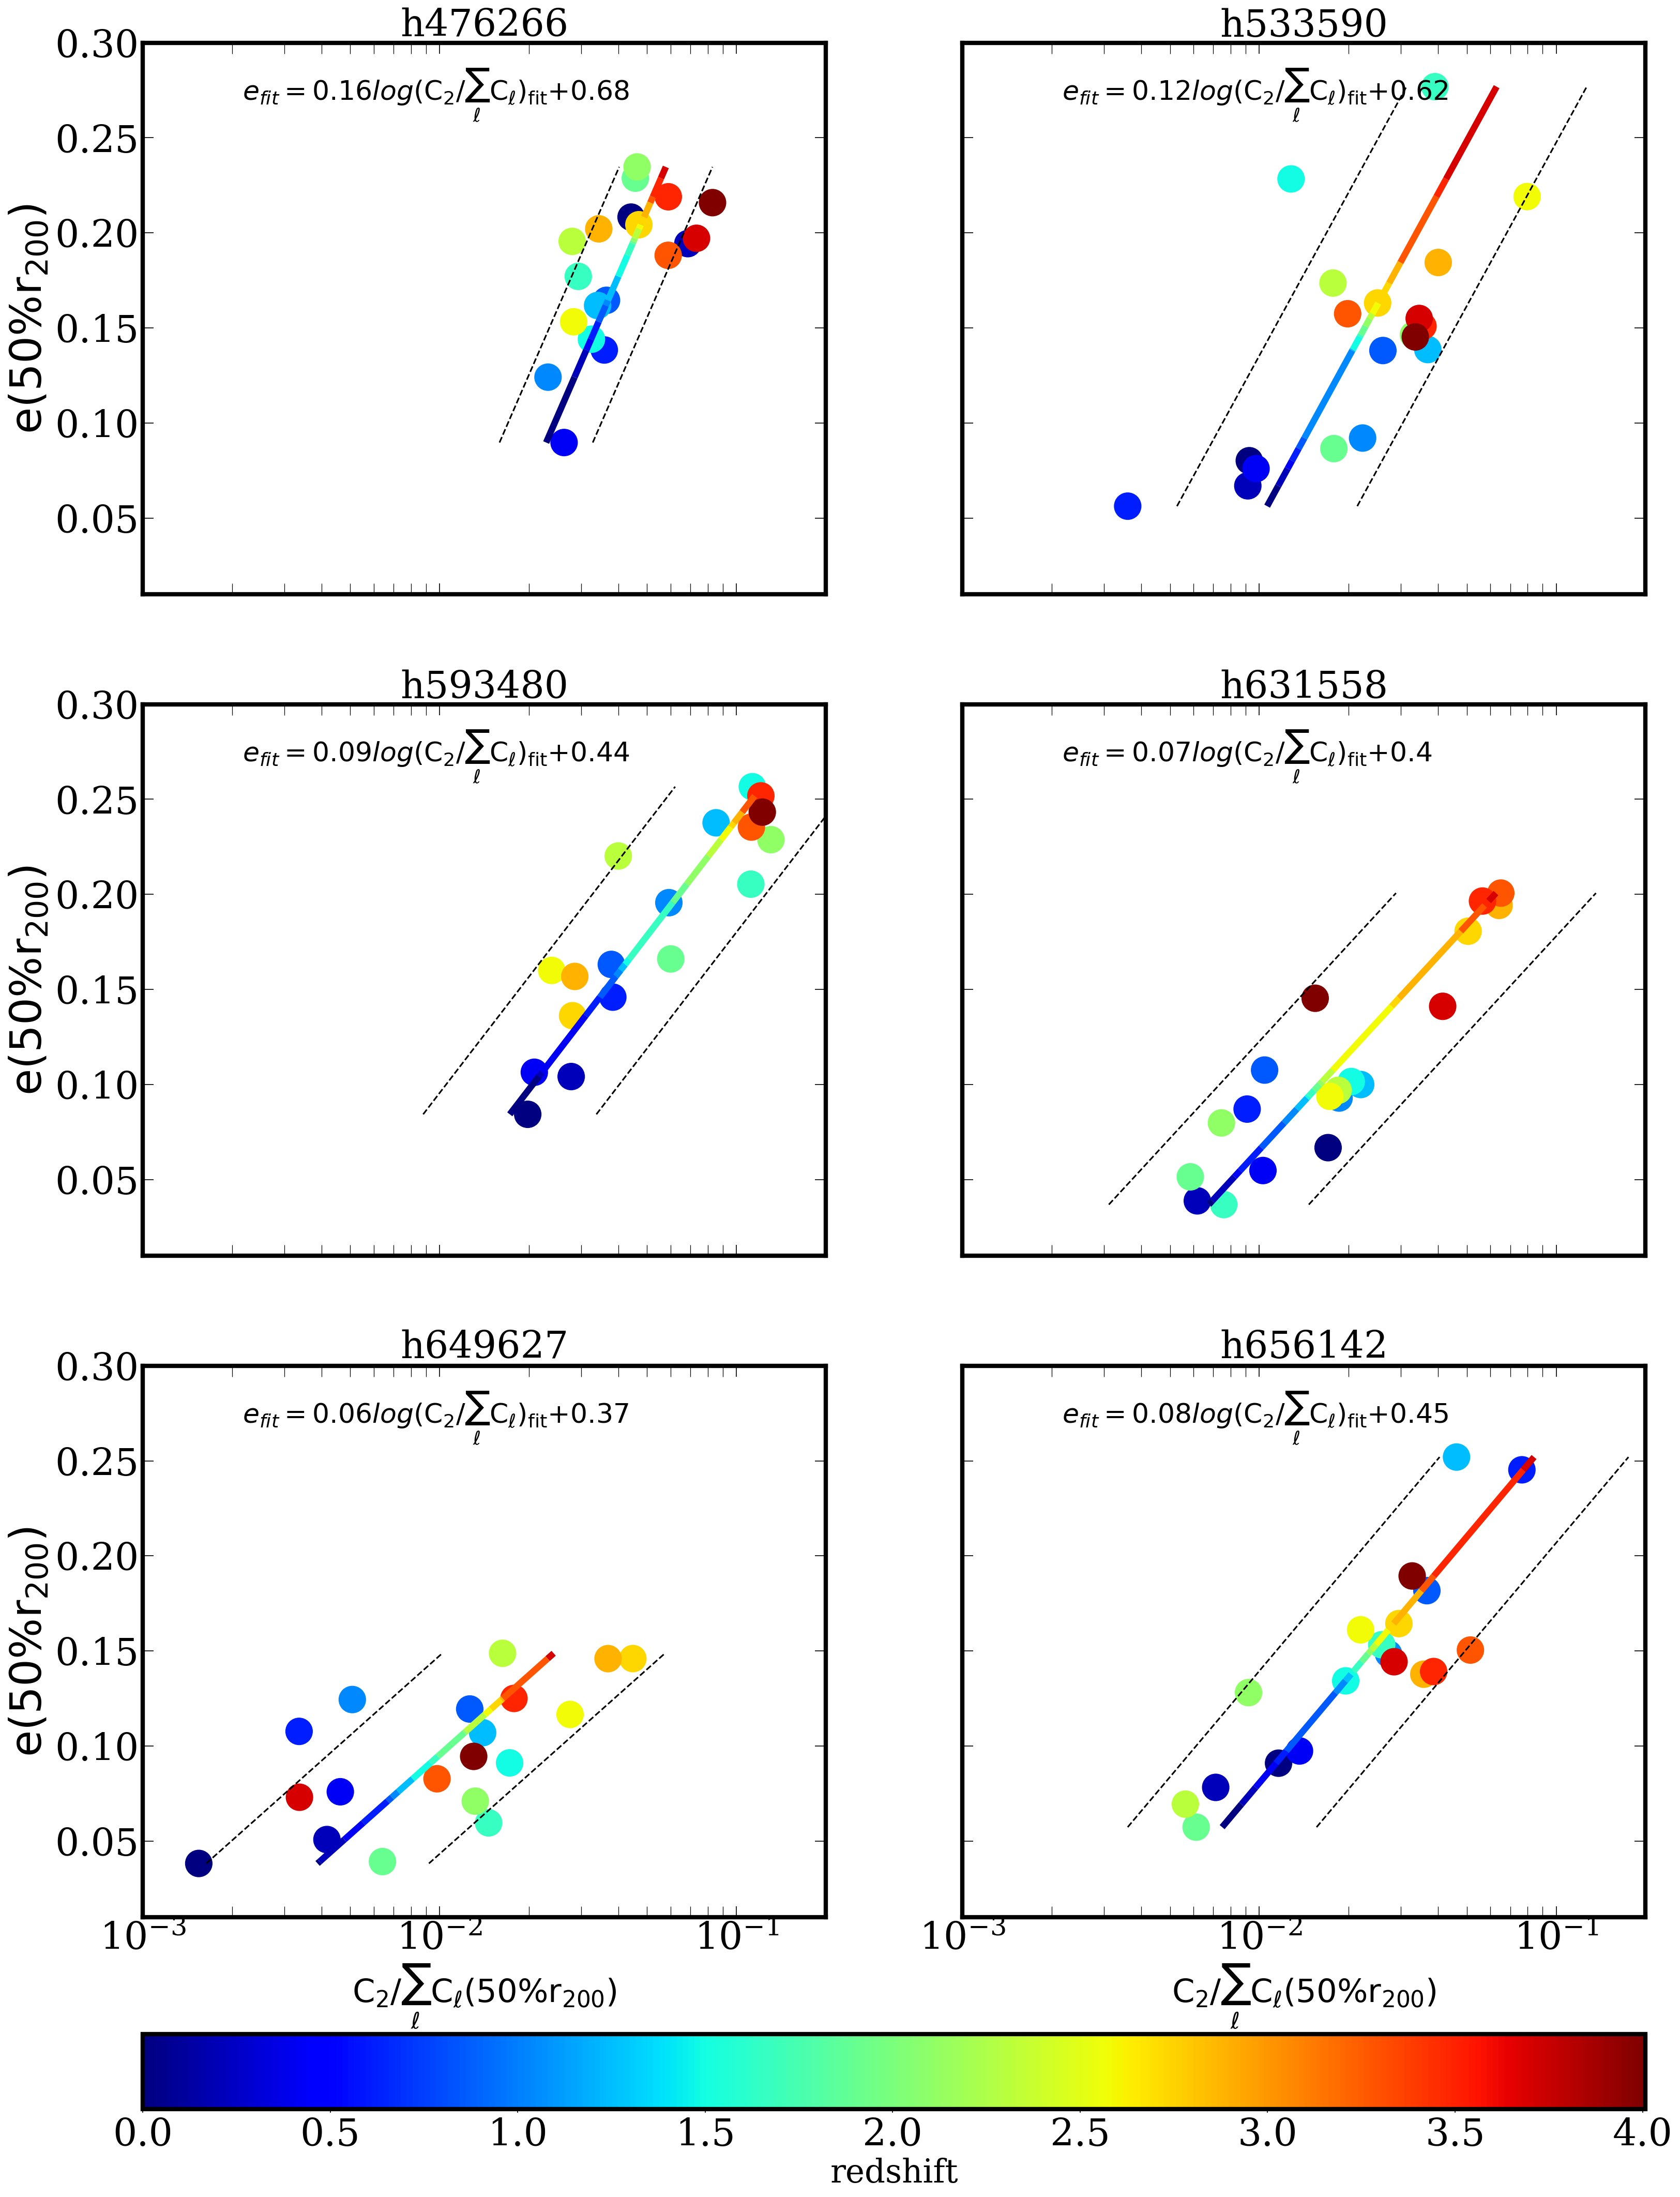
In order to find a connection between filamentary accretion and ellipticity, we shift our analysis from to outer regions , where the filamentary accretion still have a clear signal. In central regions, particle motions are dominated by other physical processes, with a subsequent loss in the quadrupole signal. Accordingly, in Fig. 14, we inspect how the halo shape is influenced by the filament strength at . We perform a logarithmic regression between the ellipticity and . The linear regression yields a positive slope for all haloes. The relation between ellipticity and filamentary accretion suggests that the accumulation of matter in a particular orientation increases the ellipticity of the halo. This connection also has a dependency on time, reflected by the color of the linear regression line in Fig. 14. As the filament strength decreases steadily with redshift, the haloes became more spherical and less elliptical.
4 Conclusions
In this work, we studied the properties of DM halo shapes and the interconnection with the halo assembly evolution. For this purpose, we study two samples from simulations with different subgrid physics implementations: a subsample of MW-like haloes from the highest resolution box of the IllustrisTNG Project (TNG50) and from the cielo zoom-in simulation. We investigate the evolution of the halo shape with redshift and the physical processes affecting them. Our main findings can be summarized as follow:
-
1.
The concentration of the halo density profiles increases at lower redshifts and in more massive haloes. This increment in concentration, a product of both, the baryonic condensation in the inner regions and the relaxation of haloes, decreases when merger events happen. The evolution of halo size experience two different regimes before and after the turnaround point at . The MAH also shows the effects of mergers. Haloes with major mergers in recent times, reach afterward .
-
2.
We find that at more recent redshifts, haloes become less elliptical and in correspondence, more spherical in central regions. Also, haloes evolve to be more spherical/oblate in the inner regions and more triaxial in the outer ones. In the case of TNG50 haloes, this evolution is also present albeit weaker.
-
3.
For all analysed samples, we find that morphology tends to be more spherical as we go towards inner regions at , with different paths for the shape parameter space between haloes. Focusing on (where we expected the halo morphology to maximize their changes (Cataldi et al., 2020)), the evolution of the shapes shows a tendency toward more spherical configurations, although this evolution has a dependence on the merger force through time. In the case of TNG50 haloes, the path through the shape parameter space is more diverse and has a weaker tendency to sphericalization with time than cielo haloes. In particular, h593480 shows a final oblate configuration at . The effects of recent major accretion (h4469 and h476266) can be spot in the figures as a larger dispersion reaching lower redshifts.
-
4.
Exploring the halo assembly history can provide insight into the connection of mergers and halo shapes. We find that all haloes accrete matter with a dominant isotropic (i.e., monopole) accretion mode. The quadrupole mode (i.e. filaments) has the next dominant contribution in accretion, with a preferential direction. We find that the strength of the quadrupole mode decreases with radii and also with redshift, as haloes lose their connection to the cosmic web.
-
5.
We find a stronger connection between the strength of the filament and the degree of ellipticity of the halo shape at . The filaments with a given preferential direction, accumulate mass so that the halo axis becomes elongated in the same direction as the infalling matter. This results in haloes being more ellipticals. With the weakening of the preferential direction of accretion in recent times, the accretion of mass becomes more isotropic, with a subsequent transformation to more spherical shapes. We find that this connection can be well described as a logarithmic regression fit for all our halo selections.
Our results show that the assembly history has a key role in understanding the resulting halo morphology at . There is an interconnection between the halo shape driven by the cosmic web at outskirt radii and the assembly of baryons at inner regions. The shape evolution is an important ingredient to understand the halo assembly history as well as the merger history.
Acknowledgements
PC and SP acknowledges partial support from MinCyT through BID PICT 2020 00582. PBT acknowledges partial support from Fondecyt Regular 20201200703 and ANID BASAL project ACE210002 (Chile). This project has received funding from the European Union’s Horizon 2020 Research and Innovation Programme under the Marie Skłodowska-Curie grant agreement No 734374 (LACEGAL) and the GALNET Network (ANID, Chile). The cielo Project was run in Marenostrum (Barcelona Supercomputer Centre, Spain), Ladgerda (IA, PUC) and the National Laboratory for High Performance Computing (NLHPC, Chile). We thank the Ministerio de Ciencia e Innovación (Spain) for financial support under Project grants PGC2018-094975-C21 and PID2021-122603NB-C21. MCA acknowledges financial support from the Seal of Excellence @UNIPD 2020 program under the ACROGAL project.
Data Availability
The data underlying this article will be shared on reasonable request to the corresponding authors.
References
- Allgood (2005) Allgood B. A., 2005, PhD thesis, University of California, nta Cruz, California, USA
- Artale et al. (2019) Artale M. C., Pedrosa S. E., Tissera P. B., Cataldi P., Di Cintio A., 2019, A&A, 622, A197
- Bailin & Steinmetz (2005) Bailin J., Steinmetz M., 2005, ApJ, 627, 647
- Baptista et al. (2022) Baptista J., et al., 2022, arXiv e-prints, p. arXiv:2211.16382
- Becquaert & Combes (1997) Becquaert J. F., Combes F., 1997, A&A, 325, 41
- Belokurov et al. (2018) Belokurov V., Erkal D., Evans N. W., Koposov S. E., Deason A. J., 2018, MNRAS, 478, 611
- Bonamigo et al. (2015) Bonamigo M., Despali G., Limousin M., Angulo R., Giocoli C., Soucail G., 2015, MNRAS, 449, 3171
- Bond et al. (1991) Bond J. R., Cole S., Efstathiou G., Kaiser N., 1991, ApJ, 379, 440
- Bovy et al. (2016) Bovy J., Bahmanyar A., Fritz T. K., Kallivayalil N., 2016, ApJ, 833, 31
- Buote & Canizares (1996) Buote D. A., Canizares C. R., 1996, ApJ, 457, 565
- Buote & Canizares (1998) Buote D. A., Canizares C. R., 1998, MNRAS, 298, 811
- Buote et al. (2002) Buote D. A., Jeltema T. E., Canizares C. R., Garmire G. P., 2002, ApJ, 577, 183
- Cataldi et al. (2020) Cataldi P., Pedrosa S. E., Tissera P. B., Artale M. C., 2020, Monthly Notices of the Royal Astronomical Society, 501, 5679
- Cataldi et al. (2022) Cataldi P., Pedrosa S., Padilla N., Landau S., Arnold C., Li B., 2022, MNRAS, 515, 5358
- Catelan & Theuns (1996a) Catelan P., Theuns T., 1996a, MNRAS, 282, 436
- Catelan & Theuns (1996b) Catelan P., Theuns T., 1996b, MNRAS, 282, 455
- Chabrier (2003) Chabrier G., 2003, PASP, 115, 763
- Choi et al. (2010) Choi E., Bond N. A., Strauss M. A., Coil A. L., Davis M., Willmer C. N. A., 2010, MNRAS, 406, 320
- Chua et al. (2019) Chua K. T. E., Pillepich A., Vogelsberger M., Hernquist L., 2019, MNRAS, 484, 476
- Chua et al. (2022) Chua K. T. E., Vogelsberger M., Pillepich A., Hernquist L., 2022, MNRAS, 515, 2681
- Codis et al. (2018) Codis S., Pogosyan D., Pichon C., 2018, MNRAS, 479, 973
- Colberg et al. (1999) Colberg J. M., White S. D. M., Jenkins A., Pearce F. R., 1999, MNRAS, 308, 593
- Curir et al. (1993) Curir A., Diaferio A., de Felice F., 1993, ApJ, 413, 70
- Despali et al. (2014) Despali G., Giocoli C., Tormen G., 2014, MNRAS, 443, 3208
- Despali et al. (2017) Despali G., Giocoli C., Bonamigo M., Limousin M., Tormen G., 2017, MNRAS, 466, 181
- Di Cintio et al. (2014) Di Cintio A., Brook C. B., Dutton A. A., Macciò A. V., Stinson G. S., Knebe A., 2014, MNRAS, 441, 2986
- Doroshkevich (1970) Doroshkevich A. G., 1970, Astrofizika, 6, 581
- Drakos et al. (2019) Drakos N. E., Taylor J. E., Berrouet A., Robotham A. S. G., Power C., 2019, MNRAS, 487, 993
- Dubinski & Carlberg (1991) Dubinski J., Carlberg R. G., 1991, ApJ, 378, 496
- Evans & Bridle (2009) Evans A. K. D., Bridle S., 2009, ApJ, 695, 1446
- Fabricant et al. (1984) Fabricant D., Rybicki G., Gorenstein P., 1984, ApJ, 286, 186
- Frenk et al. (1988) Frenk C. S., White S. D. M., Davis M., Efstathiou G., 1988, ApJ, 327, 507
- Gaia Collaboration et al. (2018) Gaia Collaboration et al., 2018, A&A, 616, A1
- Gao et al. (2008) Gao L., Navarro J. F., Cole S., Frenk C. S., White S. D. M., Springel V., Jenkins A., Neto A. F., 2008, MNRAS, 387, 536
- Ghigna et al. (1998) Ghigna S., Moore B., Governato F., Lake G., Quinn T., Stadel J., 1998, MNRAS, 300, 146
- Giocoli et al. (2012a) Giocoli C., Meneghetti M., Bartelmann M., Moscardini L., Boldrin M., 2012a, MNRAS, 421, 3343
- Giocoli et al. (2012b) Giocoli C., Meneghetti M., Ettori S., Moscardini L., 2012b, MNRAS, 426, 1558
- Gnedin et al. (2005) Gnedin O. Y., Gould A., Miralda-Escudé J., Zentner A. R., 2005, ApJ, 634, 344
- Gouin et al. (2021) Gouin C., Bonnaire T., Aghanim N., 2021, A&A, 651, A56
- Governato et al. (2012) Governato F., et al., 2012, MNRAS, 422, 1231
- Hahn & Abel (2011) Hahn O., Abel T., 2011, MNRAS, 415, 2101
- Helmi et al. (2018) Helmi A., Babusiaux C., Koppelman H. H., Massari D., Veljanoski J., Brown A. G. A., 2018, Nature, 563, 85
- Hoekstra et al. (2004) Hoekstra H., Yee H. K. C., Gladders M. D., 2004, ApJ, 606, 67
- Ibata et al. (2001) Ibata R., Lewis G. F., Irwin M., Totten E., Quinn T., 2001, ApJ, 551, 294
- Jing & Suto (2002) Jing Y. P., Suto Y., 2002, ApJ, 574, 538
- Kang & Wang (2015) Kang X., Wang P., 2015, ApJ, 813, 6
- Kawahara (2010) Kawahara H., 2010, ApJ, 719, 1926
- Kazantzidis et al. (2004) Kazantzidis S., Mayer L., Mastropietro C., Diemand J., Stadel J., Moore B., 2004, ApJ, 608, 663
- Knollmann & Knebe (2009) Knollmann S. R., Knebe A., 2009, ApJS, 182, 608
- Koposov et al. (2010) Koposov S. E., Rix H.-W., Hogg D. W., 2010, ApJ, 712, 260
- Kraljic et al. (2020) Kraljic K., et al., 2020, MNRAS, 491, 4294
- Lagos et al. (2017) Lagos C. d. P., Theuns T., Stevens A. R. H., Cortese L., Padilla N. D., Davis T. A., Contreras S., Croton D., 2017, MNRAS, 464, 3850
- Lapi & Cavaliere (2011) Lapi A., Cavaliere A., 2011, ApJ, 743, 127
- Lau et al. (2013) Lau E. T., Nagai D., Nelson K., 2013, ApJ, 777, 151
- Lau et al. (2021) Lau E. T., Hearin A. P., Nagai D., Cappelluti N., 2021, MNRAS, 500, 1029
- Law & Majewski (2010) Law D. R., Majewski S. R., 2010, ApJ, 714, 229
- Law et al. (2005) Law D. R., Johnston K. V., Majewski S. R., 2005, ApJ, 619, 807
- Law et al. (2009) Law D. R., Majewski S. R., Johnston K. V., 2009, ApJ, 703, L67
- Libeskind et al. (2011) Libeskind N. I., Knebe A., Hoffman Y., Gottlöber S., Yepes G., Steinmetz M., 2011, MNRAS, 411, 1525
- Libeskind et al. (2014) Libeskind N. I., Knebe A., Hoffman Y., Gottlöber S., 2014, Monthly Notices of the Royal Astronomical Society, 443, 1274
- Lu et al. (2006) Lu Y., Mo H. J., Katz N., Weinberg M. D., 2006, Monthly Notices of the Royal Astronomical Society, 368, 1931
- Ludlow et al. (2014) Ludlow A. D., Navarro J. F., Angulo R. E., Boylan-Kolchin M., Springel V., Frenk C., White S. D. M., 2014, MNRAS, 441, 378
- Macciò et al. (2007) Macciò A. V., Dutton A. A., van den Bosch F. C., Moore B., Potter D., Stadel J., 2007, MNRAS, 378, 55
- Malhan & Ibata (2019) Malhan K., Ibata R. A., 2019, MNRAS, 486, 2995
- Montero-Dorta et al. (2021) Montero-Dorta A. D., Chaves-Montero J., Artale M. C., Favole G., 2021, MNRAS, 508, 940
- Mosconi et al. (2001) Mosconi M. B., Tissera P. B., Lambas D. G., Cora S. A., 2001, MNRAS, 325, 34
- Navarro et al. (1997) Navarro J. F., Frenk C. S., White S. D. M., 1997, ApJ, 490, 493
- Nelson et al. (2019) Nelson D., et al., 2019, Computational Astrophysics and Cosmology, 6, 2
- Oguri et al. (2005) Oguri M., Takada M., Umetsu K., Broadhurst T., 2005, ApJ, 632, 841
- Oguri et al. (2010) Oguri M., Takada M., Okabe N., Smith G. P., 2010, MNRAS, 405, 2215
- Oguri et al. (2012) Oguri M., Bayliss M. B., Dahle H., Sharon K., Gladders M. D., Natarajan P., Hennawi J. F., Koester B. P., 2012, MNRAS, 420, 3213
- Pace et al. (2019) Pace F., Schimd C., Mota D. F., Del Popolo A., 2019, J. Cosmology Astropart. Phys., 2019, 060
- Paz et al. (2006) Paz D. J., Lambas D. G., Padilla N., Merchán M., 2006, MNRAS, 366, 1503
- Pedrosa & Tissera (2015) Pedrosa S. E., Tissera P. B., 2015, A&A, 584, A43
- Pedrosa et al. (2010) Pedrosa S., Tissera P. B., Scannapieco C., 2010, MNRAS, 402, 776
- Peebles (1980) Peebles P. J. E., 1980, The large-scale structure of the universe
- Pillepich et al. (2018) Pillepich A., et al., 2018, MNRAS, 473, 4077
- Planck Collaboration et al. (2014) Planck Collaboration et al., 2014, A&A, 571, A1
- Planck Collaboration et al. (2016) Planck Collaboration et al., 2016, A&A, 594, A13
- Press & Schechter (1974) Press W. H., Schechter P., 1974, ApJ, 187, 425
- Robotham et al. (2008) Robotham A., Phillipps S., De Propris R., 2008, ApJ, 672, 834
- Rodriguez-Gomez et al. (2015) Rodriguez-Gomez V., et al., 2015, MNRAS, 449, 49
- Rodríguez et al. (2022) Rodríguez S., Garcia Lambas D., Padilla N. D., Tissera P., Bignone L., Dominguez-Tenreiro R., Gonzalez R., Pedrosa S., 2022, MNRAS, 514, 6157
- Rodríguez-Puebla et al. (2016) Rodríguez-Puebla A., Behroozi P., Primack J., Klypin A., Lee C., Hellinger D., 2016, Monthly Notices of the Royal Astronomical Society, 462, 893
- Sayers et al. (2011) Sayers J., Golwala S. R., Ameglio S., Pierpaoli E., 2011, ApJ, 728, 39
- Scannapieco et al. (2005) Scannapieco C., Tissera P. B., White S. D. M., Springel V., 2005, MNRAS, 364, 552
- Scannapieco et al. (2006) Scannapieco C., Tissera P. B., White S. D. M., Springel V., 2006, MNRAS, 371, 1125
- Schimd & Sereno (2021) Schimd C., Sereno M., 2021, MNRAS, 502, 3911
- Shao et al. (2021) Shao S., Cautun M., Deason A., Frenk C. S., 2021, MNRAS, 504, 6033
- Soucail et al. (1987) Soucail G., Fort B., Mellier Y., Picat J. P., 1987, A&A, 172, L14
- Springel (2005) Springel V., 2005, MNRAS, 364, 1105
- Springel & Hernquist (2003) Springel V., Hernquist L., 2003, MNRAS, 339, 289
- Springel et al. (2008) Springel V., et al., 2008, MNRAS, 391, 1685
- Stadel et al. (2009) Stadel J., Potter D., Moore B., Diemand J., Madau P., Zemp M., Kuhlen M., Quilis V., 2009, MNRAS, 398, L21
- Swaters et al. (1997) Swaters R. A., Sancisi R., van der Hulst J. M., 1997, ApJ, 491, 140
- Tapia et al. (2022) Tapia B., Tissera P. B., Sillero E., Casanueva C., Pedrosa S., Bignone L., Dominguez Tenreiro R., Padilla N., 2022, Boletin de la Asociacion Argentina de Astronomia La Plata Argentina, 63, 256
- Taylor (2011) Taylor J. E., 2011, Advances in Astronomy, 2011, 604898
- Tempel et al. (2015) Tempel E., Guo Q., Kipper R., Libeskind N. I., 2015, MNRAS, 450, 2727
- Tissera & Dominguez-Tenreiro (1998) Tissera P. B., Dominguez-Tenreiro R., 1998, MNRAS, 297, 177
- Tissera et al. (2010) Tissera P. B., White S. D. M., Pedrosa S., Scannapieco C., 2010, MNRAS, 406, 922
- Tissera et al. (2016a) Tissera P. B., Pedrosa S. E., Sillero E., Vilchez J. M., 2016a, MNRAS, 456, 2982
- Tissera et al. (2016b) Tissera P. B., Machado R. E. G., Sanchez-Blazquez P., Pedrosa S. E., Sánchez S. F., Snaith O., Vilchez J., 2016b, A&A, 592, A93
- Tollet et al. (2016) Tollet E., et al., 2016, MNRAS, 456, 3542
- Tormen (1997) Tormen G., 1997, MNRAS, 290, 411
- Trayford et al. (2019) Trayford J. W., Frenk C. S., Theuns T., Schaye J., Correa C., 2019, MNRAS, 483, 744
- Vega-Ferrero et al. (2017) Vega-Ferrero J., Yepes G., Gottlöber S., 2017, MNRAS, 467, 3226
- Vera-Ciro et al. (2011) Vera-Ciro C. A., Sales L. V., Helmi A., Frenk C. S., Navarro J. F., Springel V., Vogelsberger M., White S. D. M., 2011, Monthly Notices of the Royal Astronomical Society, 416, 1377
- Vera-Ciro et al. (2014) Vera-Ciro C. A., Sales L. V., Helmi A., Navarro J. F., 2014, MNRAS, 439, 2863
- Wang et al. (2011) Wang J., et al., 2011, Monthly Notices of the Royal Astronomical Society, 413, 1373
- Wechsler et al. (2002) Wechsler R. H., Bullock J. S., Primack J. R., Kravtsov A. V., Dekel A., 2002, The Astrophysical Journal, 568, 52
- Weinberger et al. (2017) Weinberger R., et al., 2017, MNRAS, 465, 3291
- Weinberger et al. (2020) Weinberger R., Springel V., Pakmor R., 2020, ApJS, 248, 32
- White (1984) White S. D. M., 1984, ApJ, 286, 38
- White & Rees (1978) White S. D. M., Rees M. J., 1978, MNRAS, 183, 341
- Wojtak (2013) Wojtak R., 2013, A&A, 559, A89
- Zavala et al. (2016) Zavala J., et al., 2016, MNRAS, 460, 4466
- Zel’dovich (1970) Zel’dovich Y. B., 1970, A&A, 5, 84
- Zemp et al. (2011) Zemp M., Gnedin O. Y., Gnedin N. Y., Kravtsov A. V., 2011, ApJS, 197, 30
- Zemp et al. (2012) Zemp M., Gnedin O. Y., Gnedin N. Y., Kravtsov A. V., 2012, ApJ, 748, 54
- Zhao et al. (2003) Zhao D. H., Mo H. J., Jing Y. P., Börner G., 2003, MNRAS, 339, 12
- Zhu et al. (2017) Zhu Q., Hernquist L., Marinacci F., Springel V., Li Y., 2017, MNRAS, 466, 3876
Appendix A Extended analysis of halo shape evolution
In Fig. A1 we show the evolution of the virial radius . We observe two different regimes in the evolution. First, a slow increase of halo size over time, up to , follow by an acceleration in the increasing of . The effects of recent mergers activity (h476266) or major accretion (h4469) can be spot with a sudden increment at late times of the size of the halo.
We also study he evolution of baryonic MAH for the selected haloes in Fig. A2. The accretion of baryons (stars and gas) follow the same trend as DM MAH. Inspecting Fig. A2, the baryons have a MAH slope which is less monotonically increasing than DM MAH in Fig. 2, product of the star formation and complex gas dynamics within each galaxy.
By computing the mass growth of halos over cosmic time, we can calculate different proxies of their mass assembly history. Several studies describe the instantaneous mass accretion rate (e.g. Rodríguez-Puebla et al., 2016; Gouin et al., 2021; Montero-Dorta et al., 2021) as,
| (6) |
In Fig. A3 we estimated the logarithmic halo growth rate. We choose for this, to compute the mass at , where we studied the changes in morphologies.
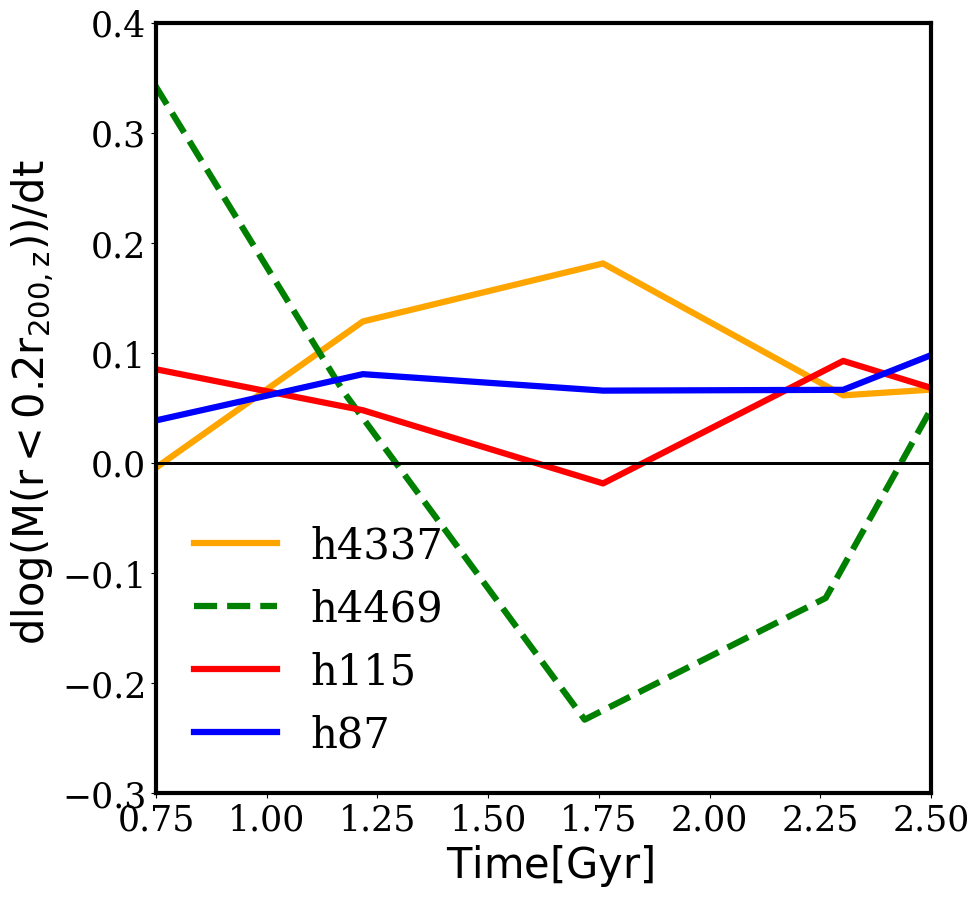
In Tab. A1 we present the instantaneous logarithmic growth rate at , together with the formation redshift at 70 ,, defined as the redshift which the mass of the halo main progenitor at is equal to 70 of the mass enclosed at the same radius at . Haloes with recent mergers accretion (h4469) and merger activity (h476266) are the last to reach of the mass at and consequently these are the haloes with greater instantaneous growth rate at .
| cielo | ||
|---|---|---|
| h4337 | 0.75 | -0.02 |
| h4469 | 0.44 | 0.40 |
| h87 | 0.88 | 0.09 |
| h115 | 0.55 | 0.03 |
| TNG50 | ||
| h476266 | 0.48 | 0.27 |
| h533590 | 0.82 | 0.05 |
| h593480 | 0.68 | 0.11 |
| h631558 | 0.70 | 0.14 |
| h649627 | 0.85 | 0.11 |
| h656142 | 0.62 | 0.06 |