spacing=nonfrench
On (assessing) the fairness of risk score models
Abstract
Recent work on algorithmic fairness has largely focused on the fairness of discrete decisions, or classifications. While such decisions are often based on risk score models, the fairness of the risk models themselves has received considerably less attention. Risk models are of interest for a number of reasons, including the fact that they communicate uncertainty about the potential outcomes to users, thus representing a way to enable meaningful human oversight. Here, we address fairness desiderata for risk score models. We identify the provision of similar epistemic value to different groups as a key desideratum for risk score fairness. Further, we address how to assess the fairness of risk score models quantitatively, including a discussion of metric choices and meaningful statistical comparisons between groups. In this context, we also introduce a novel calibration error metric that is less sample size-biased than previously proposed metrics, enabling meaningful comparisons between groups of different sizes. We illustrate our methodology – which is widely applicable in many other settings – in two case studies, one in recidivism risk prediction, and one in risk of major depressive disorder (MDD) prediction.
1 Introduction
To date, much of the algorithmic fairness literature has focused on the fairness of classification systems which are used, for example, to decide whether a person should be granted a loan or be released from prison on bail. Even in cases where such classification decisions are based on risk score models – such as in the highly influential COMPAS case [11, 16, 5] – their fairness is typically considered a function of the decisions, or classifications, made by the system. Of course, any risk score model can be turned into a classifier by selecting a probability threshold (in binary classification) or predicting the most likely outcome (in multi-class classification). Nevertheless, we argue here that it is worthwhile to distinguish between these two settings and consider the fairness of risk models independent of their downstream use, be it as the basis for a classifier or otherwise. We discuss notions of fairness for risk scores as well as their relationship to classical, classification-level notions of fairness, and we develop robust tools to empirically quantify risk score fairness. We illustrate our methodology in two case studies, one situated in the criminal justice system and one in healthcare.
Why distinguish between fair models and fair decisions?
In the statistical literature, it is generally considered desirable to distinguish between inference (e.g., identifying a risk score model) and subsequent decision-making (e.g., deriving a classification from a risk score model): while the former represents a purely statistical task, the latter depends on subjective choices about the relative desirability of different outcomes [39, 78]. Similar arguments have been made in the context of fairness analyses: learning a fair prediction model and making fair decisions based on a model are two separate tasks that should be considered separately [35]. At the same time, risk score models also play an important role outside the realm of automated decision-making, as a tool for human-computer interaction. Risk scores communicate uncertainty about the potential outcomes to users, thus enabling meaningful human oversight and decision-making as required for high-risk AI applications, e.g., by the EU’s proposed AI Act [17]. For this reason, risk scores have a long and successful history in fields such as medicine [44, 77, 98, 67, 70, 50], lending further urgency to an analysis of their fairness outside the realm of automated classification systems.
Contributions.
Our contributions range from the conceptual to the technical level, motivated by a single question:
How can we define and reliably quantify the fairness of risk score models?
In particular, our contributions include the following:
-
1.
We provide a principled argument for equality of epistemic value provided to different groups as a key desideratum for the fairness of risk models (section 3). By epistemic value, we here refer to the utility of the model in predicting the true risks of subjects. From this, we derive the relevance of previously proposed metrics, such as calibration, as well as new ones, for the fairness of risk scores. In particular, we argue that calibration and discriminative ability, that is, how well a model is able to separate positive from negative examples, are two complimentary key properties of interest. The latter can be measured, for example, by the area under the receiver-operating characteristic curve (AUROC) or the area under the precision-recall-gain curve (AUPRG).
-
2.
We examine whether risk score models can be used to obtain fair rankings in, e.g., scarce resource allocation scenarios such as medical triage (section 4). We show how even otherwise fair risk score models can lead to unfair rankings, and we show how ranking fairness relates naturally to demographic parity, or independence, in classification models. Following this analysis, we discuss consequences and make recommendations for the use of risk score models in resource allocation and prioritization.
-
3.
We address the quantification of potential fairness violations in practice (section 5). In this context, we discuss the importance of metric uncertainty quantification in order to avoid premature conclusions regarding the fairness or unfairness of a model. In addition, we introduce a novel calibration error metric that is more reliable and less sample size-biased than existing, commonly used metrics. The latter property is of particular relevance in the fairness context, where groups of different sizes are frequently compared.
-
4.
We illustrate our methodology – which is widely applicable – using two case studies, one in juvenile recidivism risk prediction, and one in risk of major depressive disorder (MDD) prediction (section 6). While the first case study uses a previously published and analyzed dataset [85], the second case study, based on national registry data of more than 400,000 subjects, is completely new.
Notation and problem setting
We consider the fairness of a risk score computed by a model from input features . We make no assumptions about – it could be, for example, a simple linear model, a neural network, or a random forest model. A risk score is designed to approximate the true risk of an outcome being positive (), given the input features . We refer to this as the fundamental aim of risk modeling. In some places, we will consider binary predictions derived from risk scores by means of a decision threshold . We pursue a notion of group fairness, comparing model properties between subject groups derived from protected attributes . The protected attributes may or may not be partially or fully contained in the model inputs . We consider categorical groups only; continuous-valued sensitive attributes (such as age) are discretized into a set of bins. Groups of interest may be defined by one or more sensitive attributes, and groups may overlap.
2 Background and related work
While the fairness of risk models has been widely discussed in the literature, this has been predominantly done in the context of risk scores used for automated decision-making, i.e., discrete classifications derived from risk scores based on a fixed threshold [11, 34, 23, 41, 45, 89, 75]. As a consequence, many of the proposed standard fairness metrics such as equalized odds, equal opportunity, parity of predictive values, or net benefit, are a function of classification decisions, and not of the risk score itself [34, 75]. This can be problematic for a number of reasons. First, decision thresholds might not be known in advance or might vary over time, thus inducing a need for an assessment that considers a whole range of possible thresholds. Second, any such classification-based fairness metric is based on implicit assumptions about the relative costs and benefits of different true or false decisions, which might not be known in advance. Third, separating between the aim of learning a fair model and making just decisions enables a more precise investigation into the sources of potential unfairness [35]. And, finally, there might simply be no formal decision-making process to analyze, for example in cases in which risk scores are used to inform human decision-making.
There is one notable exception to this focus on the fairness of classifications in the context of risk scores: calibration by groups, which is one of the standard fairness metrics employed in this space [46, 11, 6], is indeed a risk score-level metric that is fully independent of any subsequent decision-making. Calibration by groups is defined as [6]
| (1) |
In words, the model’s risk predictions should correspond to the actual risk in the population – a property of central importance to the project of risk modeling. Calibration as a desirable property of probabilistic models has a long history in diverse fields [71, 86, 35]. Many different metrics have been proposed for assessing calibration performance, including the expected calibration error (ECE) [65], adaptive calibration error (ACE) [66], and various metrics based on proper scoring rule decompositions [15, 64, 9, 14]. Unfortunately, it has been noted that standard calibration error estimates suffer from severe sample size bias [8, 49, 79, 32], thus necessitating the development of less biased alternative metrics. Towards this end, [49] proposed a binned version of the bias-corrected Brier score decomposition described by [18], corresponding to a debiased estimate of the root mean squared calibration error. They used equal-width binning and a fixed number of 15 bins. Later, [79] found that bias could be further reduced by using equal-mass binning. In addition, [79] describe a variant of ACE in which they choose the number of bins adaptively as the highest bin number that still yields a monotonically increasing calibration curve. They find this method to perform similarly well compared to an equal-mass binning version of the debiased calibration RMSE described by [49]. Interestingly, however, [79] do not apply their proposed bin count search method to the metric described by [49]. Moreover, to the authors’ knowledge, the implications of sample size-biased calibration error metrics for fairness analyses have not yet been discussed. In the fairness context, such biases are especially problematic, as groups of different sizes are routinely compared.
In the context of predictive modeling, calibration is often considered in conjunction with a second desirable property, discriminative ability [84].111This property has been the subject of many definitions across fields, including refinement [13, 48], sharpness [28], separation [22], and resolution [64], all of which describe very closely related and, in many cases, identical concepts. Maybe most prominently, discriminative ability can be measured by the area under the receiver-operating characteristic curve (AUROC) [4, 20, 19]. The AUROC metric is of particular relevance in our setting as it does not rely on binary classification decisions, quantifying the accuracy of the score ranking instead. This can also be understood from its equivalence to the concordance statistic [33, 84], i.e., the likelihood of a randomly selected positive sample being ranked above a randomly selected negative sample.222Another related result is the equivalence between AUROC and the Mann-Whitney U statistic [59]. It has been noted that in the case of strong class imbalance, AUROC can be misleading [81], and in such cases, the area under the precision-recall curve, equivalent to the average precision (AP), has been proposed as a potential alternative metric [81, 57]. As has been pointed out by [21], this metric requires proper normalization in order to enable meaningful comparisons between groups with different base rates, resulting in the use of precision-recall-gain curves and the area below them (AUPRG).
Finally, fair ranking has also been the subject of many publications, including rankings derived from risk score models; for an overview refer to the recent survey of [94]. Much of this research is in recommendation systems, however, in which relative position in a ranking matters due to declining attention being given to lower ranks [95]. This differs importantly from the set selection setting we consider here, in which relative position is irrelevant as long as a subject is selected for inclusion. Set selection fairness is intimately tied to ROC curve analysis, as both depend on the distributions of risk predictions in different groups. [87] describe a general ROC-based framework for fair ranking, which subsumes different variations of AUROC fairness, as well as pointwise ROC fairness, corresponding to the requirement that, e.g., at every threshold in a given range, true and/or false positive rates should be equal across groups. [96] propose a fair top-k ranking algorithm for overlapping protected groups, which ensures a certain minimum representation of each group in the selected set while maximizing overall ranking utility. The relationship between such approaches and (fair) risk score-based set selection has not analyzed, however.
3 Fairness desiderata for risk score models
What should we ask of a “fair” risk score model? Recall that the fundamental aim of risk modeling is to accurately predict the true underlying risks. If we consider the fairness of a risk model detached from any subsequent decision-making, then we can only characterize its fairness in terms of how well it performs according to this aim in different groups. We thus argue here that the fairness of a risk model is fundamentally determined by the epistemic value it provides to the different groups, and we consider a risk score model fair if it provides similar epistemic value to all groups of interest. This differs fundamentally from the classification case, in which fairness is typically characterized in terms of the relative costs or benefits provided to different groups as a result of decisions made based on the model, such as in equalized odds [34], equality of opportunity [34], or the expected net benefit of an intervention for different groups [75].
Quantifying the epistemic value of a given model or belief has been the subject of intense research and debate for many decades across disciplines. Interestingly, many of these diverse strands of research converge on calibration as a key desirable property of a model from an epistemic point of view [71, 86, 35]. In practice, calibration will never be satisfied exactly, and much research has been devoted to assessing the degree to which a model is miscalibrated; refer to section 2 and section 5.2.1 for more details on this issue. For now, we simply state that we consider similar degrees of (mis-)calibration across groups our first fairness desideratum for risk score models.
However, a calibrated model need not be epistemically valuable. A model that always returns a group’s base rate , regardless of any input features , is perfectly calibrated but provides little epistemic value. Thus, it has long been known that a secondary requirement for a model to provide epistemic value is for it to successfully separate positive from negative examples. We will employ the term discriminative ability333In order to avoid any confusion caused by an unfortunate clash of terminology in the fairness context, we emphasize that discriminative ability is a desirable model property and not related to unfair discrimination. to characterize this property, and we consider similar degrees of discriminative ability across groups to be our second fairness desideratum for risk score models. We will return to the issue of specific metrics in section 5 but would like to make two general remarks here.
Calibration and discriminative ability are fully orthogonal properties.
A model can be perfectly calibrated yet have no discriminative ability, as mentioned above. The inverse is also true: Consider a model that always returns for negative examples and for positive examples – such a model would be maximally miscalibrated while being perfectly discriminative. We will want our chosen metrics to reflect this orthogonality, i.e., a calibration metric should be independent of discriminative ability, and vice versa. As a negative example, it is well-known that proper scoring rules such as the Brier score and the log loss measure a combination of calibration and discriminative ability [48], thus being unsuitable for use as a pure measure of either property. As a positive example, the AUROC metric conforms with this requirement, since it is fully invariant to (monotonic) calibration: as long as a calibration procedure does not change the ranking of the returned risk scores, AUROC will be the same before and after calibration.
Compatibility of equal calibration and discriminative ability.
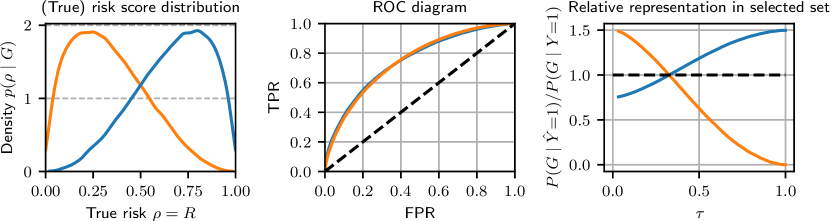
Following the publication of various incompatibility theorems [46, 11], a misconception can sometimes be observed that calibration by group and error rate parity (also called equalized odds) cannot be achieved simultaneously, except in degenerate cases. This is not true, however, and results from a misinterpretation of the original theorems: it is indeed possible to achieve both properties simultaneously, also in nontrivial cases [52, 35].444The misconception results from applying one criterion – calibration by groups – to the risk scores while applying the second criterion – separation – to binary predictions derived from the risk scores. The incompatibility theorem [6] only holds when applying both properties to the same entity, i.e., either or . For a longer discussion of this issue, refer to [52]. What is impossible to achieve is a risk model that simultaneously satisfies calibration by group and separation, defined as [6]. Separation would require the conditional risk distributions to be identical across groups, which is impossible to achieve if is calibrated by groups and there are differences in the base rates [46]. We mention this here, because an intuitively appealing way to achieve similar discriminative ability across groups might be to require identical risk score distributions across groups, i.e., separation in terms of the risk scores . In fact, the use of this fairness definition for risk scores has been proposed in the literature [74]. As shown, however, this definition is in conflict with the aim of calibration by groups, which we consider central to risk score modeling. It also penalizes predictors that fully conform with our aims: for example, a risk model can achieve equal AUROC scores in two groups and be perfectly calibrated by groups while violating separation, see fig. 1 for an example. To conclude, we emphasize that we do not consider separation a suitable fairness criterion for risk scores, and that calibration by groups and equal discriminative ability by groups are fully compatible.
Readers familiar with the standard algorithmic fairness literature may have noticed that our two desiderata outlined above – calibration by groups and similar discriminative ability across groups – closely match two of the three standard definitions of classification fairness: sufficiency, separation, and independence [6]. Calibration by groups implies sufficiency [6], and while we explicitly do not require separation (for reasons discussed above), that fairness conception could also be seen as an attempt to achieve similar discriminative ability across groups. However, we did not discuss anything similar to independence or demographic parity so far. This will change in the following section.
4 Risk score-based fair ranking and resource allocation
In scarce resource distribution settings, such as medical triage, it is a natural idea to use risk models for informing decisions about resource distribution [70, 50]. However, as we will outline here, such a procedure can lead to highly unfair distribution processes, even if the underlying risk score model is epistemically fair in the sense defined above.
For fair resource distribution, we will typically want to impose some requirement on the representation of groups in the selected group, i.e., . As one example, we might require
| (2) |
that is, that the fraction of the selected individuals that is from group matches the fraction of individuals with outcome that is from group . This is similar to the classical independence requirement , in the sense that we impose a requirement on the representation of groups in the selected set, regardless of the actual outcome of the selected individuals. Since the amount of available resources is often unknown a priori or may change over time, we would want this to hold for any decision threshold , at least in a certain threshold range of interest.555This setting is similar to the one discussed by [87] and [96]. However, [87] consider error rate-based metrics, and [96] consider a setting in which relative ranking within the selected set matters.
Unfortunately, the requirement outlined above is, in general, incompatible with the fundamental aim of risk modeling, i.e., to approximate the true risk of individuals as accurately as possible. Since the expression on the right-hand side of eq. 2 is threshold-independent, this would require that the risk score distributions be proportional to one another within the threshold range . However, the distribution of true risks may differ between groups, and in particular, they may not be proportional to one another within the range . Thus, the outlined representation requirement is in conflict with the fundamental aim of risk modeling: we can either optimize for risk prediction accuracy, or for fair ranking, but doing one will detract from the other. A simple illustration of this issue and its consequences for (un)fair resource access prioritization is shown in fig. 1.
Of course, a risk score can still be used as the basis for a fair ranking scheme that fulfils eq. 2 for all thresholds of interest, using various methods described in the score-based fair ranking literature [87, 94, 96]. However, the result of such a process would no longer represent a risk model itself, since its scores would have been adjusted in a manner that optimizes representation fairness while possibly detracting from risk accuracy. This means that while a fair ranking can be derived from a fair risk score, ranking directly based on the predicted risk scores is likely to be unfair.
5 Assessing the fairness of risk score models
We now turn our attention to the empirical quantification of risk model fairness. In section 5.1, we lay out fundamental requirements on metrics to be used for such assessments, most of which derive from the observation that in fairness analyses, groups of different sizes are compared. Based on these requirements, we then lay out our choice of specific metrics in section 5.2. The code for all our metric implementations is available online.666A link to the code will be added here after acceptance.
5.1 Comparing metrics between groups
In almost all practical fairness analyses, groups of different sizes will be compared, with important methodological consequences. First, metrics computed on small test groups will generally suffer from higher uncertainty compared to larger groups. In order to perform a proper comparison between groups, quantifying this uncertainty is crucial. As we observe in our case studies in section 6, metric uncertainty in small groups is often so high that statements concerning unfairness cannot be made with any certainty. Second, and at least as importantly, comparing groups of different sizes requires sample size-unbiased metrics. For instance, standard calibration error metrics exhibit a strong sample size bias, returning higher values in smaller groups even when predictions are equally well-calibrated [49, 79, 32]. This is clearly problematic when using such a metric for comparing model performance between groups of different sizes – as is widely done – since one might wrongly conclude that groups are differently well-calibrated when the underlying calibration quality is the same but group sizes differ. We will investigate this sample size bias and alternative, less biased ways of quantifying calibration errors in section 5.2.1. An additional requirement on metrics to be used in fairness analyses results from different groups having different base rates : in order to meaningfully compare metrics between groups, metrics must be – at least to a large degree – invariant with respect to varying base rates.
Finally, how to perform the actual comparisons? Researchers have proposed, for example, pair-wise group comparisons, comparisons to the best-performing group in each metric, and comparisons to the complement of each group, i.e., all individuals that are not members of the group under consideration. Comparisons have been performed by assessing, for example, metric differences or metric ratios between groups. In the interest of obtaining supposedly objective statements regarding the presence or absence of unfairness, one might also consider statistical hypothesis testing regarding group differences. However, the challenges surrounding the use of statistical hypothesis testing and p-values are well-documented [31]. Ultimately, the domain expert will need to decide which level of differences between groups, and at which level of certainty, is considered problematic. In order to maximize information flow to the domain expert, we thus argue for simply reporting confidence intervals for each metric and group separately, instead of any derived (e.g., difference or ratio-based) quantities. For the same reason, we consider it essential to report not just a single metric value, but to accompany each metric with a detailed graphical assessment that enables a more detailed assessment.
5.2 Choice of specific metrics
Throughout the previous sections, we have outlined a number of requirements for metrics to be used in fairness comparisons. These included, in particular,
-
1.
orthogonality (calibration metrics should be independent of discriminative ability, and vice versa),
-
2.
sample size-unbiasedness (the expected value of a metric should not depend on the size of the test sample), and
-
3.
independence of group base rates (it should be meaningful to compare groups with different base rates).
Finally, to reiterate, we are interested in metrics that assess risk scores , not binary classifications .
5.2.1 Calibration performance metrics
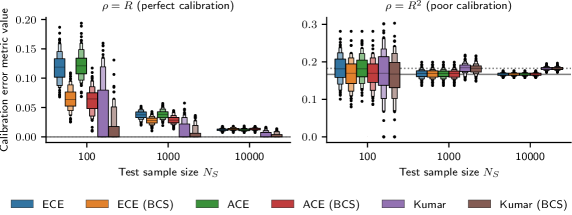
Following our discussion of calibration error metrics and their sample size biases in section 2, we here propose a combination of two previously described methods, which we show to further reduce sample size bias and metric variability compared to both of them. In particular, we propose to combine the debiasing method of [49] with an adaptive bin count search method similar to the one described by [79]. To find the largest bin count that still yields a monotonic calibration curve, [79] iteratively increase the number of bins one by one until the calibration curve becomes non-monotonic. Here, to speed up convergence, we use a simple interval search method for instead. Moreover, we ensure that each bin always contains at least 10 samples. We accompany our calibration analyses with loess-based reliability diagrams [3] using bootstrap-derived confidence intervals [2]. Further metrics could be considered, such as the calibration intercept for assessing whether risks are on average over- or underestimated in a group [86].
Figure 2 shows the distribution of calibration metric values in two simple synthetic test cases, one perfectly calibrated and one poorly calibrated. In agreement with previous publications [79, 32] we find that standard ECE and ACE (with a fixed number of bins) exhibit strong biases especially for well-calibrated models and small sample sizes, and that both adaptive bin count search and calibration error debiasing as proposed by [49] improve metric reliability. In particular, the combination of the debiased root mean square calibration error (DRMSCE) proposed by [49] with our adaptive bin count search described above outperforms all other metrics. We will simply call this combination DRMSCE and use it in the two case studies presented in section 6.
5.2.2 Discriminative ability
We use AUROC as our main metric to quantify discriminative ability, as it is independent of calibration performance, sample size-unbiased, and largely independent of group base rates. In case of strong class imbalance, i.e., , we perform precision-recall analysis instead, as recommended in the literature [81, 57]. In order to enable meaningful comparisons between groups of different base rates, we use the area under the precision-recall-gain curve (AUPRG) in this case, which represents a properly normalized AUPR [21]. We accompany our analyses of discriminative ability with ROC and PRG curves, including bootstrap-based confidence intervals.
5.2.3 Ranking fairness
In order to quantify ranking fairness according to the criterion proposed in section 4, we introduce the expected under-representation, which we define as
| (3) |
where denotes binary decisions derived from using threshold , and denotes the empirical distribution of risk scores in the test set across all groups. The ranking fairness analyses are accompanied by a plot of the normalized group representation
as a function of the decision threshold , again using bootstrap-based uncertainty quantification.
6 Case studies
We present two real-world case studies to illustrate our fairness assessment methodology.
6.1 Experimental methodology
Datasets are split into training, validation, and test sets, and we train a standard XGBoost [10] classification model on the training set. We perform randomized hyperparameter search using five-fold cross-validation on the training set and calibrate the resulting model using beta calibration [47] (first case study, because of relatively small validation set size) and isotonic regression [93] (second case study), respectively, on the validation set. We select a set of sensitive attributes to consider (e.g., gender, age group, etc.), and perform our further analyses for all groups that can be constructed from value combinations of these attributes (say, elderly women), and that surpass a minimum group size threshold.
Performance is evaluated on the hold-out test set, and we use a simple test set bootstrapping method to quantify metric uncertainty. From the overall test set, we select the samples belonging to group . We then draw bootstrapped test sets (each of size ) from this original group-specific test set, compute the metric of interest (e.g., AUROC or calibration error) on each of them, and use the obtained distribution of metric values for quantifying the uncertainty associated with this metric on this particular group. In particular, we will consider the median and the (percentile-based) 95% confidence intervals for further analysis. The code for our analyses is available online.777The link to the code will be added here after peer review.
6.2 Case study A: Catalan juvenile recidivism risk assessment
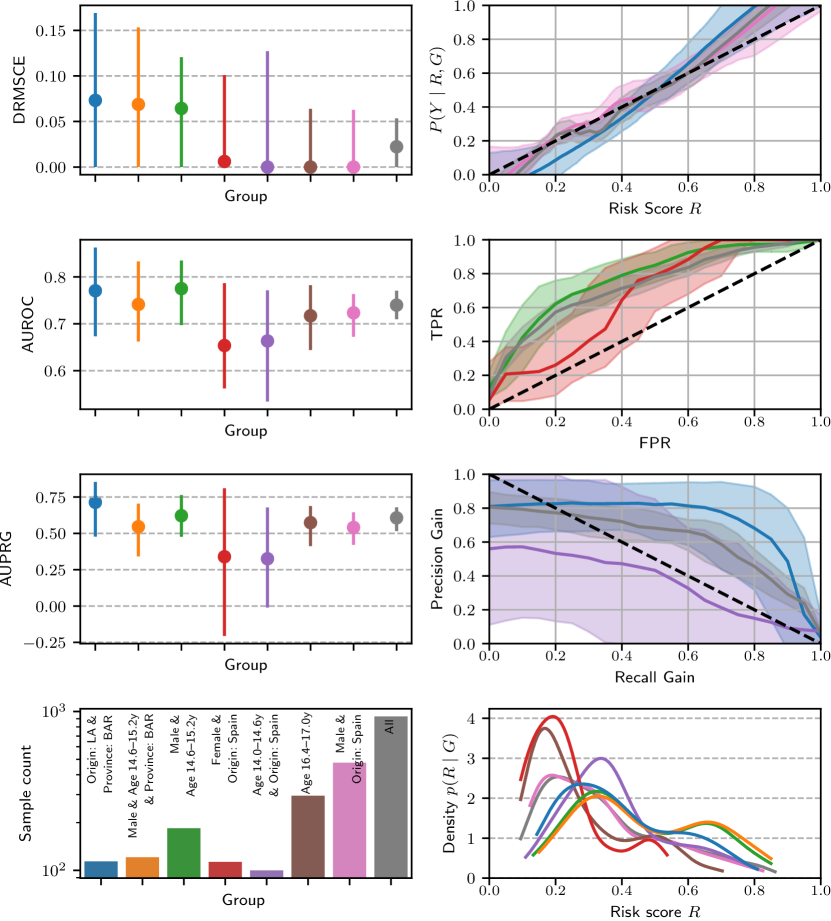
We use a dataset on juvenile recidivism provided by the Centre for Legal Studies and Specialised Training (CEJFE) within the Department of Justice of the Government of Catalonia,888The dataset can be downloaded at https://cejfe.gencat.cat/en/recerca/opendata/jjuvenil/reincidencia-justicia-menors/index.html. analyses of which have been previously published by [85] and [27]. The dataset provides information about juvenile subjects who have participated in an educational program following a conviction of a criminal act in Catalonia. We predict the risk of recidivism within five years after completion of the educational program, based on subject age at time of the crime and at time of program completion, sex, area of origin, province of residence, the number of prior criminal records, the province in which the educational program was executed, crime category and specific type, and the type of educational program. We use the preprocessing described by [27], available online.999https://github.com/elisabethzinck/Fairness-oriented-interpretability-of-predictive-algorithms/blob/main/src/data/cleaning-catalan-juvenile-recidivism-data.py The processed dataset contains 4652 samples (34% recidivism rate), and we use 70% / 10% / 20% for the training / validation / test sets, stratifying on the recidivism outcome. We consider subject sex, age group at time of crime, subject area of origin, as well as the province of residence as sensitive variables for our fairness analyses, and we use a minimum test set group size of 100 for our fairness analyses, leaving a total of 41 groups to be analyzed.
Figure 3 shows the results of our analyses. Overall model performance is reasonable (AUROC > 0.7, DRMSCE < 0.05) given the limited amount of input information. As expected, metric uncertainty in small test groups is very high, making reliable statements about the fairness or unfairness of the model near-impossible.
6.3 Case study B: National registry depression risk assessment
Major Depressive Disorder (MDD) is considered the most burdensome disease in Europe [90] and the leading cause of disability globally [91]. To address this challenge, depression risk assessments have been proposed for early detection and prevention [88, 62, 25]. At the same time, public authorities and health insurance companies are actively exploring ML-based healthcare resource prioritization, in mental health and other domains [69, 76, 40]. In this case study, we aim to investigate potential algorithmic fairness challenges that arise when using a depression risk assessment to decide who gets access to limited healthcare resources, and who does not.
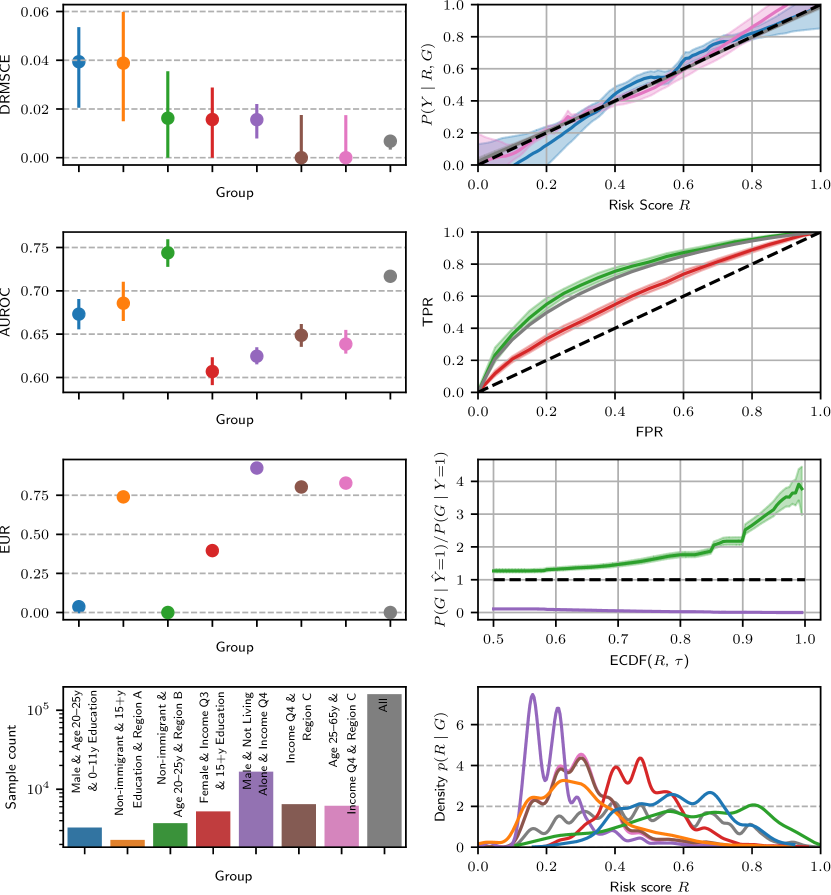
We use data from a national registry database101010To maintain full anonymity during peer review, we have removed any information about the country from which data were collected. that includes demographic and healthcare status information of the national population aged 15 years or older per the 31st of December from 2000–2018. For each year, we include all subjects diagnosed by a medical practitioner with MDD (ICD codes DF32 and DF33) within that year as cases. Control subjects were sampled without replacement from those who were not diagnosed with MDD that year, were alive at the end of the year, and were not previously selected as cases. Two equally sized cohorts without subject overlap were constructed this way, one for training, and one for validation and testing, both balanced between cases and controls and containing approximately 240,000 subjects each. The latter set was split into validation (1/3) and test (2/3) sets. We train a model to predict MDD diagnosis from demographic information; a complete list of predictors and sensitive variables can be found in appendix A. We analyze model performance in groups with a test set size of at least 2,000 subjects.
Figure 4 shows the results of our analyses. Overall model performance is again reasonable (AUROC > 0.7) and especially overall calibration is very good (DRMSCE < 0.01). Moreover, since this dataset is much larger, more reliable statements regarding potential disparities can be made. Some groups are clearly better calibrated than others; the groups that are poorer calibrated tend to be small. There are also large differences in discriminative ability, with AUROCs ranging from 0.6 to 0.75 in different groups. (We did not consider AUPRG here since the dataset is perfectly outcome-balanced.) This is also reflected in measures of under-representation in the selected set: subjects from groups with higher AUROCs tend to receive more extreme risk estimates, resulting in them being selected earlier compared to subjects in groups with lower AUROCs.
7 Discussion, limitations, and open challenges
In the following, we will discuss important outcomes and limitations of our analyses and case studies.
Challenges posed by varying test sample sizes.
While the issue of varying training set sizes for different groups has received widespread attention in the fairness literature, challenges posed by varying test set sizes are less widely discussed. In small test groups, such as in our juvenile recidivism case study, metric uncertainty is often so high that statements about fairness or unfairness cannot be made with any degree of certainty – and this is even after excluding groups below a minimum group size. It should thus be emphasized that ensuring broad group representation in the test set is at least as important as ensuring representation in the training set. Concerning metric evaluation, it is paramount that researchers take sample size variability into account in their analyses and use proper metric uncertainty estimates as well as sample size-unbiased metrics, such as the new calibration error metric we propose here.
Choice of metrics
We do not aim to make specific metric recommendations here; rather, our aim was to elucidate the basic requirements that any appropriate metric will need to fulfill (see section 5.2). The choice of the most appropriate metrics to consider will always be application-dependent [57]. For instance, AUROC and AUPRG take the whole threshold range into account – in many applications, however, a smaller range of thresholds may be of interest, thus rendering partial AUCs more appropriate [60]. Various other variations on ROC-based and ranking metrics have also been proposed [87], such as xAUC [42], which measures the likelihood that a random positive example from one group will be ranked above a random negative example from another group.
Performance differences and unfairness mitigation.
In our case studies, we observe that calibration and discriminative performance are, indeed, independent properties: groups can perform well on both, either of them, or none of them. At the same time, we observe, like many others before us, that our models perform better on some groups compared to others. What are the origins of such performance differences? Saving a more complete discussion of this question for elsewhere, we briefly remark that performance differences can result from a number of root causes, including group under-representation [51], algorithmic choices [37, 24], missing covariate information that is more important for some groups compared to others, and varying levels of input or label noise across groups [97]. While some of the resulting performance differences can be reduced by means of algorithmic interventions, this has generally proven to be a challenging endeavour. A number of studies have found that algorithmic solutions to fairness problems often yield undesirable or only marginally improved results [72, 73]. This is not surprising: if the underlying problem is that there are simply too few samples from a group, or that data from one group are more noisy than those from others, purely algorithmic interventions seem unlikely to solve the issue. Instead, an investment in more and better data from currently under-performing groups will often be the more promising approach.
Risk scores and fair ranking.
We have discussed the relationship between fair risk scores and fair ranking, finding that while a fair ranking can be derived from a fair risk score, ranking directly based on the predicted risk is likely to be unfair (see fig. 1). Another interaction between discriminative ability and ranking can be observed in our second case study (see fig. 4). Groups in which prediction is harder (as indicated, for instance, by lower AUROC) tend to receive less extreme risk estimates and are, thus, likely to be under-represented in a risk-based set selection scheme. Following our findings, one might consider it more appropriate to report both an estimated risk score and a suggested ranking based on the computed risks. This, of course, raises further challenges of real-world human–model interaction, many of which are yet to be addressed even for the “simple” risk-only case [30, 78, 29, 83, 92, 58]. In addition, there are further complexities involved in fair ranking for resource prioritization, as we will discuss next.
Artificially quantized quantities.
Our study – like most of the current literature – is based on the assumption of discrete outcomes. However, real-world outcomes often do not conform with discrete categories (“disease present” – ”disease absent”). Instead, disease severity is often a continuous property that is artificially discretized during the data collection procedure. Such artificial discretization of continuous variables is well-known to confound statistical analyses [80, 1, 68], and it might also cause problems in our setting. For example, while disease incidence might be similar in two groups, disease severity could be higher in one group compared to the other, with important consequences for what would be considered a “fair” ranking. Such differences are brushed over by approaches relying on discretized outcomes.
Biased data.
One crucial limitation of our study and most other approaches to algorithmic fairness is its underlying assumption that the available data are unbiased [26]. All of our metrics – like most metrics currently used in the literature – can hide arbitrary degrees of unfairness if the dataset suffers from, for instance, selection biases [41, 5], label biases [97, 5], or the choice of a biased proxy variable [69]. Further aggravating the problem, such biases are often undetectable without deep domain knowledge or further data collection efforts. Like others [38], We consider this one of the fundamental challenges of algorithmic fairness, and we highly appreciate attempts [69, 56, 23, 89] to address this problem. Even leaving objective measurement biases aside, subjective choices are always involved in the decision to measure a quantity, label something a crime or a disease, or include certain subjects but not others [61, 7, 5]. In this sense, it is crucial to realize that risk models can never be fully neutral or objective.
Fairness analyses in context.
We here judge the fairness of a risk model purely based on the joint distribution of generated risk scores , group membership , and output labels , ignoring questions of interpretability [54, 55, 12], procedural fairness [53], algorithmic recourse [43], or wider societal context [61, 7]. It is known, for example, that some demographic groups suffer from worse access to healthcare services compared to others. “Fairly” equalizing the access of groups to a particular healthcare service, while disregarding such discrepancies in baseline healthcare access, might contribute to deepening existing healthcare disparities. Decisions on whether or how to deploy an algorithm in the real world should thus never be based purely on a narrow fairness analysis such as ours. Instead, a comprehensive assessment of real-world complexities is essential, in which an analysis using our methodology can play just a small part [82, 30, 78, 29, 99, 63]. Nevertheless, fine-grained analyses of the different places in which unfairness can occur are crucial to navigate this immensely complex decision space, and we hope our work to be valuable towards this end.
8 Conclusion
Our main argument in this paper has been that the fairness of risk score models should be evaluated on their own, that is, independent of any subsequent decision-making processes. The reasons for this perspective were twofold. First, separating between the fairness of a model and the fairness of decisions made based on that model enables a more fine-grained analysis and discussion about the sources of unfairness. And second, risk models are indeed often used to provide information to human decision-makers, or at time-varying decision thresholds, in which case it is even more crucial to assess the model’s fairness on its own. We have further argued that the fairness of risk score models then is a function of the epistemic value they provide to different groups, and we have proposed metrics to empirically quantify this epistemic value, including a novel, debiased calibration error metric. Finally, we have considered the fairness of risk-based resource prioritization, finding that a ranking of subjects based purely on predicted risks will often be unfair.
Acknowledgements
The authors would like to thank Vibe Frøkjær, Neurobiology Research Unit, Copenhagen University Hospital, Rigshospitalet, and Merete Osler, Department of Public Health, University of Copenhagen, for help with the MDD study conception. The authors would also like to thank Emily Beaman, Department of Biomedical Sciences, University of Copenhagen, for assistance with the data analysis in the MDD study.
Funding sources
Work on this project was funded by the Independent Research Fund Denmark (DFF), grant number 9131-00097B. The funding agency had no influence on the writing of this manuscript, nor on the decision to submit it for publication. All authors are affiliated with the Pioneer Centre for AI, DNRF grant number P1.
References
- [1] Douglas G. Altman and Patrick Royston “The cost of dichotomising continuous variables” In BMJ 332.7549 BMJ, 2006, pp. 1080.1 DOI: 10.1136/bmj.332.7549.1080
- [2] Peter C. Austin and Ewout W. Steyerberg “Bootstrap confidence intervals for loess-based calibration curves” In Statistics in Medicine 33.15 Wiley, 2014, pp. 2699–2700 DOI: 10.1002/sim.6167
- [3] Peter C. Austin and Ewout W. Steyerberg “Graphical assessment of internal and external calibration of logistic regression models by using loess smoothers” In Statistics in Medicine 33.3 Wiley, 2013, pp. 517–535 DOI: 10.1002/sim.5941
- [4] Donald Bamber “The area above the ordinal dominance graph and the area below the receiver operating characteristic graph” In Journal of Mathematical Psychology 12.4 Elsevier BV, 1975, pp. 387–415 DOI: 10.1016/0022-2496(75)90001-2
- [5] Michelle Bao et al. “It’s COMPASlicated: The Messy Relationship between RAI Datasets and Algorithmic Fairness Benchmarks” In Thirty-fifth Conference on Neural Information Processing Systems Datasets and Benchmarks Track, 2022 URL: https://openreview.net/forum?id=qeM58whnpXM
- [6] Solon Barocas, Moritz Hardt and Arvind Narayanan “Fairness and Machine Learning: Limitations and Opportunities” http://www.fairmlbook.org fairmlbook.org, 2019
- [7] Justin B. Biddle “On Predicting Recidivism: Epistemic Risk, Tradeoffs, and Values in Machine Learning” In Canadian Journal of Philosophy 52.3 Cambridge University Press (CUP), 2020, pp. 321–341 DOI: 10.1017/can.2020.27
- [8] Jochen Bröcker “Estimating reliability and resolution of probability forecasts through decomposition of the empirical score” In Climate Dynamics 39.3-4 Springer ScienceBusiness Media LLC, 2011, pp. 655–667 DOI: 10.1007/s00382-011-1191-1
- [9] Jochen Bröcker “Reliability, sufficiency, and the decomposition of proper scores” In Quarterly Journal of the Royal Meteorological Society 135.643 Wiley, 2009, pp. 1512–1519 DOI: 10.1002/qj.456
- [10] Tianqi Chen and Carlos Guestrin “XGBoost” In Proceedings of the 22nd ACM SIGKDD International Conference on Knowledge Discovery and Data Mining ACM, 2016 DOI: 10.1145/2939672.2939785
- [11] Alexandra Chouldechova “Fair Prediction with Disparate Impact: A Study of Bias in Recidivism Prediction Instruments” In Big Data 5.2, 2017, pp. 153–163 DOI: 10.1089/big.2016.0047
- [12] Jonathan Crabbe, Yao Zhang, William Zame and Mihaela Schaar “Learning outside the Black-Box: The pursuit of interpretable models” In Advances in Neural Information Processing Systems 33 Curran Associates, Inc., 2020, pp. 17838–17849 URL: https://proceedings.neurips.cc/paper/2020/file/ce758408f6ef98d7c7a7b786eca7b3a8-Paper.pdf
- [13] Morris H. DeGroot and Stephen E. Fienberg “Assessing Probability Assessors: Calibration and Refinement”, 1981
- [14] Morris H. DeGroot and Stephen E. Fienberg “The Comparison and Evaluation of Forecasters” In The Statistician 32.1/2 JSTOR, 1983, pp. 12 DOI: 10.2307/2987588
- [15] Timo Dimitriadis, Tilmann Gneiting and Alexander I. Jordan “Stable reliability diagrams for probabilistic classifiers” In Proceedings of the National Academy of Sciences 118.8 Proceedings of the National Academy of Sciences, 2021 DOI: 10.1073/pnas.2016191118
- [16] Julia Dressel and Hany Farid “The accuracy, fairness, and limits of predicting recidivism” In Science Advances 4.1 American Association for the Advancement of Science (AAAS), 2018 DOI: 10.1126/sciadv.aao5580
- [17] European Commission “Proposal for a REGULATION OF THE EUROPEAN PARLIAMENT AND OF THE COUNCIL LAYING DOWN HARMONISED RULES ON ARTIFICIAL INTELLIGENCE (ARTIFICIAL INTELLIGENCE ACT) AND AMENDING CERTAIN UNION LEGISLATIVE ACTS”, 2021 URL: https://eur-lex.europa.eu/legal-content/EN/TXT/?uri=CELEX:52021PC0206
- [18] C. A. T. Ferro and T. E. Fricker “A bias-corrected decomposition of the Brier score” In Quarterly Journal of the Royal Meteorological Society 138.668 Wiley, 2012, pp. 1954–1960 DOI: 10.1002/qj.1924
- [19] Peter A. Flach “ROC Analysis” In Encyclopedia of Machine Learning and Data Mining Springer US, 2016, pp. 1–8 DOI: 10.1007/978-1-4899-7502-7_739-1
- [20] Peter A. Flach, José Hernández-Orallo and Cèsar Ferri “A Coherent Interpretation of AUC as a Measure of Aggregated Classification Performance” In Proceedings of the 28th International Conference on International Conference on Machine Learning, ICML’11 Bellevue, Washington, USA: Omnipress, 2011, pp. 657–664
- [21] Peter A. Flach and Meelis Kull “Precision-Recall-Gain Curves: PR Analysis Done Right” In Advances in Neural Information Processing Systems 28 Curran Associates, Inc., 2015 URL: https://proceedings.neurips.cc/paper/2015/file/33e8075e9970de0cfea955afd4644bb2-Paper.pdf
- [22] Peter A. Flach and Edson Matsubara “On classification, ranking, and probability estimation” In Probabilistic, Logical and Relational Learning - A Further Synthesis 7161, Dagstuhl Seminar Proceedings (DagSemProc) Dagstuhl, Germany: Schloss Dagstuhl – Leibniz-Zentrum für Informatik, 2008, pp. 1–10 DOI: 10.4230/DagSemProc.07161.8
- [23] Riccardo Fogliato, Alexandra Chouldechova and Max G’Sell “Fairness Evaluation in Presence of Biased Noisy Labels” In Proceedings of the Twenty Third International Conference on Artificial Intelligence and Statistics 108, Proceedings of Machine Learning Research PMLR, 2020, pp. 2325–2336 URL: https://proceedings.mlr.press/v108/fogliato20a.html
- [24] Jessica Zosa Forde et al. “Model Selection’s Disparate Impact in Real-World Deep Learning Applications” In Science and Engineering of Deep Learning Workshop, ICLR 2021, 2021 arXiv:2104.00606 [cs.LG]
- [25] Eiko I. Fried, Carlotta Rieble and Ricarda Katharina Karola Proppert “Building an early warning system for depression: rationale, objectives, and methods of the WARN-D study” Center for Open Science, 2022 DOI: 10.31234/osf.io/9qcvs
- [26] Sorelle A. Friedler, Carlos Scheidegger and Suresh Venkatasubramanian “The (Im)possibility of fairness” In Communications of the ACM 64.4 Association for Computing Machinery (ACM), 2021, pp. 136–143 DOI: 10.1145/3433949
- [27] Caroline Amalie Fuglsang-Damgaard and Elisabeth Zinck “Fairness-Oriented Interpretability of Predictive Algorithms”, 2022 URL: http://fairmed.compute.dtu.dk/files/theses/Fairness-oriented%20interpretability%20of%20predictive%20algorithms%20[Fuglsang-Damgaard,%20Zinck]%20(2022).pdf
- [28] Tilmann Gneiting, Fadoua Balabdaoui and Adrian E. Raftery “Probabilistic forecasts, calibration and sharpness” In Journal of the Royal Statistical Society: Series B (Statistical Methodology) 69.2 Wiley, 2007, pp. 243–268 DOI: 10.1111/j.1467-9868.2007.00587.x
- [29] Ben Green and Yiling Chen “Algorithmic Risk Assessments Can Alter Human Decision-Making Processes in High-Stakes Government Contexts” In Proceedings of the ACM on Human-Computer Interaction 5.CSCW2 Association for Computing Machinery (ACM), 2021, pp. 1–33 DOI: 10.1145/3479562
- [30] Ben Green and Yiling Chen “Disparate Interactions: An Algorithm-in-the-Loop Analysis of Fairness in Risk Assessments” In Proceedings of the Conference on Fairness, Accountability, and Transparency ACM, 2019 DOI: 10.1145/3287560.3287563
- [31] Sander Greenland et al. “Statistical tests, P values, confidence intervals, and power: a guide to misinterpretations” In European Journal of Epidemiology 31.4 Springer ScienceBusiness Media LLC, 2016, pp. 337–350 DOI: 10.1007/s10654-016-0149-3
- [32] Sebastian Gregor Gruber and Florian Buettner “Better Uncertainty Calibration via Proper Scores for Classification and Beyond” In Advances in Neural Information Processing Systems, 2022 URL: https://openreview.net/forum?id=PikKk2lF6P
- [33] J. A. Hanley and B. J. McNeil “The meaning and use of the area under a receiver operating characteristic (ROC) curve.” In Radiology 143.1 Radiological Society of North America (RSNA), 1982, pp. 29–36 DOI: 10.1148/radiology.143.1.7063747
- [34] Moritz Hardt, Eric Price and Nati Srebro “Equality of opportunity in supervised learning” In Advances in neural information processing systems, 2016, pp. 3315–3323
- [35] Brian Hedden “On statistical criteria of algorithmic fairness” In Philosophy & Public Affairs 49.2 Wiley, 2021, pp. 209–231 DOI: 10.1111/papa.12189
- [36] Heike Hofmann, Hadley Wickham and Karen Kafadar “Letter-Value Plots: Boxplots for Large Data” In Journal of Computational and Graphical Statistics 26.3 Informa UK Limited, 2017, pp. 469–477 DOI: 10.1080/10618600.2017.1305277
- [37] Sara Hooker “Moving beyond “algorithmic bias is a data problem”” In Patterns 2.4 Elsevier BV, 2021, pp. 100241 DOI: 10.1016/j.patter.2021.100241
- [38] Abigail Z. Jacobs and Hanna Wallach “Measurement and Fairness” In Proceedings of the 2021 ACM Conference on Fairness, Accountability, and Transparency ACM, 2021 DOI: 10.1145/3442188.3445901
- [39] E. T. Jaynes “Probability Theory: The Logic of Science” New York: Cambridge University Press, 2003
- [40] Dan W. Joyce et al. “CHRONOSIG: Digital Triage for Secondary Mental Healthcare using Natural Language Processing – Rationale and Protocol” In medRxiv, 2021 eprint: https://www.medrxiv.org/content/early/2021/12/02/2021.11.23.21266750
- [41] Nathan Kallus and Angela Zhou “Residual Unfairness in Fair Machine Learning from Prejudiced Data” In Proceedings of the 35th International Conference on Machine Learning 80, Proceedings of Machine Learning Research PMLR, 2018, pp. 2439–2448 URL: https://proceedings.mlr.press/v80/kallus18a.html
- [42] Nathan Kallus and Angela Zhou “The Fairness of Risk Scores Beyond Classification: Bipartite Ranking and the xAUC Metric” In Advances in Neural Information Processing Systems 32 Curran Associates, Inc., 2019 URL: https://proceedings.neurips.cc/paper/2019/file/73e0f7487b8e5297182c5a711d20bf26-Paper.pdf
- [43] Amir-Hossein Karimi, Bernhard Schölkopf and Isabel Valera “Algorithmic Recourse” In Proceedings of the 2021 ACM Conference on Fairness, Accountability, and Transparency ACM, 2021 DOI: 10.1145/3442188.3445899
- [44] Michael W. Kattan et al. “American Joint Committee on Cancer acceptance criteria for inclusion of risk models for individualized prognosis in the practice of precision medicine” In CA: A Cancer Journal for Clinicians 66.5 Wiley, 2016, pp. 370–374 DOI: 10.3322/caac.21339
- [45] Michael Kearns, Seth Neel, Aaron Roth and Zhiwei Steven Wu “Preventing Fairness Gerrymandering: Auditing and Learning for Subgroup Fairness” In Proceedings of the 35th International Conference on Machine Learning 80, Proceedings of Machine Learning Research PMLR, 2018, pp. 2564–2572 URL: https://proceedings.mlr.press/v80/kearns18a.html
- [46] Jon Kleinberg, Sendhil Mullainathan and Manish Raghavan “Inherent Trade-Offs in the Fair Determination of Risk Scores” In 8th Innovations in Theoretical Computer Science Conference (ITCS 2017) 67, Leibniz International Proceedings in Informatics (LIPIcs) Dagstuhl, Germany: Schloss Dagstuhl–Leibniz-Zentrum fuer Informatik, 2017, pp. 43:1–43:23 DOI: 10.4230/LIPIcs.ITCS.2017.43
- [47] Meelis Kull, Telmo M. Silva Filho and Peter Flach “Beyond sigmoids: How to obtain well-calibrated probabilities from binary classifiers with beta calibration” In Electronic Journal of Statistics 11.2 Institute of Mathematical Statistics, 2017 DOI: 10.1214/17-ejs1338si
- [48] Meelis Kull and Peter A. Flach “Novel Decompositions of Proper Scoring Rules for Classification: Score Adjustment as Precursor to Calibration” In Machine Learning and Knowledge Discovery in Databases Springer International Publishing, 2015, pp. 68–85 DOI: 10.1007/978-3-319-23528-8_5
- [49] Ananya Kumar, Percy S Liang and Tengyu Ma “Verified Uncertainty Calibration” In Advances in Neural Information Processing Systems 32 Curran Associates, Inc., 2019 URL: https://proceedings.neurips.cc/paper/2019/file/f8c0c968632845cd133308b1a494967f-Paper.pdf
- [50] Alexander Kutz et al. “The TRIAGE-ProADM Score for an Early Risk Stratification of Medical Patients in the Emergency Department - Development Based on a Multi-National, Prospective, Observational Study” In PLOS ONE 11.12 Public Library of Science (PLoS), 2016, pp. e0168076 DOI: 10.1371/journal.pone.0168076
- [51] Agostina J. Larrazabal et al. “Gender imbalance in medical imaging datasets produces biased classifiers for computer-aided diagnosis” In Proceedings of the National Academy of Sciences 117.23 Proceedings of the National Academy of Sciences, 2020, pp. 12592–12594 DOI: 10.1073/pnas.1919012117
- [52] Claire Lazar Reich and Suhas Vijaykumar “A Possibility in Algorithmic Fairness: Can Calibration and Equal Error Rates Be Reconciled?” In 2nd Symposium on Foundations of Responsible Computing (FORC 2021) 192, Leibniz International Proceedings in Informatics (LIPIcs) Dagstuhl, Germany: Schloss Dagstuhl – Leibniz-Zentrum für Informatik, 2021, pp. 4:1–4:21 DOI: 10.4230/LIPIcs.FORC.2021.4
- [53] Min Kyung Lee et al. “Procedural Justice in Algorithmic Fairness” In Proceedings of the ACM on Human-Computer Interaction 3.CSCW Association for Computing Machinery (ACM), 2019, pp. 1–26 DOI: 10.1145/3359284
- [54] Jiachang Liu et al. “FasterRisk: Fast and Accurate Interpretable Risk Scores” In Advances in Neural Information Processing Systems, 2022 URL: https://openreview.net/forum?id=xTYL1J6Xt-z
- [55] Eric Loreaux et al. “Boosting the interpretability of clinical risk scores with intervention predictions” In DSHealth at KDD 2022 arXiv, 2022 DOI: 10.48550/ARXIV.2207.02941
- [56] David Madras, Elliot Creager, Toniann Pitassi and Richard Zemel “Fairness through Causal Awareness: Learning Causal Latent-Variable Models for Biased Data” In Proceedings of the Conference on Fairness, Accountability, and Transparency ACM, 2019 DOI: 10.1145/3287560.3287564
- [57] Lena Maier-Hein et al. “Metrics reloaded: Pitfalls and recommendations for image analysis validation” arXiv, 2022 arXiv:2206.01653 [cs.CV]
- [58] Pauline Katharina Mantell et al. “Attitudes towards Risk Prediction in a Help Seeking Population of Early Detection Centers for Mental Disorders—A Qualitative Approach” In International Journal of Environmental Research and Public Health 18.3 MDPI AG, 2021, pp. 1036 DOI: 10.3390/ijerph18031036
- [59] S. J. Mason and N. E. Graham “Areas beneath the relative operating characteristics (ROC) and relative operating levels (ROL) curves: Statistical significance and interpretation” In Quarterly Journal of the Royal Meteorological Society 128.584 Wiley, 2002, pp. 2145–2166 DOI: 10.1256/003590002320603584
- [60] Donna Katzman McClish “Analyzing a Portion of the ROC Curve” In Medical Decision Making 9.3 SAGE Publications, 1989, pp. 190–195 DOI: 10.1177/0272989x8900900307
- [61] Melissa McCradden, Mjaye Mazwi, Shalmali Joshi and James A. Anderson “When Your Only Tool Is A Hammer” In Proceedings of the AAAI/ACM Conference on AI, Ethics, and Society ACM, 2020 DOI: 10.1145/3375627.3375824
- [62] Andrew S. Moriarty et al. “Predicting and preventing relapse of depression in primary care” In British Journal of General Practice 70.691 Royal College of General Practitioners, 2020, pp. 54–55 DOI: 10.3399/bjgp20x707753
- [63] Emanuel Moss et al. “Assembling Accountability: Algorithmic Impact Assessment for the Public Interest” In SSRN Electronic Journal Elsevier BV, 2021 DOI: 10.2139/ssrn.3877437
- [64] Allan H. Murphy “A New Vector Partition of the Probability Score” In Journal of Applied Meteorology 12.4 American Meteorological Society, 1973, pp. 595–600 DOI: 10.1175/1520-0450(1973)012<0595:anvpot>2.0.co;2
- [65] Mahdi Pakdaman Naeini, Gregory Cooper and Milos Hauskrecht “Obtaining Well Calibrated Probabilities Using Bayesian Binning” In Proceedings of the AAAI Conference on Artificial Intelligence 29.1 Association for the Advancement of Artificial Intelligence (AAAI), 2015 DOI: 10.1609/aaai.v29i1.9602
- [66] Jeremy Nixon et al. “Measuring Calibration in Deep Learning” In Proceedings of the IEEE/CVF Conference on Computer Vision and Pattern Recognition (CVPR) Workshops, 2019
- [67] Douglas Noble et al. “Risk models and scores for type 2 diabetes: systematic review” In BMJ 343.nov28 1 BMJ, 2011, pp. d7163–d7163 DOI: 10.1136/bmj.d7163
- [68] Luke Oakden-Rayner, Jared Dunnmon, Gustavo Carneiro and Christopher Re “Hidden stratification causes clinically meaningful failures in machine learning for medical imaging” In Proceedings of the ACM Conference on Health, Inference, and Learning ACM, 2020 DOI: 10.1145/3368555.3384468
- [69] Ziad Obermeyer, Brian Powers, Christine Vogeli and Sendhil Mullainathan “Dissecting racial bias in an algorithm used to manage the health of populations” In Science 366.6464 American Association for the Advancement of Science (AAAS), 2019, pp. 447–453 DOI: 10.1126/science.aax2342
- [70] A. S. Patel, A. Harrison and W. Bruce-Jones “Evaluation of the risk assessment matrix: a mental health triage tool” In Emergency Medicine Journal 26.1 BMJ, 2009, pp. 11–14 DOI: 10.1136/emj.2007.058388
- [71] Richard Pettigrew “Epistemic Utility Arguments for Probabilism” In The Stanford Encyclopedia of Philosophy Metaphysics Research Lab, Stanford University, https://plato.stanford.edu/archives/win2019/entries/epistemic-utility/, 2019
- [72] Stephen R. Pfohl, Agata Foryciarz and Nigam H. Shah “An empirical characterization of fair machine learning for clinical risk prediction” In Journal of Biomedical Informatics 113 Elsevier BV, 2021, pp. 103621 DOI: 10.1016/j.jbi.2020.103621
- [73] Stephen R. Pfohl et al. “A comparison of approaches to improve worst-case predictive model performance over patient subpopulations” In Scientific Reports 12.1 Springer ScienceBusiness Media LLC, 2022 DOI: 10.1038/s41598-022-07167-7
- [74] Stephen R. Pfohl et al. “Creating Fair Models of Atherosclerotic Cardiovascular Disease Risk” In Proceedings of the 2019 AAAI/ACM Conference on AI, Ethics, and Society ACM, 2019 DOI: 10.1145/3306618.3314278
- [75] Stephen R. Pfohl et al. “Net benefit, calibration, threshold selection, and training objectives for algorithmic fairness in healthcare” In 2022 ACM Conference on Fairness, Accountability, and Transparency ACM, 2022 DOI: 10.1145/3531146.3533166
- [76] Aristodemos Pnevmatikakis et al. “Risk Assessment for Personalized Health Insurance Based on Real-World Data” In Risks 9.3 MDPI AG, 2021, pp. 46 DOI: 10.3390/risks9030046
- [77] Polygenic Risk Score Task Force of the International Common˙Disease Alliance “Responsible use of polygenic risk scores in the clinic: potential benefits, risks and gaps” In Nature Medicine 27.11 Springer ScienceBusiness Media LLC, 2021, pp. 1876–1884 DOI: 10.1038/s41591-021-01549-6
- [78] Ashesh Rambachan, Jon Kleinberg, Jens Ludwig and Sendhil Mullainathan “An Economic Perspective on Algorithmic Fairness” In AEA Papers and Proceedings 110 American Economic Association, 2020, pp. 91–95 DOI: 10.1257/pandp.20201036
- [79] Rebecca Roelofs, Nicholas Cain, Jonathon Shlens and Michael C. Mozer “Mitigating Bias in Calibration Error Estimation” In Proceedings of The 25th International Conference on Artificial Intelligence and Statistics 151, Proceedings of Machine Learning Research PMLR, 2022, pp. 4036–4054 URL: https://proceedings.mlr.press/v151/roelofs22a.html
- [80] Patrick Royston, Douglas G. Altman and Willi Sauerbrei “Dichotomizing continuous predictors in multiple regression: a bad idea” In Statistics in Medicine 25.1 Wiley, 2005, pp. 127–141 DOI: 10.1002/sim.2331
- [81] Takaya Saito and Marc Rehmsmeier “The Precision-Recall Plot Is More Informative than the ROC Plot When Evaluating Binary Classifiers on Imbalanced Datasets” In PLOS ONE 10.3 Public Library of Science (PLoS), 2015, pp. e0118432 DOI: 10.1371/journal.pone.0118432
- [82] Andrew D. Selbst et al. “Fairness and abstraction in sociotechnical systems” In Proceedings of the Conference on Fairness, Accountability, and Transparency ACM, 2019, pp. 59–68 DOI: 10.1145/3287560.3287598
- [83] Gregory E. Simon et al. “Reconciling Statistical and Clinicians’ Predictions of Suicide Risk” In Psychiatric Services 72.5 American Psychiatric Association Publishing, 2021, pp. 555–562 DOI: 10.1176/appi.ps.202000214
- [84] Ewout W. Steyerberg et al. “Assessing the Performance of Prediction Models” In Epidemiology 21.1 Ovid Technologies (Wolters Kluwer Health), 2010, pp. 128–138 DOI: 10.1097/ede.0b013e3181c30fb2
- [85] Songül Tolan, Marius Miron, Emilia Gómez and Carlos Castillo “Why Machine Learning May Lead to Unfairness” In Proceedings of the Seventeenth International Conference on Artificial Intelligence and Law ACM, 2019 DOI: 10.1145/3322640.3326705
- [86] Ben Van Calster et al. “Calibration: the Achilles heel of predictive analytics” In BMC Medicine 17.1 Springer ScienceBusiness Media LLC, 2019 DOI: 10.1186/s12916-019-1466-7
- [87] Robin Vogel, Aurélien Bellet and Stephan Clémençon “Learning Fair Scoring Functions: Bipartite Ranking under ROC-based Fairness Constraints” In Proceedings of The 24th International Conference on Artificial Intelligence and Statistics 130, Proceedings of Machine Learning Research PMLR, 2021, pp. 784–792 URL: https://proceedings.mlr.press/v130/vogel21a.html
- [88] B. W. Van Voorhees et al. “Predicting Future Risk of Depressive Episode in Adolescents: The Chicago Adolescent Depression Risk Assessment (CADRA)” In The Annals of Family Medicine 6.6 Annals of Family Medicine, 2008, pp. 503–511 DOI: 10.1370/afm.887
- [89] Jialu Wang, Yang Liu and Caleb Levy “Fair Classification with Group-Dependent Label Noise” In Proceedings of the 2021 ACM Conference on Fairness, Accountability, and Transparency ACM, 2021 DOI: 10.1145/3442188.3445915
- [90] H.U. Wittchen et al. “The size and burden of mental disorders and other disorders of the brain in Europe 2010” In European Neuropsychopharmacology 21.9 Elsevier BV, 2011, pp. 655–679 DOI: 10.1016/j.euroneuro.2011.07.018
- [91] World Health Organization “Depression and Other Common Mental Disorders: Global Health Estimates”, 2017
- [92] Bobbi Jo H. Yarborough et al. “Clinical implementation of suicide risk prediction models in healthcare: a qualitative study” In BMC Psychiatry 22.1 Springer ScienceBusiness Media LLC, 2022 DOI: 10.1186/s12888-022-04400-5
- [93] Bianca Zadrozny and Charles Elkan “Transforming classifier scores into accurate multiclass probability estimates” In Proceedings of the eighth ACM SIGKDD international conference on Knowledge discovery and data mining ACM, 2002 DOI: 10.1145/775047.775151
- [94] Meike Zehlike, Ke Yang and Julia Stoyanovich “Fairness in Ranking, Part I: Score-based Ranking” In ACM Computing Surveys Association for Computing Machinery (ACM), 2022 DOI: 10.1145/3533379
- [95] Meike Zehlike, Ke Yang and Julia Stoyanovich “Fairness in Ranking, Part II: Learning-to-Rank and Recommender Systems” In ACM Computing Surveys Association for Computing Machinery (ACM), 2022 DOI: 10.1145/3533380
- [96] Meike Zehlike et al. “Fair Top-k Ranking with multiple protected groups” In Information Processing & Management 59.1 Elsevier BV, 2022, pp. 102707 DOI: 10.1016/j.ipm.2021.102707
- [97] Haoran Zhang et al. “Improving the Fairness of Chest X-ray Classifiers” In Conference on Health, Inference, and Learning (CHIL), 2022 arXiv:2203.12609 [cs.LG]
- [98] Zirun Zhao et al. “Prediction model and risk scores of ICU admission and mortality in COVID-19” In PLOS ONE 15.7 Public Library of Science (PLoS), 2020, pp. e0236618 DOI: 10.1371/journal.pone.0236618
- [99] Roberto V. Zicari et al. “Z-Inspection: A Process to Assess Trustworthy AI” In IEEE Transactions on Technology and Society 2.2 Institute of ElectricalElectronics Engineers (IEEE), 2021, pp. 83–97 DOI: 10.1109/tts.2021.3066209
Appendix A Additional details on the MDD case study
Subjects may be selected as a control in one year and as a case in a later year (in which they were diagnosed with MDD), although this occurs only rarely in the dataset.
The used predictor variables were the following:
-
•
age,
-
•
gender (male / female / changed at some time in the available dataset)
-
•
registered identification as LGBT, as detected by either a registered same-sex partnership or sex change,
-
•
living status (living alone or not),
-
•
equivalized household income quartile (accounts for number and age of children and combined household earning),
-
•
years of school and university education,
-
•
heritage (immigrant, child of immigrant parents, non-immigrant),
-
•
civil status (married, not married, divorced, widowed),
-
•
number of address changes during the year,
-
•
larger region of residence,
-
•
smaller region of residence.
As sensitive variables for our group fairness analyses, we consider age group, gender, registered identification as LGBT, heritage, larger region of residence, equivalized household income quartile, living status (alone or not), and number of years of education. We consider groups resulting from the combination of at most three sensitive variables and with a test set size of at least 2,000 subjects, resulting in the analysis of model performance in 886 different groups. Figure 4 in the main paper shows results for eight of those.