Measurement of the cross section from threshold to 1.2 GeV with the CMD-3 detector
Abstract
The cross section of the process has been measured in the center of mass energy range from 0.32 to 1.2 GeV with the CMD-3 detector at the electron-positron collider VEPP-2000. The measurement is based on a full dataset collected below 1 GeV during three data taking seasons, corresponding to an integrated luminosity of about 62 pb-1. In the dominant -resonance region, a systematic uncertainty of 0.7% has been reached. At energies around -resonance the production cross section was measured for the first time with high beam energy resolution. The forward-backward charge asymmetry in the production has also been measured. It shows the strong deviation from the theoretical prediction based on the conventional scalar QED framework, and it is in good agreement with the GVDM and dispersive-based predictions. The impact of presented results on the evaluation of the hadronic contribution to the anomalous magnetic moment of muon is discussed.
keywords:
annihilation , hadronic cross section, pion form factor, muon anomaly1 Introduction
The channel provides the dominant contribution to the production of hadrons from annihilation at the energy range below GeV. The total hadron production cross section normalised to the two muon production cross section, , is one of the fundamental quantities in high energy physics as it reflects a number of quark flavors opened for the production at the particular and a number of colors in quantum chromodynamics (QCD):
where is a number of QCD colors, is electric charge of th quark, is QCD correction. The perturbative QCD (pQCD) calculations has limited applicability at the resonances and quark-antiquark production threshold energy regions, therefore experimentally measured values of at GeV are used via dispersion integrals in many applications for prediction of various physical quantities such as the running fine structure constant [1], the hyperfine splitting in muonium [2], the anomalous magnetic moment of the muon [3, 4]. The last one demonstrates long standing deviation between the experimental measurement and the standard model (SM) prediction. There are efforts by several groups to compute the leading order hadronic vacuum polarization contribution to the anomalous magnetic moment of the muon using the lattice QCD approach [5]. The recent calculation by the BMW collaboration reaches the sub-percent precision and reduces the deviation between the experimental value and the SM prediction [6]. Most recent evaluations in different sub-regions by the other groups additionally increase tension between the dispersive, -based, and the lattice QCD predictions [7, 8, 9, 10, 11]. Hadronic decays with the spectral function measurements can be also used as input for , but this requires a challenging accounting of isospin-breaking corrections [12]. The other novel approach has been proposed to determine measuring the effective electromagnetic coupling in the spacelike region via scattering data by the the MUonE experiment [13, 14, 15]. It would provide another independent determination of the hadronic contribution to muon g-2.
The channel gives the major part of the hadronic contribution to the muon anomaly, out of the total value. It also determines (together with the light-by-light contribution) the overall uncertainty of the standard model prediction of muon [5]. To conform to the ultimate target precision of the ongoing Fermilab experiment[16, 17] and the future J-PARC muon g-2/EDM experiment[18], the production cross section needs to be known with the relative overall systematic uncertainty about 0.2%.
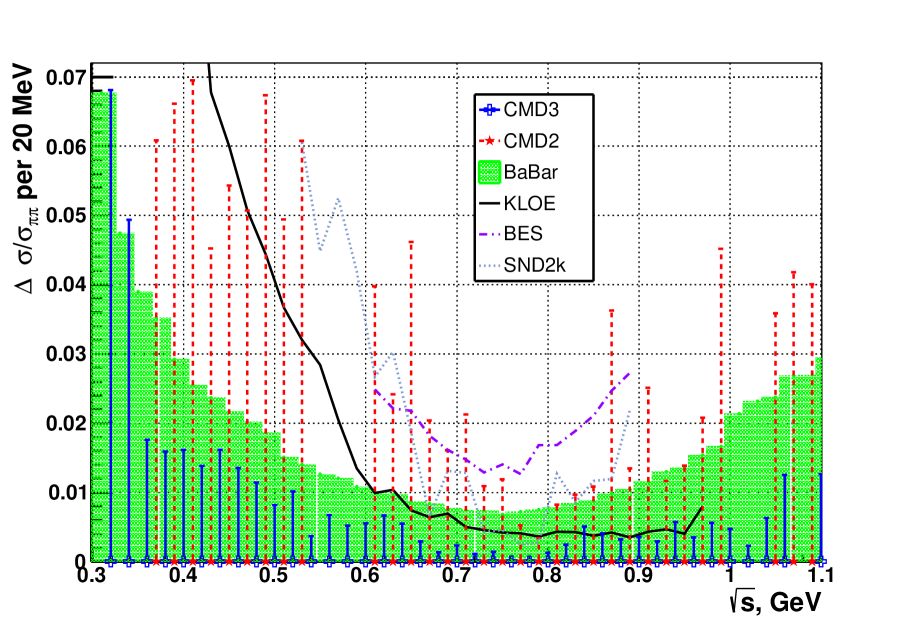
Several sub-percent precision measurements of the cross section exist. The energy scan measurements were performed at VEPP-2M collider by the CMD-2 experiment (with the systematic precision of 0.6–0.8%) [19, 20, 21, 22] and by the SND experiment (1.3%) [23]. These results have somewhat limited statistical precision. There are also measurements based on the initial-state radiation (ISR) technique by KLOE (0.8%) [24, 25, 26, 27], BABAR(0.5%) [28] and BES-III(0.9%) [29]. Due to the high luminosities of these factories, the accuracy of the results from the experiments are less limited by statistics, meanwhile they are not fully consistent with each other within the quoted systematic uncertainties.
One of the main goals of the CMD-3 and SND experiments at the new VEPP-2000 collider at BINP, Novosibirsk, is to perform the new high precision high statistics measurement of the cross section. Recently, the first SND result based on about 10% of the collected statistics was presented with a systematic uncertainty of about 0.8% [30]. Here we present the first CMD-3 result.
In comparison with the previous CMD-2, the next generation CMD-3 experiment has collected between one and two orders of magnitude more statistics, depending on the beam energy range. This allows to study possible sources of systematic errors of the cross section measurement in much more detail. The CMD-3 detector has much better performance compared with its predecessor: the drift chamber has twice better momentum resolution and 2–5 times smaller tracking inefficiency; the unique multilayer LXe calorimeter with the tracking capabilities gives information on a shower profile. The improved momentum resolution allowed to use this information for a particle separation in the most important -resonance energy range, which provides an additional independent method to the previously used separation based on the energy deposition information.
The paper is structured as follows. First, we briefly describe the detector, the collected data and the analysis strategy. Then we discuss in detail particle separation of the selected events, possible sources of background, evaluation of the detection and trigger efficiencies, calculation of the radiative corrections. A special section is devoted to the measurement of the forward-backward charge asymmetry. The final sections include the discussion of the sources of the systematic error, the presentation of the final result, the VDM fit of the measured cross section, the comparison with the other experiments and the evaluation of the corresponding contribution to the .
2 VEPP-2000 and CMD-3
The electron-positron collider VEPP-2000 [31, 32] has been operating at Budker Institute of Nuclear Physics since 2010. The collider was designed to provide instantaneous luminosity up to at the maximum center-of-mass (cms) energy . Two detectors CMD-3 [33, 34] and SND [35] are installed at the interaction regions of the collider. In 2010 both experiments started data taking. The physics program [36] includes high precision measurements of the cross sections in the wide cms energy range up to 2 GeV, where the rich intermediate dynamics is of particular interest, studies of known and searches for new vector mesons and other intermediate states, studies of the and cross sections near their production thresholds and searches for exotic hadrons. It requires a detector with a high efficiency for multiparticle events and good energy and angular resolutions for charged particles as well as for photons.

CMD-3 (Cryogenic Magnetic Detector) is a general-purpose detector, as shown in Fig. 2. Coordinates, angles and momenta of charged particles are measured by the cylindrical drift chamber (DCH) with a hexagonal cell for a high efficient reconstruction of tracks in the uniform 1.3 T magnetic field, where is typical momentum resolution. z-coordinates (along the positron beam direction) of the DCH hits used for the track polar angle evaluation are determined by the charge division method. For the purpose of the precise fiducial volume calibration, the Z-chamber, the MWPC with a strip readout placed outside of the DCH, was in operation until 2017. The calorimetry is performed with the endcap BGO crystal calorimeter and the barrel calorimeter, placed outside of the superconducting solenoid. The barrel calorimeter consists of the two systems: the Liquid Xenon (LXe) ionization calorimeter surrounded by the CsI scintillation calorimeter. The total thickness of the barrel calorimeter is about , where the inner LXe part constitutes . The LXe calorimeter has seven layers with strip readout which give information about a longitudinal shower profile and allow to measure coordinates of photons with about 2 millimeter precision[37]. The energy resolution in the barrel calorimeter is .
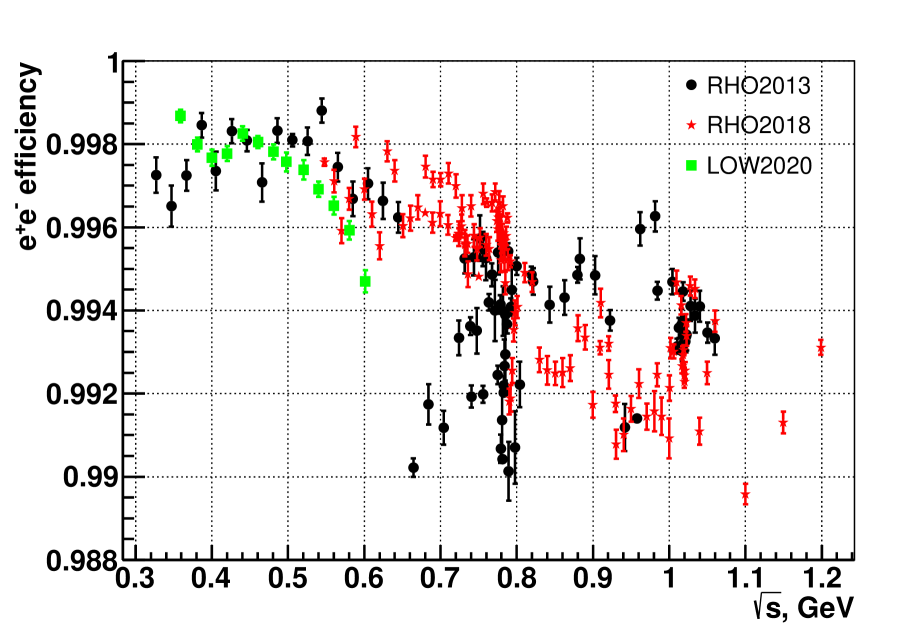
The first energy scan below 1 GeV for the measurement was performed at the VEPP-2000 collider in 2013 (labeled in the text below as RHO2013), when the luminosity integral of 17.8 pb-1 was collected in 66 energy points. In 2014-2016 there was a long shutdown for the collider and detector upgrades. In particular, a new electron and positron injector facility was commissioned, which allowed to increase luminosity significantly. The next energy scan in the -meson cms energy region was carried out during 2017-2018 season (labeled as RHO2018), where about 45.4 pb-1 were collected in 93 energy points. During these two data taking seasons also the luminosity integral of 25.7 pb-1 was recorded in 37 points at the cms energies near the -meson resonance. At the end of 2019, the additional 1 pb-1 data sample was collected in 13 points at the cms energies GeV (LOW2020 scan), which increased statistics by a factor of 2–5 at the production threshold energy region. In total, about , and events at GeV were used in this analysis. The data sample collected by the CMD-3 detector is higher than that in the previous CMD-2 experiment and in the ISR measurements of the BABAR[28] and KLOE[24, 25] experiments, as shown in Fig. 2.
3 Data analysis
3.1 Overview
The process has a simple event signature with two back-to-back charged particles. Such collinear events can be selected by using the following criteria: two back-to-back well reconstructed oppositely charged tracks are presented in the detector, originated close to the interaction point, registered in a high efficient region of the DCH:
| (1) |
where of the track fit and the number of hits on a track () describe the track quality; – the charge, the detection time, the signed impact distance to the beam axis, z-coordinate of the impact point, the momentum, the azimuthal and polar angles are reconstructed track parameters in the DCH; – kaon momentum in the process at beam energy , which is used for an additional kaons filtration above -resonance cms energies. Momentum and polar angle track parameters were corrected for an additional beam and common vertex constraint. This constraint helps us to improve a momentum resolution, important for the particle separation, as well as to reduce a possible contribution to the systematic error from the average polar angle cut.
The selected data sample includes signal pairs, accompanied by pairs and single cosmic muons, passed near the interaction point and reconstructed as pair. There is practically no any other significant physical background at energies 1 GeV.
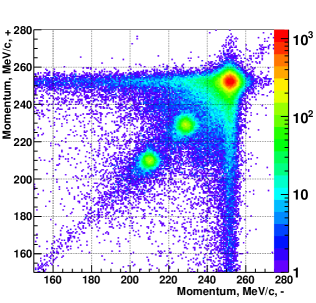
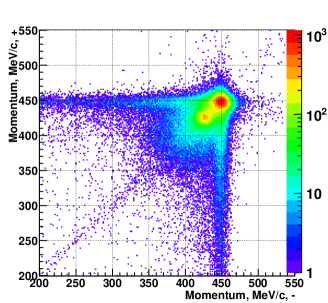
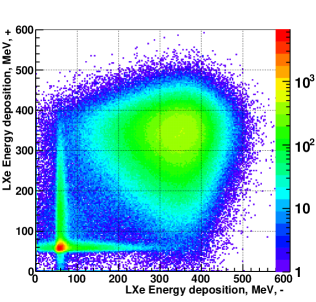
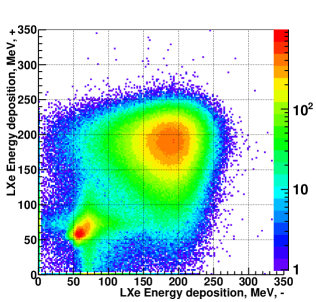
These final states can be separated using either the information about energy deposition of particles in the calorimeter or information about particles momenta, measured in the drift chamber, as demonstrated in Fig. 4 and Fig. 4. At low energies the momentum resolution of the drift chamber is sufficient to separate different types of particles. The pion momentum distribution is well aside from the electron one up to energies of about , while the events are separated from the others up to . Above this energy the number of muons was fixed relative to the number of electrons according to the QED prediction. At higher cms energies the energy deposition distribution of electrons (positrons) in the calorimeter, determined by the electromagnetic shower, is well separated from the similar distributions for the minimum ionizing particles (muons and pions). In order to have the performance of the separation procedure to be stable in the whole energy range, the energy deposition only in the inner LXe calorimeter was used for the particle separation. It helps to keep the peak positions of energy distributions for electrons and pions or muons at larger distance. Usage of a thinner calorimeter also helps to reduce the probabilities of nuclear interactions of pions and muons stops in the calorimeter and makes the distribution of energy depositions narrower and more predictable without more complicated structures. In this approach it is impossible to separate the minimum ionization part of the energy deposition signals from and , therefore the ratio of the number of muons to the number of electrons was fixed at all energies.
The momentum-based particle separation works better at lower energies, while the energy deposition-based separation performs the best at higher energies and becomes less robust at lower energies. The performance of both methods is nearly matched in the dominant -resonance production cms energy range (0.6–0.9 GeV), which gives the possibility for the cross checks between two methods. As it will be shown further, an additional consistency check comes from the analysis of the polar angle distribution, which can be used as the third separation method for an independent evaluation of the ratio of the numbers of the different final states.
3.2 Pion form factor determination
The cross section of the process can be written as:
| (2) |
where is the lowest order cross section of the pointlike pion pair production. The pion form factor is evaluated from the experimental data using the following expression:
| (3) |
The ratio is obtained from the event separation procedure, – the correction for background processes (applied only in the energy deposition-based event separation, where only cosmic events background are taken into account in the likelihood minimization), () – the lowest order cross section of the corresponding pair production in the selected polar angles, – radiative correction for this cross section within chosen selection criteria Eq. 1, – detection efficiency which accounts for a track reconstruction, a trigger efficiency, bremsstrahlung energy loss of electrons, nuclear interactions of pions, pion loses due to decays and etc. The detection efficiency is obtained as much as possible from the experimental data and it is applied in the multiplicative way as corrections to the “ideal” detector case with . The expression similar to the above one was used to predict the ratio of a number of pairs to a number of pairs:
| (4) |
further, this ratio was fixed in the event separation procedure. When the procedure allows to measure the number of muon pairs at the cms energies GeV, the measured ratio is compared to the calculated one as a crosscheck. It should be also noted that the radiative corrections and include the contribution from the vacuum polarization in a photon propagator, while in case of the process it is included in the definition of the pion form factor.
The typical values of the lowest order cross section ratios are and at the cms energy within used rad polar angles, and it gives and together with the pion form factor ( at the peak), radiative corrections and efficiencies.
3.3 Event type separation
The numbers of , , pairs in the selected sample of collinear events are determined by the minimization of the likelihood function constructed for the two dimensional distribution of selected observables for two particles in the pair:
| (5) |
where denotes the event type, is the number of events of type and denotes the measured observable for the positive/negative track. Two independent approaches are used, where is the particle’s momentum or is the particle’s energy deposition in the LXe calorimeter. Probability density functions (PDFs) describe the corresponding 2D distribution for each type of the final state.
In case of the event separation by particle momentum, the construction of PDF functions starts from the ideal momentum spectra for events obtained from the MC generators, in which the collinear signal selection criteria are applied to the generated events. Two independent generators, MCGPJ [38] and BabaYaga@NLO [39], were used, as it will be described later in Section 5. The ideal generated distributions are then convolved with the detector response function which accounts for the momentum resolution, the bremsstrahlung of electrons at the beam pipe and the inner DCH wall, and the pion decay in flight. These apparatus functions are defined in a general way, where the most of their parameters are kept free in the minimization. This allows to take into account long term changes in the detector performance.
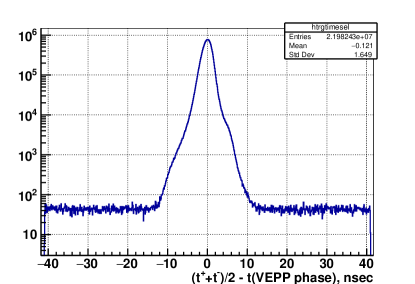
The 2D momentum spectra for the cosmic muon events is constructed from the experimental data by selecting events with the reconstructed time in the DCH away from the beam collision time, as shown in Fig. 5. The time resolution of the drift chamber for the two track events is about 1.–1.5 nsec, which should be compared to the 81.7 nsec time interval between beam collisions. The asymmetrical behaviour originates from asymmetrical distribution of variations of the drift times of DCH hits along a traversed track. The very clean sample of cosmic events can be obtained by applying nsec selection cut. The data sample over each data taking season provides enough statistics for accurate evaluation of the cosmic background spectra. At threshold energy region GeV the detector was operated with reduced magnetic field for a very limited time, having T for RHO2013 and 1 T for LOW2020 data taking seasons instead of 1.3 T normally used. Different magnetic fields lead to the different momentum resolutions and even momentum distributions because of a geometrical selection, so it is necessary to construct the specific PDF function for the reduced magnetic field case. Increased PDF uncertainty due to the limited statistics of the cosmic data here, enhanced by the higher ratio of the numbers of cosmic events to the events, leads to the additional 0.5% systematic uncertainty to the pion form factor measurement at these cms energies.
Momentum spectra of the and () background events are obtained from the full MC simulation. Numbers of events for these background processes passed selection cuts relative to the number of events are for at the peak and for the two-photon four-lepton production events at the lowest energy points. The actual effect on the measured pion form factor is even smaller as their momentum spectra are quite different from that of the signal process. At the other energies the relative number of background events is negligible.
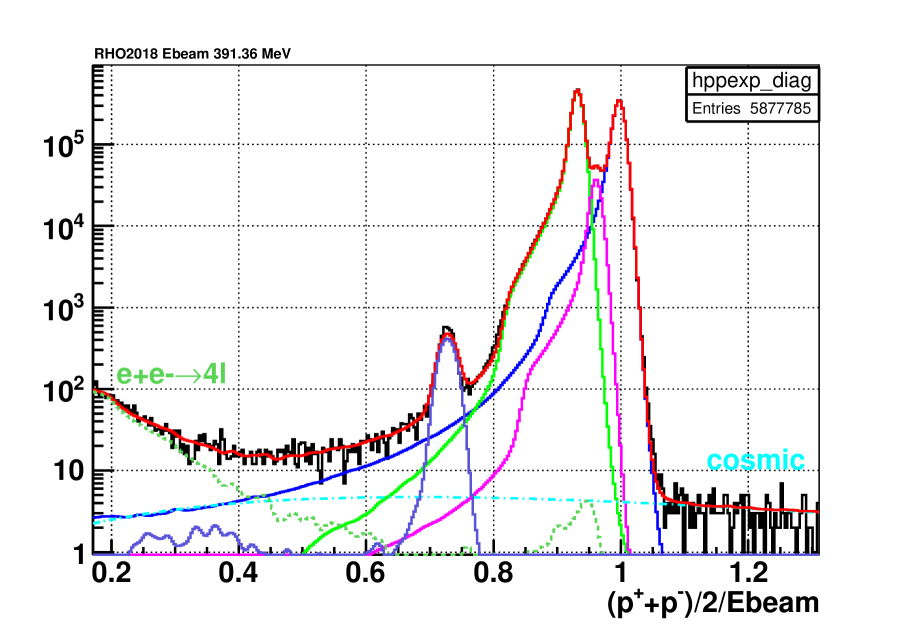
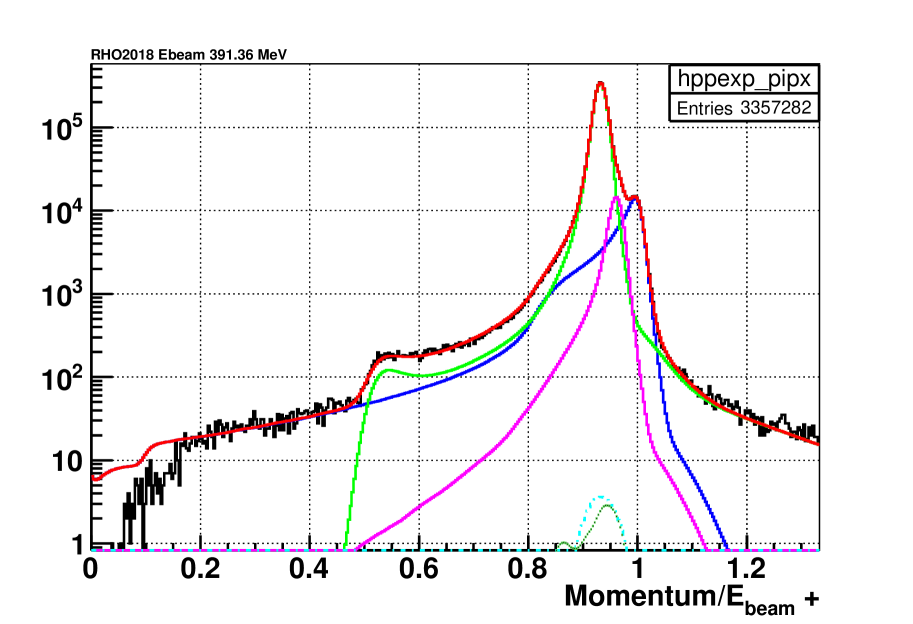
The result of the likelihood minimization based on the distributions of particle momenta for the MeV beam energy point is demonstrated in Figs. 7, 7 for different momentum projections.
In case of the event separation by energy depositions of particles, the PDF distributions are taken mostly from the experimental data. The PDFs are assumed to be factorized over two charges: . The possible correlations between and are introduced as corrections to the main PDF functions. The primary source of the correlation is the dependence of the calorimeter thickness and, correspondingly, the energy deposition on the polar angle of the track. For collinear events the inclinations of polar angles for two particles are nearly the same. The correlation between and is reduced by applying correction on the energy deposition, which takes into account the corresponding dependencies with angle. Not corrected, this correlation leads to the systematic bias of the ratio of about , and after the correction applied the bias is negligible.
The electron PDF is described by a generic functional form, sum of asymmetric gaussian-like with long tails, where all 11 parameters per projection are free during minimization. The small correlation coming from the double initial photon radiation, which gives correlated tail towards lower momenta of both particles, was evaluated from the simulation. The corresponding correlated terms, describing this tail behaviour along momenta of the opposite charge particles, was added to the with fixed parameters. Accounting of this correlation leads to about 0.2% effect on the measured pion form factor in the central -meson peak cms energy region and decreasing with higher energies.
The muon PDF, as for minimum ionizing particles (MIP), is taken from the clean cosmic sample selected by the time of the event as was described before. In case of the process, an additional momentum selection was applied to the full cosmic sample to have momenta in the range of , where . Number of cosmic muons was estimated from the time distribution for each energy point according to Fig. 5 by rescaling from the sidebands ( to the signal region () assuming the flat distribution, and was fixed for the likelihood minimization.
The pion PDF is described as a sum of several contributions. The long tails of the energy deposition of pions, which undergo nuclear interactions in the detector, are described by a generic monotonous function. The functional form for the MIP pions, which passed calorimeter without nuclear interactions, was taken the same as for the muons with a released set of parameters (such as the average energy, width etc.).
The MIP parts of the energy deposition of and events overlap strongly, which may introduce a significant systematic effect on the retrieved number of events after the minimization due to imprecise descriptions of the overlapping PDFs. In order to reduce this effect, the flat 2D-PDF functions for all particle types were used in the range of MeV, which effectively accounts the number of particular events in this region in the unbiased way.
Background events, which will be described in the next Section 3.4, mostly contribute to the signal events (some of them give the same response and some ones directly contribute to the energy deposition signal region), except for the process which contributes mostly to the events. Thus, in contrast to the fit of the momenta distribution, the noncollinear background terms (except for the cosmic events) were not added to the likelihood function, but rather the ratio was corrected for the background after the minimization as correction according to Eq. 3.
The full likelihood function has 36 or 56 free parameters in total to be adjusted during the minimization for the momentum-based or energy deposition-based approaches respectively. Most of these parameters describe the details of the detector response functions in a functionally general way. The separation based on the momentum information is used for the energies up to GeV, while the separation based on the energy deposition information is used starting from GeV.
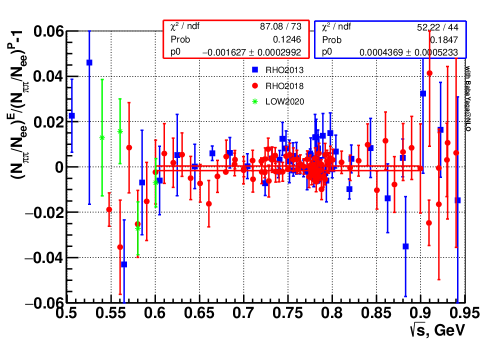
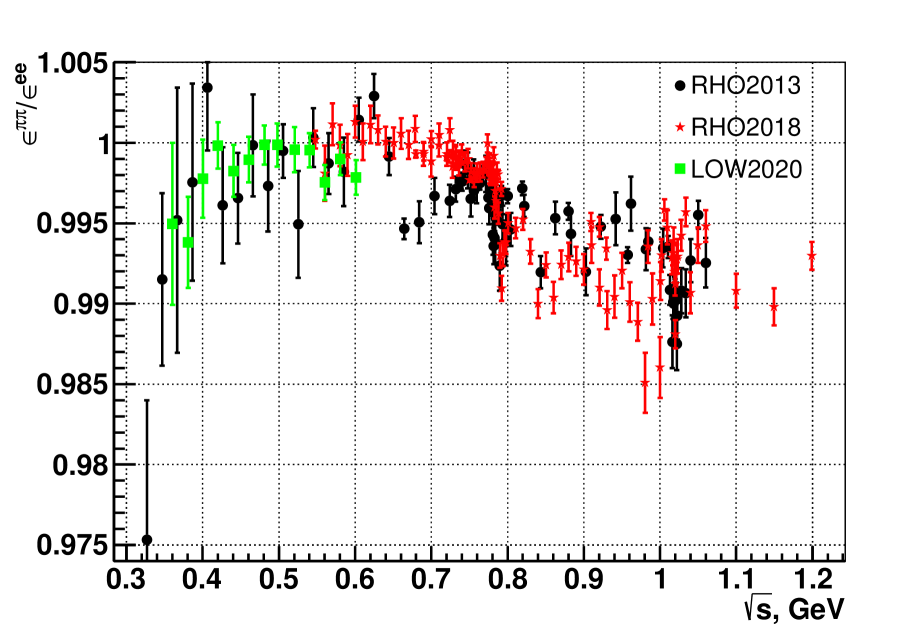
It is known that the maximum likelihood method could provide a biased estimation of the parameters, introducing some systematics. For both separation methods possible biases were studied with the help of the full simulation using mixed statistics of different processes of the same size as for the data. In the -meson resonance cms energy region the systematic uncertainty of the obtained ratio is estimated to be below 0.2% for both methods. At the higher energies, the overlap of the momentum distributions of electrons and pions increases, which degrades the momentum-based separation capability and leads to the growth of the systematic error from 0.2% at GeV to 1.5% at GeV. On the contrary, the distributions of energy deposition of electron and MIPs start to overlap significantly at lower energies, as can be seen in Fig. 4, when the the electron peak position is shifted below 200 MeV at lower energies. At the same time muons start to stop in the LXe calorimeter at the energies below MeV and pions stop at MeV. The distribution of energy deposition of the stopped particles becomes very distorted and it extends well beyond the MIP 2D-PDF box. All these effects degrade the energy deposition-based separation capability leading to the growth of the estimated systematic uncertainty from 0.2% at GeV to 2% at GeV. The observed biases of the ratios after the likelihood minimization on the simulated data are not applied to the pion form factor, they are considered as a part of the systematic uncertainty. The comparison of ratios obtained by two separation methods is shown in Fig. 8. Only specifically for this plot, for a demonstrative purpose, the result of the momentum-based separation was corrected above 0.82 GeV according to the simulation. Figure 8 shows the comparison for the case when the electron’s and muon’s PDFs for the momentum-based separation were constructed using the BabaYaga@NLO MC generator as input. It can be seen that two fully independent separation methods are well compatible within , and the average difference between both methods is in the central 0.7–0.82 GeV cms energy range. Looking at the right side of the plot, good compatibility of the two separation methods on the level below is seen (the fit of the data in the cms energy region GeV gives the average difference of ). The mentioned above bias raise in up to at GeV for the momentum-based separation minimization was already corrected for this plot from the MC simulation. This also indicates good agreement between experimental data and MC simulation for the bias cms energy dependence.
For the final result, the experimental ratios together with their separation-related statistical uncertainties (excluding the common Poisson part of errors) were averaged between two independent separation methods in the GeV cms energy range with weights, equal to the corresponding separation-related systematic uncertainties inverse squared. The merged values were used for the pion form factor determination. Out of the overlap region, it was used either the momentum-based separation at lower energies or the energy deposition-based separation at higher energies.
A further method, which is out of the scope of this analysis, is under development to exploit the full power of the layered barrel calorimeter. The available independent measurements in 7 strip layers of the LXe calorimeter, energy deposition in the CsI calorimeter and transversal cluster sizes give a better discrimination power between different particles due to the different interaction processes involved (electromagnetic shower, ionization process, nuclear interaction). The analysis based on the full information from the combined calorimeter is planned to be the major method for the pion form factor measurement above 1 GeV, where the ratio of the events to the others is strongly decreasing with the cms energy.
3.4 Background subtraction
Possible background sources were tested by the multihadronic Monte Carlo generator [40], which covers most of the processes properly weighted by their experimental cross sections. The reactions of annihilation with the production of the final states: , , , , as well as QED two-photon and production processes contribute to the background. Their contributions were evaluated by the dedicated MC generators: according to the model, kaon production – using the MCGPJ generator [38], four pion events – with the most advanced existing model including various intermediate components [41], four lepton events – by the DIAG36 generator [42].
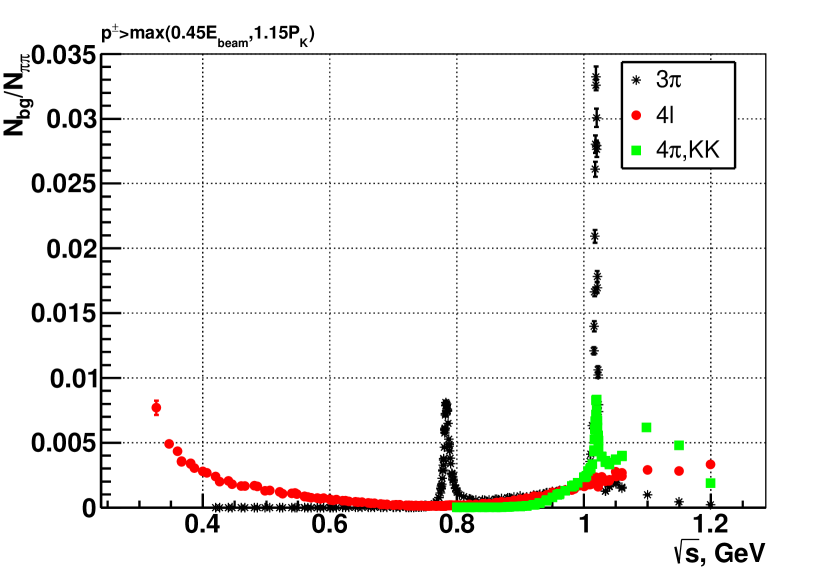
The number of the simulated events of the particular background process normalized to the number of simulated Bhabha events in the used the collinear selection criteria was estimated based on the measured cross section of the process and the calculated Bhabha cross section. In such an approach the common inefficiencies are partially cancelled out. The ratios of the numbers of events for various background processes to the number of events are shown in Fig.10. The largest background is observed at the cms energies around -meson peak with the following contribution from the different final states: – 3.32%, – 0.29%, – 0.07%, – 0.14%, – 0.21%, – 0.12%, – 0.11%. The dominant cross section is known with the precision better than 5%.
The momentum distribution of events only partially overlaps with the distribution of the signal events. This background contributes mostly to the cosmic or events as shown in Fig. 7. Implementation of the corresponding PDF functions to the momentum-based likelihood function results in a change of the extracted ratio for energy points in the range of GeV and negligible in the others.
Since the momentum distribution for the events is well aside from the distributions of the other final states (as seen in Fig. 7), the number of events is also extracted from the momentum-based likelihood fit. Such an approach allows to obtain the cross section as a byproduct of this analysis based on the sample of the selected collinear events. It should be noted that this measurement is based on a small subset of full sample since the cuts for the collinear events are applied. The cross section is calculated using the simplified efficiency correction, based on the efficiency analysis for the events, as follows:
| (6) |
In this approach we take into account: a difference in the pion specific losses between and events, radiative corrections and and the beam energy spread correction . The beam energy spread of about 200 keV results in at most 0.42% correction at the peak of -meson. The detection efficiency of the process () includes the solid angle acceptance factor, in contrast to the other efficiencies in Eqs. 6, 3, which are defined in the polar angle range of rad.
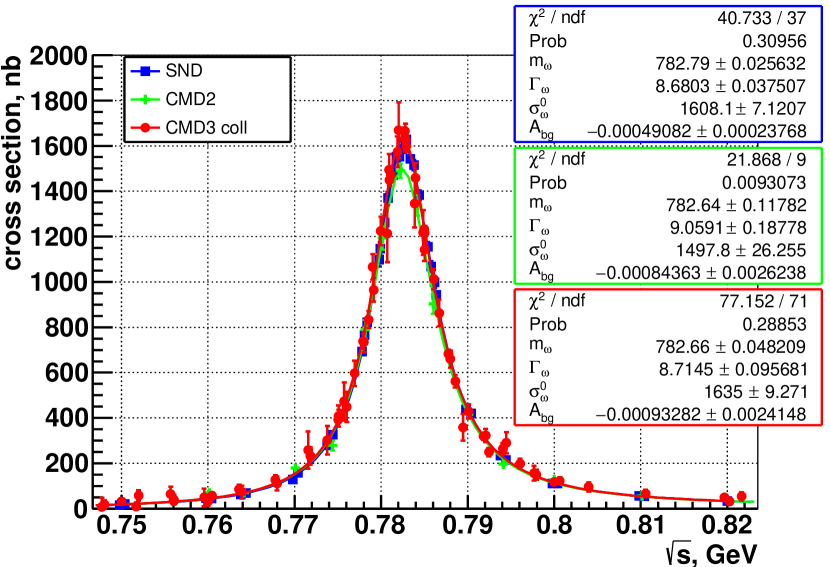
The measured cross section in the region of the -resonance is shown in Fig. 10 together with the CMD-2 [43, 19] and SND [44] results. The fit of the cross section by the same function with the contributions from the and meson resonances as well as the nonresonant background is performed for all experiments. Free parameters of the fit are listed in Fig. 10 while the other parameters are fixed at their world average values [45]. The fit of these data yields the cross section peak value nb (or ) , which is in good agreement with the SND measurement nb and about away from the CMD-2 result nb. The obtained result also agrees well within the systematic uncertainty with the published results by BES [46] and BABAR [47] experiments. The main sources of the systematic uncertainty specific for the process are: a possible difference of the track reconstruction inefficiencies for the and samples (0.5%), a limited MC statistics used for the PDF description (2.0%), an uncertainty of the model used in the MC generator to extract selection efficiency (2.4%). Some sources with the smaller systematic uncertainty contributions are the same as for the process, they will be summarized later in Table 2. The total systematic uncertainty of the cross section in this analysis is estimated as at the cms energies.
The model uncertainty was estimated as a possible contribution from the intermediate state. It comes from the decay according to the paper [48], and it should be suppressed at cms energies near the mass. A non- state at the -meson resonance energies was measured in the papers [49, 44, 50, 51] and the following estimation of the normalized value of the contact amplitude was obtained: (Table 3 from [51]). This corresponds to the ratio at the resonance, if the same contact term is taken and no additional suppression between and energies is applied. The additional amplitude could interfere with the main with different relative phases, the worst case leads up to about 2.4% possible change in the total efficiency of collinear events selection (Eq. 1) for events. The effect from the inaccuracy of the PDF description was estimated using different parameterizations. The variation of the constructed PDF gives the consistent changes in the fit results for both data and MC simulation. Thus, the related correction was taken according to the simulation, and the the value of the correction is conservatively considered as the corresponding systematic uncertainty.
While the most of the contributions to the cross section systematic uncertainty can be improved with more advanced treatment within the same analysis procedure, but the dominant model uncertainty comes from a limited knowledge of the possible intermediate states of the production and will be improved in a dedicated analysis of the full event sample.
To test the accuracy of the background subtraction in the process, the more stringent cut on minimal momentum was applied: (instead of ) and (instead of ). It reduces the numbers of background events by at the -meson peaks, respectively, and more than by a factor of 5 for the other channels around the -meson resonance cms energies. The pion form factor obtained with the new cuts, changes by and in average at the cms energy points near and meson resonances, respectively. This ensures that the background estimation itself is consistent at the level of . Thus, the corresponding background knowledge contribution to the systematic error of the pion form factor measurement is estimated as 0.05% at the -meson peak, 0.2% at the -meson peak. The systematic error increases linearly from 0 to 0.15% for the GeV outside the -meson resonance.
4 Detection efficiency
4.1 Selection efficiency
The sample of collinear events used in this analysis is selected by only the tracking information from the drift chamber in accordance with Eq. 1. Assuming that the reconstruction of the drift chamber data and calorimeter data are independent, it becomes possible to measure the efficiency of the tracking-based selection criteria by using a sample of the test events independently selected in the barrel calorimeter. For this purpose, the test sample of collinear events was preselected with only two back-to-back clusters in the barrel calorimeter in the same fiducial volume as for the primary sample:
| (7) |
where – the azimuthal and polar angles of the detected clusters, – the average z-coordinate of the clusters. The correction describes the particle deflection in the magnetic field of the detector. In order to suppress the background, it is required that there are no additional energetic clusters in the endcap part. To reduce the contamination from other backgrounds, the presence of at least one good track (by the and ) originated from the beam interaction point and connected to one of the clusters by the angle and the impact point on the inner surface of the calorimeter is required. The correlated losses of both tracks were studied separately, as will be described below.
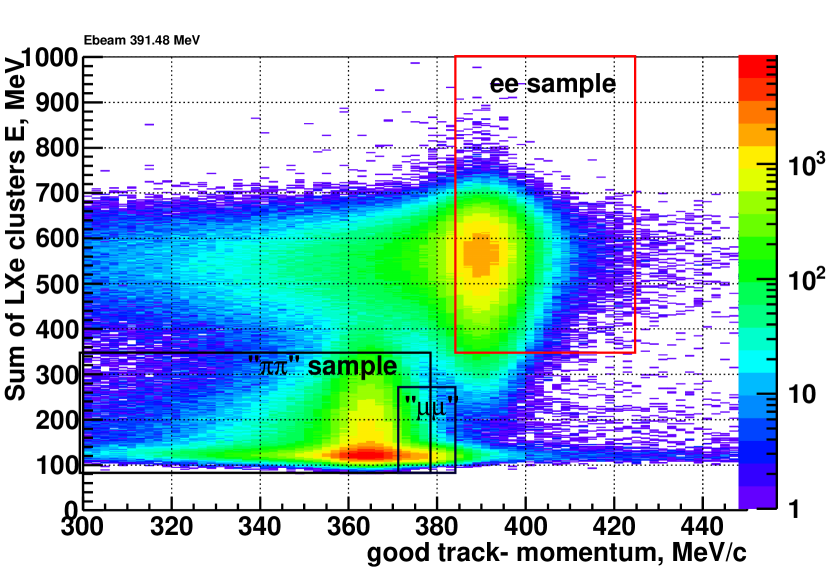
Then, this test event sample is subdivided into three type classes according to the energy deposition and momentum of the good track as shown for the MeV beam energy point in Fig. 12. This gives a clean sample of Bhabha events and mixed sample of “MIP” events ( and ). At lower energies GeV the energy-momentum selection also allows to separate the samples of and events.
For the purpose of the efficiency analysis the selection cuts Eq. 1 are splitted into the basic set, to find compatible tracks with , and charge cuts, and all the rest. The efficiency of the basic set (base efficiency in the following discussion) was directly measured using the test sample as the probability to find two good tracks in the test event, where the both tracks should be compatible by the basic set of cuts. The efficiencies of the remaining cuts were studied separately.
The , and cuts inefficiencies were studied using the data itself. The typical resolution of the impact distance of a track to a beam axis is about 0.25–0.3 mm for a single track, therefore the cut on the average impact parameter mm is very weak, designed mainly to reduce cosmic events background. The cut on the suppresses the long resolution tails of the distribution. The remaining inefficiency of the applied cuts on the , beyond included in the base efficiency and which could arise when both tracks have same value on long tails in the distributions, is negligibly small.
The same thing is for the nsec cut, the main purpose of which is to have possibility to select the clean sample of cosmic events by the time of an event as shown in Fig. 5 (or, reversely, to reduce in addition the cosmic background). The core resolution of the time of the track is about 2 nsec and the measured inefficiency of the selection is at the level of that comes only from the tails of the time distribution. Moreover, the difference between the and inefficiencies, which is only relevant for the determination according to Eq. 3, is at the level of .
The , , and momentum cuts determine the lowest order cross section and the radiative corrections calculation in Eq. 3. Any bias in these cuts lead to corrections to the , which can also be considered as additional contributions to the inefficiency and it will be discussed later in Section 7. Several possible effects, such as an additional resolution smoothing effect or energy losses in the detector, were estimated using the full MC simulation, in which the detector conditions such as the resolutions, the correlated noises, etc. were reproduced as in the experimental data at each energy point. The typical one track angle resolutions are mrad and mrad, which should be compared to the and cuts of 0.25 and 0.15 rad in Eq. 1, respectively. The overall effect from angle resolution, obtained using the full detector simulation, gives about (0.10–0.25) % inefficiency correction for the events, with the largest correction observed for the 2013 data taking conditions. Nevertheless, the difference of the and inefficiencies is less than (0.05–0.10) %, except for the narrow energy range GeV, where the additional correction for the events grows up to 0.25%. This is because of the ISR radiative return from these energies to the -meson cross section peak, which produces the noncollinearity of rad, that affects the distribution at the edge of the applied selection cut.
The CMD-3 drift chamber has high efficiency for particles with the polar angle in the range rad, when a track passes all wire layers. At lower angles the number of hits on tracks starts to drop rapidly, worsening also the resolution of the track parameters. To properly account for the edge effects it is important to evaluate the inefficiency of the cut on in exactly the same fiducial volume restriction within the same definition as used for the pion form factor measurement. This inefficiency is studied using the full collinear event sample selected with the standard set of cuts by Eq. 1 with cut released. The dependence of this inefficiency on the for different types of events is shown for one of the energy points in Fig. 12 ( MeV, RHO2013). The edge effects are different for the and events, mainly because of the different ionization energy losses () in the DCH. The base efficiency, described at the beginning of the section, was adjusted to avoid double counting; if the event was rejected only by the cut on the , this cut was ignored and the event was considered as passed the selection criteria.
To increase luminosity, the collider was operated with the long beams during the last part of the season in 2013 and afterwards with the typical size of the beams interaction region of cm along the beam axis (with cm in the first part of the 2013 season). The long beams have comparable length to the length of the drift chamber with cm. To ensure that the selected tracks in the used range of polar angles were still inside the good fiducial volume of the DCH, the strong enough cut on the longitudinal coordinate of the event vertex cm was applied as listed in Eq. 1, which filtrates up to 10% of events. This inefficiency was extracted from the analysis of the distribution, which is constructed with the cut released. Energy deposition from the combined calorimeter, including the BGO endcap part, was used for the event type tagging. These modifications on the signal sample and tagging were necessary to avoid possible distortion of the tails of the distribution due to inefficiencies. The cosmic background, originated not from beam interactions, is well predicted and was subtracted using the event time as shown in Fig. 5. While the selection inefficiency has sizeable values, originally from the collider it is exactly the same for all processes. Possible differences may come from the different angular dependence of the efficiencies and edge effects for the and events. But as long as we stay in the highly efficient volume of the detector, this difference is negligible. The additional detector related effect from the track Z-vertex resolution mm contributes to the efficiency much smaller, of the order of . And the difference between the and Bhabha events is even smaller with the typical values of the , with at most up to 0.3% at the GeV when the enormous correlated noise situation was observed in the detector during the part of the 2018 season and about 0.4% at the GeV for the 2013 season. This was studied using the full detector MC simulation and cross checked by the data using samples of events of different types as mentioned above (see Fig.12).
The described above procedure to reconstruct efficiency assumes that sources of the inefficiencies treated separately are not statistically correlated within used acceptance. High precision goal of this study requires to prove this assumption. This assumption may not be valid if a detector performance is strongly degraded, especially when the inefficiencies are large and the second-order effects become significant. Either the events with large are used, which adds short tracks with the deteriorated parameters at the edge of the tracking system. Possible level of the correlations was studied with the help of the full MC simulation, which shows an unaccounted correlated inefficiency of at the GeV for events and for in the RHO2013 data taking season. The effect is 2-3 times smaller for the RHO2018 season, when the DCH was in much better conditions. The main sources of these inefficiencies originate from the correlations between , cuts and , , selection criteria. The difference of the correlated inefficiencies between and samples is about 0.1% at the -meson cms energies and 0.15% at the GeV for the RHO2013 season. They were considered as the corresponding contributions to the systematic uncertainty of the pion form factor measurement.
As it was discussed earlier, at least one good track was required for the test event selection. However, the loss of both tracks could not be fully independent. The probability of the loss of both tracks in an event in a correlated way is also studied with the specially selected test events without requirement of the presence of a good track. To suppress a higher background level from cosmic events, the additional compatibility requirement was introduced for the collinear topology of the track segments reconstructed in the calorimeter, which were solely determined by the ionization coordinates in the LXe strip layers. The number of events originated from the beam interaction point with both tracks lost was extracted by the analysis of the distribution. The typical value of the correlated inefficiency to lose both good tracks are and increases with the beam energy. The difference of the inefficiencies between and events is about 0.05% at the GeV and at the cms energies above 1 GeV. These values were taken as the contribution to the systematic error of the trigger efficiency, as the main reason of the correlated loss of both tracks is related to the out-of-sync trigger issue.
4.2 Particle specific losses
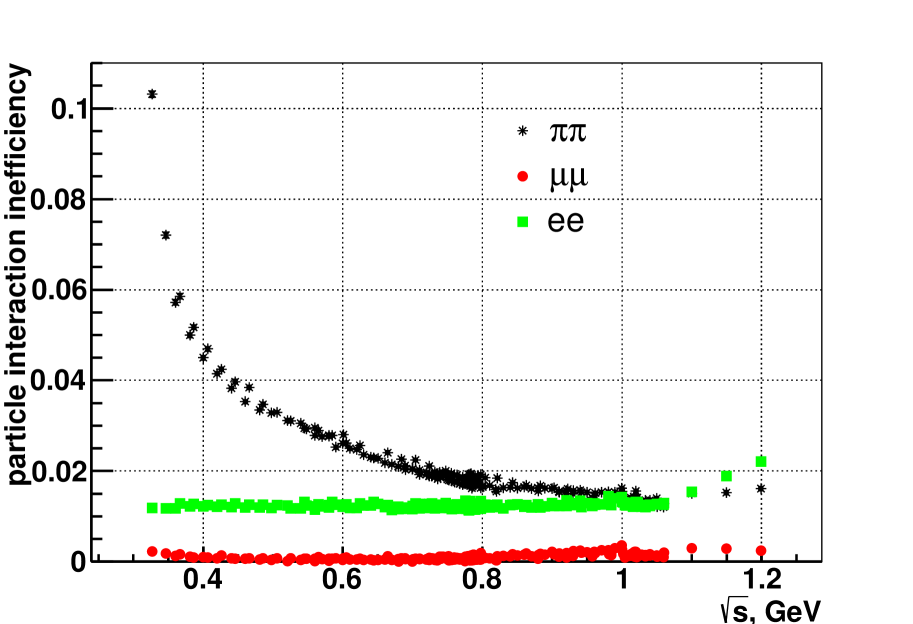
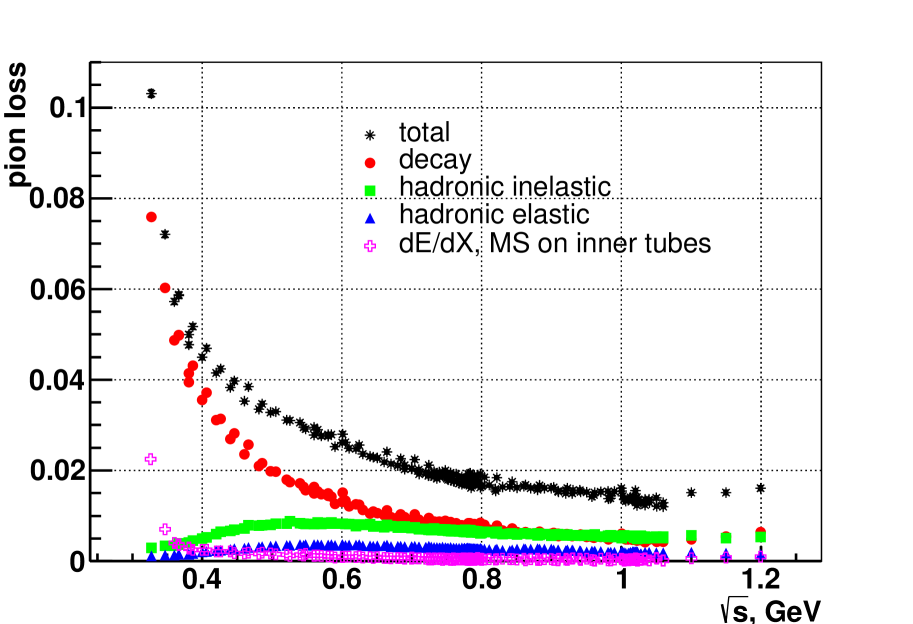
The events under study may be lost not only from the track reconstruction inefficiencies in the DCH, but also because of the particle specific losses like the decay in flight, bremsstrahlung, the nuclear interaction with the detector materials, and multiple scattering (MS) on the wall of the beam vacuum pipe. Some of these lost events without collinear cluster in the calorimeter are not included in the test samples. Hence, they are not taken into account in the efficiency determination described in the previous section. The already accounted part of these losses for the events is about at the -meson resonance cms energies, for the events and for less than 10%. The particle specific losses mentioned above are extracted by using the full MC simulation of the detector. The corresponding correction is taken as the ratio between the full efficiency obtained in the MC simulation and the efficiency obtained with the subset of events when no any mentioned above process is happened in the tracking volume. The MC efficiency was defined as the ratio of the number of events passed selections after the full reconstruction to the number of events within acceptance at the generator level. The efficiency also takes into account the effect of the finite detector resolution, when the filtrated events after the generators are returned back to the selected sample after the reconstruction. The overall particle specific inefficiencies are shown in Fig. 14 and the different contributions to the event loss are shown in Fig. 14. Changes in the inefficiency trends at the GeV come from the additional momentum selection to filtrate kaons, which start to contribute here as listed in Eq. 1. To exclude double counting, the corresponding particle specific losses parts were subtracted from all efficiencies described in the previous Section. 4.1. These corrections were determined for the each specific test data samples which are used in the estimation of the corresponding inefficiencies mentioned above. It was also taken into account that the selected test samples have an admixture from the different types, for example, the “MIP” sample includes about 5% of the events at the -meson cms energies and up to 50% near the -meson resonance.
The efficiency correction due to the bremsstrahlung for electrons is about , where the main part comes from photon radiation on the wall of the beam vacuum pipe (with the thickness of 0.00575) and the inner wall of the DCH (0.00241), while the contribution from the material in the DCH gas volume is about 0.15%. The related material budget is known with the precision better than 5% of the total . Moreover, its effect can be extracted from the analysis of the momentum spectra of electrons obtained in the particle separation. The functional addition from the bremsstrahlung to the base momentum tail from the generator was incorporated in the PDF definition for the events, where one of the free parameters is related to an effective . The part of the bremsstrahlung inefficiency, when events don’t pass only the momentum cuts in Eq. 1, is about 0.9%. These numbers obtained from the fitted PDF on the the experimental data and on base of the full MC sample are consistent at the level of . The additional uncertainty to this comparison comes from the different initial momentum spectra provided by BabaYaga@NLO or MCGPJ generators. The momentum tail for electrons comes almost equally from the radiative corrections and the bremsstrahlung process in the detector. The consistency check above comparing the data with the MC prediction includes both effects. The systematic uncertainty related to the bremsstrahlung loss for the events is estimated as 0.05%.
The nuclear interaction of a pion leads to its loss with a probability of less than 1%, mostly coming from the interaction with the wall of the beam vacuum pipe and the inner wall of the DCH. The precision of this correction was conservatively estimated as 20%, as a knowledge of the hadronic cross sections implemented in the geant4 toolkit, in accordance with the previous studies [19, 30].
The strongest pion loss comes from the decay in flight, where the number of events decaying in the DCH volume changes from 3% at -meson resonance cms energies to 13% at the lowest energy point. While this process is precisely known, complications come from the produced broken parts of the track inside the DCH volume, making the reconstruction to be highly dependent on the detector performance condition. The momentum spectrum of pions is shown in Fig. 7, where the left tail comes from the muon spectrum after the pion decays at the beginning of the tracking volume, and the right tail is produced when the decay vertex appears in the middle of the DCH. The latter case gives confusion for the reconstruction of a broken trajectory, which can be found as a single track. It can be viewed in Fig. 7: the green line shows PDF and magenta line shows PDF without effect of the subsequent muon decay. The forms of these left and right parts of the momentum spectrum were fixed separately from the full simulation, while the numbers of events in these tails were free parameters during the likelihood minimization. It provides the possibility to control the reconstruction efficiency of such decay in flight events in comparison with full MC simulation. The consistency between data and MC simulation on the number of events in the pion decay tails is about (1–3)% (as averaged over the statistics of the different seasons). The worst inconsistency was observed in the 2013 season when a few layers in the middle of the DCH were not operating. It should be noted that to improve the consistency, the most recent CMD-3 detector MC simulation includes different detector specific effects in the DCH, like: amplitudes variations, wires inefficiencies, correlated noises on both ends of the wire readout, resolution dependencies with layers and etc, which were conditioned with time per each collected energy point. And the bare DCH description, without account of all these effects, was given inconsistency of about 15% in the reconstruction efficiency of pion decayed tracks. The other check of this pion decay inefficiency correction was performed with repeating the full analysis with the relaxed cuts: , , . The looser cuts make the pion decay inefficiency smaller by a factor of 2–2.5 at the GeV, but the pion form factor variation is only at the level of for the RHO2013/RHO2018 seasons.
Based on the data-MC inconsistency, the corresponding systematic uncertainty in the pion form factor measurement from the pion decay inefficiency was estimated as 0.1% at the -meson resonance cms energies and 0.2% at the lowest energy points. The dependence of this estimation on the cms energy was taken from a comparison of the comprehensive drift chamber simulation and the bare DCH MC simulation case. Or in the other words, the ratio of the events with the pion decays in the DCH volume is about 3% at the -meson resonance cms energies, and 3% inconsistency in the reconstruction of the pions results in about of the full efficiency uncertainty. While at the lowest energies a fraction of the tracks, which can be potentially reconstructed and selected in the collinear sample (excluding the extreme cases when, for example, the angle of the decayed track disobeys the collinearity condition), grows up to 7% that corresponds to 0.2% systematic uncertainty.
The overall efficiency (without selection inefficiency, polar angle resolution and bremsstrahlung corrections) is shown in Fig. 16. While the ratio of the and efficiencies is shown in Fig. 16 and the particle specific corrections shown in Fig. 14 are not included in this plot. The severe change in the at the GeV for the RHO2018 season comes from the deplorable noise conditions in the detector during scanning from higher to lower cms energies. And during the RHO2013 season, the DCH was operated without few layers in the middle of the drift chamber, that strongly affects the tracking performance.
4.3 Trigger efficiency
Two triggers are used during the data taking: “charged” and “neutral”, which are assumed to be independent at the first order. The signal of the “charged” trigger is produced by the track finder (TF) module. TF collects the information from the tracking system and searches for a signature of at least one track in the drift chamber (as 3 nearest groups of wires, which are fired in 6 DCH outer layers). The signal of the “neutral” trigger is produced by the cluster finder (CF) module. CF processes the information from the calorimeter about the energies and positions of the clusters and searches for neutral patterns above some energy deposition thresholds. Having two independent trigger signals at the same time allows to study the efficiency of the certain module with the data sample having signal from another one.
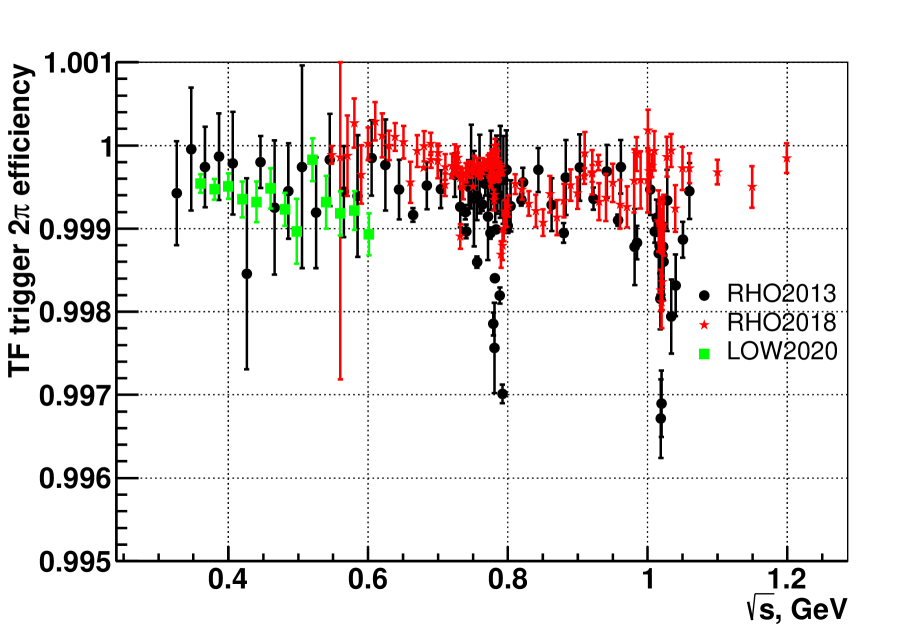
In case of the TF, the trigger efficiency as a function of the polar angle is obtained for the sum of all collinear tracks, and then it is convolved with the angle distribution of the particular process. The inefficiency of the TF for a single track is about 1% when the track passes all DCH layers. It gives better than 0.1% inefficiency, , for the events with two tracks within the polar angles radians and increases to around at the radian. The overall “charged” trigger inefficiency for the selected collinear events is about (0.05–0.15)% with at most 0.2–0.4% for a few energy points as shown specifically for the events in Fig. 18 for the different data sets. As a cross check, the TF efficiency is also obtained in an integral way using the event classes with different energy depositions, in the similar way as it was described in the previous section 4.1. A consistent result has been obtained.
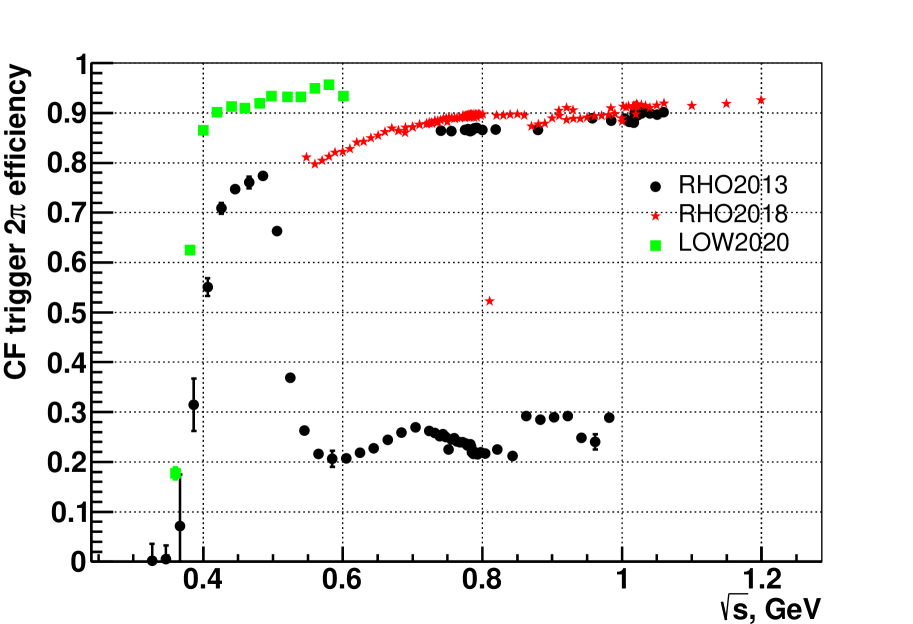
The CF trigger efficiency is evaluated as a function of the energy deposition of two clusters, and then it is convolved with the energy deposition profile of the specific process. The CF efficiency is usually as high as (97–99)% for Bhabha events at the cms energies around the -meson cross section peak, and it is decreasing down to 92% for the cms energy points below the GeV. The CF efficiency for the events is around 90% at the -meson resonance peak, but part of the 2013 data were collected with a higher energy deposition threshold, decreasing the CF efficiency to about 20%, as it is shown in Fig. 18.
Nevertheless, assuming the independence of the TF and CF triggers, the total trigger efficiency (TF or CF) for the events is well above 99.94% everywhere in this analysis, and it is even higher for Bhabha events.
An additional analysis is performed to study possible correlations between the two trigger signals due to a difference in time or in the event topology. Generally, two triggers are not fully independent as they have the very different time response, as the different physical processes and detector electronics are involved. It can give different probabilities to loose an event due to a out-of-sync time for the different detector channels. The TF trigger has faster response time as compared to the CF, and it gives a predominance of the TF over the CF to fire the event when both trigger signals are present. This could introduce a correlation between the triggers via different event efficiencies in the presence of either only one trigger or both of them. It is worth noting that the track reconstruction efficiency depends on the type of the trigger. For the charged trigger which utilizes the information from the DCH, the track reconstruction efficiency is higher than that for the neutral trigger based on the information from the calorimeters. The existence of the charged trigger implies that the signatures of the tracks have been already reconstructed in the DCH, hence the track reconstruction efficiency is naturally high. In contrary, in case of the neutral trigger, signatures of the tracks in the DCH are not guaranteed and also the trigger starting time is not optimal for the DCH electronics. As a result, the track reconstruction efficiency is lower for the events passed only by neutral trigger. This effect is taken into account by the detection reconstruction efficiencies calculated for the specific triggers combination. They are used in the evaluation of the trigger efficiency as: , where and – number of the selected events and the reconstruction efficiency for the data sample with the presence of the trigger signal (regardless of the TF presence) or with the presence of both signals in the event. The account of the ratio of the trigger conditional efficiencies gives the correction factor of for the TF inefficiency in comparison with the simplified estimation. Impact on the CF inefficiency is more moderate on a percentage level for the events. This effect was already included in the values of the TF and CF efficiencies listed at the beginning of this subsection and shown in Figs. 18, 18.
The other issue, related to the trigger system operation, is to produce a starting time too late, which leads to a correlated loss of both tracks in the drift chamber due to a limited DCH digitizer time window, while an energy deposition in the calorimeter is still present in an event. This was discussed at the end of Section 4.1 and the corresponding trigger related systematic uncertainty, 0.05% at the GeV and 0.3% at the cms energies above 1 GeV, is assigned.
Few other hypothesis on possible hidden correlations were checked. For example, if the “neutral” trigger signal could somehow spoil the final trigger response, it should gives a different effect on the total efficiency in case of a different rate of the CF trigger presence. A comparison of the above mentioned two datasets from the RHO2013 season, with the very different 90% or 20% CF efficiencies for the two pion events, shown in Fig. 18, can be such a cross-check of hidden correlations. The measured form factors for both CF trigger conditions are statistically compatible with the average relative difference .
4.4 Total efficiency vs polar angle
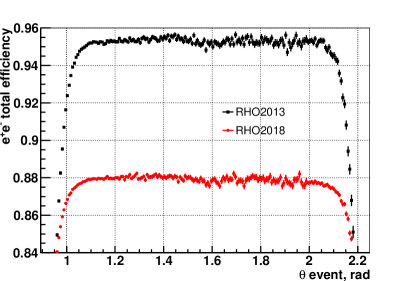
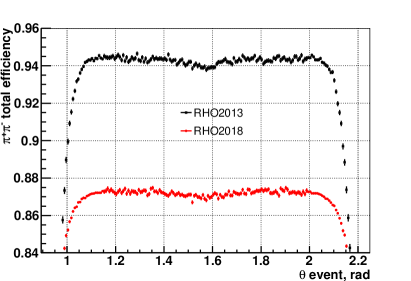
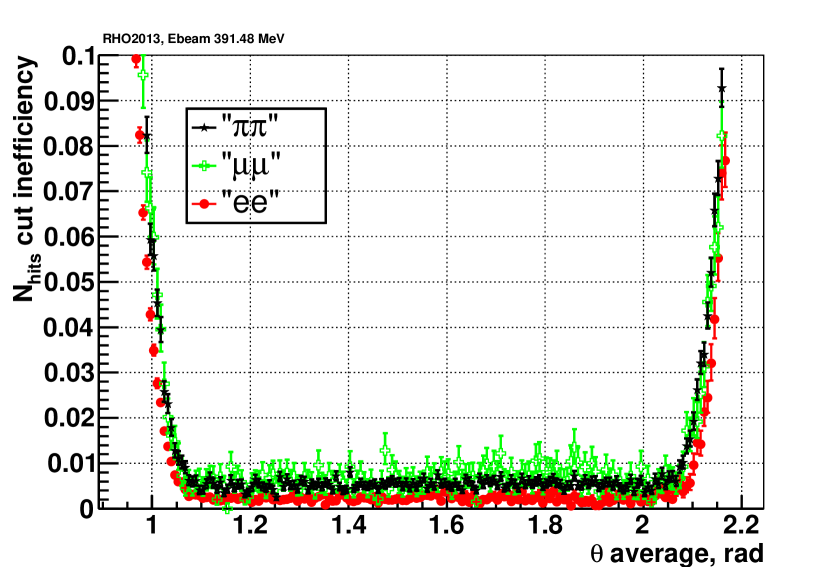
The total detection efficiency for the and events versus the polar angle averaged over the GeV energy points is shown in Fig. 19. It includes all the known effects described above and corresponds to the differential behaviour of the defined in Eq. 3. The main efficiency loss comes from the Z vertex selection with the average efficiencies of 97.0% and 89.2% for the RHO2013 and RHO2018 data samples, respectively, and it is nearly the same for the and events. The efficiency dependence is well symmetric over radian, with a small dependence at the level for the events because of not symmetric differential cross section. The drop of the efficiency at the level around radians comes from the Z vertex selection and the polar angle resolution effects. The angular resolution changes by a factor of 2 from the 1 to radians due to the charge screening effect reducing the amplitudes for the tracks perpendicular to the wires in the DCH. The drop of the efficiency by 2% and 4.5% at the edges of the used angle range comes from the requirement on the number of hits in the DCH, as shown in Fig. 12.
5 Radiative corrections
The radiative corrections for the final states are calculated by the MCGPJ [38] generator, while for the process it is preferable to use the BabaYaga@NLO [39] generator. All these generators are based on the next-to-leading order (NLO) calculations, and the higher order terms in some approximations (the parton shower approach, collinear structure functions, etc). The declared precisions are 0.2% for the MCGPJ and 0.1% for the BabaYaga@NLO generators. Both generators are consistent in the integrated cross section at the level better than 0.1% for Bhabha process [52], but the BabaYaga@NLO somewhat better describes the differential distributions as it will be shown later. In case of the process, the initial momentum spectrum to construct the PDF, used in the momentum-based separation, is taken from the BabaYaga@NLO, while the integrated radiative correction is calculated by the MCGPJ. In case of the BabaYaga@NLO generator, the muon mass term is missed in the FSR virtual correction [52], which results in the 0.4% underestimation of the cross section at the lowest energy point used in the analysis.
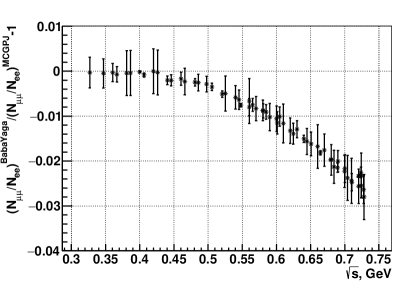
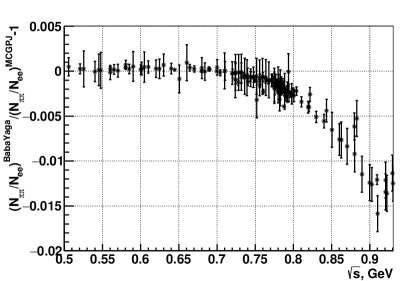
The high statistics collected with the CMD-3 detector allowed to observe a discrepancy in the momentum distribution between the experimental data and the theoretical spectra from the original MCGPJ generator based on the paper [38]. For example, notable excess of the fitted function over the data was observed in the momentum range in the Fig. 7 before special MCGPJ modification. The source of the discrepancy was understood: the collinear approximation for the photon jets was not good enough to describe the differential cross section in the momentum distributions when energies of both final leptons are much smaller than the initial values (when two energetic photon jets are involved in the kinematic). Therefore, the modified MCGPJ generator is used in this analysis with several improvements, where the main one was an inclusion of the photon jet angular distribution as for the one photon approximation. Even after these modifications, the difference still remains in the momentum far tails at the level of about between the modified MCGPJ and BabaYaga@NLO generators. The effect of the usage of the different momentum distributions from different generators indicates a possible systematic uncertainty from the differential cross section prediction. The momentum spectra from the generators are essential only for the particle separation based on the momentum information for the PDF construction, and the corresponding impact on the extracted and ratios are shown in Fig. 20. This gives the sizeable effect on the measured cross section, and as it will be shown later, the data are consistent with the prediction when the BabaYaga@NLO generator is used. This is one of the reasons, along with others that will be mentioned later, why the BabaYaga@NLO is preferable to use for process.
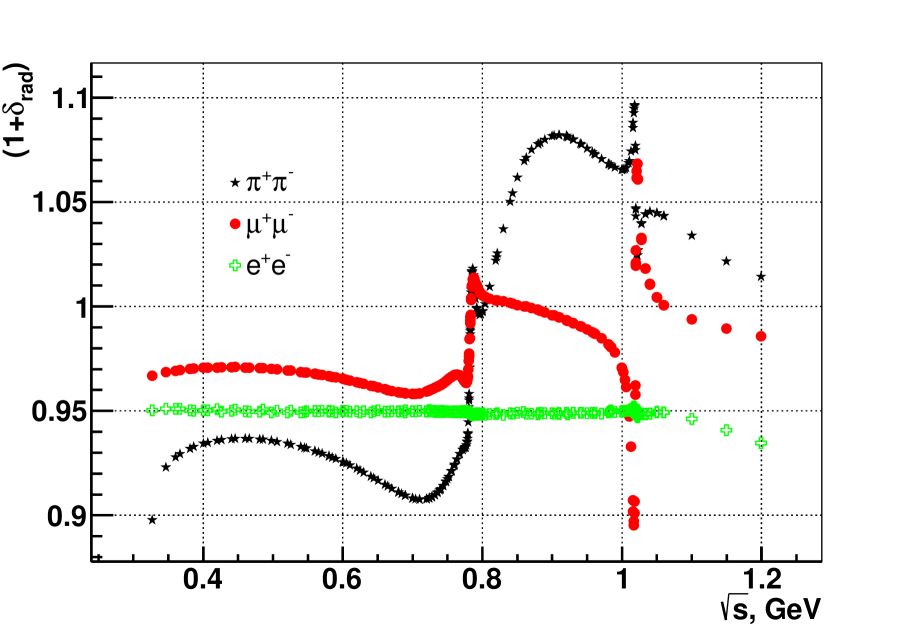
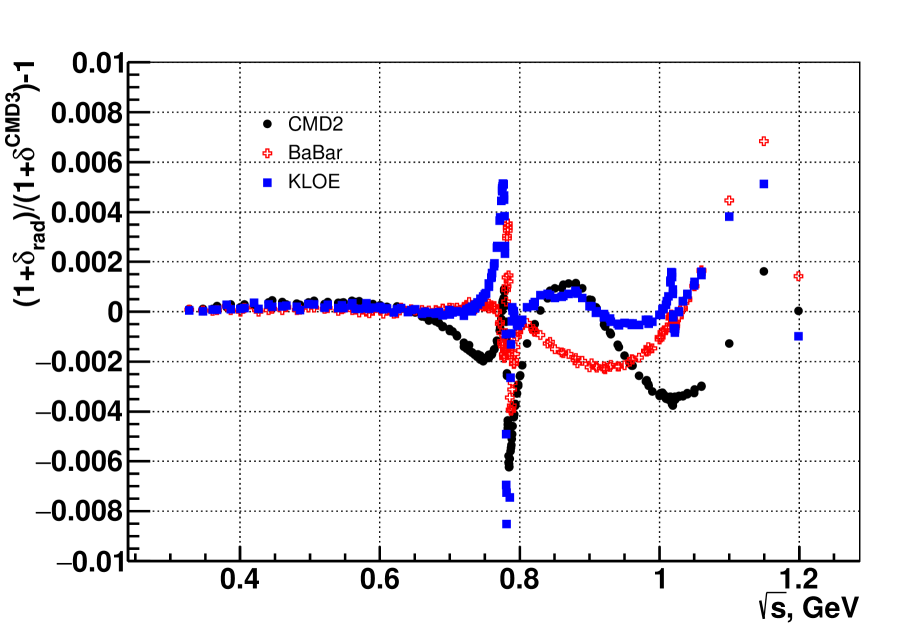
The radiative correction for the process does not include the vacuum polarization term in the photon propagator, as it is considered to be an intrinsic part of the hadronic cross section and is already included in the definition of the pion form factor. The radiative correction for the process depends on the used pion form factor parameterization as input, so the iterative calculation is necessary. Three iterations are enough to reach the precision except for the cms energy region around -meson resonances, and another two to get the same value convergence at the fast changing cross section near these narrow resonances. The obtained radiative corrections for the collinear events passed the selection criteria in Eq. 1 are shown in Fig. 22, where there are only relevant cuts on the , , and are applied at the generator level.
To estimate a possible systematic effect on the radiative correction from the different pion form-factor parameterizations, the various experimental datasets from the BABAR, KLOE and CMD-2 measurements are used and they are fitted separately according to the form factor parameterization as will be described in Section 8. Parameters of the decay are fixed from the CMD-3 measurement. The relative differences of the calculated in case of the BABAR, KLOE and CMD-2 parameterizations and the CMD-3 case are shown in Fig. 22. The fast change near the -meson resonance is coming from a possible energy shifts in different experiments, and it should be accounted for in the corresponding systematic uncertainty, related to the beam energy scale. The CMD-2 measurement is limited by the statistics at higher cms energies, what results in a larger radiative correction uncertainty. The influence of the pion form factor behaviour on the radiative correction is added as an additional systematic uncertainty with 0.2% at the cms energies GeV and at the highest few energy points GeV.
6 The forward-backward charge asymmetry
6.1 Asymmetry measurement
One of the most significant sources of the systematic uncertainty comes from the fiducial volume determination, and good understanding of the observed angular distributions is important for the investigation and control of this contribution. Quantitative characteristic of the angular differential cross section is the forward-backward charge asymmetry. The asymmetry is strongly affected by used models for the description of the pion with photon interaction in the calculation of the radiative corrections for the channel. The comparison of the experimental asymmetry with the theoretical predictions can be rather sensitive test for the models [53, 54, 55].
The measured asymmetry is defined as a difference between the detected numbers of events to the forward and backward regions of the detector:
| (8) |
where is defined as the average polar angle of an event, and event selection criteria are the same as for the main cross section analysis in Eq. 1. The numbers of events in this expression were corrected for detector effects like inefficiencies, resolution smearing, etc, so that the measured asymmetry can be directly compared with the predictions obtained with a Monte-Carlo generator. The applied total selection efficiency versus the polar angle was discussed in Section. 4.4.
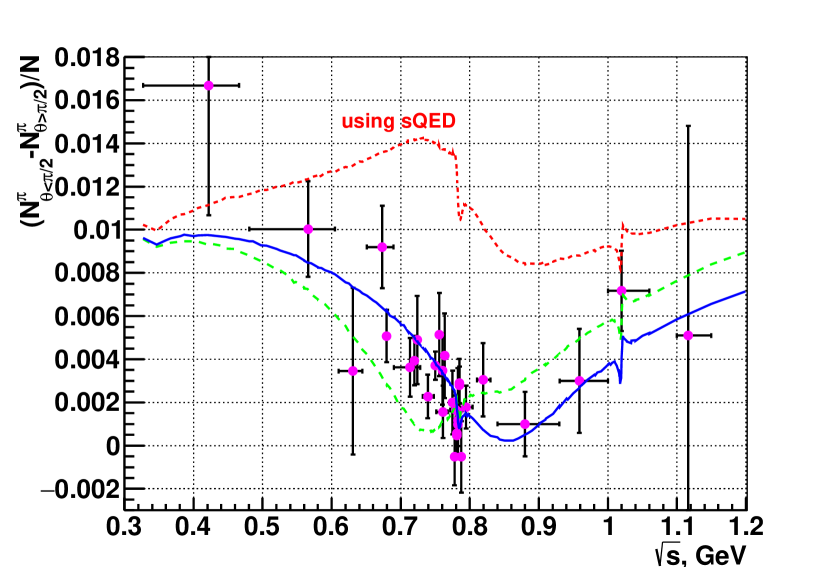
The obtained experimental asymmetry together with the theoretical predictions are shown in Fig. 25. The points correspond to the overall statistics collected at this moment with the CMD-3 detector at the GeV. On this plot, some of energy points are merged together, where the mean energy is the weighted by the numbers of events averaged and the horizontal error bars show the energy range of the merged points. Different theoretical predictions are also shown on this plot, where the dotted red line corresponds to the conventional approach based on the scalar QED (sQED) assumption [58], which is usually used for the radiative correction calculations. The discrepancy of this prediction with the experimental data is much larger than the statistical uncertainty of the measurement. The dependence of the asymmetry on the invariant mass of two pions shows that this deviation comes from the virtual corrections, when , and gave a clue that the source of the discrepancy is related to the calculation of the box like diagrams within the sQED assumption. The improved approach using the generalized vector-meson-dominance (GVMD) model in a loop integral was proposed in the paper [56]. This theoretical result is shown by the blue line in Fig. 25. In addition to the original paper, the interference is taken into account in the calculation, which slightly improves the description near the mass. As it is seen, the GVMD model prediction agrees well with the experimental asymmetry. The difference between the measured asymmetry and the GVMD prediction agrees with zero within statistical precision, as shown in Fig.25. The average value of this difference in the cms energy range GeV is which should be compared with the asymmetry difference obtained with the conventional sQED approach. The other calculation for the C-odd radiative correction in a dispersive formalism was later presented in the paper [57], which is shown by the green dashed line as relative to the GVMD result in Fig.25. Good consistency of the asymmetry is observed for both models at the cms energies near the mass, but some moderate discrepancy between these models is seen at the energies GeV. The average difference between the measured asymmetry and the prediction using dispersive calculation is at the GeV, and at the GeV. The average asymmetry difference over the whole cms energy diapason GeV is .
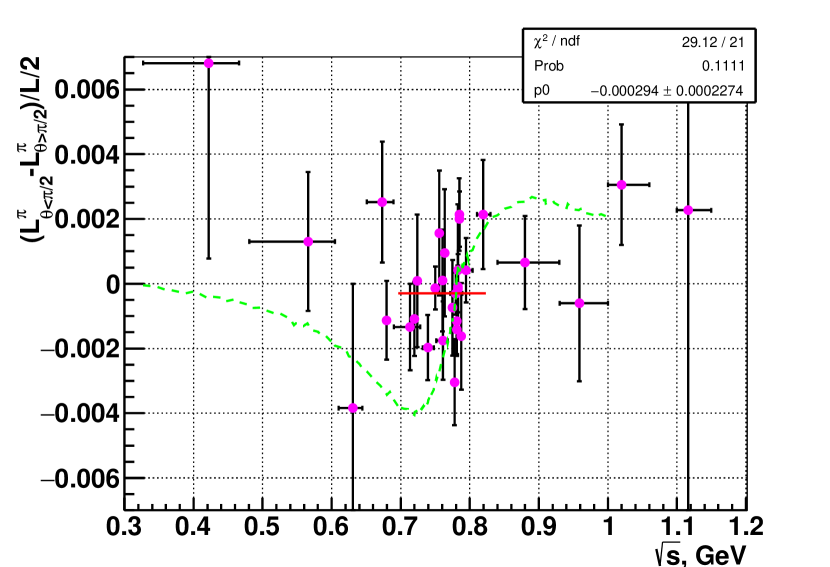
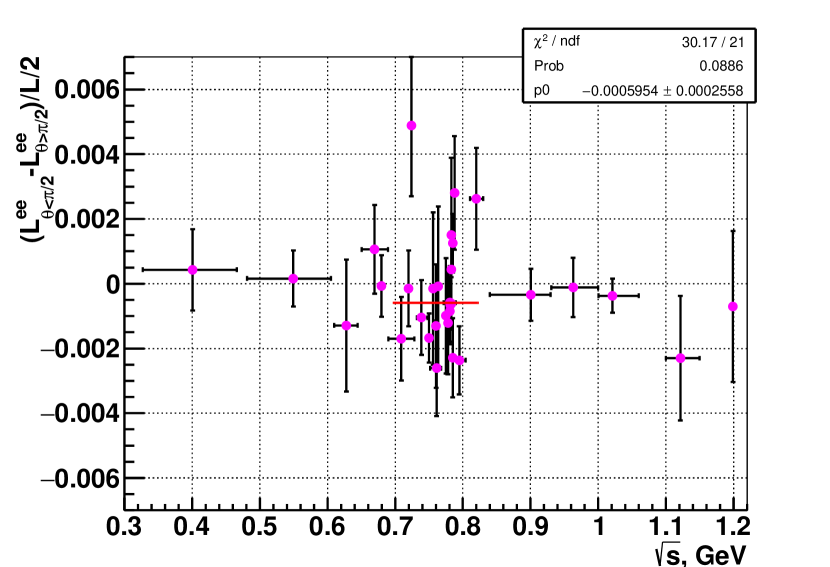
The same asymmetries between the detected numbers of events in both halves of the detector normalized to the predicted cross sections are also considered for the and processes. They are calculated as , where the corresponds to the effective luminosity based on specific event type defined in the corresponding th polar angle sector, and . These relative to the prediction asymmetries are shown in Fig. 25 (the number of the events is possible to extract separately only at the lowest cms energies). The average values of the asymmetry differences are: for the events in the same cms energy range GeV and for the process for the cms energies GeV. Good agreement between measured and predicted asymmetries for the and events is observed.
The calculation is done by the BabaYaga@NLO generator, while the asymmetry difference in the case of the MCGPJ generator prediction becomes . The angular dependence of the differential cross section obtained by BabaYaga@NLO is confirmed by the exact fixed order NNLO calculation with the McMule framework [59]. The comparison between three packages at the GeV (with the vacuum polarization effect switched off) gives the asymmetry differences between the BabaYaga@NLO and MCGPJ predictions, and between the McMule and MCGPJ (errors correspond to the statistical precision of calculations).
6.2 Particle separation based on polar angle distribution
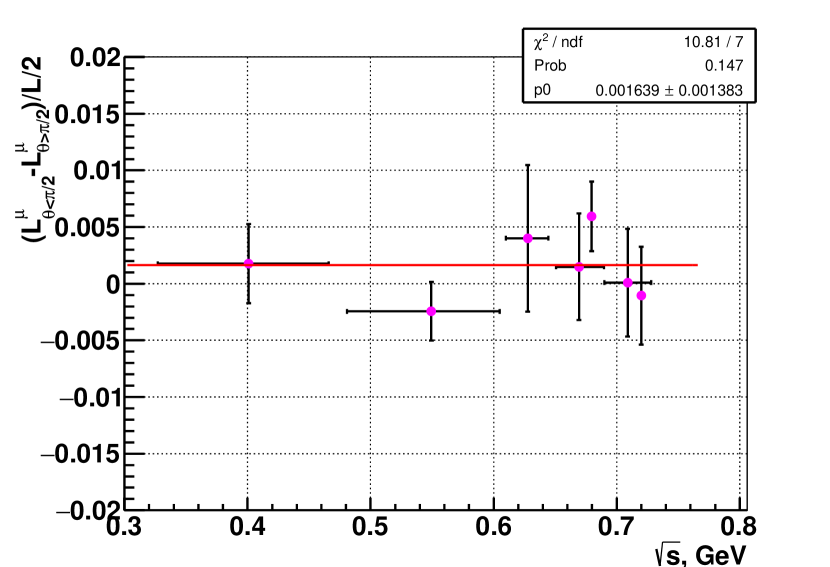
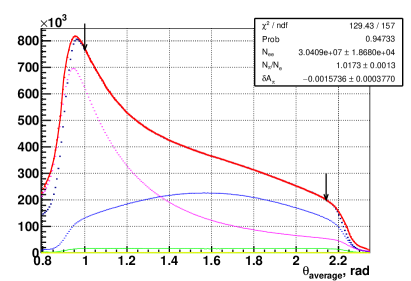
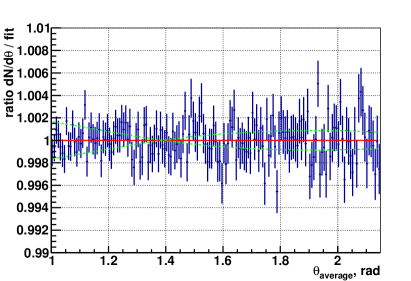
The polar angle distribution of the detected collinear events can be used for the determination of the ratio. It provides the third particle separation method (-based separation) as a cross check of the particle identification (PID) based on either momentum information in the tracker or energy deposition in the calorimeter. For this purpose, the exact angular distributions for specific final states, taken from the MC generators, are convolved with all detector effects like efficiencies, angular resolution and the polar angle corrections obtained in each energy point. The average corrections per each data taking season are shown in Fig. 19. The angular spectrum for the cosmic events is taken from the data itself by clean selection on the event time, and the contribution is taken from the full detector MC simulation. The experimental distribution summed over the energy points within the range GeV and the corresponding predicted spectra of all components are shown in Fig. 26. The predicted angular distribution for each final state is averaged over the different energy points with the weights equal to the numbers of events selected in each cms energy point. The experimental distribution is fitted in the used angular range rad with free parameters: – number of events, the ratio and the additional asymmetry correction for the events. The ratio of the number of muons to the is fixed () according to the QED prediction. The number of events (about 0.2% of the total number of events ()) and the number of cosmic events (0.04% of ) are fixed at the values obtained in the momentum-based particle separation. The ratio of the experimental angular spectrum to the fitted function is also shown on the right plot in Fig. 26. It should be pointed out that there is no visible issue in the accounted efficiency (i.e. no additional sizeable systematics) at the edges of the good polar angle range, although the notable correction up to level 2-5% at rad is applied as seen in Fig. 19. The obtained ratio from the angular distribution should be compared with the from the momentum-based separation or with the from the energy deposition-based separation method (see Section. 3.3) as summed within the cms energy range GeV. The comparison of numbers as relative to the momentum-based separation gives deviations for -separation and for the energy deposition-based separation. If the asymmetry correction parameter is fixed at according to the GVMD model prediction [56] then the obtained relative ratio difference between the -based and momentum-based separations is . This demonstrates the compatibility of all three independent particle separation methods and ensures that the separation method related systematic uncertainty of the pion form factor measurement is at level below 0.2%.
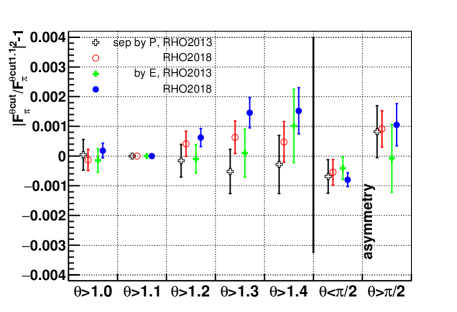
An additional cross-check of the pion form factor measurement was performed by changing the selection criterion on the average polar angle with the cut value varied from 1 rad to 1.4 rad and also separately in both halves of the detection volume rad or rad. The relative differences between the pion form factors in the cases of the various cut values and that for the rad cut are shown in Fig. 27 for the momentum-based and energy deposition-based separation methods for both RHO2013 and RHO2018 data taking seasons. The relative difference is plotted as average for the cms energies GeV and the errors of the points are shown as the statistical difference between the corresponding dataset and the rad case. Additional correction up to 0.15% coming from the dependence of the particle separation systematic bias on the polar angle cut as seen in the simulated datasets was applied specifically for this plot. No residual effect remains and the measured form factor is stable on the variation of the polar angle selection criterion at the level below for all cases. It should be also noted that some of possible systematic uncertainties of the related to the polar angle measurement (like the common angle bias or the z-length scale miscalibration) should be 2–3 times smaller for the rad half of the fiducial volume in comparison with the full angle range used in the analysis. The compatibility observed in Fig. 27 between this two angle regions, assuming no other systematic uncertainties arising due to asymmetrical angle selection, should ensure our angle related systematic uncertainty estimation with a good safety factor.
6.3 Asymmetry systematic uncertainty
| efficiency corrections | ||
|---|---|---|
| cut | ||
| Z vertex selection | ||
| angle bias correction | ||
| particle specific loss | ||
| cuts | ||
| base efficiency | ||
| trigger | ||
| total correction | ||
| sum for RHO2013 | ||
| sum for RHO2018 | ||
| radiative corrections |
The obtained results above and the level of the applied efficiency corrections allow to estimate the systematic uncertainty of the charge asymmetry measurement. The biggest effect comes from the dependency of the particle separation systematic bias on datasets within different angles, which gives effect for . This correction is not applied to the data, also, the value agrees well with the observed difference between the experimental asymmetry and the prediction based on the BabaYaga@NLO generator. For the events the particle separation effect is . The efficiency corrections taken into account in the measurement of the charge asymmetry are shown in Table 1, they are averaged in the energy range GeV. The main effect comes from the event inefficiency due to the selection, where the strong degradation is seen at the edges of the used angle range (in the ranges rad and rad), as shown in Figs. 12, 19. Looking in Fig. 26 it can be seen that there are no contributions from some unaccounted effects at both polar angle edges at least on the level. Possible additional inefficiency of 0.2% at one edge of the distribution is propagated to the related systematic uncertainty of the asymmetry as and for the and events, respectively. The other notable accounted efficiency effects on the asymmetry for the events come from the Z vertex selection, the angle bias correction and the bremsstrahlung losses. All these effects and possible systematics on them are symmetrical over the rad and give negligible correction in case of the events. Also, it should be noted again, that the drift chamber was in very different conditions in the RHO2013 and RHO2018 seasons, it was operated without 4 layers of wires (from 16 in total) in the middle of the DCH sensitive volume during the RHO2013. This results in very different effects as on the efficiencies as seen in Fig. 19, and on possible tracking systematics. This leads to the difference of total effect from efficiencies on the asymmetry between seasons as for the events and only for the events. The asymmetry difference for the events comes mainly from the angle bias correction () and from the inefficiency of the cut (). The experimental differences of the asymmetries of two seasons (after applied corrections) are and for the and events, respectively, which are consistent with zero.
Having very asymmetric over rad angular distribution for the events and mostly symmetric in case of the events should give more pronounced any possible systematic effect on the asymmetry for the events and suppressed by a factor 2–3 in case of the events. The systematic effect for the asymmetry becomes even negligible if a systematic effect has almost symmetric behaviour over the polar angle (like in the particle specific losses because of the nuclear interaction or pion decay). The consistency of the experimental asymmetry with the prediction for the Bhabha events as shown in Fig. 25, and assuming the correctness of this prediction, it can give a level of possible systematic effects for the two pion events.
Taking into account the discussion above, the total systematic uncertainty of the measured asymmetry for the process is estimated as .
7 Systematic uncertainties
| Source | Contribution |
|---|---|
| Radiative corrections | 0.2% () 0.2% (, GeV) 0.1% () |
| separation | 0.5% ( GeV) - 0.2% () - 0.6% ( GeV) |
| Fiducial volume | 0.5% / 0.8% (RHO2013) |
| Trigger + correlated inefficiency | () - 0.3% 0.15% (1 GeV) |
| Beam Energy (by Compton) | 0.1% , 0.5% (at -peaks) |
| Background events | ( GeV), |
| 0.05% (at -peak), 0.2% (at -peak) | |
| Bremsstrahlung loss | 0.05% |
| Pion specific loss | 0.2% - nuclear interaction |
| 0.2% (low) - 0.1% () - pion decay | |
| Total Systematics | 0.8% (low) - 0.7% () - 1.6% () |
| 1.1% (low) - 0.9% () - 2.0% () (RHO2013) |
Summary of the contributions to the systematic uncertainty of the pion form factor measurement is shown in Table 2. The exact dependence of the total systematic uncertainty of the on the cms energy is given in Table 8.
One of the important sources of the systematics is a theoretical precision of the radiative corrections [60], which was discussed in detail in Section 5. Two contributions should be distinguished: the one is related to the accuracy of the calculation of the integrated cross sections, and another is related to the prediction of the differential cross sections. In first case, the most precise lepton pair production generators are well consistent at the level of about 0.1%. There is some discrepancy at the threshold region for process, but its source is known. For the process there is the only MCGPJ generator which declares 0.2% precision for the total cross section. In case of the differential cross section, which is important for the momentum-based event separation method and for the charge asymmetry study, a more precise generator is very desirable at the exact NNLO with proper matching to the next orders resummation of logarithmically enhanced corrections.
For the further reduction of theoretical systematics it is advisable to develop another precise generator based on the theoretical framework beyond the scalar QED approach, as the point-like pion approximation is already not sufficient.
The other important part of the analysis is the separation. Three methods were developed based on completely independent information: the momenta of particles measured in the tracking system, the energy depositions in the calorimeter and the polar angle distribution (as average at energy region). All methods are highly consistent as was described above, which ensures the systematic uncertainty from the particle separation to be below 0.2%.
The most important source of the systematics comes from the fiducial volume determination. In the CMD-3 detector, polar angle of tracks is measured by the drift chamber with help of the charge division method, providing the z-coordinate resolution of about 2 mm [61]. This measurement is unstable by itself as it depends on a calibration and thermal stability of the parameters of electronics. For example, fast day-night oscillations are seen on a reconstructed z-coordinate at the level of , which requires to perform a temperature dependent calibration of the response of each DCH electronic board. To determine the z-axis scale, an independent calibration is necessary to apply as relative to an external system. The LXe calorimeter coordinate system was used for this purpose using cosmic muon events and with additional regular corrections per a single run. It was also possible to use the ZC chamber for this purpose. The ZC chamber was a 2-layer multiwire chamber installed at the outer radius of the DCH, with the middle radius between two layers at 31.5 cm [62]. It had a strip readout along z-coordinate, where the strip width is 6 mm and the z-coordinate resolution is about 0.7 mm for the tracks with 1 radian inclination. The ZC chamber had been working for 25 years (initially at the CMD-2 detector) until the summer of 2017. Also, the CMD-3 detector has the unique LXe calorimeter where the ionization is collected in 7 layers with a cathode strip readout [37]. The combined strip size is 10–15 mm and the coordinate resolution is about 2 mm. The first layer is located at the radius of 37.9 cm. Both subsystems had the design systematic precision for the coordinate strip position better than , which is required to keep the systematic uncertainty of the integrated luminosity at the level 0.1%. This precision can be also affected by a noise presence, aggravated by wide strip dimensions.
When the ZC chamber was in operation together with the LXe calorimeter, it was possible to cross check each other. The consistency during that time was obtained at level up to for the z-length scale averaged over the angles. The considerable part of this inconsistency comes from the ZC chamber, as seen by performing comparison between own two layers. Also systematical variations of the DCH track impact point at the LXe inner layer versus the measured position in LXe is observed up to 0.5 mm at the different coordinate regions and track inclination angles at the LXe inner layer. This corresponds to the at the rad for a detected track and cm radial position. Both z-scale uncertainties at the DCH outer radius correspond to the systematic uncertainty of the Bhabha cross section determination at the rad fiducial volume.
In the reconstruction of the polar angle, the inner layers of the DCH wires close to the interaction point are used. These layers of wires were operated at a reduced high voltage, which results in much lower measured amplitudes used in the z-coordinate reconstruction. Together with higher level of beam background in this region and beam induced correlated noises, the inner layers are highly vulnerable to possible coordinate reconstruction systematic effects. The polar angle definition of an event as in the selection criteria Eq. 1 reduces the angle systematics coming from the common shift of the z-coordinates of the two tracks (or with ) in the region close to the interaction point. Meanwhile, the systematic bias in the mean value of the will introduce a systematic shift in the , and the strong systematic effect was observed here, which changes number of selected electrons by up to . To cope with it, the vertex constrained fit of both tracks was performed and the modified polar angles were used further in the selection criteria. Also, the corresponding momenta with improved resolutions were used further in the event separation. All efficiencies described before were calculated within these angle and momentum definitions, where it is relevant. Also, an additional angle correction per each energy point is introduced to control and account systematic shifts for each definition of the polar angle. This correction is obtained from the observed discrepancy between both track’s impact points at the inner wall of the LXe calorimeter and the measured coordinates by the LXe itself. The exactly same collinear events sample were used as for the particle separation itself, where Bhabha and “MIP” event types were considered according to the energy deposition. The correction in case of the polar angle after the vertex constrained fit is below mrad at the rad (and of the opposite sign over ), which results in the for the selected events. Part of this uncertainty at the level of comes from the insufficient knowledge of the strip plane transparency factor for an induced charge on the U-V coordinates sides of the plane in the LXe ionization layers, which is required to reconstruct properly the coordinates for the different types of particles and their inclination angles. Nevertheless, the corresponding contribution from the event’s polar angle reconstruction to the systematic uncertainty of the pion form factor measurement is rather conservatively estimated as the difference between results based on the vertex constrained fit and unconstrained uncorrected angle definitions cases, which are 0.7% for the RHO2013 season and 0.3% for the others. As it was mentioned before, the tracking performance was much worse in the RHO2013 as the DCH was operated without HV on the four layers of wires in the middle of the volume, which leads to the higher weights of the inner layers in the track angle determination.
The overall systematic uncertainty related to the fiducial volume determination is estimated as for the RHO2013 energy points and for the others.
Beam parameters were permanently monitored by the method based on Compton backscattering of the laser photons on the electron beams [63, 64]. The statistical uncertainty of the measured beam energy ( keV) is propagated into the statistical uncertainty of the measured pion form factor via the energy derivative of the fitted visible ratio from Eq. 3. The systematic precision of the Compton backscattering method is estimated as 40 keV per beam according to the paper [64] and from a stability of the analysis of the scattered gamma energy distribution. This helps to keep the related contribution to the systematic uncertainty of the pion form factor measurement below 0.1% except the cms energies around and -meson resonances, where this systematic uncertainty increases up to due to the fast change of the cross section in the region of the narrow resonances. In principal, the systematic bias of the measured beam energy can be different for the different data taking seasons, as different lasers and analysis procedures were used for this monitoring. A beam energy spread is also provided by the Compton backscattering method, which gives in average as keV per beam at the -meson resonance and keV at the -meson resonance cms energies and the corresponding cross section corrections are up to and at near resonances.
An additional systematic uncertainty comes from the fixing the ratio in the particle separation. The only relevant contributions for this from Table 2 are part of the radiative corrections with , bremsstrahlung loss, fiducial volume. The trigger related uncertainty and the correlated inefficiency are smaller in case of the , they are at the -meson and at the GeV. Also, the effect of the 40 keV systematic beam energy shift is 0.08% at the -meson and 0.5% at the -meson resonance cms energies. All these contributions are fully correlated between and events. In case of the energy deposition-based particle separation an excess of the events results in a deficiency of almost the same number of the events as they are located in the same “MIP” energy deposition region as seen in Fig. 4. It gives an additional scale factor for the systematic uncertainties of the measurement from the listed above corresponding sources, with the obtained coefficient at the GeV. This coefficient is smaller than 1 because of the two-particle correlation in the description of the hadronic interaction tails in PDF for the events.
In case of the momentum-based particle separation, the extracted result is insensitive at level to fixed/”fixed with 1% bias” at the GeV or fixed/unfixed at the GeV cases for number of events in the minimization, with the correlation coefficient at the GeV, at the GeV and at the GeV. The correlation coefficient changes sign at the different energy ranges as at the lower energies an inaccuracy of muons determination contributes via the radiative tail of electron while at the higher energies the muons and pions momenta become closer.
So, fixing the number of the events to the number of the events according to the QED prediction and the detector efficiencies results in the increase of the total pion form factor systematic uncertainty from 1.05%/ 1.2%(RHO2013) to 1.6%/ 2.0%(RHO2013) at the -meson resonance energies with the , and from 1.05% to 1.95% at the GeV with the .
The total systematic uncertainty of the measurement from all sources mentioned above is estimated as 0.9% for the RHO2013 data taking season and 0.7% for the other data at the central -meson resonance energies. It is slightly higher at the production threshold and grows up to 2% at above 1 GeV as shown in Table 2.
The systematic uncertainty in case of the cross section measurement doesn’t have the pion specific contributions and if not to include the difference between the MCGPJ and BabaYaga@NLO generators as in Fig. 20, coming from the knowledge of the momentum differential cross section, then the total systematic uncertainty at the lower energies can be estimated as , where the corresponds to the fiducial volume uncertainty and the 0.25% is a sum of the others.
Further, it is discussed the crucial sources of the systematic uncertainty of the pion form factor for purpose of the risk assessment on a possible underestimation of their contributions.
The estimated systematic uncertainty related to the fiducial volume determination is taken as the conservative value. It would be difficult to come up with some tricky model which gives a possible angle bias above already considered, but at the same time this model should provide the very remarkable agreement in the forward-backward charge asymmetry at the level between data and predictions for both and processes simultaneously, as described in Section 6.1. It will be very helpful to go forward in a precision with available and generators. For example, it will be interesting to understand the difference in the C-odd radiative correction between obtained in the dispersive formalism and the GVMD model predictions, while the last one reproduces well the obtained experimental result.
From the detector side, a further improvement in the drift chamber performance at the inner layers is potentially expected. And in a more distant future, a new ZC chamber with much smaller strip dimensions (and possibly better noise environment) and a new drift chamber with the stereo layers layout (to avoid charge division systematics) are under considerations.
The trigger performance is determined by the high track finder efficiency , which is less sensitive to the difference between electron and pion tracks. The notable variations are present in the cluster finder, but to affect the overall trigger efficiency it will require some tricky influence from it. For this purpose, additional hidden correlations between the “charged” and “neutral” triggers were tried to be scrutinized as it was mentioned above. Also, the new trigger equipment with better scheme was developed and first prototype has been implemented. It is planned to be commissioned in the coming data taking seasons. This will help to discard some other potential trigger related scenarios.
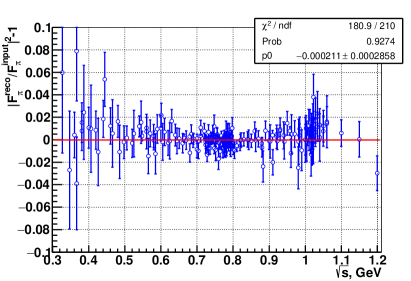
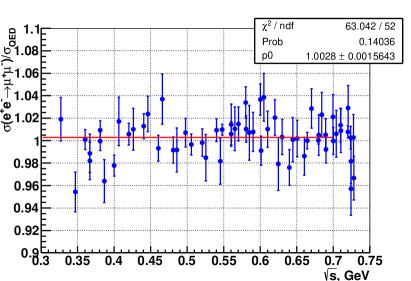
From the analysis point of view, one of the tests was performed on the used workflow in the analysis. The properly mixed data samples after the full MC simulation, which take into account the detail detector conditions over time, were prepared corresponding to the same accumulated luminosities as in the data. After that the full analysis as on experimental datasets was performed with the evaluation of efficiencies, particle separations, etc. Mostly the same procedure, scripts and intermediate files as for the experimental data were used. It helps also to ensure that, for example, some inefficiency components in the described efficiency reconstruction procedure are not double counted. The relative difference of the obtained and implemented in the generator pion form factor is shown in Fig. 28. The average deviation from the input form factor is . For the three cms energy ranges / / GeV the deviations are / / . These numbers include the systematic effect from the separation +0.2% and +0.6% at the lowest energies and for the GeV, respectively. Separate looks on underneath components were also performed to understand each single contribution to the final result with better precision (with the purely statistical Poisson error subtracted or with the larger MC samples). No notable anomalies in the analysis procedure have been found. The same compatibility test with MC events is also shown for the measurement of the cross section on the right side in Fig. 28.
8 Results
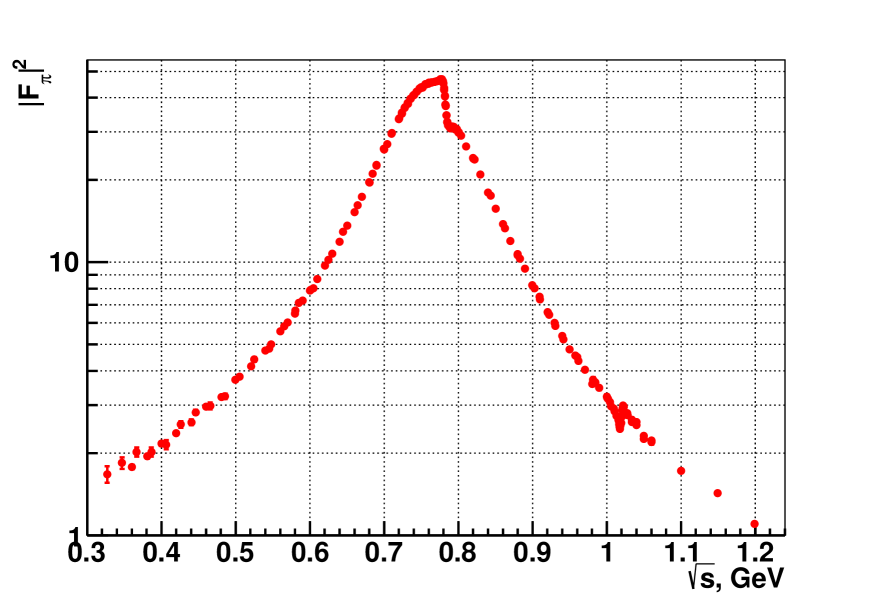

One of the tests in this analysis is the measurement of the cross section at low energies, where the particle separation was performed using momentum information and the number of muons were extracted separately. The measured cross section is well consistent with the QED prediction with an overall statistical precision of 0.16% as shown in Fig. 30. The obtained ratio is as the average at the GeV, and the separate ratios obtained in the different data taking seasons are also statistically compatible with each other. It is very important to take correct differential cross sections as an input of the separation procedure. The results shown above have been obtained with the BabaYaga@NLO generator based differential cross sections, while if the MCGPJ generator momentum spectra are used, the relative difference between the measured and predicted cross sections is about 1.3% (see the difference from the MCGPJ and BabaYaga@NLO generators usage on the left plot in Fig. 20). Similar effect is observed for the ratio as shown on the right side in Fig. 20. If to compare the cases of the event separations based on energy deposition information with one based on momentum information, then the inconsistency will be seen at the GeV in Fig. 8 after applying the difference between the MCGPJ and BabaYaga@NLO generators shown in Fig. 20.
The measured pion form factor values together with the systematic uncertainties are given in Table 8 and shown in Fig. 30. This table together with the calculated radiative corrections in Eq. 3 are provided as supplementary material.
The experimental data are fitted using the vector meson dominance (VMD) model:
| (9) |
where the wide and resonances are described by the Gounaris-Sakurai parameterization (GS) [65], and the relativistic Breit-Wigner with the constant width, , is taken for the narrow and meson resonances. The complex parameters , , , , are used to describe the corresponding resonance contributions. The parameters and are expressed via the branching fraction values, using the VMD relation:
| (10) |
and together with Eq. 2, 9, it gives the following expression:
| (11) |
The phase of the is introduced as a relative to the phase of the without the resonance contribution, representing the local -meson resonance behaviour as . The parameter is expressed via the by the following equation:
| (12) |
Such definition of the provides more consistent result for possible different and parameterizations.
Parameters of and resonances are obtained from the combined fit of the CMD-3 pion form factor at the GeV together with the CMD-2 points at the GeV [20] and DM2 result at the GeV [66]. The obtained and parameters are relevant here only for the functional form factor behaviour, and they shouldn’t be directly compared to the PDG’s values, since for the latter more dedicated description of these resonances have to be taken into account. The fitted constant represents a continuum contribution, which also could partially absorb the part of the and resonance contributions and can account for left tails of the excitations and other higher resonances. The result of the fit of the solely CMD-3 points at the cms energies GeV is given in the Table 8, were the second errors includes the additional propagation of uncertainties of the and parameters. The masses of the and mesons, and , are slightly shifted from their world average PDG’s values [45]. This was also observed in more dedicated analysis in the framework of dispersion relations of the previously measured experimental data [67, 68] in comparison with the channels [69, 70, 71]. The shift is not originated from the beam energy miscalibration since the -meson cross section peak in the channel (Fig. 10 and similar result at the -meson resonance energies) and CMD-3 analysis of the production on and around -meson resonance [72, 73] show mass values consistent with those in PDG. The origin of the obtained mass shift in the channel can be the -meson parameterization together with interference. To account for the last case, a constrained fit was performed with the values and their corresponding errors taken from the PDG(2022) [45]. Parameters obtained in this fit are presented in the second column of the Table 8 and considered as the baseline result, while the differences of the two sets of parameters are assigned as additional systematic uncertainties for some of the parameters discussed below.
| Parameter | value | constrained | PDG(2022) [45] |
|---|---|---|---|
| by PDG’s values | |||
| , MeV | |||
| , MeV | |||
| , MeV | |||
| , MeV | |||
| , rad | |||
| , MeV | |||
| , MeV | |||
| , rad | |||
| , rad | |||
| 212.53 / 195 | 223.42 / 199 | ||
| , MeV | |||
| , MeV | |||
| , MeV | |||
| , MeV | |||
| , rad | |||
| , rad | |||
& 288.87/240 CMD3+CMD2+DM2 220.08(CMD3)+25.30(CMD2)+40.10(DM2)+3.39(PDG) ndf= 207+29+20+4 - 12() - 8()
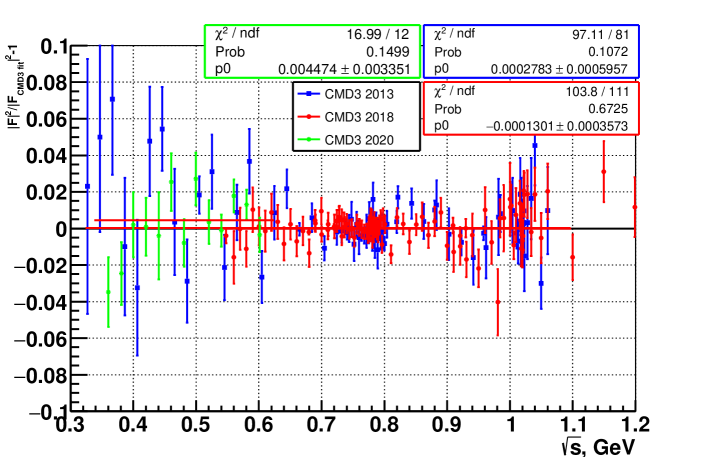
The data samples used in the analysis were accumulated during three seasons: RHO2013, RHO2018 and LOW2020. The relative deviations of the measured form factors from the fitted curve are shown in Fig. 31. Data of the different datasets are shown by different colors. The datasets show good compatibility with the average differences: and at the GeV. In spite of the different efficiencies and the polar angle related systematics in the drift chamber during RHO2013 season, the results from all seasons are very similar.
This analysis provides the measurement of the pion form factor at the -meson resonance for the first time. Figure 33 shows the form factor around -meson resonance together with the constrained fit function and the measurements of the other experiments at the off-peak energies: OLYA [74], DM1 [75], ACO [76], CLEO [77], CMD-2 [20], BABAR [28], KLOE [26]. The obtained parameters of the interference together with the systematics uncertainties are the following:
| (13) | ||||
Where the first and second errors are statistical and systematic parts, and the third error corresponds to the difference between PDG constrained/unconstrained fits.
The systematic errors of the decay parameters include the variations of the cross section within the total systematic uncertainty in the Table 2, variations of the -meson resonance backgrounds, different fit function parameterizations of the , , in the global fit. The significant contribution comes from the uncertainty of the radiative correction calculation. The initial systematic or statistical shift of the measured branching ratio or phase after the iterative procedure to calculate the radiative correction results in the corresponding bias in the radiative correction. If to repeat the fit of the data with the biased radiative correction and extract the and values again, their shift will be inflated by an additional factor in comparison with the initial one. By repeating this iteratively, the final inflation factor will be . This is an effect of the inflation of the uncertainties of and due to the radiative corrections. The listed errors of the and include this scale factor, both for statistical and systematic uncertainties.
The interference was previously studied using only the detected numbers of events by the OLYA [78] experiment or by using visible cross section measured by ND [79] and SND [80] at the VEPP-2M collider. In the SND case, a simultaneous fit together with possible background contributions in the detected cross section was performed. SND result for the interference is the following: , and (according to Eq.14 from the SND paper [80]). Their parameters show standard deviation difference from the CMD-3 result. This deviation can be partially explained by the overestimated pion form factor value (and possibly a resonance background underestimation) and by an uncertainty of the applied radiative corrections due to the input resonance parameters, which together gives back compatibility to .
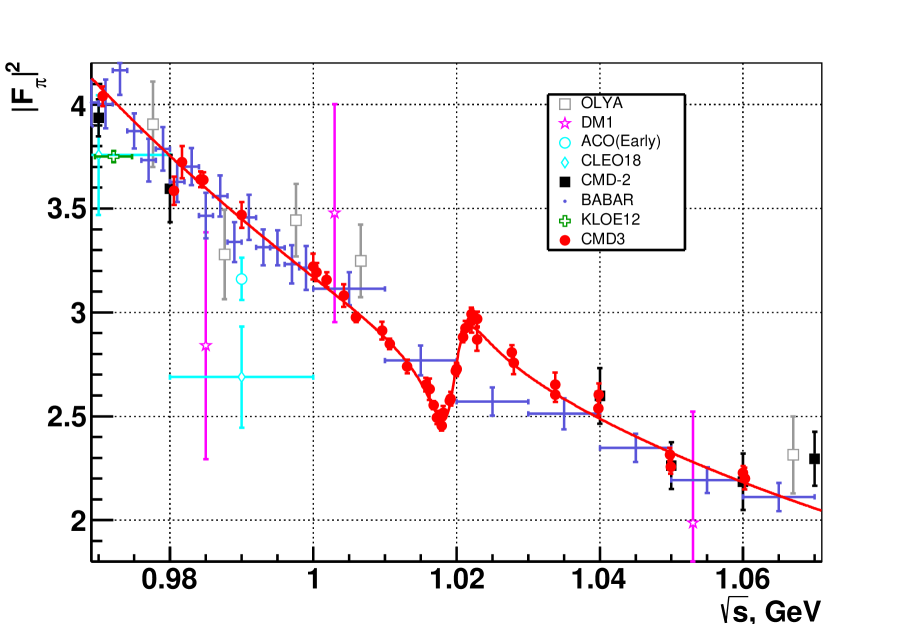
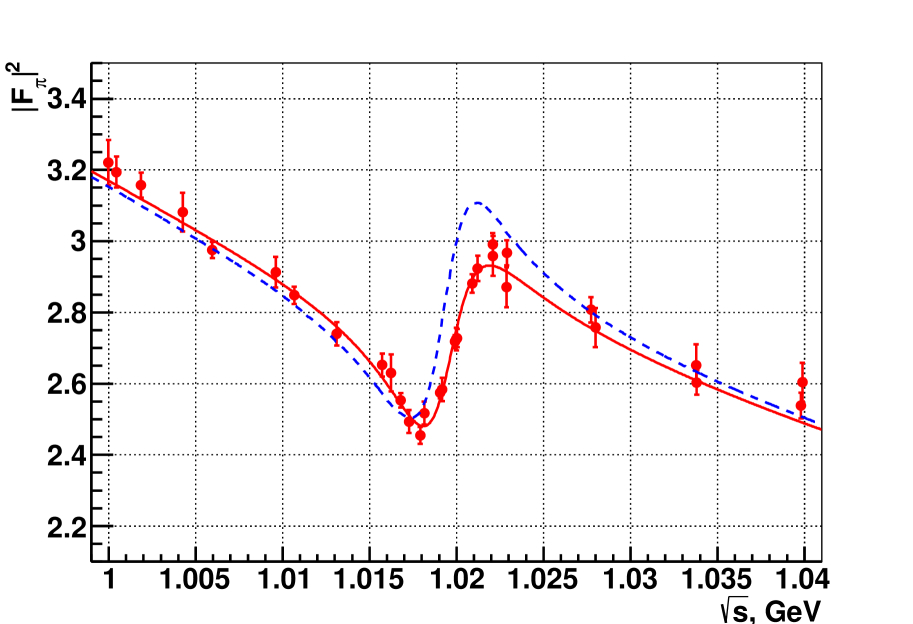
It is interesting to note that the obtained branching fraction is smaller than that expected from the vacuum polarization term, in the assumption that there is no direct transition:
| (14) |
where – non -resonant part of the vacuum polarization [81, 60]. Figure 33 shows the comparison of the measured form factor with the expectation coming only from the vacuum polarization described by the function.
The obtained result for the decay is the following:
| (15) |
where the first and second errors correspond to the statistical and systematic uncertainties. Both errors include the scale factor related to the uncertainty of the radiative correction. It is obtained in the same way as discussed above for the -meson case.
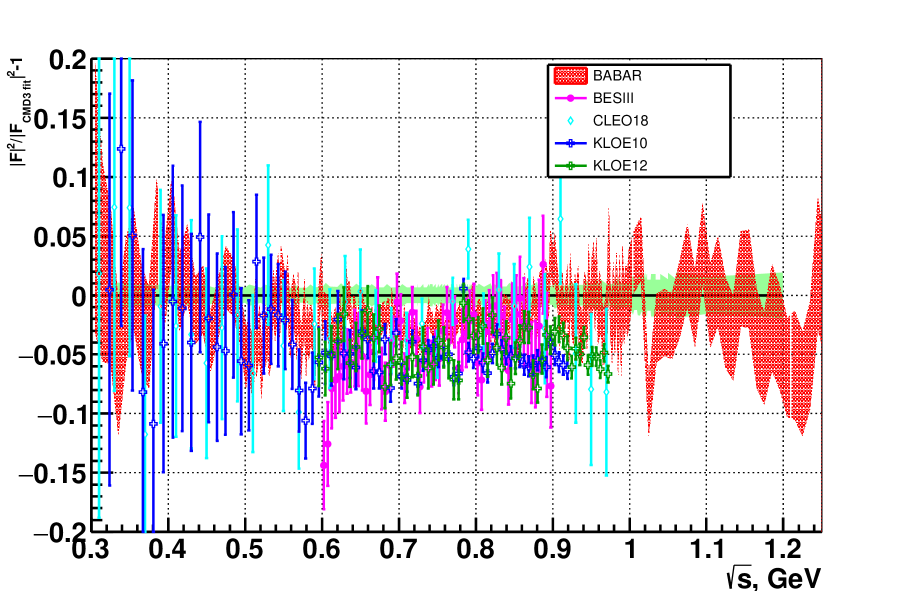
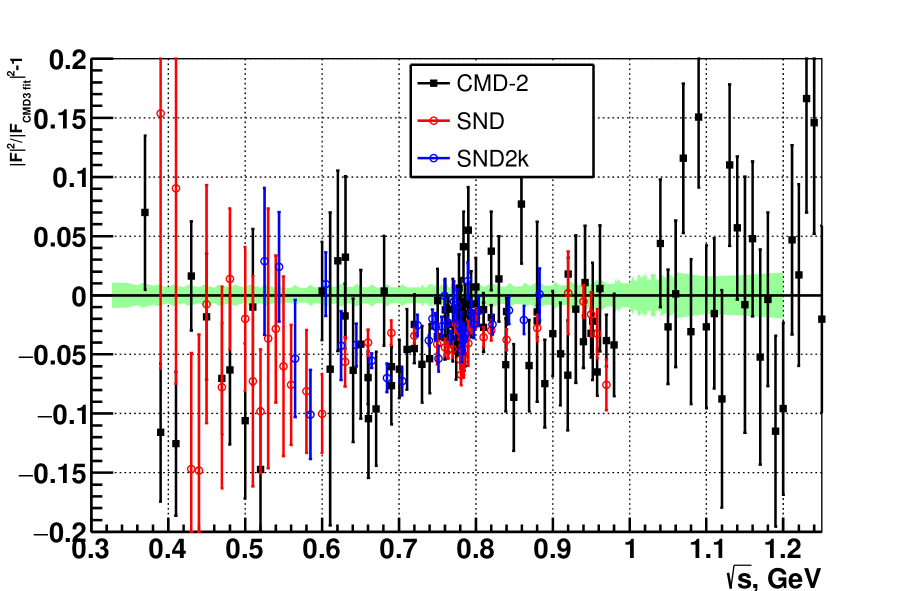
The comparison of the pion form factor measured in this work with the results obtained in the most recent ISR experiments (BABAR [28], KLOE [25, 26], BES [29]) is shown in Fig. 35. The comparison with the most precise previous energy scan experiments (CMD-2 [19, 20, 21, 22], SND [23] at the VEPP-2M and SND [30] at the VEPP-2000) is shown in Fig. 35. The new result generally shows larger pion form factor in the whole energy range. The most significant difference with the other energy scan measurements, including previous CMD-2 measurement, is observed at the left side of the -meson ( GeV), where it reaches up to 5%, well beyond the combined systematic and statistical errors of the new and the previous results. The source of this difference is unknown at the moment.
One of the main applications of the measured cross sections is the evaluation of the hadronic part of the anomalous magnetic moment of the muon , which is calculated via the dispersive integral [82]:
| (16) |
where – is known analytical kernel function. The dispersive integral requires the bare cross section, which can be obtained from the measured one :
| (17) |
by subtracting the vacuum polarization of the intermediate photon and adding the final state radiation in the point-like approximation with the term [83, 84]. The most recent the muon (g-2)/2 evaluations can be found in the references [3, 4, 5], and the hadronic channel gives the dominant contribution to the hadronic part and determines the overall precision of the full value.
In order to evaluate the impact of our result it is calculated the contribution to the from the process using data from the various experiments in the common energy range GeV. This particular energy range was chosen for two reasons: it is covered by many high-precision experiments and it gives more than 50% of the full integral. The dispersive integral calculation is performed by using linear interpolation between the experimental points with the proper account of the statistical and systematic errors. The results of the calculations are shown in Fig. 36 and given in Table 4. The first line in Table 4 corresponds to the combined result of all measurements before CMD-2 experiment.
The pion form factor measurements from the RHO2013 and RHO2018 seasons of the CMD-3 experiment give the statistically consistent results for the integral as:
| (18) |
Two CMD-3 values are in very good agreement in spite of a very different data taking conditions (as was discussed earlier). The combined CMD-3 result is obtained in a very conservative assumption of 100% correlation between systematic errors of the two data sets. The CMD-3 result on the is significantly higher in comparison with the results of the other energy scan and ISR experiments. Although this evaluation is done in the limited energy range and the full evaluation of the is yet to be done, it is clear that our measurement reduces the tension between the experimental value of the anomalous magnetic moment of muon and its Standard Model prediction. The correlated impact on the , , from different pion form factor behaviours and possible increase in the hadronic cross section at different energy ranges have been discussed in a number of papers [85, 86, 87, 88].
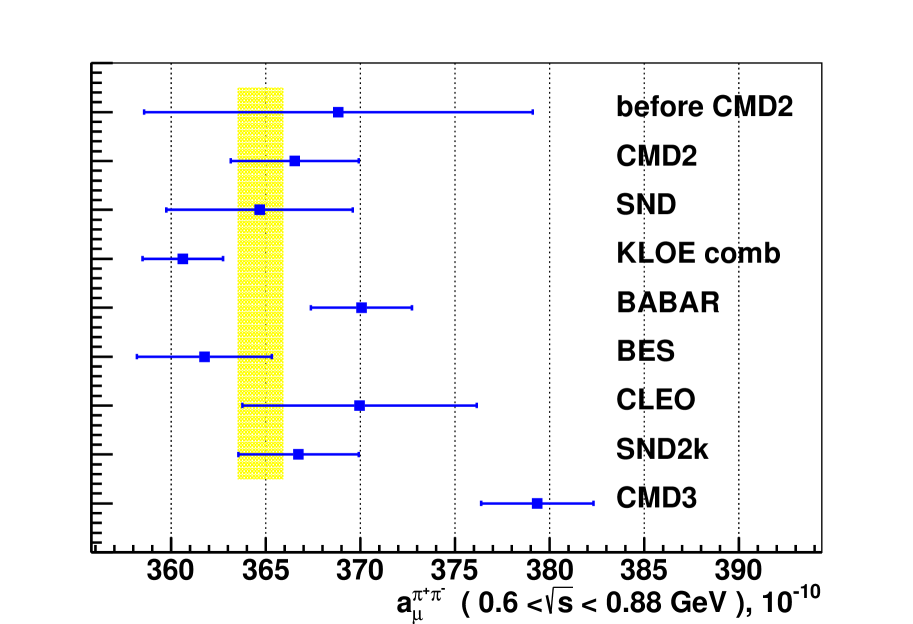
| Experiment | |
|---|---|
| before CMD2 | |
| CMD2 | |
| SND | |
| KLOE | |
| BABAR | |
| BES | |
| CLEO | |
| SND2k | |
| CMD3 |
| RHO 2013 season | RHO 2018 season | ||||
|---|---|---|---|---|---|
| 326.980 | 1.677 0.114 0.018 | 547.784 | 5.015 0.021 0.032 | 920.648 | 6.535 0.066 0.055 |
| 346.820 | 1.844 0.091 0.019 | 560.253 | 5.461 0.080 0.034 | 929.645 | 6.006 0.030 0.051 |
| 366.660 | 2.024 0.078 0.021 | 570.210 | 6.019 0.069 0.038 | 930.447 | 5.855 0.058 0.050 |
| 386.520 | 2.024 0.077 0.018 | 580.133 | 6.481 0.064 0.041 | 940.281 | 5.375 0.063 0.047 |
| 406.360 | 2.152 0.082 0.019 | 590.167 | 7.245 0.087 0.047 | 949.992 | 4.805 0.051 0.043 |
| 426.200 | 2.550 0.073 0.023 | 600.144 | 7.884 0.082 0.058 | 960.354 | 4.506 0.056 0.041 |
| 446.060 | 2.827 0.061 0.025 | 610.064 | 8.671 0.098 0.063 | 970.587 | 4.041 0.047 0.038 |
| 465.900 | 2.985 0.086 0.027 | 620.169 | 9.722 0.097 0.069 | 980.546 | 3.585 0.068 0.035 |
| 485.760 | 3.232 0.076 0.029 | 630.083 | 10.765 0.099 0.075 | 984.251 | 3.641 0.037 0.036 |
| 505.202 | 3.816 0.038 0.034 | 639.997 | 11.898 0.108 0.082 | 990.000 | 3.469 0.063 0.034 |
| 525.162 | 4.409 0.086 0.040 | 650.596 | 13.632 0.114 0.093 | 999.985 | 3.221 0.063 0.033 |
| 545.093 | 4.829 0.088 0.042 | 660.375 | 15.238 0.126 0.104 | 1000.450 | 3.194 0.043 0.039 |
| 565.149 | 5.824 0.087 0.051 | 670.204 | 17.377 0.135 0.117 | 1001.857 | 3.158 0.035 0.039 |
| 585.012 | 7.096 0.120 0.064 | 679.684 | 19.675 0.029 0.132 | 1005.961 | 2.976 0.023 0.037 |
| 604.872 | 8.027 0.117 0.084 | 680.181 | 19.576 0.148 0.131 | 1009.606 | 2.913 0.042 0.036 |
| 624.779 | 10.210 0.147 0.103 | 689.578 | 22.610 0.127 0.151 | 1015.730 | 2.652 0.032 0.035 |
| 644.624 | 12.939 0.134 0.126 | 690.000 | 22.705 0.107 0.152 | 1016.793 | 2.553 0.020 0.034 |
| 664.549 | 16.172 0.055 0.154 | 699.705 | 26.044 0.190 0.174 | 1017.915 | 2.455 0.024 0.032 |
| 684.425 | 21.127 0.165 0.198 | 700.044 | 25.833 0.103 0.173 | 1019.056 | 2.574 0.015 0.036 |
| 704.207 | 27.099 0.182 0.252 | 709.962 | 29.512 0.152 0.198 | 1019.916 | 2.718 0.018 0.043 |
| 724.120 | 35.028 0.243 0.325 | 710.357 | 29.753 0.190 0.199 | 1020.028 | 2.728 0.026 0.043 |
| 731.860 | 38.033 0.241 0.353 | 719.917 | 33.457 0.048 0.225 | 1020.904 | 2.881 0.026 0.040 |
| 739.149 | 40.685 0.133 0.378 | 720.301 | 33.621 0.218 0.226 | 1022.077 | 2.991 0.032 0.039 |
| 740.515 | 41.005 0.147 0.381 | 723.766 | 34.985 0.092 0.235 | 1022.897 | 2.968 0.035 0.039 |
| 743.785 | 42.088 0.312 0.391 | 724.208 | 35.281 0.208 0.237 | 1027.733 | 2.807 0.036 0.036 |
| 747.749 | 43.356 0.413 0.402 | 727.684 | 36.723 0.210 0.247 | 1033.810 | 2.603 0.034 0.034 |
| 751.715 | 43.641 0.407 0.405 | 728.170 | 36.908 0.227 0.249 | 1039.804 | 2.539 0.036 0.034 |
| 755.702 | 44.806 0.310 0.416 | 731.973 | 38.303 0.226 0.258 | 1049.794 | 2.315 0.032 0.032 |
| 756.059 | 44.794 0.122 0.416 | 732.038 | 37.993 0.183 0.256 | 1059.990 | 2.227 0.033 0.031 |
| 759.566 | 44.978 0.410 0.418 | 735.576 | 39.634 0.156 0.268 | 1099.963 | 1.723 0.022 0.027 |
| 763.598 | 45.392 0.135 0.422 | 736.114 | 39.662 0.220 0.268 | 1149.610 | 1.430 0.023 0.025 |
| 767.976 | 45.690 0.206 0.425 | 739.946 | 41.031 0.219 0.278 | 1199.168 | 1.105 0.018 0.021 |
| 771.573 | 46.072 0.421 0.430 | 744.065 | 42.147 0.213 0.285 | ||
| 775.119 | 46.278 0.137 0.432 | 748.035 | 43.218 0.209 0.292 | LOW 2020 season | |
| 775.729 | 46.823 0.423 0.437 | 751.984 | 43.850 0.218 0.296 | 360.352 | 1.781 0.035 0.015 |
| 778.561 | 46.321 0.151 0.433 | 750.003 | 43.655 0.037 0.295 | 380.968 | 1.950 0.034 0.016 |
| 779.141 | 45.928 0.192 0.431 | 756.081 | 44.870 0.230 0.303 | 400.059 | 2.168 0.039 0.014 |
| 780.738 | 43.394 0.377 0.424 | 760.023 | 45.277 0.208 0.306 | 420.041 | 2.367 0.037 0.015 |
| 781.141 | 42.692 0.071 0.427 | 760.477 | 45.390 0.096 0.306 | 440.460 | 2.596 0.062 0.017 |
| 782.031 | 40.671 0.363 0.422 | 763.916 | 45.568 0.216 0.308 | 460.467 | 2.962 0.045 0.019 |
| 782.894 | 37.457 0.122 0.397 | 767.793 | 45.769 0.182 0.309 | 480.895 | 3.210 0.042 0.021 |
| 782.910 | 37.316 0.073 0.396 | 771.827 | 46.100 0.194 0.313 | 499.440 | 3.712 0.052 0.024 |
| 783.880 | 34.563 0.316 0.356 | 773.790 | 46.238 0.227 0.314 | 520.620 | 4.160 0.049 0.027 |
| 784.880 | 32.572 0.315 0.321 | 775.033 | 46.516 0.089 0.316 | 540.167 | 4.752 0.042 0.030 |
| 785.031 | 32.569 0.056 0.320 | 775.089 | 46.534 0.244 0.316 | 560.250 | 5.647 0.050 0.036 |
| 786.703 | 31.595 0.128 0.299 | 776.027 | 46.676 0.213 0.317 | 580.504 | 6.662 0.054 0.042 |
| 788.574 | 31.213 0.108 0.295 | 776.942 | 46.530 0.247 0.316 | 601.222 | 7.930 0.074 0.058 |
| 789.450 | 30.924 0.317 0.293 | 777.927 | 46.521 0.080 0.316 | ||
| 792.469 | 31.184 0.106 0.296 | 778.023 | 46.759 0.197 0.318 | ||
| 794.466 | 31.053 0.307 0.295 | 779.029 | 46.128 0.211 0.316 | ||
| 797.656 | 30.521 0.281 0.290 | 779.976 | 45.171 0.216 0.318 | ||
| 799.987 | 29.797 0.112 0.284 | 780.943 | 42.837 0.210 0.322 | ||
| 803.980 | 29.031 0.212 0.280 | 780.989 | 42.858 0.057 0.323 | ||
| 819.674 | 24.091 0.146 0.239 | 781.886 | 40.449 0.204 0.329 | ||
| 821.643 | 23.779 0.141 0.237 | 782.727 | 37.800 0.059 0.318 | ||
| 843.428 | 17.527 0.143 0.180 | 782.799 | 37.493 0.171 0.316 | ||
| 862.676 | 13.327 0.127 0.142 | 783.978 | 34.514 0.185 0.275 | ||
| 879.938 | 10.710 0.054 0.117 | 784.985 | 32.619 0.042 0.240 | ||
| 883.188 | 10.309 0.137 0.114 | 785.018 | 32.613 0.157 0.239 | ||
| 902.620 | 8.037 0.114 0.093 | 786.086 | 31.727 0.145 0.222 | ||
| 922.517 | 6.420 0.047 0.078 | 787.783 | 31.394 0.070 0.216 | ||
| 941.793 | 5.231 0.079 0.067 | 788.007 | 31.228 0.146 0.215 | ||
| 957.787 | 4.555 0.017 0.060 | 790.108 | 31.219 0.150 0.214 | ||
| 961.925 | 4.352 0.073 0.059 | 791.835 | 31.402 0.087 0.216 | ||
| 981.691 | 3.723 0.077 0.053 | 792.083 | 31.369 0.152 0.216 | ||
| 984.654 | 3.638 0.037 0.052 | 794.070 | 31.307 0.152 0.215 | ||
| 1004.253 | 3.082 0.054 0.051 | 796.050 | 30.605 0.144 0.210 | ||
| 1010.669 | 2.848 0.024 0.048 | 797.942 | 30.680 0.168 0.211 | ||
| 1013.113 | 2.740 0.033 0.047 | 800.654 | 29.948 0.142 0.207 | ||
| 1016.231 | 2.630 0.052 0.046 | 810.560 | 26.552 0.130 0.188 | ||
| 1017.269 | 2.494 0.032 0.044 | 820.258 | 23.960 0.121 0.172 | ||
| 1018.142 | 2.517 0.032 0.044 | 829.849 | 20.952 0.117 0.152 | ||
| 1019.174 | 2.584 0.033 0.048 | 839.997 | 18.004 0.117 0.132 | ||
| 1019.987 | 2.725 0.032 0.054 | 850.530 | 15.698 0.088 0.117 | ||
| 1021.217 | 2.924 0.036 0.053 | 860.216 | 13.811 0.105 0.104 | ||
| 1022.089 | 2.959 0.056 0.052 | 870.262 | 11.962 0.083 0.092 | ||
| 1022.874 | 2.871 0.056 0.051 | 880.145 | 10.615 0.084 0.083 | ||
| 1027.981 | 2.757 0.055 0.049 | 889.769 | 9.469 0.075 0.075 | ||
| 1033.769 | 2.652 0.058 0.047 | 899.809 | 8.250 0.063 0.067 | ||
| 1039.883 | 2.604 0.054 0.047 | 909.413 | 7.475 0.031 0.061 | ||
| 1049.905 | 2.256 0.033 0.043 | 910.113 | 7.310 0.082 0.060 | ||
| 1060.255 | 2.200 0.052 0.042 | 920.556 | 6.579 0.032 0.055 | ||
9 Conclusions
The measurement of the cross section was performed by the CMD-3 experiment at the VEPP-2000 collider in the energy range GeV in 209 energy points. The analysis was based on the biggest ever used collected statistics at the resonance region with events at GeV. The large statistics allows to study various systematic effects in detail. The development of the analysis strategy, cross-check studies and the analysis of the systematic effects were done in blind manner, without knowing the measured value of the cross section. The total systematic uncertainty of the pion form factor in the central -meson energy region is estimated as 0.7/0.9%, with the two numbers reflecting the difference in the detector performance in the different data taking seasons. The new result generally shows larger cross section compared to the previous measurements in the whole energy range under discussion.
The interference observed in the data allowed to measure the branching ratio of the decay as given in Eq. 15. As a by-product of the background analysis, the branching ratio of the decay (given in Sec.10) is measured using the background events which contaminate the signal sample of events within used collinear samples. The obtained result is in good agreement with the other measurements of the cross section, which indicates the proper handling of the background in the sample. More precise study of the process will be done in the ongoing dedicated analysis of the full events sample.
At the energies around -meson resonance the first measurement of the cross section is performed with high energy resolution. The corresponding decay parameters are given in Eq. 8.
As one of the consistency checks, the cross section was measured at the lowest energies GeV, where the muon pairs can be cleanly separated from the others. The experimental values are well consistent with the QED prediction with the average ratio as: σ_e^+e^-→μ^+μ^- / σ_QED = 1.0017±0.0016 ±0.0025 ±0.0056, where the first error is statistical and the others are estimated systematic uncertainties, the last term corresponds to the uncertainty of the fiducial volume determination.
The charge asymmetry in the final state was extracted using the forward and backward parts of the measured cross sections. The strong deviation was observed from the prediction based on the conventional scalar QED approach for the calculation of the radiative corrections. The improved GVMD model was proposed in the paper [56], which gives the remarkable agreement with the experimental data. The significant corrections beyond the scalar QED was also confirmed by the calculation in the dispersive formalism in the paper [57]. It will be still interesting to understand the difference between the C-odd radiative correction obtained in the dispersive formalism and that estimated in the GVMD model, which is sensed by the experimental statistical precision. The obtained result shows the importance of the appropriate choice of the model for the calculation of the radiative corrections for the channel. It is important to revise possible effect of the scalar QED limitations for other calculations including two photon exchange processes. The observed differences between the measured and predicted charge asymmetries for the and events averaged in the GeV energy range are and . This consistency better than 0.1% should additionally ensure our polar angle related systematic uncertainty estimation in the measurement of the pion form factor.
The measured cross section was used to evaluate contribution to the hadronic part of the anomalous magnetic moment of the muon in the energy range GeV. The value based on the CMD-3 data is notably larger than the evaluations, based on the results of the previous measurements. The CMD-3 result reduces the tension between the experimental value of the and its Standard Model prediction.
9.1 Acknowledgments
The authors are grateful to R. Lee for his help with the theoretical development of the GVMD model. We thank the VEPP-2000 team for the excellent machine operation.
References
- [1] F. Jegerlehner, Precision measurements of sigma(hadronic) for alpha(eff)(E) at ILC energies and (g-2)(mu), Nucl. Phys. B Proc. Suppl. 162 (2006) 22–32. arXiv:hep-ph/0608329, doi:10.1016/j.nuclphysbps.2006.09.060.
- [2] A. Czarnecki, S. I. Eidelman, S. G. Karshenboim, Muonium hyperfine structure and hadronic effects, Phys. Rev. D 65 (2002) 053004. arXiv:hep-ph/0107327, doi:10.1103/PhysRevD.65.053004.
- [3] A. Keshavarzi, D. Nomura, T. Teubner, of charged leptons, , and the hyperfine splitting of muonium, Phys. Rev. D 101 (1) (2020) 014029. arXiv:1911.00367, doi:10.1103/PhysRevD.101.014029.
- [4] M. Davier, A. Hoecker, B. Malaescu, Z. Zhang, A new evaluation of the hadronic vacuum polarisation contributions to the muon anomalous magnetic moment and to , Eur. Phys. J. C 80 (3) (2020) 241, [Erratum: Eur.Phys.J.C 80, 410 (2020)]. arXiv:1908.00921, doi:10.1140/epjc/s10052-020-7792-2.
- [5] T. Aoyama, et al., The anomalous magnetic moment of the muon in the Standard Model, Phys. Rept. 887 (2020) 1–166. arXiv:2006.04822, doi:10.1016/j.physrep.2020.07.006.
- [6] S. Borsanyi, et al., Leading hadronic contribution to the muon magnetic moment from lattice QCD, Nature 593 (7857) (2021) 51–55. arXiv:2002.12347, doi:10.1038/s41586-021-03418-1.
- [7] G. Colangelo, A. X. El-Khadra, M. Hoferichter, A. Keshavarzi, C. Lehner, P. Stoffer, T. Teubner, Data-driven evaluations of Euclidean windows to scrutinize hadronic vacuum polarization, Phys. Lett. B 833 (2022) 137313. arXiv:2205.12963, doi:10.1016/j.physletb.2022.137313.
- [8] M. Cè, et al., Window observable for the hadronic vacuum polarization contribution to the muon g-2 from lattice QCD, Phys. Rev. D 106 (11) (2022) 114502. arXiv:2206.06582, doi:10.1103/PhysRevD.106.114502.
- [9] C. Alexandrou, et al., Lattice calculation of the short and intermediate time-distance hadronic vacuum polarization contributions to the muon magnetic moment using twisted-mass fermions, Phys. Rev. D 107 (7) (2023) 074506. arXiv:2206.15084, doi:10.1103/PhysRevD.107.074506.
- [10] T. Blum, et al., An update of Euclidean windows of the hadronic vacuum polarization (1 2023). arXiv:2301.08696.
- [11] C. Alexandrou, et al., Probing the Energy-Smeared R Ratio Using Lattice QCD, Phys. Rev. Lett. 130 (24) (2023) 241901. arXiv:2212.08467, doi:10.1103/PhysRevLett.130.241901.
- [12] J. A. Miranda, P. Roig, New -based evaluation of the hadronic contribution to the vacuum polarization piece of the muon anomalous magnetic moment, Phys. Rev. D 102 (2020) 114017. arXiv:2007.11019, doi:10.1103/PhysRevD.102.114017.
- [13] C. M. Carloni Calame, M. Passera, L. Trentadue, G. Venanzoni, A new approach to evaluate the leading hadronic corrections to the muon -2, Phys. Lett. B 746 (2015) 325–329. arXiv:1504.02228, doi:10.1016/j.physletb.2015.05.020.
- [14] G. Abbiendi, et al., Measuring the leading hadronic contribution to the muon g-2 via scattering, Eur. Phys. J. C 77 (3) (2017) 139. arXiv:1609.08987, doi:10.1140/epjc/s10052-017-4633-z.
-
[15]
G. Abbiendi, et al., Letter of
Intent: the MUonE project, Tech. rep., CERN, Geneva (2019).
URL https://cds.cern.ch/record/2677471 - [16] J. Grange, et al., Muon (g-2) Technical Design Report (1 2015). arXiv:1501.06858.
- [17] B. Abi, et al., Measurement of the Positive Muon Anomalous Magnetic Moment to 0.46 ppm, Phys. Rev. Lett. 126 (14) (2021) 141801. arXiv:2104.03281, doi:10.1103/PhysRevLett.126.141801.
- [18] N. Saito, A novel precision measurement of muon g-2 and EDM at J-PARC, AIP Conf. Proc. 1467 (2012) 45–56. doi:10.1063/1.4742078.
- [19] R. R. Akhmetshin, et al., Reanalysis of hadronic cross-section measurements at CMD-2, Phys. Lett. B 578 (2004) 285–289. arXiv:hep-ex/0308008, doi:10.1016/j.physletb.2003.10.108.
- [20] V. M. Aul’chenko, et al., Measurement of the pion form-factor in the range 1.04-GeV to 1.38-GeV with the CMD-2 detector, JETP Lett. 82 (2005) 743–747. arXiv:hep-ex/0603021, doi:10.1134/1.2175241.
- [21] V. M. Aul’chenko, et al., Measurement of the cross section with the CMD-2 detector in the 370-520 MeV c.m. energy range, JETP Lett. 84 (2006) 413–417. arXiv:hep-ex/0610016, doi:10.1134/S0021364006200021.
- [22] R. R. Akhmetshin, et al., High-statistics measurement of the pion form factor in the rho-meson energy range with the CMD-2 detector, Phys. Lett. B 648 (2007) 28–38. arXiv:hep-ex/0610021, doi:10.1016/j.physletb.2007.01.073.
- [23] M. N. Achasov, et al., Update of the cross-section measured by SND detector in the energy region MeV, J. Exp. Theor. Phys. 103 (2006) 380–384. arXiv:hep-ex/0605013, doi:10.1134/S106377610609007X.
- [24] F. Ambrosino, et al., Measurement of and the dipion contribution to the muon anomaly with the KLOE detector, Phys. Lett. B 670 (2009) 285–291. arXiv:0809.3950, doi:10.1016/j.physletb.2008.10.060.
- [25] F. Ambrosino, et al., Measurement of from threshold to 0.85 GeV2 using Initial State Radiation with the KLOE detector, Phys. Lett. B 700 (2011) 102–110. arXiv:1006.5313, doi:10.1016/j.physletb.2011.04.055.
- [26] D. Babusci, et al., Precision measurement of and determination of the contribution to the muon anomaly with the KLOE detector, Phys. Lett. B 720 (2013) 336–343. arXiv:1212.4524, doi:10.1016/j.physletb.2013.02.029.
- [27] A. Anastasi, et al., Combination of KLOE measurements and determination of in the energy range GeV2, JHEP 03 (2018) 173. arXiv:1711.03085, doi:10.1007/JHEP03(2018)173.
- [28] J. P. Lees, et al., Precise Measurement of the Cross Section with the Initial-State Radiation Method at BABAR, Phys. Rev. D 86 (2012) 032013. arXiv:1205.2228, doi:10.1103/PhysRevD.86.032013.
- [29] M. Ablikim, et al., Measurement of the cross section between 600 and 900 MeV using initial state radiation, Phys. Lett. B 753 (2016) 629–638, [Erratum: Phys.Lett.B 812, 135982 (2021)]. arXiv:1507.08188, doi:10.1016/j.physletb.2015.11.043.
- [30] M. N. Achasov, et al., Measurement of the process cross section with the SND detector at the VEPP-2000 collider in the energy region GeV, JHEP 01 (2021) 113. arXiv:2004.00263, doi:10.1007/JHEP01(2021)113.
- [31] P. Y. Shatunov, et al., Status and perspectives of the VEPP-2000, Phys. Part. Nucl. Lett. 13 (7) (2016) 995–1001. doi:10.1134/S154747711607044X.
- [32] D. Shwartz, et al., Recomissioning and Perspectives of VEPP-2000 Collider, PoS ICHEP2016 (2016) 054. doi:10.22323/1.282.0054.
- [33] V. M. Aulchenko, et al., CMD-2M Detector Project (2001).
- [34] B. Khazin, Physics and detectors for VEPP-2000, Nucl. Phys. B Proc. Suppl. 181-182 (2008) 376–380. doi:10.1016/j.nuclphysbps.2008.09.068.
- [35] M. N. Achasov, et al., First experience with SND calorimeter at VEPP-2000 collider, Nucl. Instrum. Meth. A 598 (2009) 31–32. doi:10.1016/j.nima.2008.08.012.
- [36] S. Eidelman, Physics at VEPP-2000, Nucl. Phys. B Proc. Suppl. 162 (2006) 323–326. doi:10.1016/j.nuclphysbps.2006.09.122.
- [37] A. V. Anisenkov, et al., Status of the Liquid Xenon calorimeter of the CMD-3 detector, JINST 9 (2014) C08024. doi:10.1088/1748-0221/9/08/C08024.
- [38] A. B. Arbuzov, G. V. Fedotovich, F. V. Ignatov, E. A. Kuraev, A. L. Sibidanov, Monte-Carlo generator for annihilation into lepton and hadron pairs with precise radiative corrections, Eur. Phys. J. C 46 (2006) 689–703. arXiv:hep-ph/0504233, doi:10.1140/epjc/s2006-02532-8.
- [39] G. Balossini, C. M. Carloni Calame, G. Montagna, O. Nicrosini, F. Piccinini, Matching perturbative and parton shower corrections to Bhabha process at flavour factories, Nucl. Phys. B 758 (2006) 227–253. arXiv:hep-ph/0607181, doi:10.1016/j.nuclphysb.2006.09.022.
- [40] H. Czyż, S. Eidelman, G. V. Fedotovich, A. Korobov, S. E. Müller, A. Nyffeler, P. Roig, O. Shekhovtsova, T. Teubner, G. Venanzoni, Mini-Proceedings, 14th meeting of the Working Group on Rad. Corrections and MC Generators for Low Energies (12 2013). arXiv:1312.0454.
- [41] E. A. Kozyrev, et al., An amplitude analysis of the process in the center-of-mass energy range 900–2000 MeV with the CMD3 detector at the VEPP-2000 collider, EPJ Web Conf. 212 (2019) 03008. doi:10.1051/epjconf/201921203008.
- [42] F. A. Berends, P. H. Daverveldt, R. Kleiss, Monte Carlo Simulation of Two Photon Processes. 2. Complete Lowest Order Calculations for Four Lepton Production Processes in electron Positron Collisions, Comput. Phys. Commun. 40 (1986) 285–307. doi:10.1016/0010-4655(86)90115-3.
- [43] R. R. Akhmetshin, et al., Measurement of meson parameters in decay mode with CMD-2, Phys. Lett. B 476 (2000) 33–39. arXiv:hep-ex/0002017, doi:10.1016/S0370-2693(00)00123-4.
- [44] M. N. Achasov, et al., Study of the process in the energy region below 0.98 GeV, Phys. Rev. D 68 (2003) 052006. arXiv:hep-ex/0305049, doi:10.1103/PhysRevD.68.052006.
- [45] R. L. Workman, Review of Particle Physics, PTEP 2022 (2022) 083C01. doi:10.1093/ptep/ptac097.
- [46] M. Ablikim, et al., Measurement of the Cross Section from 0.7 GeV to 3.0 GeV via Initial-State Radiation (12 2019). arXiv:1912.11208.
- [47] J. P. Lees, et al., Study of the process using initial state radiation with BABAR, Phys. Rev. D 104 (11) (2021) 112003. arXiv:2110.00520, doi:10.1103/PhysRevD.104.112003.
- [48] M. N. Achasov, et al., Study of dynamics of the process in the energy range 1.15–2.00 GeV, Eur. Phys. J. C 80 (10) (2020) 993. arXiv:2007.14595, doi:10.1140/epjc/s10052-020-08524-4.
- [49] M. N. Achasov, et al., Study of the pi pi mass spectra in the process at = 1020 MeV, Phys. Rev. D 65 (2002) 032002. arXiv:hep-ex/0106048, doi:10.1103/PhysRevD.65.032002.
- [50] A. Aloisio, et al., Study of the decay with the KLOE detector, Phys. Lett. B 561 (2003) 55–60, [Erratum: Phys.Lett.B 609, 449–450 (2005)]. arXiv:hep-ex/0303016, doi:10.1016/j.physletb.2005.01.092.
- [51] R. R. Akhmetshin, et al., Study of with CMD-2 detector, Phys. Lett. B 642 (2006) 203–209. doi:10.1016/j.physletb.2006.09.041.
- [52] G. Abbiendi, et al., Mini-Proceedings of the STRONG2020 Virtual Workshop on ”Space-like and Time-like determination of the Hadronic Leading Order contribution to the Muon ”, in: STRONG2020 Virtual Workshop “Space-like and Time-like determination of the Hadronic Leading Order contribution to the Muon g 2”, 2022. arXiv:2201.12102.
- [53] J. P. Lees, et al., Measurement of initial-state–final-state radiation interference in the processes and , Phys. Rev. D 92 (7) (2015) 072015. arXiv:1508.04008, doi:10.1103/PhysRevD.92.072015.
- [54] F. Ambrosino, et al., Study of the decay with the KLOE detector, Phys. Lett. B 634 (2006) 148–154. arXiv:hep-ex/0511031, doi:10.1016/j.physletb.2006.01.016.
- [55] S. E. Muller, et al., Measurement of the pion form factor for between 0.1 and 0.85 GeV2 with the KLOE detector, Chin. Phys. C 34 (2010) 686–691. arXiv:0912.2205, doi:10.1088/1674-1137/34/6/013.
- [56] F. Ignatov, R. N. Lee, Charge asymmetry in process, Phys. Lett. B 833 (2022) 137283. arXiv:2204.12235, doi:10.1016/j.physletb.2022.137283.
- [57] G. Colangelo, M. Hoferichter, J. Monnard, J. R. de Elvira, Radiative corrections to the forward-backward asymmetry in , JHEP 08 (2022) 295. arXiv:2207.03495, doi:10.1007/JHEP08(2022)295.
- [58] A. B. Arbuzov, T. V. Kopylova, G. A. Seilkhanova, Forward–backward asymmetry in electron–positron annihilation into pion or kaon pairs revisited, Mod. Phys. Lett. A 35 (25) (2020) 2050210. arXiv:2003.14054, doi:10.1142/S0217732320502107.
- [59] P. Banerjee, T. Engel, N. Schalch, A. Signer, Y. Ulrich, Bhabha scattering at NNLO with next-to-soft stabilisation, Phys. Lett. B 820 (2021) 136547. arXiv:2106.07469, doi:10.1016/j.physletb.2021.136547.
- [60] S. Actis, et al., Quest for precision in hadronic cross sections at low energy: Monte Carlo tools vs. experimental data, Eur. Phys. J. C 66 (2010) 585–686. arXiv:0912.0749, doi:10.1140/epjc/s10052-010-1251-4.
- [61] F. Grancagnolo, et al., Drift chamber for the CMD-3 detector, Nucl. Instrum. Meth. A 623 (2010) 114–116. doi:10.1016/j.nima.2010.02.166.
- [62] E. V. Anashkin, et al., The CMD-2 cryogenic magnetic detector, Instrum. Exp. Tech. 49 (2006) 798–814. doi:10.1134/S0020441206060066.
- [63] E. V. Abakumova, M. N. Achasov, D. E. Berkaev, V. V. Kaminsky, N. Y. Muchnoi, E. A. Perevedentsev, E. E. Pyata, Y. M. Shatunov, Backscattering of Laser Radiation on Ultrarelativistic Electrons in a Transverse Magnetic Field: Evidence of MeV-Scale Photon Interference, Phys. Rev. Lett. 110 (14) (2013) 140402. arXiv:1211.0103, doi:10.1103/PhysRevLett.110.140402.
- [64] E. V. Abakumova, et al., A system of beam energy measurement based on the Compton backscattered laser photons for the VEPP-2000 electron–positron collider, Nucl. Instrum. Meth. A 744 (2014) 35–40. arXiv:1310.7764, doi:10.1016/j.nima.2014.01.020.
- [65] G. J. Gounaris, J. J. Sakurai, Finite width corrections to the vector meson dominance prediction for , Phys. Rev. Lett. 21 (1968) 244–247. doi:10.1103/PhysRevLett.21.244.
- [66] D. Bisello, et al., The Pion Electromagnetic Form-factor in the Timelike Energy Range 1.35-GeV 2.4-GeV, Phys. Lett. B 220 (1989) 321–327. doi:10.1016/0370-2693(89)90060-9.
- [67] G. Colangelo, M. Hoferichter, P. Stoffer, Two-pion contribution to hadronic vacuum polarization, JHEP 02 (2019) 006. arXiv:1810.00007, doi:10.1007/JHEP02(2019)006.
- [68] G. Colangelo, M. Hoferichter, B. Kubis, P. Stoffer, Isospin-breaking effects in the two-pion contribution to hadronic vacuum polarization, JHEP 10 (2022) 032. arXiv:2208.08993, doi:10.1007/JHEP10(2022)032.
- [69] B.-L. Hoid, M. Hoferichter, B. Kubis, Hadronic vacuum polarization and vector-meson resonance parameters from , Eur. Phys. J. C 80 (10) (2020) 988. arXiv:2007.12696, doi:10.1140/epjc/s10052-020-08550-2.
- [70] M. Hoferichter, B.-L. Hoid, B. Kubis, Three-pion contribution to hadronic vacuum polarization, JHEP 08 (2019) 137. arXiv:1907.01556, doi:10.1007/JHEP08(2019)137.
- [71] D. Stamen, D. Hariharan, M. Hoferichter, B. Kubis, P. Stoffer, Kaon electromagnetic form factors in dispersion theory, Eur. Phys. J. C 82 (5) (2022) 432. arXiv:2202.11106, doi:10.1140/epjc/s10052-022-10348-3.
- [72] E. A. Kozyrev, et al., Study of the process in the center-of-mass energy range 1004–1060 MeV with the CMD-3 detector at the VEPP-2000 collider, Phys. Lett. B 760 (2016) 314–319. arXiv:1604.02981, doi:10.1016/j.physletb.2016.07.003.
- [73] E. A. Kozyrev, et al., Study of the process in the center-of-mass energy range 1010–1060 MeV with the CMD-3 detector, Phys. Lett. B 779 (2018) 64–71. arXiv:1710.02989, doi:10.1016/j.physletb.2018.01.079.
- [74] L. M. Barkov, et al., Electromagnetic Pion Form-Factor in the Timelike Region, Nucl. Phys. B 256 (1985) 365–384. doi:10.1016/0550-3213(85)90399-2.
- [75] A. Quenzer, et al., Pion Form-Factor from 480 MeV to 1100 MeV, Phys. Lett. B 76 (1978) 512–516. doi:10.1016/0370-2693(78)90918-8.
- [76] G. Cosme, et al., Measurement of the electron-positron annihilation cross-section into at the energies 915 MeV, 990 MeV and 1076 MeV, LAL-1287 (7 1976).
- [77] T. Xiao, S. Dobbs, A. Tomaradze, K. K. Seth, G. Bonvicini, Precision Measurement of the Hadronic Contribution to the Muon Anomalous Magnetic Moment, Phys. Rev. D 97 (3) (2018) 032012. arXiv:1712.04530, doi:10.1103/PhysRevD.97.032012.
- [78] I. B. Vasserman, L. M. Kurdadze, V. A. Sidorov, A. N. Skrinsky, A. G. Chilingarov, Y. M. Shatunov, B. A. Shvarts, Measurement of the Branching Ratio, Phys. Lett. B 99 (1981) 62–65. doi:10.1016/0370-2693(81)90804-2.
- [79] V. B. Golubev, V. P. Druzhinin, V. N. Ivanchenko, E. A. Perevedentsev, A. N. Peryshkin, S. I. Serednyakov, V. A. Sidorov, Y. M. Shatunov, The decay (in Russian), Yad. Fiz. 44 (1986) 633–636.
- [80] M. N. Achasov, et al., Decay , Phys. Lett. B 474 (2000) 188–193. arXiv:hep-ex/0001048, doi:10.1016/S0370-2693(00)01477-X.
- [81] F. V. Ignatov, Measurement of the pion form-factor at 1.04-1.38 GeV energy range with the CMD-2 detector, Ph.D. thesis, Novosibirsk State U. (2008).
- [82] M. Gourdin, E. De Rafael, Hadronic contributions to the muon g-factor, Nucl. Phys. B 10 (1969) 667–674. doi:10.1016/0550-3213(69)90333-2.
- [83] Y. M. Bystritskiy, E. A. Kuraev, G. V. Fedotovich, F. V. Ignatov, The cross sections of the muons and charged pions pairs production at electron-positron annihilation near the threshold, Phys. Rev. D 72 (2005) 114019. arXiv:hep-ph/0505236, doi:10.1103/PhysRevD.72.114019.
- [84] A. Hoefer, J. Gluza, F. Jegerlehner, Pion pair production with higher order radiative corrections in low energy collisions, Eur. Phys. J. C 24 (2002) 51–69. arXiv:hep-ph/0107154, doi:10.1007/s100520200916.
- [85] M. Passera, W. J. Marciano, A. Sirlin, The Muon g-2 and the bounds on the Higgs boson mass, Phys. Rev. D 78 (2008) 013009. arXiv:0804.1142, doi:10.1103/PhysRevD.78.013009.
- [86] A. Keshavarzi, W. J. Marciano, M. Passera, A. Sirlin, Muon and connection, Phys. Rev. D 102 (3) (2020) 033002. arXiv:2006.12666, doi:10.1103/PhysRevD.102.033002.
- [87] B. Malaescu, M. Schott, Impact of correlations between and on the EW fit, Eur. Phys. J. C 81 (1) (2021) 46. arXiv:2008.08107, doi:10.1140/epjc/s10052-021-08848-9.
- [88] G. Colangelo, M. Hoferichter, P. Stoffer, Constraints on the two-pion contribution to hadronic vacuum polarization, Phys. Lett. B 814 (2021) 136073. arXiv:2010.07943, doi:10.1016/j.physletb.2021.136073.