Complex Daily Activities, Country-Level Diversity, and Smartphone Sensing: A Study in Denmark, Italy, Mongolia, Paraguay, and UK
Abstract.
Smartphones enable understanding human behavior with activity recognition to support people’s daily lives. Prior studies focused on using inertial sensors to detect simple activities (sitting, walking, running, etc.) and were mostly conducted in homogeneous populations within a country. However, people are more sedentary in the post-pandemic world with the prevalence of remote/hybrid work/study settings, making detecting simple activities less meaningful for context-aware applications. Hence, the understanding of (i) how multimodal smartphone sensors and machine learning models could be used to detect complex daily activities that can better inform about people’s daily lives, and (ii) how models generalize to unseen countries, is limited. We analyzed in-the-wild smartphone data and 216K self-reports from 637 college students in five countries (Italy, Mongolia, UK, Denmark, Paraguay). Then, we defined a 12-class complex daily activity recognition task and evaluated the performance with different approaches. We found that even though the generic multi-country approach provided an AUROC of 0.70, the country-specific approach performed better with AUROC scores in [0.79-0.89]. We believe that research along the lines of diversity awareness is fundamental for advancing human behavior understanding through smartphones and machine learning, for more real-world utility across countries.
1. Introduction
The field of activity recognition has gained substantial attention in recent years due to its usefulness in various domains, including healthcare (Straczkiewicz et al., 2021a), sports (Zhuang and Xue, 2019), transportation (Naseeb and Saeedi, 2020), and human well-being (Meegahapola and Gatica-Perez, 2020). For instance, fitness-tracking mobile health applications enable users to access activity-specific metrics (Zhuang and Xue, 2019; Siirtola et al., 2011). Similarly, smart home systems can make changes to the environment (e.g., lighting, temperature) based on the information gathered about people’s activities (Makonin et al., 2013; Nef et al., 2015). Context awareness, a key aspect of mobile phone user experience, is enabled with the integration of activity recognition (Wang et al., 2012; Oh et al., 2015).
Traditionally, sensor-based activity recognition relied on custom sensors attached to the body (Choudhury et al., 2008). While this approach is effective for small-scale studies, it is often challenging to scale up. The cost and maintenance required for these sensors can make them both expensive and obtrusive, reducing the motivation to use them. The alternative approach of using commercial wearables is not immune to these challenges, and these devices are often perceived as niche or abandoned after a short period of usage (Mercer et al., 2016; Coorevits and Coenen, 2016). This is where the presence of smartphones comes in handy. In the United States, 85% of adults and 96% of young adults own a smartphone, making it easier to target a broader audience (Center, 2021). Research in mobile sensing has revealed the potential of smartphone data for activity recognition (Straczkiewicz et al., 2021a; Meegahapola and Gatica-Perez, 2020). The widespread ownership and unobtrusive nature of smartphones make them an attractive solution to traditional sensor-based activity recognition. However, there is still a need to understand how multiple sensing modalities in smartphones can be utilized for complex daily activity recognition. Additionally, the generalization of complex daily activity recognition models across different countries remains an under-explored area of research.
Recognizing complex daily activities is important. In the activity recognition literature, multiple types of activities have been considered, each at different granularity levels (Dernbach et al., 2012; Saguna et al., 2013). Coarse-grained or simple activities like walking, sitting, or cycling are repeated unitary actions directly measurable from a proxy (e.g., inertial sensor unit). Fine-grained complex activities, or activities of daily living (ADL), are built on top of simple activities, but convey more specific contextual information (Wiener et al., 1990; Rai et al., 2012; Saguna et al., 2013). For example, eating, studying, working, and movie watching entail participants sitting. Such activities can not be measured by inertial sensor units alone (Bouton-Bessac et al., 2022; Meegahapola et al., 2020b; Biel et al., 2018) and need a more holistic multimodal sensing approach that captures a wide range of contexts and behaviors that build on top of simple activities (Saguna et al., 2013). Further, recognizing such complex daily activities could: (i) allow tracking the digital well-being of individuals in a more fine-grained manner (e.g., providing a breakdown of time spent eating, resting, attending a lecture, and studying, instead of just sitting (Sewall et al., 2020; Bouton-Bessac et al., 2022)); (ii) provide context-aware user experiences and notifications by understanding user behavior better (e.g., not sending phone notifications when a person is studying or attending a lecture, suggesting products while a user is shopping (Mehrotra and Musolesi, 2017)); and (iii) allow better content recommendation (e.g., recommending music based on the current daily activity such as working, studying, or shopping (Wang et al., 2012)), where complex activities can be more informative and valuable than simpler ones. However, even though inertial, location, or WiFi/Bluetooth data have been used separately for activity recognition (Rai et al., 2012; Saguna et al., 2013), prior work has not exhaustively studied complex daily activities by using multimodal smartphone sensing data.
The use of multimodal smartphone sensing data in machine learning models could provide a more comprehensive picture of complex daily activities when compared to using single modalities. This is especially relevant in light of the Covid-19 pandemic, which has brought about a significant shift in daily habits and activities (Stockwell et al., 2021; Zheng et al., 2020). The lockdown measures enforced to slow the spread of the virus resulted in a decrease in physical activity and an increase in sedentary behavior, particularly among young adults. This shift is evident in changes to smartphone use patterns (Ratan et al., 2021; Saadeh et al., 2021; Li et al., 2021), which can impact the effectiveness of location-based activity recognition methods in a remote/hybrid work/study setting where individuals tend to remain sedentary for extended periods of time. Hence, the importance of inertial and location sensors as predictive features could diminish due to sedentary behavior. This underscores the importance of incorporating fine-grained multimodal sensing features to accurately characterize the complex daily activities of these emerging lifestyles through smartphones. However, there is currently little understanding of which smartphone sensing features are systematically useful in characterizing different complex daily activities.
Taking a few steps back, we can also consider the “country” dimension and its influence on smartphone usage. Country differences can affect smartphone usage in different world regions (Mathur et al., 2017). For example, it could be socially frowned upon to take a call at a formal restaurant in Japan, while people in Europe could leave a movie theater to check their phone (Canton, 2012). It has been shown that people in Japan tend to be more reticent than in Sweden about talking on the phone in public transportation or, more generally, about being loud in public (Baron and af Segerstad, 2010). Another study about smartphone addiction among young adults in 24 countries found that the rigidity of social norms and obligations highly influenced smartphone usage (Olson et al., 2022). In addition to how people use the phone, prior work also discussed how passively sensed behavioral data about people differ in many countries (Althoff et al., 2017). These differences across countries constitute a form of diversity, which is a growing area of interest in computing and AI research (Cultures, 2022) 111While we acknowledge that cultures can be multidimensional and exist in tension with each other and in plurality within the same country (Yuval-Davis, 2004), some prior studies in mobile sensing, psychology, and sociology have used “culture” as a proxy to refer to the country of data collection (Phan et al., 2022; Khwaja et al., 2019; Van de Vijver and Tanzer, 2004; He and van de Vijver, 2012). However, in this study, for consistency, we use “country” (a more specific geographic region) as the unit of analysis that could affect phone usage behavior and sensing data. We also used the term “geographic” rarely, when appropriate and when referring to regions (i.e., Europe).. From a machine learning point-of-view, a diversified system contains more information and can better fit various environments (Gong et al., 2019). More generally, diversity-aware machine learning aims to improve the model’s representational ability through various components such as input data, parameters, and outputs (Gong et al., 2019). Concretely, country-level, diversity-aware activity recognition should try to understand the effect of the country diversity of smartphone users, on inference model performance. However, the understanding of how country diversity affects the smartphone sensing pipeline (from collected data to model performance) is limited, as previous work aimed at quantifying such effects has been scarce (Khwaja et al., 2019; Meegahapola and Gatica-Perez, 2020; Phan et al., 2022), due to reasons including, but not limited to, logistical difficulties in conducting longitudinal smartphone sensing studies with the same protocol in diverse countries.
| Terminology | Description |
| Complex Daily Activity | Based on prior studies that looked into complex activities of daily living (Saguna et al., 2013; Rai et al., 2012; Laput and Harrison, 2019a), we define these as activities that punctuate one’s daily routine; that are complex in nature and occur over a non-instantaneous time window; and that have a semantic meaning and an intent, around which context-aware applications could be built. |
| Country-Specific | This approach uses training and testing data from the same single country. Each country has its own model without leveraging data from other countries. As the name indicates, these models are specific to each country (e.g., a model trained in Italy and tested in Italy). |
| Country-Agnostic |
This approach assumes that data and models are agnostic to the country. Hence, a trained model can be deployed to any country regardless of the country of training. There are two types of country-agnostic phases:
(Phase I) This phase uses training data from one country and testing data from another country. This corresponds to the scenario where a trained machine learning model already exists, and we need to understand how it would generalize to a new country (e.g., a model trained in Italy and tested in Mongolia). (Phase II) This phase uses training data from four countries and testing data from the remaining country. This corresponds to a scenario where the model was already trained with data from several countries, and we need to understand how it would generalize to a new country (e.g., a model trained with data from Italy, Denmark, UK, and Paraguay, and tested in Mongolia). |
| Multi-Country | This one-size-fits-all approach uses training data from all five countries and tests the learned model in all countries. This corresponds to the setting in which multi-country data is aggregated to build one single generalized model. However, this is also how models are typically built without considering aspects such as country-level diversity. |
Our work uses a set of experimental approaches (country-specific, country-agnostic, and multi-country, described in Table 1), and model types (population-level and hybrid, described in Section 5). With the support of rich multimodal smartphone sensing data collected in multiple countries under the same experimental protocol, we address three research questions:
-
RQ1:
How are complex daily activities expressed in different countries, and what smartphone sensing features are the most useful in discriminating different activities?
-
RQ2:
Is a generic multi-country approach well-suited for complex daily activity recognition? To which extent can country differences be accurately modeled by country-specific approaches?
-
RQ3:
Can complex daily activity recognition models be country-agnostic? In other words, how well do models trained in one or more countries generalize to unseen countries?
In addressing the above research questions, we provide the following contributions:
-
Contribution 1:
We examined a novel smartphone sensor dataset and over 216K self-reports (including complex daily activities) collected from 637 college students in five countries (Denmark, Italy, Mongolia, Paraguay, and the United Kingdom) for over four weeks. To represent each activity self-report, we extracted around 100 features by processing multimodal smartphone sensor data (Table 3). Moreover, we defined 12 complex daily activity classes based on participant responses, prevalence, and prior work. The list includes sleeping, studying, eating, watching something, online communication and social media use, attending classes, working, resting, reading, walking, sports, and shopping. On the one hand, we found that similar features are most informative for all countries for specific activities (e.g., sleep, shopping, walking). On the other hand, for some other activities, the most informative features vary across countries. Interestingly, however, they remain approximately similar across geographically closer countries. For example, the "sport" activity has the use of "health & fitness apps" as a top feature across European countries. However, the feature was not prominent in Mongolia and Paraguay, where such physical activity-related app usage is lower. This divide is also visible in the “watching something” activity, which is influenced by the use of entertainment apps in European countries, and not in the other two countries.
-
Contribution 2:
We defined and evaluated a 12-class complex daily activity inference task with country-specific, country-agnostic, and multi-country approaches (Table 1). We also used population-level (not personalized) and hybrid (partially personalized) models to evaluate how model personalization affects performance within and across countries. We show that the generic multi-country approach, which directly pools data from all countries (a typical approach in many studies), achieved an AUROC of 0.70 with hybrid models. Country-specific models perform the best for the five countries, with AUROC scores in the range of 0.79-0.89. These results suggest that even though multi-country models are trained with more data, models could not encapsulate all the information towards better performance, possibly due to the averaging effect of diverse behaviors across countries. The country-specific approach consistently worked better.
-
Contribution 3:
With the country-agnostic approach, we found that models do not generalize well to other countries, with all AUROCs being below 0.7 in the population-level setting. With hybrid models, personalization increased the generalization of models reaching AUROC scores above 0.8, but not up to the same level as country-specific hybrid models. Moreover, even after partial personalization, we observed that models trained in European countries performed better when deployed in other European countries than in Mongolia or Paraguay. This shows that in addition to country diversity, behavior and technology usage habits could be what mediates the performance of models in different countries. In light of these findings, we believe that human-computer interaction and ubiquitous computing researchers should be aware of machine learning models’ geographic sensitivities when training, testing, and deploying systems to understand real-life human behavior and complex daily activities. We also highlight the need for more work to address the domain shift challenge in multimodal mobile sensing datasets across countries.
To the best of our knowledge, this is the first study that focuses on the use of multimodal smartphone sensing data for complex daily activity recognition, while examining the effect of country-level diversity of data on complex activity recognition models with a large-scale multi-country dataset, and highlighting domain shift-related issues in daily activity recognition, even when the same experimental protocols are used to collect data in different countries.
The paper is organized as follows. In Section 2, we describe the related work and background. Then, we describe the dataset in Section 3. In Section 4, we present the descriptive and statistical analysis regarding important features. We define and evaluate inference tasks in Section 5 and Section 6. Finally, we end the paper with the Discussion in Section 7 and the Conclusion in Section 8.
2. Background and Related Work
2.1. Mobile Sensing
In prior work, researchers have collected and analyzed mobile sensing data to understand various attributes of a particular population. Depending on the study, that goal can be put under coarse categories such as behavior, context, and person-aspect recognition (Meegahapola and Gatica-Perez, 2020). Behavior recognition is aimed at understanding user activities broadly. Person aspect recognition looks into understanding demographic attributes (e.g., sex, age, etc.), psychology-related attributes (e.g., mood, stress, depression, etc.), and personality. Finally, context recognition identifies different contexts (e.g., social context, location, environmental factors, etc.) in which mobile users operate.
Regarding behavior recognition, there are studies that aimed to capture binary (sometimes three) states of a single complex activity/behavior such as eating (e.g., eating meals vs. snacks (Biel et al., 2018), overeating vs. undereating vs. as usual eating (Meegahapola et al., 2021b)), smoking (e.g., smoking or not (McClernon and Roy Choudhury, 2013)) or drinking alcohol (e.g., drinking level (Phan et al., 2020; Bae et al., 2017a), drinking or not (Santani et al., 2018)). Another study used the action logs of an audio-based navigation app to predict its usage and understand what drives user engagement (Liu et al., 2022). Then, regarding person aspects, the MoodScope system (LiKamWa et al., 2013) inferred the mood of smartphone users with a multi-linear regression based on interactions with email, phone, and SMS, as well as phone location and app usage. Servia-Rodriguez et al. (Servia-Rodríguez et al., 2017) observed a correlation between participants’ routines and some psychological variables. They trained a deep neural network that could predict participants’ moods using smartphone sensor data. Additionally, Khwaja et al. (Khwaja et al., 2019) developed personality models based on random forests using smartphone sensor data. Finally, context recognition is aimed at detecting the context around behaviors and activities. (Meegahapola et al., 2020a) used sensing data from Switzerland and Mexico to understand its relation to the social context of college students when performing eating activities. More specifically, they built an inference model to detect whether a participant eats alone or with others. Similarly, (Meegahapola et al., 2021a) examined smartphone data from young adults to infer the social context of drinking episodes using features from modalities such as the accelerometer, app usage, location, Bluetooth, and proximity. In this case, context detection is two-fold: it’s based on the number of people in a group, and on their relationship to the participant (e.g., alone, with another person, with friends, with colleagues). Similarly, mobile sensing studies attempted to infer other contexts, psychological traits, and activities by taking behavior and contexts sensed using smartphone sensors as proxies (Meegahapola and Gatica-Perez, 2020; Cornet and Holden, 2018; Hoseini-Tabatabaei et al., 2013).
One common aspect regarding most of these studies is that they were done in the wild, focused on two or three-class state inference, and sensing is not fine-grained (i.e., using behavior and context as proxies to the dependent variable). This paper follows a similar approach with a dataset captured real life, using multimodal smartphone sensor data, and taking behavior and context as proxies for our dependent variable. However, in this study, the target attribute entails a 12-class daily activity recognition problem that is complex and novel compared to prior work. In addition, we are interested in examining model performance within and across five countries, with and without partial personalization.
2.2. Activity Recognition
Human activity recognition (HAR) aims to understand what people are doing at a given time. Large-scale datasets issued from the activity of smartphone users have a lot of potential in solving that task. This “digital footprint" has been used to re-identify individuals using credit-card metadata (de Montjoye et al., 2015): it has been shown that only 4 data points are required to re-identify 90% of individuals. While the same approach could be followed using smartphone sensing data, our main focus is activity recognition at a single point in time rather than using time series for re-identification. We will focus on two types of activity recognition techniques: wearable-based and smartphone-based (Straczkiewicz et al., 2021b).
2.2.1. Wearable-based HAR
In wearable-based activity recognition, the users wear sensors such as wearable accelerometers from which the data is analyzed and classified to detect activities. For example, in healthcare, wearable-based HAR can be used to analyze gait and prevent falling or monitor physical activity and observe health outcomes (Liu et al., 2021). The wearable-sensing trend emerged two decades ago and relied on custom-designed wearable sensors (Farringdon et al., 1999; Park et al., 1999), which were backed by encouraging findings in health research. With time, custom sensors were replaced by commercial fitness or activity trackers. Unfortunately, applying these findings to real-world settings was rare due to the high cost of producing custom sensors, the difficulty distributing devices to a broad audience, and their unpopularity among some users (Coorevits and Coenen, 2016). This restricted most studies using wearables to performing experiments in a controlled environment or in the wild with smaller populations. However, wearable-based HAR models that could recognize simple activities are currently deployed across many commercial wearable devices.
2.2.2. Smartphone-based HAR
With the popularity of smartphones in the past two decades, the problems of wearable-based HAR were solved. Reality Mining (Eagle and (Sandy) Pentland, 2006) is a pioneering study in the field of mobile sensing: it showed the utility of mobile sensing data in a free-living setting. In smartphone-based activity recognition, people do not need to use wearable sensors. Instead, the system relies on a smartphone that is always on and stays closer to its user. Smartphones replace wearable devices as the former contains multiple sensors such as an accelerometer, gyroscope, GPS, proximity, or thermometer. Nevertheless, smartphones capture data at multiple positions (e.g., a pocket, hand, or handbag), which introduces a bias in sensor measurements as they are position-dependent (Yang and Wang, 2016).
Regardless of the device used, most prior activity recognition tasks have been done in lab-based/controlled settings where accurate ground truth capture is possible (Straczkiewicz et al., 2021a). The prime goal of such studies is to increase the accuracy of activity recognition models with precise ground truth and sensor data collection (e.g., by placing sensors on fixed body positions, recording ground truth with videos, etc.). However, these studies are hard to scale and do not capture the real behavior of participants, and this is especially true for complex daily activities (Saguna et al., 2013). For example, a person’s behavior when studying, working, or shopping in an unconstrained environment can not be replicated in a lab. On the other hand, some studies are done in the wild (Laput and Harrison, 2019b; Saguna et al., 2013), where the ground truth and sensor data collection might not be that precise but allow capturing complex daily activities in a naturalistic setting. Our study is similar, where our intention was to take a more exploratory stance, build country-level diversity-aware models, and compare their performance within and across different countries.
2.3. Activity Types
One crucial difference across existing studies is in the selection of activities. A majority of studies work towards the recognition of simple activities. For example, Straczkiewicz et al. (Straczkiewicz et al., 2021a) classified activities into groups such as posture (lying, sitting, standing), mobility (walking, stair claiming, running, cycling), and locomotion (motorized activities). Laput and Harrison (Laput and Harrison, 2019a) called such activities coarse or whole-body. Activities belonging to these groups are directly measurable from one or more proxies (e.g., inertial sensor unit, location). For example, when considering the accelerometer, each activity has a distinct pattern on the different axes (Dernbach et al., 2012). However, they constitute a small subset of activities performed by people in daily lives (Saguna et al., 2013; Rai et al., 2012; Cobian et al., 2013).
Notice that some of the simple activities described above are usually part of more complex activities (e.g., sitting while eating, walking while shopping). Dernbach et al. (Dernbach et al., 2012) defined complex activities as a series of multiple actions, often overlapping. Along with Bao et al. (Bao and Intille, 2004), they used the same techniques to recognize both simple and complex activities. This results in weaker performances for complex activities since their structure is more complicated. Another approach is considering complex activities hierarchically by using combinations of simple activities to predict more complex ones. Huynh et al. (Huynh et al., 2008) characterized user routines as a probabilistic combination of simple activities. Blanke et al. (Blanke and Schiele, 2009) used a top-down method that first identifies simple activities to recognize complex ones. However, this requires pre-defining simple activities and mappings to complex activities. Some studies focus on detecting binary episodes of a single complex activity or a specific action. For example, the Bites’n’Bits study (Biel et al., 2018) examined the contextual differences between eating a meal and a snack, and presented a classifier able to discriminate eating episodes among students. Likewise, DrinkSense (Santani et al., 2018) aimed at detecting alcohol consumption events among young adults on weekend nights. Unfortunately, such task-specific classifiers will perform poorly when exposed to situations they were not trained on.
In this study, we focus on a majority of complex daily activities (11 out of 12 and one simple activity: walking) derived by considering over 216K self-reports from college students in five countries. In this context, drawing from prior studies that looked into activities of daily living (Saguna et al., 2013; Rai et al., 2012), for the scope of this paper, we define complex activities as "activities that punctuate one’s daily routine; that are complex in nature and occur over a non-instantaneous time window; and that have a semantic meaning and an intent, around which context-aware applications could be built". While it is impossible to create a classifier that could recognize all complex human activities, we believe the classifier we propose captures a wide range of prevalent activities/behaviors, especially among young adults.
2.4. Diversity-Awareness in Smartphone Sensing
Research in the field of smartphone sensing, including the studies mentioned above, lacks diversity in their study populations (Meegahapola and Gatica-Perez, 2020). Regarding country diversity, with a few exceptions (Servia-Rodríguez et al., 2017; Khwaja et al., 2019), most experiments were conducted in a single country or rarely two. This can be problematic with respect to the generalization of findings since smartphone usage differs across geographic regions, which can lead to different patterns being observed in, for example, two populations of different genders or age range (Del Rosario et al., 2014). Khwaja et al. stressed the importance of diversity awareness in mobile sensing (Khwaja et al., 2019). Moreover, experiments performed in a controlled setting usually can not accommodate many participants. While this makes the whole process lighter and more manageable, it also restricts the generalization of results to a broader free-living audience (Sasaki et al., 2016; van Hees et al., 2013). According to Phan et al. (Phan et al., 2022), cross-country generalizability is the extent to which findings apply to different groups other than those under investigation.
Diversity awareness and model generalization are two essential aspects, as they will allow an activity recognition system to be deployed and to perform well across different user groups and countries (Meegahapola et al., 2023; Schelenz et al., 2021a). In computer vision research, the lack of diversity has been repeatedly shown for specific attributes such as gender and skin color (Raji and Buolamwini, 2019; Cuthbertson, 2019; Karkkainen and Joo, 2021). In natural language processing and speech research, not accounting for dialects in different countries could marginalize groups of people from certain countries (Prabhakaran et al., 2022). Hence, ignoring country diversity when developing AI systems could harm users in the long run by marginalizing certain groups of people (Prabhakaran et al., 2022). In this context, smartphone sensing studies that consider country-level diversity are still scarce (Phan et al., 2022). This could be due to the lack of large-scale datasets, logistical difficulties in data collection in different countries, and studies being time and resource-consuming. Khwaja et al. (Khwaja et al., 2019) built personality inference models using smartphone sensor data from five countries and showed that such models perform well when tested in new countries. To the best of our knowledge, their study is one of the first to investigate the generalization of smartphone sensing-based inference models across different countries. In our work, we focus on complex daily activity recognition with smartphone sensing and aim to uncover and examine model behavior in multi-country settings.
2.5. Human-Centered Aspects in Smartphone Usage
Our literature review has so far focused on the technical aspects such as data collection or target variables. We now discuss the impact of smartphone usage on individuals and society, which is studied by various disciplines in the social sciences. Previous work includes the study of smartphone dependence among young adults, where it was found that problematic smartphone use varies by country and gender (Lopez-Fernandez et al., 2017; van Deursen et al., 2015), and those specific activities such as social networking, video games, and online shopping contribute to the addiction (Lopez-Fernandez et al., 2017; Olson et al., 2022). Another study (Rathod et al., 2022) summarized findings on correlations between smartphone usage and psychological morbidities among teens and young adults. Excessive smartphone usage could lead to emotional difficulties, impulsivity, shyness, low self-esteem, and some medical issues such as insomnia, anxiety, or depression. From a sociological standpoint, Henriksen et al. (Henriksen et al., 2020) studied how smartphones impact interactions in cafés and defined three concepts of social smartphone practices. Interaction suspension (e.g., your friend goes to the bathroom), which can lead to using the smartphone to appear occupied or to avoid uncomfortable situations while being alone. Deliberate interaction shielding corresponds to situations where one suspends an ongoing interaction to answer a phone call or a text message, whether it is an emergency or just in fear of missing out. Accessing shareables, which leads to a collective focus on shared content (e.g., pictures or short videos), giving the smartphone a role of enhancing face-to-face social interactions rather than obstructing them. Nelson and Pieper (Nelson and Pieper, 2022) showed that smartphone attachment “inadvertently exacerbates feelings of despair while simultaneously promises to resolve them", thus trapping users in negative cycles.
According to Van Deursen et al. (van Deursen et al., 2015), older populations are less likely to develop addictive smartphone behaviors. While they are often associated with younger generations, smartphones are slowly gaining popularity among older generations as they are coming up with creative ways to integrate them into their habits. Miller et al. (Miller et al., 2021) investigated the role that smartphones play in different communities across nine countries. Through 16-month-long ethnographies, they showed that various groups of people have specific ways of taking ownership of their smartphones through apps, customization, and communication. For example, in Ireland, smartphones are used by the elderly in many of their daily activities, and in Brazil, the usage of messaging applications for health have lead to the creation of a manual of best practices for health through such applications. More globally, smartphones can help users stay in touch with their extended families or distant friends, a feature that has been particularly important during the 2020 global pandemic. In this paper, we attempt to uncover country-specific smartphone usage patterns through multimodal sensing data. While these insights may not have the depth that field observations provide, they represent a starting point for future research to draw upon.
Hence, all while considering these factors, we aim to examine smartphone sensing-based inference models for complex daily activity recognition with country-specific, country-agnostic, and multi-country approaches, as described in Figure 1.
3. Data, Features, and Target Classes
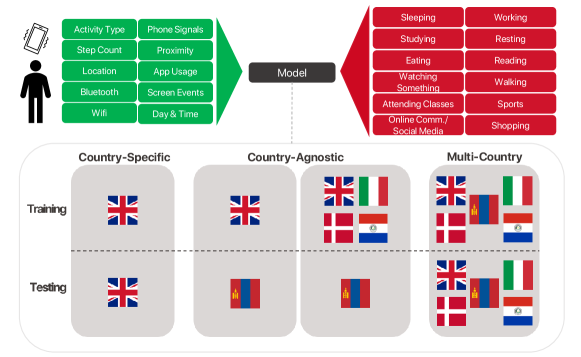
High-level overview of the study is given in this diagram. The study uses continuous and interaction sensing modalities and different approaches such as country-specific, country-agnostic, and multi-country, to infer complex daily activities.
3.1. Dataset Information
To address our research questions, we collected a smartphone sensing dataset regarding the everyday behavior of college students for four weeks during November 2020, in the context of the European project "WeNet: The Internet of Us" 222The dataset is planned to be released for research purposes after the end of the project, by complying with all regulations governing the data collection protocol within and outside the European Union. Hence, future plans for dataset access will be made available on the project website: https://www.internetofus.eu/. The study procedure is summarized in a technical report (Giunchiglia et al., 2022). The sample consisted of both undergraduate and graduate students. This dataset was collected to study the effect of the diversity of study participants on social interactions and smartphone sensor data. The dataset contains over 216K self-reported activities collected from 637 college students living in five countries (ordered by the number of participants): Italy, Mongolia, the United Kingdom, Denmark, and Paraguay. All data were collected using Android smartphones with the same mobile app. Table 2 shows the distribution of participants across countries. Moreover, the data were collected with a protocol compliant with the EU General Data Protection Regulation (GDPR) and with each non-EU country’s rules. In addition, written approvals from the ethical review boards (or similar entities) were acquired by each participating university, separately.
| University | Country | Participants | Age () | % Women | # of Self-Reports |
| University of Trento | Italy | 259 | 24.1 (3.3) | 58 | 116,170 |
| National University of Mongolia | Mongolia | 224 | 22.0 (3.1) | 65 | 65,387 |
| London School of Economics & Political Science | UK | 86 | 26.6 (5.0) | 66 | 20,238 |
| Universidad Católica "Nuestra Señora de la Asunción" | Paraguay | 42 | 25.3 (5.1) | 60 | 6,998 |
| Aalborg University | Denmark | 26 | 30.2 (6.3) | 58 | 7,461 |
| Total/Mean | 637 | 24.0 (4.3) | 62 | 216,254 |
The first phase of the data collection obtained questionnaire data about the participants, their habits, social relations, individual practices (e.g., physical activities, leisure), and skills (personal and interpersonal). This data was aimed at capturing different aspects of diversity, including observable characteristics such as demographics as well as less observable aspects such as personality, traits, skills, values, and relations (Schelenz et al., 2021b). The second phase collected data through a smartphone application. Participants filled out time diaries multiple times throughout the day. Participants were asked about their sleep quality and expectations at the start of the day. At the end of the day, they had to report how their day went. At every hour, they had to self-report what they were doing (current activity, using a drop-down list of 34 activities), location (a list of 26 semantic locations), social context (a list of 8 social contexts), and mood (valence was captured similar to (LiKamWa et al., 2013) with a five-point scale). The app continuously collected data from more than thirty smartphone sensors, which can be broken down into two categories (Meegahapola and Gatica-Perez, 2020): continuous sensing modalities such as the simple activity type (derived using inertial sensors and location with the Google Activity Recognition API (Google, 2022)), step count, location, WiFi, Bluetooth, phone signal, battery, and proximity; and interaction sensing modalities such as application usage time, screen usage episode counts and time, notification clicking behaviors, and user presence time.
3.2. Deriving Features
The choice of the dataset’s format is key for the rest of the study. A tabular dataset centered around activities or events enables the handcrafting of a multitude of sensor-specific features discussed in prior literature (Santani et al., 2018; Meegahapola and Gatica-Perez, 2020; Canzian and Musolesi, 2015; Servia-Rodríguez et al., 2017; Meegahapola et al., 2021b). This later enables the use of traditional machine learning methods. However, a temporal dataset relies mainly on raw sensor measurements in the form of time series (i.e., raw accelerometer and gyroscope data in typical activity recognition). This approach allows deep learning methods to extract and learn relevant high-level features automatically. Past research (Zhu et al., 2019; Avilés-Cruz et al., 2019) has shown that using deep learning techniques yields better-performing HAR classifiers. These studies typically include simple activities that are easier to detect with inertial sensors than the more complex ones we are interested in. This is particularly important in remote study/work settings, where many activities are performed while at home. Therefore, we chose to perform the analysis using a tabular dataset with the heterogeneous handcrafted features described below.
We aggregated all sensor measurements with self-reports to create features using smartphone data. We followed a time-window-based approach similar to prior studies on event-level inferences (Meegahapola and Gatica-Perez, 2020; Straczkiewicz et al., 2021b; Servia-Rodríguez et al., 2017). Hence, we used 10 minutes before and after each self-report and aggregated sensor data in the corresponding 20-minute interval 333We conducted experiments with different time windows between 5 minutes and 25 minutes. We did not go beyond 25 minutes because it would lead to overlapping sensor data segments, hence leaking data between data points. 20-minute window performed the best out of the examined time windows. For brevity, we only present results with the 20-minute window. Shorter windows might not have performed reasonably because they do not capture enough contextual information to make the inference. Prior work too has shown that large time windows might be suitable to detect binary activities (Bae et al., 2017b; Meegahapola et al., 2021a; Biel et al., 2018). While traditional and inertial sensor-based recognition of simple activities attempts to capture repetitive moments using deep learning with a smaller time window, that method is not applicable here because we attempt to capture a set of non-repetitive activities that last longer. In addition, we consider behavior and context sensed with the smartphone as a proxy to the target activity, similar to prior ubicomp studies (McClernon and Roy Choudhury, 2013; Meegahapola et al., 2021b; Servia-Rodríguez et al., 2017). So, the corresponding features generated using sensing modalities are shown in Table 3. More details on how each sensing modality was pre-processed can be found in (Meegahapola et al., 2023). In addition to sensor data features, we added a feature that describes the time period of the day when the activity occurred and a weekend indicator. While there is no agreement as to how a day could be split into morning, afternoon, evening, and night in the literature (Obuchi et al., 2020; Wang et al., 2020, 2017; Nepal et al., 2020; Wang et al., 2022), we defined five time periods: morning from 6 AM to 10 AM, noon from 10 AM to 2 PM, afternoon from 2 PM to 6 PM, evening from 6 PM to 10 PM, and night from 10 PM to 6 AM, and included it as another feature that could be used in training machine learning models.
| Modality | Corresponding Features and Description |
| Location | radius of gyration, distance traveled, mean altitude calculated similarly to prior work (Canzian and Musolesi, 2015) |
| Bluetooth [LE, normal] | number of devices (the total number of unique devices found), mean/std/min/max RSSI (Received Signal Strength Indication – measure close/distant closer devices are) (Santani et al., 2018) |
| WiFi | connected to a network indicator, number of devices (the total number of unique devices found), mean/std/min/max RSSI (Santani et al., 2018) |
| Cellular [GSM, WCDMA, LTE] | number of devices (the total number of unique devices found), mean/std/min/max phone signal strength (Santani et al., 2018) |
| Notifications | notifications posted (the number of notifications that came to the phone), notifications removed (the number of notifications that were removed by the participant) – these features were calculated with and without duplicates. (LiKamWa et al., 2013) |
| Proximity | mean/std/min/max of proximity values (Bae et al., 2017b) |
| Activity | time spent doing the following simple activities: still, in_vehicle, on_bicycle, on_foot, running, tilting, walking, other (derived using the Google Activity Recognition API (Google, 2022)) |
| Steps | steps counter (steps derived using the total steps since the last phone turned on), steps detected (steps derived using event triggered for each new step) (Das Swain et al., 2022) |
| Screen events | touch events (number of phone touch events), user presence time (derived using android API that indicate whether a person is using the phone or not), number of episodes (episode is from turning the screen of the phone on until the screen is turned off), mean/min/max/std episode time (a time window could have multiple episodes), total time (total screen on time within the time window) (LiKamWa et al., 2013; Bae et al., 2017b; Meegahapola et al., 2021b) |
| App events | time spent on apps of each category derived from Google Play Store (LiKamWa et al., 2013; Santani et al., 2018): action, adventure, arcade, art & design, auto & vehicles, beauty, board, books & reference, business, card, casino, casual, comics, communication, dating, education, entertainment, finance, food & drink, health & fitness, house, lifestyle, maps & navigation, medical, music, news & magazines, parenting, personalization, photography, productivity, puzzle, racing, role-playing, shopping, simulation, social, sports, strategy, tools, travel, trivia, video players & editors, weather, word |
| Time & Day | hour of the day, period of the day (morning, noon, afternoon, evening, night), weekend indicator (weekday or weekend) (Biel et al., 2018; Meegahapola et al., 2021b) |
3.3. Determining Target Classes
Hourly self-reports required participants to log what they were doing at the time by selecting an activity from a predefined list of thirty-four items. These items were derived based on prior work (Giunchiglia et al., 2017; Zhang et al., 2021). By looking at their distribution in different countries (Figure 2), one can quickly notice that they are highly unbalanced. The remote work/study constraints during the time of data collection were one of the causes behind this imbalance, because activities such as traveling, walking, or shopping would have been more popular if mobility was not restricted. A closer look at the list of activities shows that some classes are too broad in terms of semantic meaning. Hence, similar to prior work that narrowed down activity lists based on various aspects (Laput and Harrison, 2019a), we narrowed down the original list of activities into 12 categories to capture complex daily activities that are common enough in the daily lives of people, especially in a remote work/study setting. For example, under “hobbies”, one can be playing the piano or painting, and the two do not entail the same smartphone usage and are not common enough. Similarly, “social life” is too broad, as one could be in a bar, a restaurant, or a park. Moreover, to mitigate the class imbalance problem, we decided to filter the target classes. First, classes that had similar semantic meanings were merged: this is the case of eating and cooking, and social media and internet chatting. Classes representing a broad activity were removed, such as personal care, household care, games, and hobbies. Finally, classes that did not have enough data in all countries were removed, such as listening to music, movie, theatre, concert, and free-time study. Filler classes such as “nothing special” or “other” were also removed. This filtering reduced the number of target classes to twelve, and their updated distribution is shown in Figure 3. These classes entail activities performed during daily life that are complex in nature and have a semantic meaning around which context-aware applications could be built. Moreover, the selected activities also align with prior work that looked into complex daily activity recognition (Saguna et al., 2013).
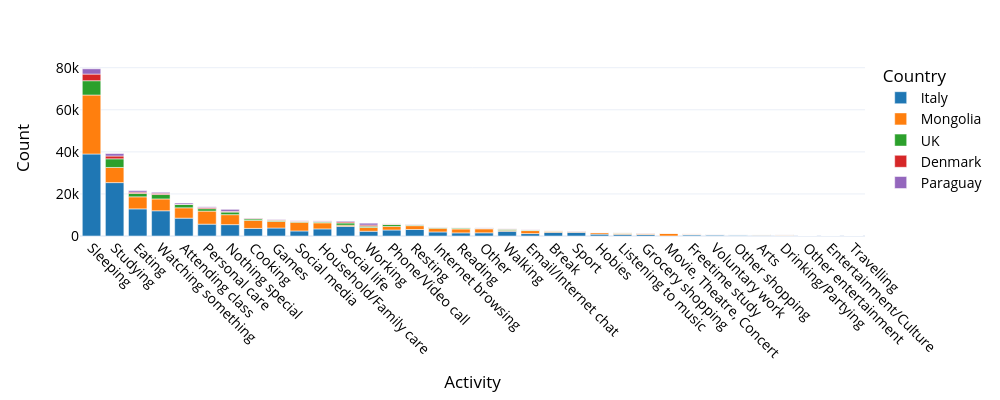
The original distribution of target classes before any filtering or merging was done. X-axis shows the activities. Y-axis shows the country, separated by countries. Activities with the highest number of self-reports include sleeping, studying, eating, watching something, and attending class.
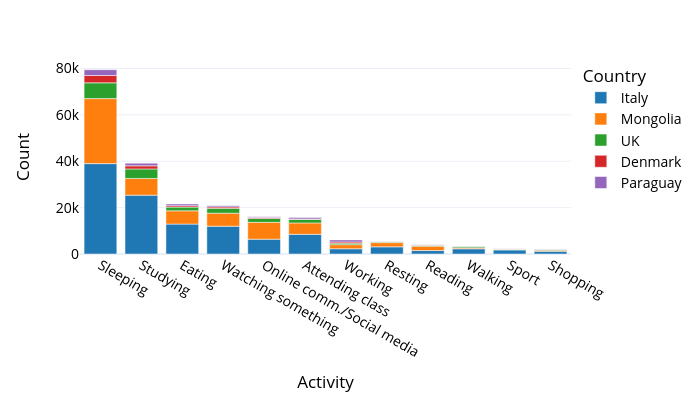
Distribution of target classes after removing classes that are semantically broad or lack data. Now the 12 classes include sleeping, studying, eating, watching something, online communication or social media, attending class, working, resting, reading, walking, sport, and shopping.
4. How are activities expressed in different countries, and what smartphone features are most discriminant? (RQ1)
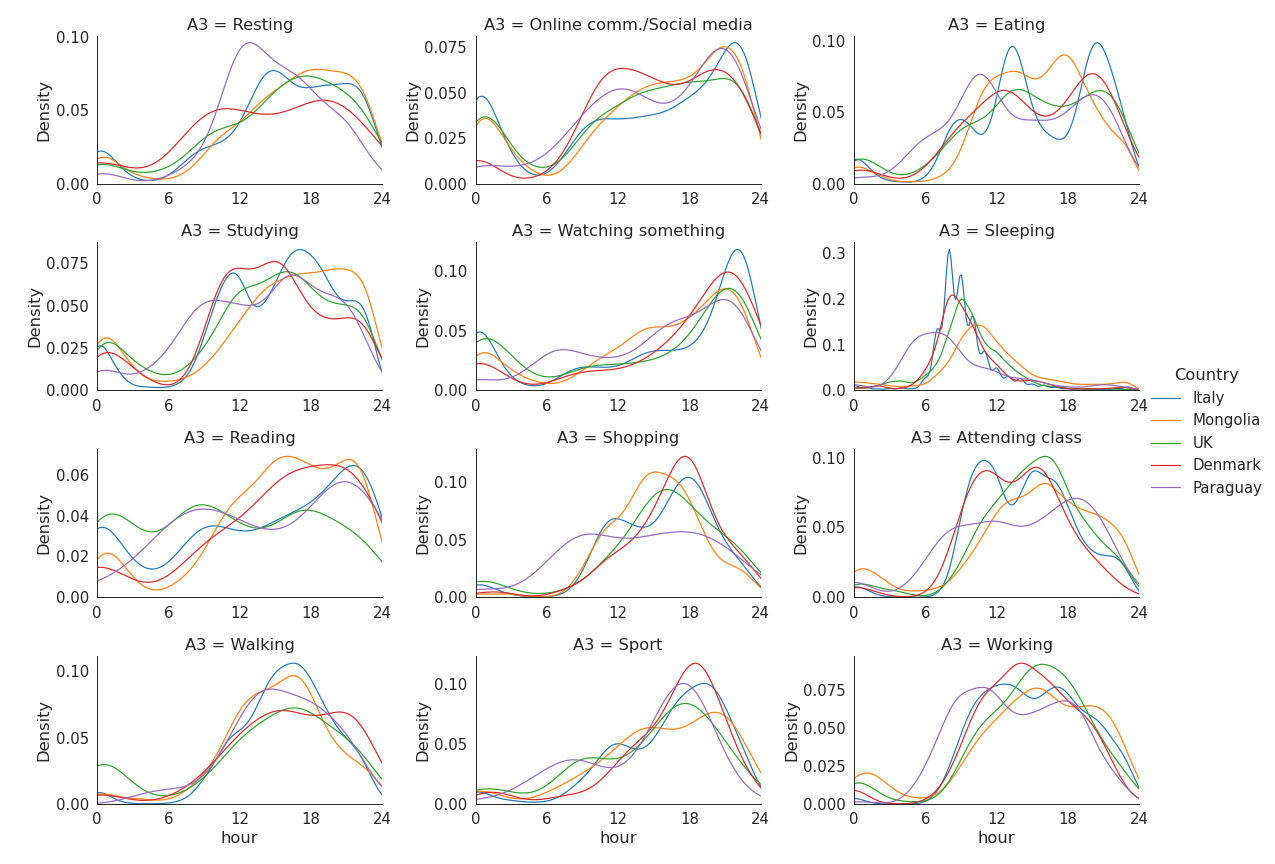
Density functions of target classes as a function of the hour of the day in each country. In each diagram, the x-axis refers to the hour of the day, and the y-axis refers to the density of each activity.
To understand the distribution of activities in each country and to determine the influence of features on the target, we provide a descriptive and statistical analysis of the dataset in this section, hence shedding light on RQ1.
4.1. Hourly Distribution of Activities
The activities we consider all seem to occur at different times: people tend to sleep at night, work during the day, and eat around noon and in the evening. However, not all schedules are the same, especially not across different countries (Fisher and Robinson, 2010; Esteban Ortiz-Ospina and Roser, 2020). We reported the density function of each target class at different hours of the day in Figure 4. In each diagram, the x-axis refers to the hour of the day, and the y-axis refers to the density of each activity. On an important note, while most activities were reported as they were being performed, in the case of sleeping, participants reported the activity after they woke up and still in bed, meaning that peaks for that activity could also be interpreted as “waking up”. This was later confirmed with many participants in all countries during post-study interviews. This also makes the time of the day less informative when inferring the sleeping activity.
A first look at the distribution shows the “expected” patterns, such as a peek of sleeping during the night or peaks around eating times for lunch and dinner. Notice that participants from Paraguay tend to sleep less than others, reflecting that they start working and resting earlier in the day. Online communication and social media usage happen around noon, coinciding with a break from classes and lunchtime, followed by a high peak towards the end of the day. This is in line with prior studies that showed that depending on the location context and hour of the day, the use of certain social media applications (i.e., Twitter) could differ (Deng et al., 2018). Moreover, we also observe country differences in hourly social media and online communication app usage patterns as reported by users. For example, between noon and 6 pm, there is a dip in the usage of these types of apps in Italy, Paraguay, and Denmark, whereas that pattern is not visible in the UK. Prior work has also studied social media app usage and adoption-related differences, especially across countries. As per those studies, such usage differences could result from cultural characteristics within countries and from motives of people for using different apps (Alsaleh et al., 2019; Lim et al., 2014). Most leisure activities (reading, shopping, sport, watching something) happen towards the end of the day, right when students have finished their classes.
Another activity that showed clear cross-country differences is “Eating”. We can observe that Italians tend to eat later than others, which hints at their Mediterranean customs (Tobin, 2018). Italy also showed two clear peaks for lunch and dinner with a sharp dip in between the two meals. The dip is less visible in other countries, indicating that meals are more spread out across different times. Moreover, the dinner peaks for all countries except Mongolia were peaking on or after 6 pm, whereas in Mongolia, it was before 6 pm. These findings suggest that the hour of the day could indicate whether people are eating or not—slightly differently in Italy, Mongolia, and other countries. In fact, prior studies that used mobile sensors for studies regarding eating behavior showed that the hour of the day is an important feature in predicting aspects related to eating (Biel et al., 2018; Meegahapola et al., 2021b). To add to that, prior studies have also pointed out that meal times, frequency, and sizes too could differ between countries (Chiva, 1997), even within Europe (Southerton et al., 2012). Finally, the activity “walking” had more or less similar distributions across countries. In fact, a smartphone-based activity tracking study by Althoff et al. (Althoff et al., 2017) mentioned that the average number of steps walked by people across Italy, the UK, Denmark, and Mongolia were in the same ballpark (i.e., around 5000-6000 daily steps).
4.2. Statistical Analysis of Features
To understand the importance of each smartphone sensing feature in discriminating each target activity from others, we reported in Table 4 the top three features and their ANOVA (Analysis of variance) F-values (Kim, 2014) for each activity and each country. The goal is to identify features that define an activity and how those differ across countries. We consider each country-activity pair alone to find features that influence the classification task in a binary setting (i.e., determining whether the participant is sleeping or not, studying or not, eating or not, etc.).
| Italy | Mongolia | UK | Denmark | Paraguay | ||||||
| Feature | F | Feature | F | Feature | F | Feature | F | Feature | F | |
| app_tools | 5423 | day_period | 6623 | day_period | 1632 | day_period | 354 | app_not-found | 510 | |
| day_period | 4439 | app_not-found | 3595 | screen_max_episode | 603 | screen_max_episode | 249 | noti_removed_wo_dups | 348 | |
| Sleeping | screen_max_episode | 2498 | noti_removed_wo_dups | 1052 | screen_time_per_episode | 534 | screen_time_per_episode | 156 | notifications_posted_wo_dups | 289 |
| screen_max_episode | 1447 | day_period | 683 | screen_time_total | 446 | screen_max_episode | 241 | app_video players & editors | 147 | |
| screen_time_total | 1378 | noti_removed_wo_dups | 220 | screen_max_episode | 396 | screen_time_total | 225 | app_not-found | 84 | |
| Studying | day_period | 1146 | app_photography | 178 | screen_time_per_episode | 247 | weekend | 154 | day_period | 43 |
| day_period | 271 | day_period | 518 | day_period | 61 | proximity_std | 38 | app_not-found | 37 | |
| app_tools | 98 | app_not-found | 180 | app_not-found | 26 | proximity_max | 29 | wifi_mean-rssi | 23 | |
| Eating | app_not-found | 61 | activity_still | 72 | app_video players & editors | 23 | app_communication | 18 | wifi_max-rssi | 21 |
| app_entertainment | 715 | day_period | 326 | app_video players & editors | 397 | app_entertainment | 151 | wifi_mean-rssi | 51 | |
| app_not-found | 426 | app_not-found | 325 | wifi_std_rssi | 85 | app_not-found | 59 | app_lifestyle | 38 | |
| Watching something | weekend | 334 | wifi_num_of_devices | 217 | app_entertainment | 66 | notifications_posted | 58 | weekend | 29 |
| app_social | 1381 | touch_events | 503 | wifi_num_of_devices | 112 | app_tools | 64 | app_tools | 95 | |
| screen_time_total | 565 | screen_time_total | 355 | wifi_connected | 93 | app_causal | 58 | proximity_max | 58 | |
| Online comm./ Social media | screen_max_episode | 473 | app_not-found | 354 | screen_time_total | 92 | screen_time_total | 42 | proximity_mean | 48 |
| weekend | 3167 | day_period | 455 | weekend | 357 | app_not-found | 119 | notifications_posted_wo_dups | 148 | |
| screen_num_of_episodes | 745 | weekend | 289 | day_period | 260 | notifications_posted | 104 | weekend | 112 | |
| Attending class | app_tools | 476 | app_not-found | 251 | screen_max_episode | 70 | screen_max_episode | 37 | screen_time_total | 87 |
| steps_detected | 271 | wifi_mean_rssi | 1049 | screen_time_per_episode | 143 | proximity_mean | 305 | activity_invehicle | 441 | |
| screen_time_per_episode | 210 | wifi_max_rssi | 848 | proximity_mean | 129 | proximity_max | 304 | wifi_num_of_devices | 226 | |
| Working | screen_num_of_episodes | 206 | wifi_min_rssi | 633 | screen_max_episode | 124 | proximity_std | 292 | activity_walking | 163 |
| day_period | 337 | day_period | 191 | app_medical | 374 | notifications_posted | 22 | app_photography | 145 | |
| app_tools | 117 | screen_time_total | 89 | app_arcade | 72 | app_not-found | 16 | app_trivia | 64 | |
| Resting | app_educational | 66 | screen_max_episode | 75 | day_period | 55 | touch_events | 14 | app_maps & navigation | 23 |
| app_books & reference | 955 | app_not-found | 167 | app_not-found | 215 | cellular_lte_min | 252 | app_adventure | 21 | |
| app_comics | 93 | touch_events | 122 | wifi_std_rssi | 109 | app_tools | 83 | app_comics | 16 | |
| Reading | app_news & magazines | 93 | day_period | 121 | wifi_max_rssi | 77 | location_altitude | 76 | location_altitude | 6 |
| activity_onfoot | 3518 | activity_onfoot | 1582 | steps_detected | 376 | steps_detected | 285 | activity_walking | 25 | |
| activity_walking | 3497 | activity_walking | 1579 | steps_counter | 314 | activity_walking | 101 | activity_onfoot | 25 | |
| Walking | steps_detected | 3374 | steps_detected | 1009 | activity_walking | 232 | activity_onfoot | 101 | location_radius_of_gyration | 23 |
| app_health & fitness | 502 | day_period | 33 | app_health & fitness | 931 | app_health & fitness | 1248 | wifi_max_rssi | 50 | |
| day_period | 233 | wifi_num_of_devices | 32 | proximity_min | 52 | noti_removed | 72 | proximity_std | 41 | |
| Sport | notifications_posted | 132 | wifi_min_rssi | 23 | day_period | 40 | day_period | 34 | wifi_mean_rssi | 41 |
| steps_detected | 283 | activity_onfoot | 1270 | day_period | 74 | activity_walking | 132 | app_weather | 86 | |
| activity_onfoot | 267 | activity_walking | 1269 | user_presence_time | 41 | activity_onfoot | 131 | app_auto & vehicles | 84 | |
| Shopping | activity_walking | 265 | steps_detected | 504 | screen_num_of_episodes | 38 | steps_detected | 55 | activity_walking | 79 |
The resulting features across countries for the same activity are different in most cases, highlighting the dataset’s diversity and each country’s cultural differences or habits. For example, when studying, features regarding screen episodes dominate in the UK, Italy, and Denmark, while the day period appears in Italy, Mongolia, and Paraguay. This could mean that European students tend to use their phones when studying more (or less) than students from Paraguay or Mongolia. This divide is also visible when “watching something”, which is influenced by the use of entertainment applications in Europe, but not in Paraguay or Mongolia. This effect could be due to the unpopularity of streaming services classified as entertainment applications in the latter two countries, where participants might rely on alternatives. In fact, differences in using streaming services across countries have been studied in prior work, highlighting differences in usage percentages (Lotz, 2021) and the relations to income level (Nhan et al., 2020). On the other hand, it could also be that students watch something on a medium that is not their smartphone. In fact, research shows that young adults aged 18-29 use more online media streaming services as compared to television in the USA (Centre, 2017). However, whether similar percentages hold across different countries with contrasting cultures, income levels, and internet quality remains a question. While not conclusive, these could be the reason for entertainment apps not being indicative of “watching something” in Mongolia and Paraguay, which are the non-European countries in this study.
For some activities, the top three features are inherent to the nature of the activity. For example, “reading” in Italy has features corresponding to reading applications such as books, comics, newspapers, and magazines. Other countries do not show this. The same observation can be made for the “sports” activity: health and fitness apps are one of the determining features in European countries. This effect could correspond to participants tracking their workouts using a smartphone app.
The “walking” activity has almost the same features in all five countries: steps detected and an on-foot or walking activity detected by the Google Activity Recognition API. This homogeneity is due to the nature of the activity—walking is considered a simple activity. This is also why shopping has some of the same features as walking since participants also walk when they shop. To summarize, in most cases, each country has different defining features when looking at the same activity. For some activities, the features found are inherent to the activity and are usually app categories. Finally, it is worth mentioning that the period of the day is an important feature, which matches what has been observed in Figure 4 — all activities do not occur at the same frequency throughout the day.
Finally, it is worth noting that we could expect some of the highly informative features to change over time, with changes to technology use and habits of people, in different countries (Xu et al., 2023; Adler et al., 2022). For example, a reason for the lack of use of streaming services in certain countries is the lack of laws surrounding the usage of illegally downloaded content (e.g., Germany has strict laws about not using illegal downloads (Rump, 2011)). Changes in the laws of countries could change the behavior of young adults. Further, internet prices could also affect the use of streaming services. While bandwidth-based and cheap internet is common in developed countries, it is not the same in developing nations in Asia, Africa, and South America, where internet usage is expensive, hence demotivating streaming. In addition, income levels too could influence captured features a lot. For example, with increasing income levels (usually happens when a country’s GDP changes), young adults may use more wearables for fitness tracking, leading to the usage of health and fitness apps on mobile phones. Another aspect that could affect the captured behaviors is the weather condition. All five countries mentioned in this study go through different seasons, as all are somewhat far from the equator. Hence, we could expect changes in features in different seasons. More about this is discussed in the limitations section.
5. Machine Learning-based Inference: Experimental Setup, Models, and Performance Measures
This study aims to perform a multi-class inference of smartphone sensing data to predict what participants do at a particular time. The input space consists of the features in the tabular dataset previously mentioned. We study the three approaches to the problem as summarized in Figure 1, going from country-specific to multi-country.
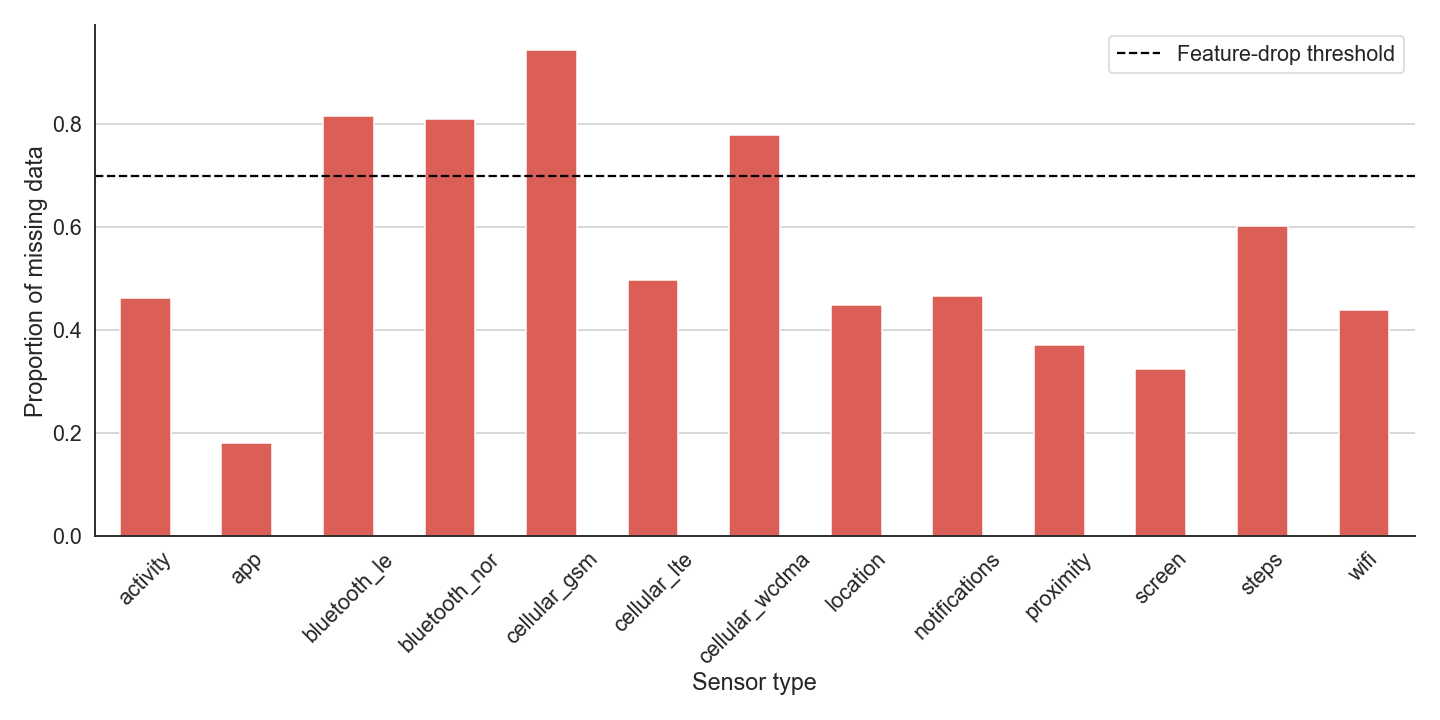
Proportion of missing data per sensor type is shown as a bar chart. More than 90% of GSM cellular sensor values were unavailable, possibly due to devices being put in airplane mode, sensor failure, or the phone mostly operating with LTE signals. For other modalities, data were available more than 70% of the time.
5.1. Data Imputation
The first step in preparing the dataset for inference was data imputation. Missing data in the context of smartphone sensing can occur for multiple reasons (Servia-Rodríguez et al., 2017; Bae et al., 2017b; Meegahapola et al., 2022): the device being on low-consumption mode, the failure of a sensor, or insufficient permissions from the participants. In the dataset we used, we noticed that most sensors have some missing values (see Figure 5). For example, more than 90% of GSM cellular sensor values were unavailable, possibly due to devices being put in airplane mode, sensor failure, or the phone mostly operating with LTE signals. To deal with missing values, we decided to drop features from sensors that were missing more than 70% of their data (refer to the dotted line on Figure 5) similar to prior work (Santani et al., 2018). For the remaining features, and each country individually, we used k-Nearest Neighbour (kNN) imputation (Zhang, 2012) to infer missing information from neighboring samples 444We also tried mean imputation, user-based mean imputation, most frequent value imputation, last observation carried forward (LOCF) imputation, in addition to kNN. However, we obtained the best results for inferences with kNN. In addition, using kNN is common in studies that used passive sensing (Zhang et al., 2022; Rashid et al., 2020; Zhou et al., 2018; Xu et al., 2021). Hence, we only reported results obtained with kNN..
5.2. Models and Performance Measures
To conduct all experiments, we used the scikit-learn (Pedregosa et al., 2011) and Keras (Chollet et al., 2015) frameworks, with Python. We first trained the following two baseline models: one that always predicts the most frequent label and another that randomly predicts targets by considering the class distribution. This will allow us to understand if the trained models perform better than a randomized guess. The experiments were carried out with the following model types: Random Forest Classifier (Breiman, 2001) (RF), AdaBoost with Decision Tree Classifier (Hastie et al., 2009), and Multi-Layer Perceptron neural networks (MLP) (Wang, 2003) 555We initially tried out other model types such as Gradient Boosting and XGBoost in addition to the reported models. Results for these models were not reported considering their performance and page limits. All these model types are commonly used in small mobile sensing datasets that are in tabular format (Merrill and Althoff, 2022; Biel et al., 2018; Meegahapola et al., 2021b). The first two inherently leverage class imbalance, and RFs also facilitate the interpretability of results. Each experiment was carried out ten times to account for the effect of randomness. For each experimental setup, we reported the mean and standard deviation across the ten runs for the following metrics: F1 score (Scikit-Learn, 2022b), and the area under the Receiver Operating Characteristic curve (AUROC) (Scikit-Learn, 2022a). Even though we calculated the accuracies of models, and while the accuracy is easy to interpret, it might not present a realistic picture in an imbalanced data setting. Hence, we did not include it in the results. The weighted macro F1 score computes metrics for each class and averages them following their support, resulting in a metric that considers label imbalance. Moreover, it takes a significant hit if one of the classes has a lot of false positives. A low F1 score could imply that the classifier has difficulty with rare target classes. The AUROC score measures how well the model can distinguish each activity. It can be understood as an average of F1 scores at different thresholds. We also used a weighted macro version to account for label imbalance.
Next, we examine results for country-specific, country-agnostic, and multi-country approaches (Khwaja et al., 2019). Finally, for all three approaches, we examine population-level, and hybrid models that correspond to no and partial personalization, respectively, similar to (Meegahapola et al., 2023; Meegahapola et al., 2022; LiKamWa et al., 2013) (training and testing splits were always done with 70:30 ratio):
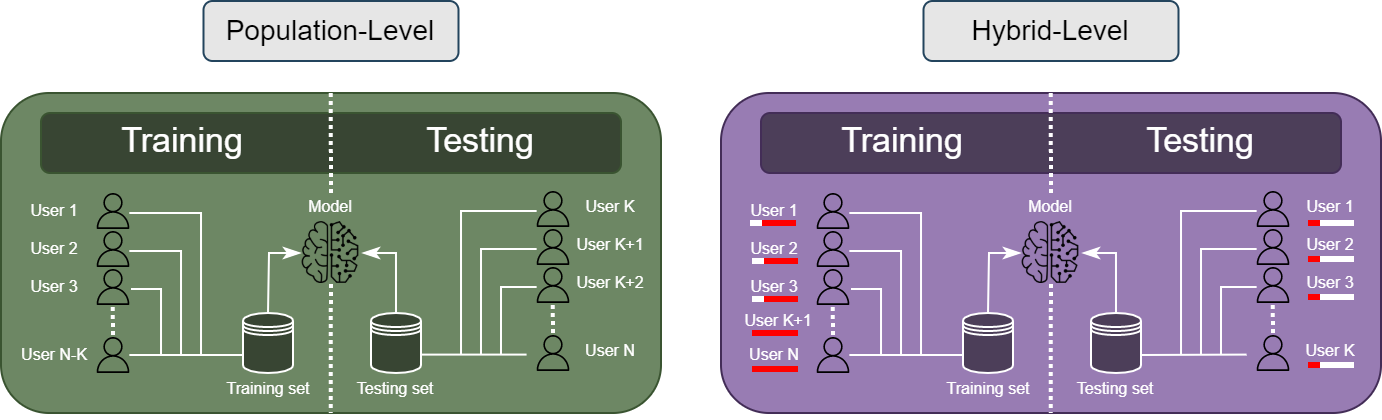
Personalization levels used in the country-specific, country-agnostic, and multi-country approaches. Population-level corresponds to models with no personalization. Hybrid corresponds to models with partial personalization.
-
•
Population-Level model, also known as leave-k-participants-out in country-specific and multi-country approaches, and leave-k-countries-out in country-agnostic approach: the set of participants present in the training set (70%) and the testing set (30%) are disjoint. The splitting was done in a stratified manner, meaning each split was made by preserving the percentage of samples for each class. This represents the case where the model was trained on a subset of the population, and a new set of participants joined a system that runs the model and started using it.
-
–
In the country-specific approach, this means that data from disjoint participants are in training and testing splits, and everyone is from the same country. E.g., trained with a set of participants in Italy and tested with another set of participants in Italy who were not in the training set.
-
–
In the country-agnostic approach, this means the training set is from one (Phase I) or four (Phase II) countries, and the testing set is from a country not seen in training. E.g., For Phase I — trained with a set of participants in Italy and tested with a set of participants in Mongolia; Phase II — trained with a set of participants in Italy, Denmark, UK, and Mongolia, and tested with a set of participants in Paraguay.
-
–
In the multi-country approach, this means a disjoint set of participants in training and testing without considering country information. This is the typical way of training models even when data are collected from multiple countries (Servia-Rodríguez et al., 2017). E.g., trained with a set of participants from all five countries and tested with a set of participants in all five countries who were not in the training set.
-
–
-
•
Hybrid model, also known as the leave-k-samples-out: the sets of participants in the training and testing splits are not disjoint. Part of the data of some participants present in the testing set (70%) was used in training the models. Testing is done with the rest of the data from the participants (30%). This represents the case where the model was trained on the population, and the same participants whose data were used in training continue to use the model. Hence, models are partially personalized.
-
–
In the country-specific setting, this means that some data from participants within a country in the testing set can also be in the training set. This represents a scenario where personalization is examined within the country. E.g., trained with a set of participants in Italy and tested with another set of participants in Italy, whose data (70%) were also used in the training set. The rest of the data (30%) were used in the testing set.
-
–
In the country-agnostic setting, this means the training set is from one/more countries, and the testing set is from another country, where a percentage of their past data (70%) was also included in the training. This represents a scenario where personalization is examined when deployed to a new country. E.g., Phase I — trained with a set of participants in Italy and tested with a set of participants in Mongolia, whose data (70%) were also used in the training set. Rest of the data (30%) were used in the testing set; Phase II — trained with a set of participants in Italy, Denmark, UK, Mongolia, and tested with a set of participants in Paraguay, whose data (70%) were also used in the training set. The rest of the data (30%) were used in the testing set.
-
–
In the multi-country setting, this means that training and testing participants are not disjoint, and country information is not considered. This is the typical way of partially personalizing models even when data are collected from multiple countries. E.g., trained with a set of participants from all five countries and tested with a set of participants in all five countries, whose data (70%) were also used in the training set. The rest of the data (30%) were used in the testing set.
-
–
6. Inference Results
In this section, we present the results of the experiments. First, we discuss results from the country-specific and multi-country approaches, shedding light on RQ2. Then, the country-agnostic approach is discussed by providing answers to RQ3 on model generalization.
6.1. Country-Specific and Multi-Country Approaches (RQ2)
Country-Specific Approach
| Baseline I | Baseline II | Random Forest | AdaBoost | MLP | ||||||
| Population-Level | ||||||||||
| F1 | AUROC | F1 | AUROC | F1 | AUROC | F1 | AUROC | F1 | AUROC | |
| Italy | 0.17 (0.000) | 0.50 (0.000) | 0.19 (0.001) | 0.50 (0.001) | 0.41 (0.001) | 0.71 (0.001) | 0.39 (0.000) | 0.71 (0.000) | 0.38 (0.002) | 0.68 (0.002) |
| Mongolia | 0.26 (0.000) | 0.50 (0.000) | 0.23 (0.001) | 0.50 (0.001) | 0.33 (0.002) | 0.62 (0.001) | 0.33 (0.000) | 0.63 (0.000) | 0.34 (0.003) | 0.61 (0.004) |
| UK | 0.17 (0.000) | 0.50 (0.000) | 0.18 (0.002) | 0.50 (0.001) | 0.32 (0.004) | 0.63 (0.003) | 0.31 (0.000) | 0.59 (0.000) | 0.22 (0.006) | 0.56 (0.003) |
| Denmark | 0.25 (0.000) | 0.50 (0.000) | 0.24 (0.006) | 0.49 (0.003) | 0.32 (0.008) | 0.61 (0.006) | 0.34 (0.000) | 0.57 (0.000) | 0.25 (0.008) | 0.57 (0.006) |
| Paraguay | 0.19 (0.000) | 0.50 (0.000) | 0.19 (0.006) | 0.49 (0.002) | 0.30 (0.004) | 0.59 (0.003) | 0.28 (0.000) | 0.56 (0.000) | 0.31 (0.009) | 0.58 (0.004) |
| Hybrid | ||||||||||
| F1 | AUROC | F1 | AUROC | F1 | AUROC | F1 | AUROC | F1 | AUROC | |
| Italy | 0.17 (0.000) | 0.50 (0.000) | 0.19 (0.001) | 0.50 (0.001) | 0.63 (0.001) | 0.87 (0.001) | 0.40 (0.000) | 0.73 (0.000) | 0.51 (0.002) | 0.81 (0.000) |
| Mongolia | 0.26 (0.000) | 0.50 (0.000) | 0.23 (0.002) | 0.50 (0.001) | 0.51 (0.001) | 0.79 (0.001) | 0.34 (0.000) | 0.66 (0.000) | 0.45 (0.002) | 0.75 (0.002) |
| UK | 0.17 (0.000) | 0.50 (0.000) | 0.19 (0.003) | 0.50 (0.001) | 0.66 (0.001) | 0.88 (0.006) | 0.34 (0.000) | 0.68 (0.000) | 0.58 (0.003) | 0.83 (0.002) |
| Denmark | 0.25 (0.000) | 0.50 (0.000) | 0.24 (0.003) | 0.50 (0.002) | 0.69 (0.002) | 0.89 (0.001) | 0.41 (0.000) | 0.66 (0.000) | 0.67 (0.002) | 0.87 (0.002) |
| Paraguay | 0.18 (0.000) | 0.50 (0.000) | 0.19 (0.002) | 0.49 (0.003) | 0.61 (0.003) | 0.84 (0.001) | 0.30 (0.000) | 0.61 (0.000) | 0.58 (0.002) | 0.79 (0.001) |
We consider this approach to be the base setting that does leverage country-level diversity in building separate models—each country has its own model independently from others. Table 5 summarizes the results of experiments following the country-specific approach. In the population-level setting, the three models perform more or less similarly, but the RFs are generally better based on F1 and AUROC scores. In the case of the hybrid models, RFs performed the best across the five countries, with AUROC scores in the range of 0.79-0.89, where the lowest was for Mongolia, and the highest was for Denmark. Compared to population-level models, we can notice a substantial bump in performance in the hybrid models, showing the effect of personalization within countries. These results suggest that random forest models applied to a partially personalized setting can recognize complex daily activities from passive sensing data with a good performance. Given this conclusion, even though we got results for all model types for subsequent sections, we will present results only using random forest models.
Multi-Country Approach
This approach aims at building a generic multi-country or one-size-fits-all model with the expectation that it would capture the diversity of all countries. All five countries are present in both the training and the testing set. We, therefore, consider all participants of the dataset, regardless of their country, similar to an experiment where country-level diversity is ignored. Hence, we can examine population-level and hybrid models for a multi-country approach in this context. Further, models were evaluated with a dataset with an imbalanced representation from five countries (multi-country w/o downsampling — MC w/o DS) and a balanced representation from five countries by randomly downsampling from countries with more data to make it equal to the country with the least number of self-reports (i.e., Paraguay) (multi-country w/ downsampling — MC w/ DS). The results are shown in Figure 7 in comparison to country-specific results. MC w/o DS had an AUROC of 0.71 while MC w/ DS had an AUROC of 0.68, indicating that training on the original data distribution performed better. The reason could in fact be that, more data led to better performance. The expectation of training with downsampled data was to give equal emphasis to each country, expecting that the model would perform well to all countries. However, the result indicates that it is not the case.
These results shed light on our RQ2: learning a multi-country model for complex activity recognition solely using passive smartphone sensing data is difficult (AUROC: 0.709 with hybrid models). It does not yield better performance than the country-specific approach (AUROCs of the range 0.791-0.894). This may stem from the data’s imbalance between countries and classes or the context in which the dataset was collected. Another primary reason for this could be behavioral differences in data highlighted in Table 4, making it difficult for a model to learn the representation when the diversity of data is unknown. Distributional shifts 666https://huyenchip.com/2022/02/07/data-distribution-shifts-and-monitoring.html#data-shifts across datasets from different countries could be the reason for this. When sensor feature and ground truth distributions (we discussed ground truth distributions in Section 4) are different across countries, it could lead to an averaging effect, which would lead to worse-performing models than models for each country. Moreover, it is worth noting that there are not a lot of studies that trained country-specific and multi-country models for performance comparison (Phan et al., 2022). In one of the only other studies that we found (Khwaja et al., 2019), personality trait inference performance using smartphone sensor data was better when using country-specific models, similar to what we found for complex daily activity inference. Finally, from a human-centered perspective, recruiting participants to collect smartphone sensing data to build machine learning models means that—rather than targeting large samples from a single country, recruiting a reasonable number of participants from diverse countries could help deploy better-performing models to multiple countries.
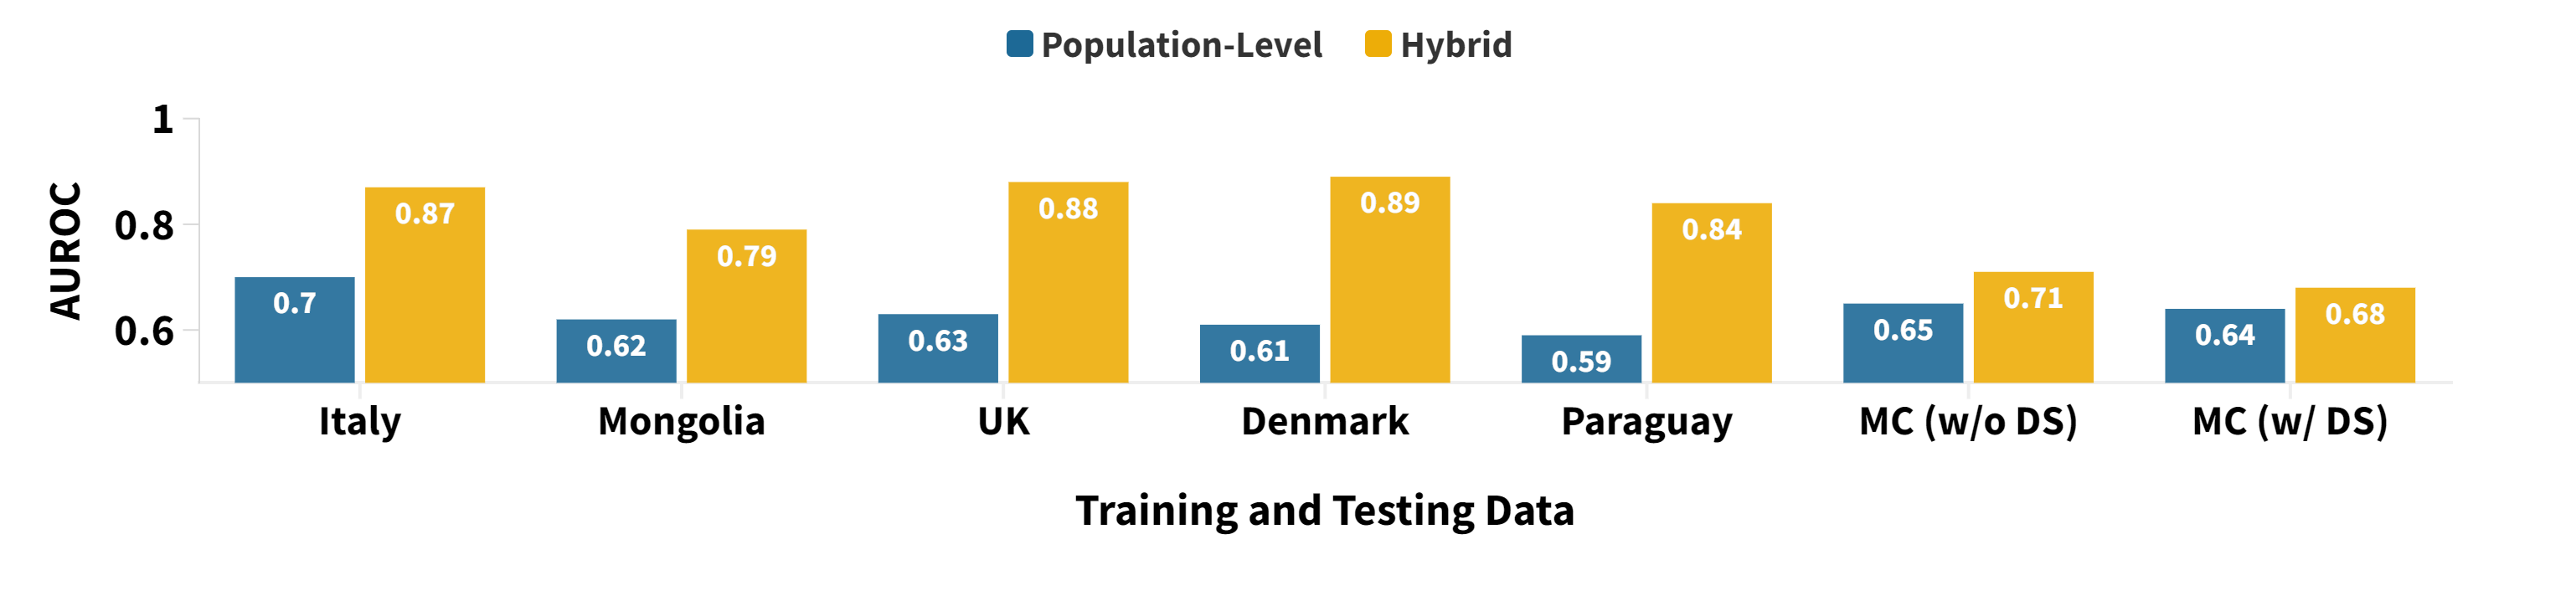
Diagram shows mean AUROC score comparison for country-specific and multi-country approaches with population-level and hybrid models. MC: Multi-Country; w/o DS: without downsampling; w/ DS: with downsampling. Results show that the country-specific approach provides better results than the multi-country approach, by large margins across both population-level and hybrid models.
6.2. Generalization Issues with Country-Agnostic Approach (RQ3)
We examined this research question with two phases as detailed in Table 1. During the first phase, to evaluate the extent to which country-specific models generalize to new countries, we tested models trained with a single country’s data in the other four countries separately. In the second phase, to evaluate the extent to which a model trained with four countries generalized to the remaining country, we trained with different combinations of countries and tested on the remaining country.
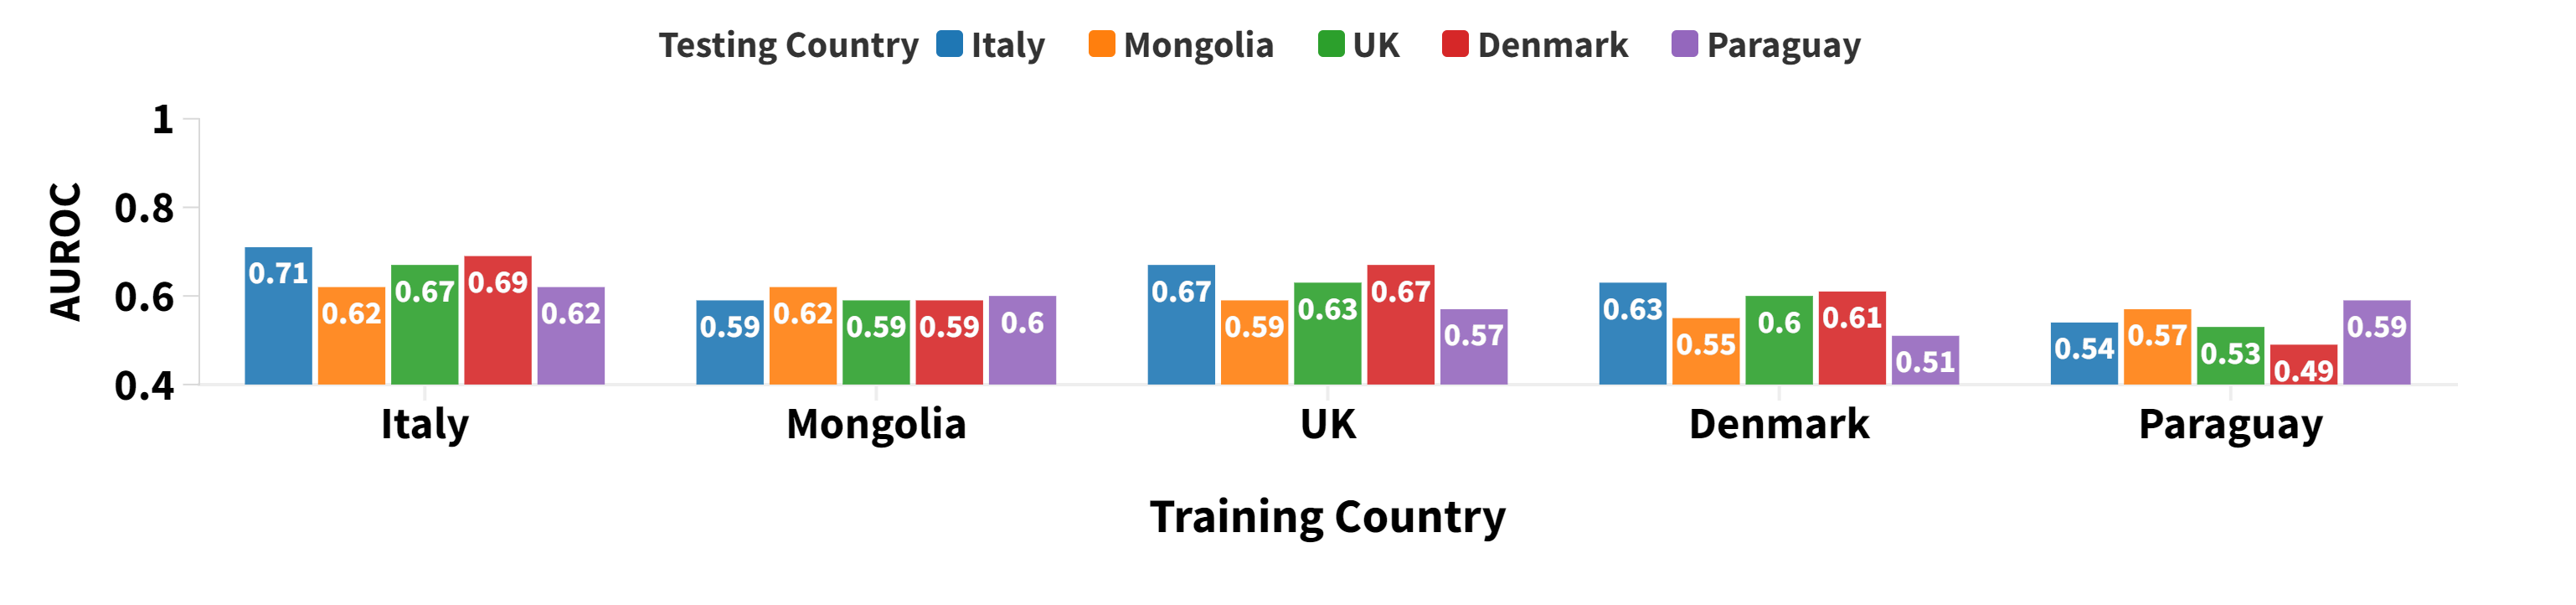
Mean AUROC scores obtained in the country-agnostic approach with population-level models.
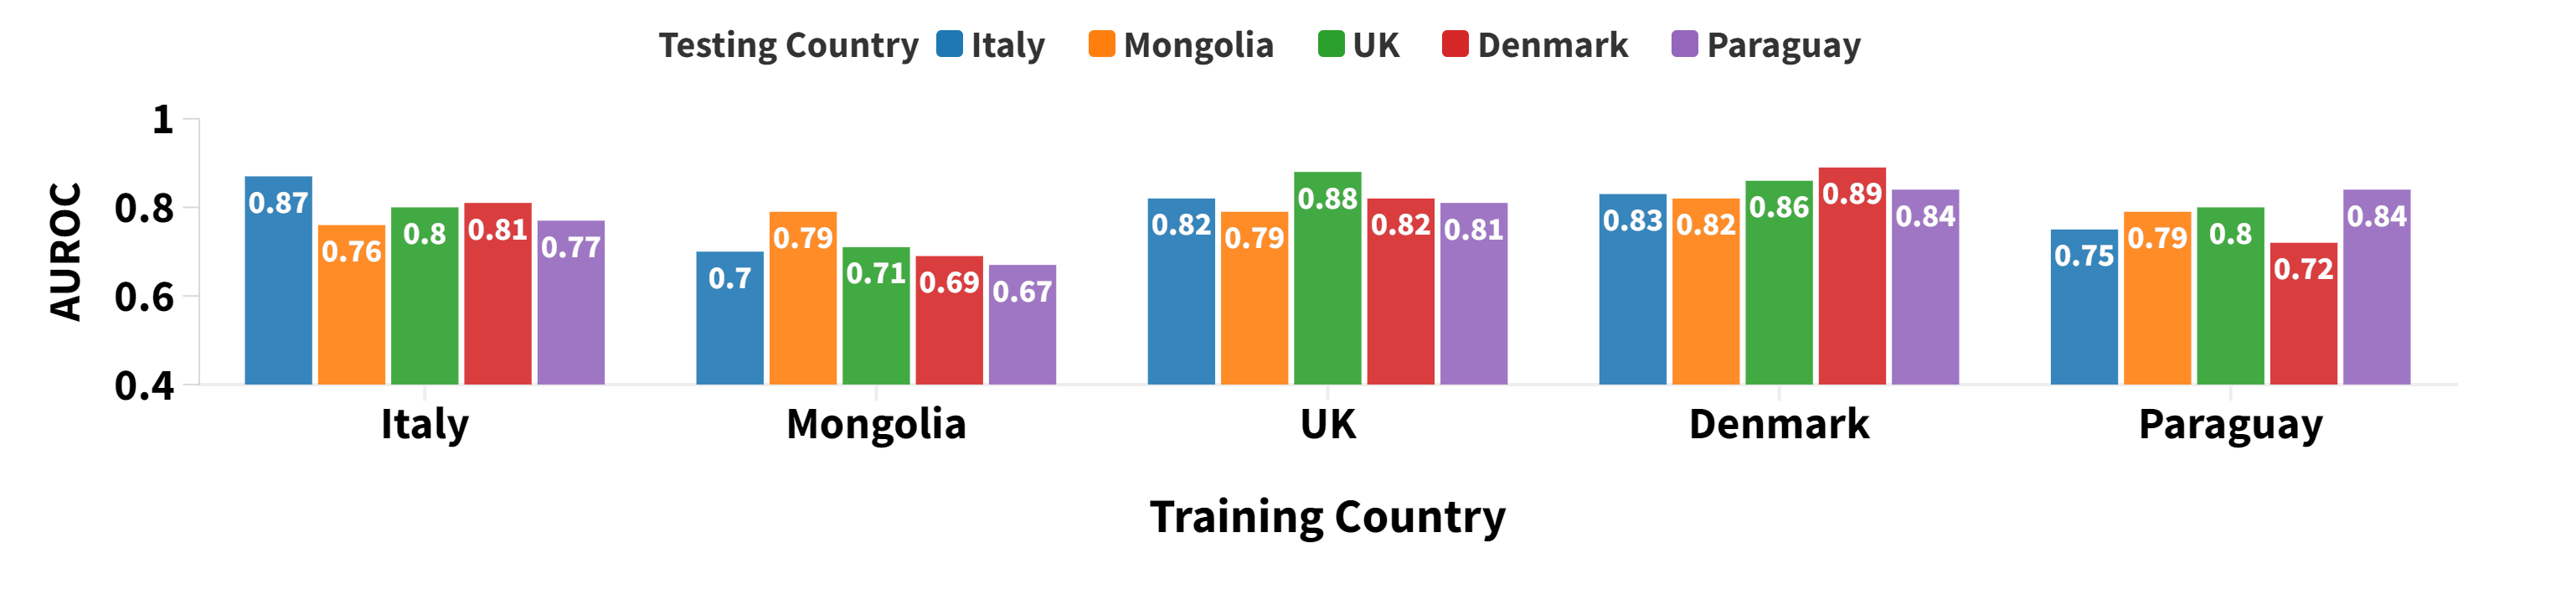
Mean AUROC scores obtained in the country-agnostic approach with hybrid models.
-
•
Phase I: Figure 8 summarizes results for population-level models and Figure 9 summarizes results for hybrid models. To allow easy comparison, in both figures, the result mentioned as the performance of a country, when tested on the same country is the result from Table 5. For instance, at the population-level, Italy had an AUROC of 0.71 according to Table 5, and this is marked in Figure 8 where both Training and Testing country is Italy. Population-level results suggest that the country-agnostic approach tends to perform better in countries geographically close to the country where the model was originally trained. For example, the Italy model had an AUROC of 0.71 for the Italian populations in a population-level setting and performed better in Denmark (AUROC: 0.69) and the UK (AUROC: 0.67) than it did in Mongolia (AUROC: 0.62) or Paraguay (AUROC: 0.62). Similar results can also be observed for hybrid models, where the Italian model performed better in Denmark and UK. This observation suggests that college students from countries within the same geographic region (Europe) could have behaviors that translate to similar smartphone usage and contexts during periods of doing similar activities. This is consistent with the observations made in the descriptive analysis above, where the countries that deviate from the general trends are usually those outside Europe. In summary, even after using the same experimental protocol when collecting mobile sensing data, we could still observe a distribution shift of data by the performance of models across geographically distant countries.
-
•
Phase II: The second phase looked into extending the work done in phase I. Instead of testing a country-specific model in a new country, we were interested in testing a model already exposed to diverse data (e.g., from four countries) in a new country. We present results for random forest models (because they performed the best across experiments) where the training set consisted of data from four countries, and the testing set had data from the fifth. As suggested in prior studies (Khwaja et al., 2019), each country contributed equally to the training set in terms of data volume, which means we had to downsample the data from each country to a common count (which was equal to the minimum number of data points available from one country). Table 6 presents the results for experiments of the second phase. Similar to previous cases, we observed an increase in performance from population-level to hybrid models. More generally, and by looking at the F1 and AUROC scores, the performance of the hybrid models in the country-agnostic approach is lower than that of the same model in the country-specific approach. This is somewhat expected since including data from other distributions (i.e., other countries) in the training set increases the data’s variance and makes it more difficult to represent all distributions accurately. This drop in performance could also be due to the downsampling. For instance, in a model where we train with four countries, including Italy and Paraguay, Italy represents the largest portion of the dataset compared to Paraguay, which is the smallest. When reducing the number of samples in each country to that of Paraguay, a lot of information is lost in the other countries: the larger the original dataset is, the larger the loss gets. This could explain the low performance of country-agnostic models in Italy and Mongolia, especially in the hybrid setting.
In addition, when comparing different modeling approaches, the results with Multi-Country w/o Downsampling are similar to those found in Phase II (hybrid) of the country-agnostic approach, which was expected since the training sets are similar. However, the bump in performance when going from population-level to hybrid is less noticeable here compared to previous cases. Furthermore, MC w/ DS performs worse than the previous approach, with an AUROC of 0.68 compared to 0.71. This could be because we lose much data from many countries due to downsampling, reducing models’ representational ability. To summarize, a hybrid model in a country-agnostic approach can not predict complex activities better than its country-specific counterpart. Furthermore, while more data often means better performances, this does not apply when the data follow different distributions, one per country in this case. This suggests that each country has specific characteristics that make learning one representation difficult.
These results shed light on our RQ3: complex activity recognition models trained in specific countries often generalize reasonably to other countries (especially with hybrid models). However, the performance is not comparable to the country-specific approach, suggesting that there is still a distributional shift between countries. In fact, in Section 4, we discussed how the labels used in the inference (i.e., shown in Figure 4–complex daily activities such as resting, studying, reading, etc.) had different distributions across the five countries. Further, the extent of the generalization often depended on whether countries are geographically closer (i.e., within Europe) or not. This result is in line with findings from previous studies (Phan et al., 2022; Khwaja et al., 2019) that highlighted the effect of geographic dimensions (i.e., country of data collection) on mobile sensing model performance. For example, (Khwaja et al., 2019) found that country-specific models that used mobile sensing data as input, could perform well for the inference of three personality traits–Extraversion, Agreeableness, and Conscientiousness. Furthermore, we would also like to highlight that the issue regarding distributional shifts and generalization is an open problem in multimodal mobile sensing, as highlighted by two recent studies that examined similar datasets collected from the same country in different time periods (Xu et al., 2023; Adler et al., 2022). This is possibly due to behavioral changes over time leading to different distributions in sensor data and ground truth. Our results go beyond this and show that even if data is collected within the same time period and with the same protocol, distributional shifts could still occur due to country differences.
| Population-Level | Hybrid | |||
| Test Country | F1 | AUROC | F1 | AUROC |
| Italy | 0.33 (0.005) | 0.65 (0.006) | 0.37 (0.004) | 0.71 (0.002) |
| Mongolia | 0.30 (0.011) | 0.60 (0.004) | 0.37 (0.006) | 0.67 (0.003) |
| UK | 0.29 (0.004) | 0.63 (0.005) | 0.47 (0.004) | 0.78 (0.002) |
| Denmark | 0.38 (0.006) | 0.65 (0.006) | 0.63 (0.008) | 0.86 (0.004) |
| Paraguay | 0.28 (0.005) | 0.59 (0.006) | 0.55 (0.006) | 0.80 (0.008) |
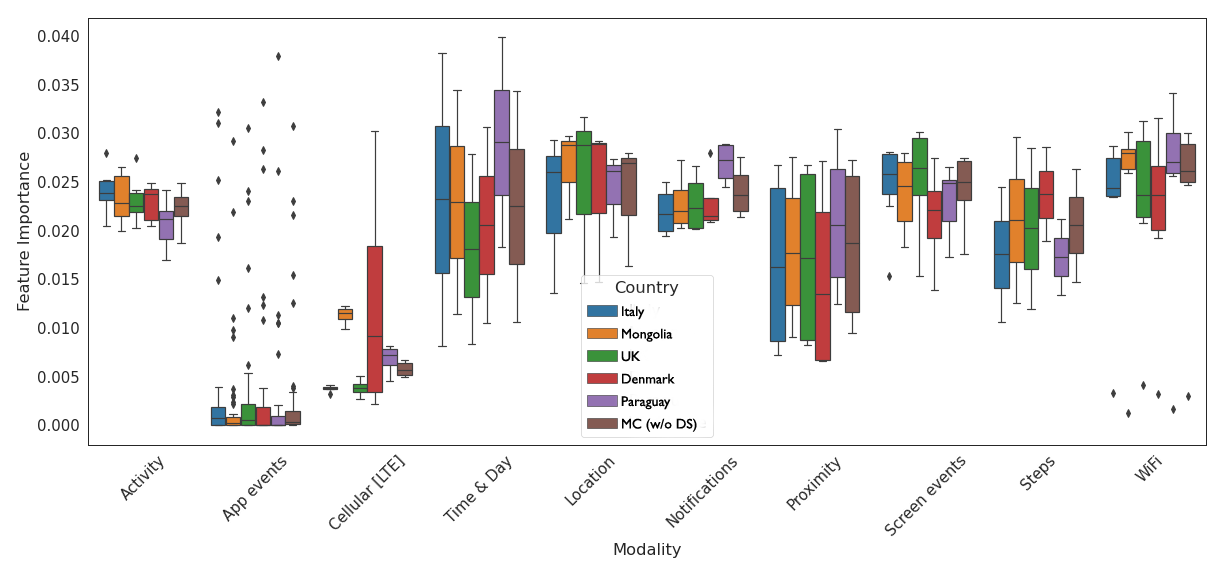
Feature importance of each feature category for hybrid country-specific and multi-country models. These values were obtained using random forest classifiers.
6.3. Feature Importance for Complex Daily Activity Recognition
The random forest models trained in our experiments inherently provide the Gini importance of the features seen during training (Breiman, 1998). In Figure 10, each set of box plots represents the distribution of feature importances for a given modality (as defined in Table 3) for hybrid models under the country-specific approach and multi-country approach (MC w/o DS). A first look shows that the multi-country distribution deviates from other countries for all sensing modalities. For example, one cellular feature in the model from Denmark is more important than the other models’ cellular features. The temporal, WiFi and notification features are more important in Paraguay than in other countries. App events are mostly unimportant, except for a few outliers across all countries. This is reasonable given that out of the long list of app types used for the analysis, participants frequently used only a few types (e.g., entertainment, social, educational, health and fitness, etc.). Our analysis showed that the outliers here are, in fact, the apps used by participants the most. By looking at the top whiskers of each set of box plots, the most predictive features overall are part of the following modalities: time & day, wifi, app usage, simple activity type, and location.
7. Discussion
7.1. Summary of Results
We examined a multi-country smartphone sensing dataset to develop inference models of complex daily activities. Our primary goal was to seek whether reasonably performing complex daily activity recognition models could be trained using multimodal sensor data from smartphones. Then, our goal was to identify differences among countries visible through smartphone usage and to leverage these differences to decide whether it makes sense to build country-specific or generic multi-country models, and whether models generalize well. We believe these findings are important when designing and deploying sensing and ML-based apps and systems in geographically diverse settings. The main findings for the three research questions can be summarized as follows:
-
•
RQ1: Different features in each country can characterize an activity. Their distributions throughout the day also vary between countries and seem to be affected. This finding points towards biases that could get propagated if proper care is not taken during the design and data collection phase of studies involving people and smartphones. In Section 7.2.1, we discuss this in more detail under a set of biases: construct bias (He and van de Vijver, 2012), sample bias (Meegahapola and Gatica-Perez, 2020), device-type bias (Blunck et al., 2013), and bias from user practices (Van de Vijver and Tanzer, 2004).
-
•
RQ2: It is feasible to train models with the country-specific approach to infer 12 complex activities from smartphone data. Furthermore, personalization within countries increases performance (AUROCs of the range 0.79-0.89). Hence, the country-specific approach outperforms the multi-country approach, which only yields an AUROC of 0.71 with hybrid models. However, building multi-country models solely from sensing features is a non-trivial task that might require more effort with regard to data balance and feature selection. Our results also show that the sedentary lifestyles of the pandemic world can be captured with country-specific partially personalized machine learning models. In addition, we also show that multimodal smartphone sensors could be used to recognize complex daily activities that go beyond binary inferences to 12-class inferences. In Section 7.2.2, we discuss why real-life studies are important to capture complex emerging lifestyles; in Section 7.2.3, we also discuss how complex daily activities could be useful to design novel context-aware applications.
-
•
RQ3: Under the country-agnostic approach, we found that models generalize reasonably to new countries. However, unsurprisingly, the performance is not as high as when the model was tested in the same country where it was trained. Interestingly, models trained in European countries performed better in other European countries than in Paraguay or Mongolia. This issue broadly falls under the topic of domain shifts, which remains under-explored in mobile sensing literature. We elaborate more on this in Section 7.2.4.
7.2. Implications
Our work has implications aligned to both theoretical and practical aspects.
7.2.1. Accounting for Country Biases in Study Design (RQ1).
Studies using sensing data drawn from geographically diverse samples (i.e., different countries) should account for and understand the sources of biases that can occur at different stages of the study. Our study, and also previous studies on human behavior, sociology, and psychology, allow an understanding of these aspects in detail. For example, the following taxonomy can be used to characterize such biases (Phan et al., 2022). (i) Construct bias occurs when the target is expressed differently across countries, depending on countries’ norms or environmental factors (He and van de Vijver, 2012). For example, the “walking” activity in one country where physical exercise is not widespread could be labeled as “walking”, whereas in a country where it is an activity done for fitness by many people, so it could be labeled as a “sport” as well. Hence, some behaviors can be specific to a particular environment or group of people. (ii) Sample bias concerns the comparability of diverse samples that can be impacted by the recruitment process in each country (Meegahapola and Gatica-Perez, 2020). For example, if the samples in each country differ in age or gender, sensing data would likely not have similar distributions across countries. (iii) Device-type bias is due to the differences in the devices used by participants across countries and in environmental factors affecting sensor measurements (Blunck et al., 2013). Devices worldwide are not equipped with the same software and hardware, and similar sensors can differ in accuracy and precision (e.g., Apple devices are more prominent in developed countries, whereas Android phones are common in others). Finally, the (iv) bias from user practices arises when participants from different countries use their mobile phones differently (Van de Vijver and Tanzer, 2004). Examples abound: how a phone is physically carried could distort measurements; how sensors are disabled to save battery or mobile data (especially in countries where unlimited mobile data plans are not standard) also changes what is measured; and different motivations to use certain apps in different countries also changes the resulting logs (Lim et al., 2014). Phan et al. (Phan et al., 2022) have proposed a set of mitigation strategies that aim to reduce biases and foster fair approaches to diversity-aware research. To achieve these objectives, the authors recommend taking several steps during both the planning and implementation phases of the study. During the planning phase, researchers are advised to acquire knowledge about potential cross-country differences and relevant environmental factors, with the assistance of local informants. Furthermore, researchers should ensure that their study targets are comparable across countries and that they exist in each country being studied. In the implementation phase, the authors suggest inclusive recruitment strategies that aim to make each sampled country representative of a given target. These recommended strategies are important in promoting diversity-aware research and mitigating the potential for biases that can skew results.
7.2.2. Activities Captured in Real-Life Studies (RQ2).
In terms of theoretical implications, it is worth highlighting that the set of activities that we considered are complex behaviors that can not be typically captured during in-lab studies. Fine-grained sensing-based activity recognition studies help increase performance on simple activities (e.g., walking, running, sitting, climbing stairs, etc. — that have a repetitive nature in sensor data) that can be captured in in-lab settings. In contrast, building sensing-based ML models to capture complex daily behaviors requires conducting real-life studies. Activities like studying, attending classes, or shopping is hard to replicate in lab settings. Further, while simple activities might not have led to differences in model performances across countries, complex daily activities tightly bound with cultural, country-level, or geographic norms lead to differences in behaviors, leading to differences in the sensed data. In this context, prior work in the domain has not focused on this aspect enough, in our view. Even more so, we believe that studies must capture data from diverse communities to build models that work for all intended users. While this is a challenging task, it is much needed for the field of research to mature for more real-life use cases. Our study is one of the first studies in this direction.
7.2.3. Novel Applications of Context-Aware Mobile Apps (RQ2).
In terms of practical implications, our findings point towards adding context awareness to mobile applications. Current mobile applications provide context-aware services, interventions, and notifications based on location and simple activity sensing (Mehrotra and Musolesi, 2017; Meegahapola and Gatica-Perez, 2020). However, a range of potential applications that go beyond the current offering could become feasible with complex daily activity recognition. For example, previously, a smartphone would only know that a user was sitting in a particular place. With complex activity recognition, it would know that a user is studying, attending a lecture, reading, or eating, which all entail sitting. For example, if the student is reading, studying, or attending a lecture, automatically putting the phone in silent or do-not-disturb mode might make sense, even though, in many cases, people forget to do so. In summary, complex daily activity recognition could offer diverse use cases to build mobile applications around in the future.
7.2.4. Domain Adaptation for Multimodal Mobile Sensing (RQ3).
Another theoretical implication can be described in a machine learning sense. We discussed the challenges of generalization and domain shifts in our smartphone sensor dataset. We described how this shift affects model performance, specifically for complex daily activity recognition with multimodal sensors. Although biases, distributional shifts, and model generalization have been widely studied in other domains such as natural language processing (Elsahar and Gallé, 2019), speech (Sun et al., 2017), and computer vision (Luo et al., 2019), smartphone sensing studies have yet to receive sufficient attention (Gong et al., 2021). We demonstrated that model personalization (hybrid setting) could reduce distributional shifts to a certain extent. In a way, according to transfer learning-related terms, this approach is similar to fine-tuning an already trained model for a specific user to achieve model personalization (Chen et al., 2020). Such strategies for personalization have been used in prior work (Meegahapola et al., 2021b). However, recent research in domain adaptation has shown limitations in mobile sensing, particularly with regard to time series data (Wilson et al., 2022). The diversity of wearable device positioning poses a persistent issue in human activity recognition, which affects the performance of recognition models (Chang et al., 2020; Mathur et al., 2019). Wilson et al. (Wilson et al., 2022) conducted a study of domain adaptation in datasets captured from individuals of different age groups, yet the findings are limited to simpler time series accelerometer data. Other works admit that the current lack of solutions for domain adaptation and generalization from smartphone and wearable data presents an opportunity for future exploration (Adler et al., 2022; Xu et al., 2023). We have added to the literature by confirming that domain adaptation techniques are necessary for multi-country, multimodal smartphone sensor data. In addition, even on a fundamental level, approaches that allow quantifying cross-dataset distributional differences for multimodal sensing features and target labels (e.g., activity, mood, social context, etc.) separately, are lacking in the domain. Research on such aspects could allow us to better understand distributional shifts in sensor data, to better counter it with domain adaptation techniques in multimodal settings.
7.3. Limitations
While the dataset covers five different countries from three continents, students’ behavior in other countries and continents could differ from what we have already encountered. In addition, even though we found geographically closer countries performing well in Europe, such findings need to be confirmed for other regions where geographically closer countries could have contrasting behaviors and norms (e.g., India and China). Furthermore, the weather conditions in different countries during the time period of data collection could be slightly different. All five countries mentioned in this study go through different seasons, as all are somewhat far from the equator. Hence, we could expect changes in features in different seasons. However, in practical terms, collecting data in similar weather conditions is not feasible.
When aggregating sensor data around self-reports, the data corresponding to the moment the participant was filling out the self-report is considered a part of the activity he/she was doing at the time. This noise could alter the recognition task if the window’s size is small enough. However, even though this could affect results if we intended to increase model performance in a fine-grained sensing task, we do not believe this noise affects the results significantly regarding our findings on diversity awareness. In addition, it is worth noting that the way we model our approach with a tabular dataset is similar to prior ubicomp/mobile sensing studies done in real life (Meegahapola and Gatica-Perez, 2020) because we do not have continuous ground truth labels. Hence, it restrains us from modeling the task as a time-series problem, which is how a majority of activity recognition studies (Straczkiewicz et al., 2021b) with continuous accurate ground truth measurements follow. So, the results should be interpreted with the study’s exploratory nature in mind.
Further, it is worth noting that we could expect some of the highly informative features used in models to change over time, with changes to technology use and habits of people, in different countries (Xu et al., 2023; Adler et al., 2022). For example, a reason for the lack of use of streaming services in certain countries (discussed in Section 4) is the lack of laws surrounding the usage of illegally downloaded content (e.g., Germany has strict laws about not using illegal downloads (Rump, 2011)). Changes in the laws of countries could change the behavior of young adults. Further, internet prices could also affect the use of streaming services. While bandwidth-based and cheap internet is common in developed countries, it is not the same in developing nations in Asia, Africa, and South America, where internet usage is expensive, hence demotivating streaming. In addition, income levels too could influence captured features a lot. For example, with increasing income levels (usually happens when a country’s GDP changes), young adults may use more wearables for fitness tracking, leading to the usage of health and fitness apps on mobile phones.
The amount of data for each country is highly imbalanced. For a fair representation of each country, having the same number of participants and self-reports per country would ensure that a classifier learns to distinguish classes from each country equally. However, Italy and Mongolia are dominant in the current state of the dataset. If not done carefully, down-sampling would result in a loss of expressiveness and variance, making it difficult to discern different classes in a multi-country approach. Another imbalance is found among class labels, where activities such as sleeping or studying are more frequent than others. However, this does make sense since we do not expect all activities to appear at the same frequency in a participant’s day or week. Further, we reported F1 and AUROC scores that are preferred in such imbalanced settings.
Finally, the dataset was collected in November 2020, during the Covid-19 pandemic, when most students stayed home due to work/study-from-home restrictions. This explains why most of the relevant features found in the statistical analysis are screen events and app events. While some relevant features are relative to proximity and WiFi sensors, there are very few regarding activity and location unless the activity corresponds to physical activities. This is probably an effect of a context where movements were highly discouraged. From another perspective, the behavior of college students from all countries during this time period reflects remote work or study arrangements. We could expect these practices to continue for years as more universities and companies adopt remote work/study culture. Hence, while many prior studies in ubicomp used phone usage features and sensing features for activity/behavior/psychological trait inference tasks, our findings indicate that phone usage features could be even more critical in the future with remote study/work settings due to sedentary behavior, that would limit the informativeness of sensors such as location and inertial sensors.
7.4. Future Work
The study’s population for the dataset collection consisted of students. Therefore, it might be worth exploring how people from different age groups use their smartphones and how their daily behavior is expressed through that usage. In addition to visible diversity, it is known that deep diversity attributes (innate to humans and not visible) such as personality (captured with Big Five Inventory (Donnellan et al., 2006)), values (captured with basic values survey (Gouveia et al., 2014) and human values survey (Schwartz, 1994; Schwartz et al., 2001)), and intelligence (captured with multiple intelligence scale (Tirri and Nokelainen, 2008)) could also affect smartphone sensor data and activities performed by people (Schelenz et al., 2021b; Khwaja et al., 2019). Hence, investigating how such diversity attributes could affect smartphone-based inference models on complex activities, and other target variables, is worth investigating. Further, future work could investigate how the classification performance is affected when excluding the sensing data corresponding to the time taken to fill the self-report about activities by participants. Finally, domain adaptation for multi-modal smartphone sensor data across time and countries, remains an important problem worth investigating in future work.
8. Conclusion
In this study, we examined the daily behavior of 637 students in Italy, Mongolia, the United Kingdom, Denmark, and Paraguay using over 216K self-reports and passive sensing data collected from their smartphones. The main goal of this study was to, first examine whether multimodal smartphone sensor data could be used to infer complex daily activities, which in turn would be useful for context-aware applications. Then, to examine whether models generalize well to different countries. We have a few primary findings: (i) While each country has its day distribution of activities, we can observe similarities between the geographically closer countries in Europe. Moreover, features such as the time of the day or the week, screen events, and app usage events are indicative of most daily activities; (ii) 12 complex daily activities can be recognized in a country-specific and personalized setting, using passive sensing features with reasonable performance. However, extending this to a multi-country model does not perform well, compared to the country-specific setting; and (iii) Models do not generalize well to other countries (at least compared to within-country performance), and especially to geographically distant ones. More studies are needed along these lines regarding complex daily activity recognition and also other target variables (e.g., mood, stress, fatigue, eating behavior, drinking behavior, social context inference, etc.), to confirm the findings. Hence, we believe research around geographic diversity awareness is fundamental for advancing mobile sensing and human behavior understanding for more real-world utility across diverse countries. From a study design sense, we advocate the idea of collecting data from diverse regions and populations to build better-represented machine learning models. From a machine learning sense, we advocate the idea of developing domain adaptation techniques to better handle multimodal mobile sensing data collected from diverse countries.
Acknowledgements.
This work was funded by the European Union’s Horizon 2020 WeNet project, under grant agreement 823783. We deeply thank all the volunteers across the world for their participation in the study.References
- (1)
- Adler et al. (2022) Daniel A Adler, Fei Wang, David C Mohr, and Tanzeem Choudhury. 2022. Machine learning for passive mental health symptom prediction: Generalization across different longitudinal mobile sensing studies. Plos one 17, 4 (2022), e0266516.
- Alsaleh et al. (2019) Dhoha A Alsaleh, Michael T Elliott, Frank Q Fu, and Ramendra Thakur. 2019. Cross-cultural differences in the adoption of social media. Journal of Research in Interactive Marketing (2019).
- Althoff et al. (2017) Tim Althoff, Rok Sosič, Jennifer L Hicks, Abby C King, Scott L Delp, and Jure Leskovec. 2017. Large-scale physical activity data reveal worldwide activity inequality. Nature 547, 7663 (2017), 336–339.
- Avilés-Cruz et al. (2019) Carlos Avilés-Cruz, Andrés Ferreyra-Ramírez, Arturo Zúñiga-López, and Juan Villegas-Cortéz. 2019. Coarse-Fine Convolutional Deep-Learning Strategy for Human Activity Recognition. Sensors 19, 7 (March 2019), 1556. https://doi.org/10.3390/s19071556
- Bae et al. (2017a) Sangwon Bae, Denzil Ferreira, Brian Suffoletto, Juan C Puyana, Ryan Kurtz, Tammy Chung, and Anind K Dey. 2017a. Detecting drinking episodes in young adults using smartphone-based sensors. Proceedings of the ACM on Interactive, Mobile, Wearable and Ubiquitous Technologies 1, 2 (2017), 1–36.
- Bae et al. (2017b) Sangwon Bae, Denzil Ferreira, Brian Suffoletto, Juan C. Puyana, Ryan Kurtz, Tammy Chung, and Anind K. Dey. 2017b. Detecting Drinking Episodes in Young Adults Using Smartphone-based Sensors. Proceedings of the ACM on Interactive, Mobile, Wearable and Ubiquitous Technologies 1, 2 (June 2017), 1–36. https://doi.org/10.1145/3090051
- Bao and Intille (2004) Ling Bao and Stephen S. Intille. 2004. Activity Recognition from User-Annotated Acceleration Data. In Pervasive Computing, Alois Ferscha and Friedemann Mattern (Eds.). Springer Berlin Heidelberg, Berlin, Heidelberg, 1–17.
- Baron and af Segerstad (2010) Naomi S. Baron and Ylva Hård af Segerstad. 2010. Cross-cultural patterns in mobile-phone use: public space and reachability in Sweden, the USA and Japan. New Media & Society 12, 1 (2010), 13–34. https://doi.org/10.1177/1461444809355111 arXiv:https://doi.org/10.1177/1461444809355111
- Biel et al. (2018) Joan-Isaac Biel, Nathalie Martin, David Labbe, and Daniel Gatica-Perez. 2018. Bites’n’Bits: Inferring Eating Behavior from Contextual Mobile Data. Proceedings of the ACM on Interactive, Mobile, Wearable and Ubiquitous Technologies 1, 4 (Jan. 2018), 1–33. https://doi.org/10.1145/3161161
- Blanke and Schiele (2009) Ulf Blanke and Bernt Schiele. 2009. Daily Routine Recognition through Activity Spotting. In Location and Context Awareness, Tanzeem Choudhury, Aaron Quigley, Thomas Strang, and Koji Suginuma (Eds.). Vol. 5561. Springer Berlin Heidelberg, Berlin, Heidelberg, 192–206. https://doi.org/10.1007/978-3-642-01721-6_12 Series Title: Lecture Notes in Computer Science.
- Blunck et al. (2013) Henrik Blunck, Niels Olof Bouvin, Tobias Franke, Kaj Grønbæk, Mikkel B Kjaergaard, Paul Lukowicz, and Markus Wüstenberg. 2013. On heterogeneity in mobile sensing applications aiming at representative data collection. In Proceedings of the 2013 ACM conference on Pervasive and ubiquitous computing adjunct publication. 1087–1098.
- Bouton-Bessac et al. (2022) Emma Bouton-Bessac, Lakmal Meegahapola, and Daniel Gatica-Perez. 2022. Your Day in Your Pocket: Complex Activity Recognition from Smartphone Accelerometers. Proceedings of the 16th EAI International Conference on Pervasive Computing Technologies for Healthcare (PervasiveHealth) (2022).
- Breiman (1998) Leo Breiman (Ed.). 1998. Classification and regression trees (1. crc press repr ed.). Chapman & Hall/CRC, Boca Raton, Fla.
- Breiman (2001) Leo Breiman. 2001. Random Forests. Machine Learning 45, 1 (2001), 5–32. https://doi.org/10.1023/A:1010933404324
- Canton (2012) Naomi Canton. 2012. Cell phone culture: How cultural differences affect mobile use. https://edition.cnn.com/2012/09/27/tech/mobile-culture-usage/index.html
- Canzian and Musolesi (2015) Luca Canzian and Mirco Musolesi. 2015. Trajectories of depression: unobtrusive monitoring of depressive states by means of smartphone mobility traces analysis. In Proceedings of the 2015 ACM international joint conference on pervasive and ubiquitous computing. 1293–1304.
- Center (2021) Pew Research Center. 2021. Mobile Fact Sheet. https://www.pewresearch.org/internet/fact-sheet/mobile/
- Centre (2017) Pew Research Centre. 2017. Adapt your app by understanding what users are doing. Retrieved December 12, 2022 from https://www.pewresearch.org/fact-tank/2017/09/13/about-6-in-10-young-adults-in-u-s-primarily-use-online-streaming-to-watch-tv/
- Chang et al. (2020) Youngjae Chang, Akhil Mathur, Anton Isopoussu, Junehwa Song, and Fahim Kawsar. 2020. A systematic study of unsupervised domain adaptation for robust human-activity recognition. Proceedings of the ACM on Interactive, Mobile, Wearable and Ubiquitous Technologies 4, 1 (2020), 1–30.
- Chen et al. (2020) Yiqiang Chen, Xin Qin, Jindong Wang, Chaohui Yu, and Wen Gao. 2020. Fedhealth: A federated transfer learning framework for wearable healthcare. IEEE Intelligent Systems 35, 4 (2020), 83–93.
- Chiva (1997) Matty Chiva. 1997. Cultural aspects of meals and meal frequency. British Journal of Nutrition 77, S1 (1997), S21–S28.
- Chollet et al. (2015) François Chollet et al. 2015. Keras. https://keras.io.
- Choudhury et al. (2008) Tanzeem Choudhury, Gaetano Borriello, Sunny Consolvo, Dirk Haehnel, Beverly Harrison, Bruce Hemingway, Jeffrey Hightower, Predrag "Pedja" Klasnja, Karl Koscher, Anthony LaMarca, James A. Landay, Louis LeGrand, Jonathan Lester, Ali Rahimi, Adam Rea, and Danny Wyatt. 2008. The Mobile Sensing Platform: An Embedded Activity Recognition System. IEEE Pervasive Computing 7, 2 (April 2008), 32–41. https://doi.org/10.1109/MPRV.2008.39
- Cobian et al. (2013) Daniel G Cobian, Nicole S Daehn, Paul A Anderson, and Bryan C Heiderscheit. 2013. Active cervical and lumbar range of motion during performance of activities of daily living in healthy young adults. Spine 38, 20 (2013), 1754–1763.
- Coorevits and Coenen (2016) Lynn Coorevits and Tanguy Coenen. 2016. The rise and fall of wearable fitness trackers. Academy of Management Proceedings 2016, 1 (Jan. 2016), 17305. https://doi.org/10.5465/ambpp.2016.17305abstract
- Cornet and Holden (2018) Victor P Cornet and Richard J Holden. 2018. Systematic review of smartphone-based passive sensing for health and wellbeing. Journal of biomedical informatics 77 (2018), 120–132.
- Cultures (2022) AI Cultures. 2022. Neurips 2022 workshop on AI Cultures. Retrieved February 12, 2023 from https://ai-cultures.github.io/
- Cuthbertson (2019) Anthony Cuthbertson. 2019. Self-driving cars are be more likely to drive into black people, study claims. https://www.independent.co.uk/life-style/gadgets-and-tech/news/self-driving-car-crash-racial-bias-black-people-study-a8810031.html
- Das Swain et al. (2022) Vedant Das Swain, Victor Chen, Shrija Mishra, Stephen M Mattingly, Gregory D Abowd, and Munmun De Choudhury. 2022. Semantic Gap in Predicting Mental Wellbeing through Passive Sensing. In CHI Conference on Human Factors in Computing Systems. 1–16.
- de Montjoye et al. (2015) Yves-Alexandre de Montjoye, Laura Radaelli, Vivek Kumar Singh, and Alex “Sandy” Pentland. 2015. Unique in the shopping mall: On the reidentifiability of credit card metadata. Science 347, 6221 (2015), 536–539. https://doi.org/10.1126/science.1256297 arXiv:https://www.science.org/doi/pdf/10.1126/science.1256297
- Del Rosario et al. (2014) Michael B Del Rosario, Kejia Wang, Jingjing Wang, Ying Liu, Matthew Brodie, Kim Delbaere, Nigel H Lovell, Stephen R Lord, and Stephen J Redmond. 2014. A comparison of activity classification in younger and older cohorts using a smartphone. Physiological Measurement 35, 11 (Nov. 2014), 2269–2286. https://doi.org/10.1088/0967-3334/35/11/2269
- Deng et al. (2018) Chengbin Deng, Weiying Lin, Xinyue Ye, Zhenlong Li, Ziang Zhang, and Ganggang Xu. 2018. Social media data as a proxy for hourly fine-scale electric power consumption estimation. Environment and Planning A: Economy and Space 50, 8 (2018), 1553–1557.
- Dernbach et al. (2012) Stefan Dernbach, Barnan Das, Narayanan C. Krishnan, Brian L. Thomas, and Diane J. Cook. 2012. Simple and Complex Activity Recognition through Smart Phones. In 2012 Eighth International Conference on Intelligent Environments. IEEE, Guanajuato, Mexico, 214–221. https://doi.org/10.1109/IE.2012.39
- Donnellan et al. (2006) M Brent Donnellan, Frederick L Oswald, Brendan M Baird, and Richard E Lucas. 2006. The mini-IPIP scales: tiny-yet-effective measures of the Big Five factors of personality. Psychological assessment 18, 2 (2006), 192.
- Eagle and (Sandy) Pentland (2006) Nathan Eagle and Alex (Sandy) Pentland. 2006. Reality mining: sensing complex social systems. Personal and Ubiquitous Computing 10, 4 (May 2006), 255–268. https://doi.org/10.1007/s00779-005-0046-3
- Elsahar and Gallé (2019) Hady Elsahar and Matthias Gallé. 2019. To annotate or not? predicting performance drop under domain shift. In Proceedings of the 2019 Conference on Empirical Methods in Natural Language Processing and the 9th International Joint Conference on Natural Language Processing (EMNLP-IJCNLP). 2163–2173.
- Esteban Ortiz-Ospina and Roser (2020) Charlie Giattino Esteban Ortiz-Ospina and Max Roser. 2020. Time Use. Our World in Data (2020).
- Farringdon et al. (1999) Jonny Farringdon, Andrewj Moore, Nancy Tilbury, James Church, and Pieter D. Biemond. 1999. Wearable Sensor Badge & Sensor Jacket for Context Awareness.
- Fisher and Robinson (2010) Kimberly Fisher and John Robinson. 2010. Daily routines in 22 countries diary evidence of average daily time spent in thirty activities. Technical Report. University of Oxford, Centre for Time Use Research. https://www.timeuse.org/sites/default/files/public/ctur_technical_paper/869/CTUR_Technical_Paper_2010-01.pdf
- Giunchiglia et al. (2017) Fausto Giunchiglia, Enrico Bignotti, and Mattia Zeni. 2017. Personal context modelling and annotation. In 2017 IEEE international conference on pervasive computing and communications workshops (PerCom workshops). IEEE, 117–122.
- Giunchiglia et al. (2022) Fausto Giunchiglia, Ivano Bison, Matteo Busso, Ronald Chenu-Abente, Marcelo Rodas, Mattia Zeni, Can Gunel, Giuseppe Veltri, Amalia De Götzen, Peter Kun, Amarsanaa Ganbold, Altangerel Chagnaa, George Gaskell, Sally Stares, Miriam Bidoglia, Luca Cernuzzi, Alethia Hume, Jose Luis Zarza, Hao Xu, Donglei Song, Shyam Diwakar, Chaitanya Nutakki, Salvador Ruiz Correa, Andrea-Rebeca Mendoza, Lakmal Meegahapola, and Daniel Gatica-Perez. 2022. A worldwide diversity pilot on daily routines and social practices (2020-2021). University of Trento Technical Report - DataScientia dataset descriptors. https://iris.unitn.it/handle/11572/338382.
- Gong et al. (2021) Taesik Gong, Yewon Kim, Adiba Orzikulova, Yunxin Liu, Sung Ju Hwang, Jinwoo Shin, and Sung-Ju Lee. 2021. DAPPER: Performance Estimation of Domain Adaptation in Mobile Sensing. arXiv preprint arXiv:2111.11053 (2021).
- Gong et al. (2019) Zhiqiang Gong, Ping Zhong, and Weidong Hu. 2019. Diversity in Machine Learning. IEEE Access 7 (2019), 64323–64350. https://doi.org/10.1109/ACCESS.2019.2917620
- Google (2022) Google. 2022. Adapt your app by understanding what users are doing. Retrieved February 12, 2022 from https://developers.google.com/location-context/activity-recognition
- Gouveia et al. (2014) Valdiney V Gouveia, Taciano L Milfont, and Valeschka M Guerra. 2014. Functional theory of human values: Testing its content and structure hypotheses. Personality and individual differences 60 (2014), 41–47.
- Hastie et al. (2009) Trevor Hastie, Saharon Rosset, Ji Zhu, and Hui Zou. 2009. Multi-class AdaBoost. Statistics and Its Interface 2, 3 (2009), 349–360. https://doi.org/10.4310/SII.2009.v2.n3.a8
- He and van de Vijver (2012) Jia He and Fons van de Vijver. 2012. Bias and equivalence in cross-cultural research. Online readings in psychology and culture 2, 2 (2012), 2307–0919.
- Henriksen et al. (2020) Ida Marie Henriksen, Marianne Skaar, and Aksel Tjora. 2020. The Constitutive Practices of Public Smartphone Use. Societies 10, 4 (2020). https://doi.org/10.3390/soc10040078
- Hoseini-Tabatabaei et al. (2013) Seyed Amir Hoseini-Tabatabaei, Alexander Gluhak, and Rahim Tafazolli. 2013. A survey on smartphone-based systems for opportunistic user context recognition. ACM Computing Surveys (CSUR) 45, 3 (2013), 1–51.
- Huynh et al. (2008) Tâm Huynh, Mario Fritz, and Bernt Schiele. 2008. Discovery of activity patterns using topic models. In Proceedings of the 10th international conference on Ubiquitous computing - UbiComp ’08. ACM Press, Seoul, Korea, 10. https://doi.org/10.1145/1409635.1409638
- Karkkainen and Joo (2021) Kimmo Karkkainen and Jungseock Joo. 2021. Fairface: Face attribute dataset for balanced race, gender, and age for bias measurement and mitigation. In Proceedings of the IEEE/CVF Winter Conference on Applications of Computer Vision. 1548–1558.
- Khwaja et al. (2019) Mohammed Khwaja, Sumer S. Vaid, Sara Zannone, Gabriella M. Harari, A. Aldo Faisal, and Aleksandar Matic. 2019. Modeling Personality vs. Modeling Personalidad: In-the-wild Mobile Data Analysis in Five Countries Suggests Cultural Impact on Personality Models. Proceedings of the ACM on Interactive, Mobile, Wearable and Ubiquitous Technologies 3, 3 (Sept. 2019), 1–24. https://doi.org/10.1145/3351246
- Kim (2014) Hae-Young Kim. 2014. Analysis of variance (ANOVA) comparing means of more than two groups. Restorative dentistry & endodontics 39, 1 (2014), 74–77.
- Laput and Harrison (2019a) Gierad Laput and Chris Harrison. 2019a. Sensing Fine-Grained Hand Activity with Smartwatches. In Proceedings of the 2019 CHI Conference on Human Factors in Computing Systems. ACM, Glasgow Scotland Uk, 1–13. https://doi.org/10.1145/3290605.3300568
- Laput and Harrison (2019b) Gierad Laput and Chris Harrison. 2019b. Sensing fine-grained hand activity with smartwatches. In Proceedings of the 2019 CHI Conference on Human Factors in Computing Systems. 1–13.
- Li et al. (2021) Tong Li, Mingyang Zhang, Yong Li, Eemil Lagerspetz, Sasu Tarkoma, and Pan Hui. 2021. The Impact of Covid-19 on Smartphone Usage. IEEE Internet of Things Journal 8, 23 (Dec. 2021), 16723–16733. https://doi.org/10.1109/JIOT.2021.3073864
- LiKamWa et al. (2013) Robert LiKamWa, Yunxin Liu, Nicholas D. Lane, and Lin Zhong. 2013. MoodScope: building a mood sensor from smartphone usage patterns. In Proceeding of the 11th annual international conference on Mobile systems, applications, and services - MobiSys ’13. ACM Press, Taipei, Taiwan, 389. https://doi.org/10.1145/2462456.2464449
- Lim et al. (2014) Soo Ling Lim, Peter J Bentley, Natalie Kanakam, Fuyuki Ishikawa, and Shinichi Honiden. 2014. Investigating country differences in mobile app user behavior and challenges for software engineering. IEEE Transactions on Software Engineering 41, 1 (2014), 40–64.
- Liu et al. (2021) Rex Liu, Albara Ah Ramli, Huanle Zhang, Erik Henricson, and Xin Liu. 2021. An Overview of Human Activity Recognition Using Wearable Sensors: Healthcare and Artificial Intelligence. arXiv:2103.15990 [cs, eess] (Aug. 2021). http://arxiv.org/abs/2103.15990 arXiv: 2103.15990.
- Liu et al. (2022) Tiffany Liu, Javier Hernandez, Mar Gonzalez-Franco, Antonella Maselli, Melanie Kneisel, Adam Glass, Jarnail Chudge, and Amos Miller. 2022. Characterizing and Predicting Engagement of Blind and Low-Vision People with an Audio-Based Navigation App. In Extended Abstracts of the 2022 CHI Conference on Human Factors in Computing Systems (New Orleans, LA, USA) (CHI EA ’22). Association for Computing Machinery, New York, NY, USA, Article 411, 7 pages. https://doi.org/10.1145/3491101.3519862
- Lopez-Fernandez et al. (2017) Olatz Lopez-Fernandez, Daria J. Kuss, Lucia Romo, Yannick Morvan, Laurence Kern, Pierluigi Graziani, Amélie Rousseau, Hans-Jürgen Rumpf, Anja Bischof, Ann-Kathrin Gässler, Adriano Schimmenti, Alessia Passanisi, Niko Männikkö, Maria Kääriänen, Zsolt Demetrovics, Orsolya Király, Mariano Chóliz, Juan José Zacarés, Emilia Serra, Mark D. Griffiths, Halley M. Pontes, Bernadeta Lelonek-Kuleta, Joanna Chwaszcz, Daniele Zullino, Lucien Rochat, Sophia Achab, and Joël Billieux. 2017. Self-reported dependence on mobile phones in young adults: A European cross-cultural empirical survey. Journal of Behavioral Addictions 6, 2 (2017), 168 – 177. https://doi.org/10.1556/2006.6.2017.020
- Lotz (2021) Amanda D Lotz. 2021. In between the global and the local: Mapping the geographies of Netflix as a multinational service. International Journal of Cultural Studies 24, 2 (2021), 195–215.
- Luo et al. (2019) Yawei Luo, Liang Zheng, Tao Guan, Junqing Yu, and Yi Yang. 2019. Taking a closer look at domain shift: Category-level adversaries for semantics consistent domain adaptation. In Proceedings of the IEEE/CVF Conference on Computer Vision and Pattern Recognition. 2507–2516.
- Makonin et al. (2013) Stephen Makonin, Lyn Bartram, and Fred Popowich. 2013. A Smarter Smart Home: Case Studies of Ambient Intelligence. IEEE Pervasive Computing 12, 1 (2013), 58–66. https://doi.org/10.1109/MPRV.2012.58
- Mathur et al. (2019) Akhil Mathur, Anton Isopoussu, Nadia Berthouze, Nicholas D Lane, and Fahim Kawsar. 2019. Unsupervised domain adaptation for robust sensory systems. In Adjunct Proceedings of the 2019 ACM International Joint Conference on Pervasive and Ubiquitous Computing and Proceedings of the 2019 ACM International Symposium on Wearable Computers. 505–509.
- Mathur et al. (2017) Akhil Mathur, Lakshmi Manasa Kalanadhabhatta, Rahul Majethia, and Fahim Kawsar. 2017. Moving Beyond Market Research: Demystifying Smartphone User Behavior in India. Proceedings of the ACM on Interactive, Mobile, Wearable and Ubiquitous Technologies 1, 3 (Sept. 2017), 1–27. https://doi.org/10.1145/3130947
- McClernon and Roy Choudhury (2013) F Joseph McClernon and Romit Roy Choudhury. 2013. I am your smartphone, and I know you are about to smoke: the application of mobile sensing and computing approaches to smoking research and treatment. Nicotine & tobacco research 15, 10 (2013), 1651–1654.
- Meegahapola et al. (2022) Lakmal Meegahapola, Wageesha Bangamuarachchi, Anju Chamantha, Salvador Ruiz-Correa, Indika Perera, and Daniel Gatica-Perez. 2022. Sensing Eating Events in Context: A Smartphone-Only Approach. IEEE Access 10, ARTICLE (2022).
- Meegahapola et al. (2023) Lakmal Meegahapola, William Droz, Peter Kun, Amalia de Götzen, Chaitanya Nutakki, Shyam Diwakar, Salvador Ruiz Correa, Donglei Song, Hao Xu, Miriam Bidoglia, George Gaskell, Altangerel Chagnaa, Amarsanaa Ganbold, Tsolmon Zundui, Carlo Caprini, Daniele Miorandi, Alethia Hume, Jose Luis Zarza, Luca Cernuzzi, Ivano Bison, Marcelo Rodas Britez, Matteo Busso, Ronald Chenu-Abente, Can Günel, Fausto Giunchiglia, Laura Schelenz, and Daniel Gatica-Perez. 2023. Generalization and Personalization of Mobile Sensing-Based Mood Inference Models: An Analysis of College Students in Eight Countries. Proc. ACM Interact. Mob. Wearable Ubiquitous Technol. 6, 4, Article 176 (jan 2023), 32 pages.
- Meegahapola and Gatica-Perez (2020) Lakmal Meegahapola and Daniel Gatica-Perez. 2020. Smartphone Sensing for the Well-Being of Young Adults: A Review. IEEE Access 9 (2020), 3374–3399.
- Meegahapola et al. (2021a) Lakmal Meegahapola, Florian Labhart, Thanh-Trung Phan, and Daniel Gatica-Perez. 2021a. Examining the Social Context of Alcohol Drinking in Young Adults with Smartphone Sensing. Proceedings of the ACM on Interactive, Mobile, Wearable and Ubiquitous Technologies 5, 3 (Sept. 2021), 1–26. https://doi.org/10.1145/3478126
- Meegahapola et al. (2020a) Lakmal Meegahapola, Salvador Ruiz-Correa, and Daniel Gatica-Perez. 2020a. Alone or With Others? Understanding Eating Episodes of College Students with Mobile Sensing. In 19th International Conference on Mobile and Ubiquitous Multimedia. ACM, Essen Germany, 162–166. https://doi.org/10.1145/3428361.3428463
- Meegahapola et al. (2020b) Lakmal Meegahapola, Salvador Ruiz-Correa, and Daniel Gatica-Perez. 2020b. Protecting Mobile Food Diaries from Getting too Personal. In 19th International Conference on Mobile and Ubiquitous Multimedia. ACM, Essen Germany, 212–222. https://doi.org/10.1145/3428361.3428468
- Meegahapola et al. (2021b) Lakmal Meegahapola, Salvador Ruiz-Correa, Viridiana del Carmen Robledo-Valero, Emilio Ernesto Hernandez-Huerfano, Leonardo Alvarez-Rivera, Ronald Chenu-Abente, and Daniel Gatica-Perez. 2021b. One More Bite? Inferring Food Consumption Level of College Students Using Smartphone Sensing and Self-Reports. Proceedings of the ACM on Interactive, Mobile, Wearable and Ubiquitous Technologies 5, 1 (March 2021), 1–28. https://doi.org/10.1145/3448120
- Mehrotra and Musolesi (2017) Abhinav Mehrotra and Mirco Musolesi. 2017. Intelligent notification systems: A survey of the state of the art and research challenges. arXiv preprint arXiv:1711.10171 (2017).
- Mercer et al. (2016) Kathryn Mercer, Lora Giangregorio, Eric Schneider, Parmit Chilana, Melissa Li, and Kelly Grindrod. 2016. Acceptance of Commercially Available Wearable Activity Trackers Among Adults Aged Over 50 and With Chronic Illness: A Mixed-Methods Evaluation. JMIR mHealth and uHealth 4, 1 (Jan. 2016), e7. https://doi.org/10.2196/mhealth.4225
- Merrill and Althoff (2022) Mike A Merrill and Tim Althoff. 2022. Self-supervised Pretraining and Transfer Learning Enable Flu and COVID-19 Predictions in Small Mobile Sensing Datasets. arXiv preprint arXiv:2205.13607 (2022).
- Miller et al. (2021) Daniel Miller, Laila Abed Rabho, Patrick Awondo, Maya de Vries, Marília Duque, Pauline Garvey, Laura Haapio-Kirk, Charlotte Hawkins, Alfonso Otaegui, Shireen Walton, and Xinyuan Wang. 2021. The Global Smartphone: Beyond a youth technology. UCL Press. http://www.jstor.org/stable/j.ctv1b0fvh1
- Naseeb and Saeedi (2020) Chan Naseeb and Bilal Al Saeedi. 2020. Activity recognition for locomotion and transportation dataset using deep learning. In Adjunct Proceedings of the 2020 ACM International Joint Conference on Pervasive and Ubiquitous Computing and Proceedings of the 2020 ACM International Symposium on Wearable Computers. ACM, Virtual Event Mexico, 329–334. https://doi.org/10.1145/3410530.3414348
- Nef et al. (2015) Tobias Nef, Prabitha Urwyler, Marcel Büchler, Ioannis Tarnanas, Reto Stucki, Dario Cazzoli, René Müri, and Urs Mosimann. 2015. Evaluation of Three State-of-the-Art Classifiers for Recognition of Activities of Daily Living from Smart Home Ambient Data. Sensors 15, 5 (May 2015), 11725–11740. https://doi.org/10.3390/s150511725
- Nelson and Pieper (2022) Justin J. Nelson and Christopher M. Pieper. 2022. “Maladies of Infinite Aspiration”: Smartphones, Meaning-Seeking, and Anomigenesis. Sociological Perspectives (Aug 2022), 073112142211142. https://doi.org/10.1177/07311214221114296
- Nepal et al. (2020) Subigya Nepal, Shayan Mirjafari, Gonzalo J Martinez, Pino Audia, Aaron Striegel, and Andrew T Campbell. 2020. Detecting job promotion in information workers using mobile sensing. Proceedings of the ACM on Interactive, Mobile, Wearable and Ubiquitous Technologies 4, 3 (2020), 1–28. https://doi.org/10.1145/3414118
- Nhan et al. (2020) Johnny Nhan, Kendra Bowen, and Aaron Bartula. 2020. A comparison of a public and private university of the effects of low-cost streaming services and income on movie piracy. Technology in Society 60 (2020), 101213.
- Obuchi et al. (2020) Mikio Obuchi, Jeremy F Huckins, Weichen Wang, Alex daSilva, Courtney Rogers, Eilis Murphy, Elin Hedlund, Paul Holtzheimer, Shayan Mirjafari, and Andrew Campbell. 2020. Predicting brain functional connectivity using mobile sensing. Proceedings of the ACM on Interactive, Mobile, Wearable and Ubiquitous Technologies 4, 1 (2020), 1–22. https://doi.org/10.1145/3381001
- Oh et al. (2015) Hyungik Oh, Laleh Jalali, and Ramesh Jain. 2015. An intelligent notification system using context from real-time personal activity monitoring. In 2015 IEEE International Conference on Multimedia and Expo (ICME). IEEE, 1–6.
- Olson et al. (2022) Jay A. Olson, Dasha A. Sandra, Élissa S. Colucci, Alain Al Bikaii, Denis Chmoulevitch, Johnny Nahas, Amir Raz, and Samuel P.L. Veissière. 2022. Smartphone addiction is increasing across the world: A meta-analysis of 24 countries. Computers in Human Behavior 129 (2022), 107138. https://doi.org/10.1016/j.chb.2021.107138
- Park et al. (1999) S. Park, C. Gopalsamy, R. Rajamanickam, and S. Jayaraman. 1999. The Wearable Motherboard: a flexible information infrastructure or sensate liner for medical applications. Studies in Health Technology and Informatics 62 (1999), 252–258.
- Pedregosa et al. (2011) F. Pedregosa, G. Varoquaux, A. Gramfort, V. Michel, B. Thirion, O. Grisel, M. Blondel, P. Prettenhofer, R. Weiss, V. Dubourg, J. Vanderplas, A. Passos, D. Cournapeau, M. Brucher, M. Perrot, and E. Duchesnay. 2011. Scikit-learn: Machine Learning in Python. Journal of Machine Learning Research 12 (2011), 2825–2830.
- Phan et al. (2022) Le Vy Phan, Nick Modersitzki, Kim Karen Gloystein, and Sandrine Müller. 2022. Mobile Sensing Around the Globe: Considerations for Cross-Cultural Research. preprint. PsyArXiv. https://doi.org/10.31234/osf.io/q8c7y
- Phan et al. (2020) Thanh-Trung Phan, Florian Labhart, Skanda Muralidhar, and Daniel Gatica-Perez. 2020. Understanding Heavy Drinking at Night through Smartphone Sensing and Active Human Engagement. In Proceedings of the 14th EAI International Conference on Pervasive Computing Technologies for Healthcare. 211–222.
- Prabhakaran et al. (2022) Vinodkumar Prabhakaran, Rida Qadri, and Ben Hutchinson. 2022. Cultural Incongruencies in Artificial Intelligence. arXiv preprint arXiv:2211.13069 (2022).
- Rai et al. (2012) Angshu Rai, Zhixian Yan, Dipanjan Chakraborty, Tri Kurniawan Wijaya, and Karl Aberer. 2012. Mining complex activities in the wild via a single smartphone accelerometer. In Proceedings of the sixth international workshop on knowledge discovery from sensor data. 43–51.
- Raji and Buolamwini (2019) Inioluwa Deborah Raji and Joy Buolamwini. 2019. Actionable Auditing: Investigating the Impact of Publicly Naming Biased Performance Results of Commercial AI Products. In Proceedings of the 2019 AAAI/ACM Conference on AI, Ethics, and Society. ACM, Honolulu HI USA, 429–435. https://doi.org/10.1145/3306618.3314244
- Rashid et al. (2020) Haroon Rashid, Sanjana Mendu, Katharine E Daniel, Miranda L Beltzer, Bethany A Teachman, Mehdi Boukhechba, and Laura E Barnes. 2020. Predicting subjective measures of social anxiety from sparsely collected mobile sensor data. Proceedings of the ACM on Interactive, Mobile, Wearable and Ubiquitous Technologies 4, 3 (2020), 1–24.
- Ratan et al. (2021) Zubair Ahmed Ratan, Sojib Bin Zaman, Sheikh Mohammed Shariful Islam, and Hassan Hosseinzadeh. 2021. Smartphone overuse: A hidden crisis in COVID-19. Health Policy and Technology 10, 1 (March 2021), 21–22. https://doi.org/10.1016/j.hlpt.2021.01.002
- Rathod et al. (2022) Ashwini S Rathod, Abhishek Ingole, Abhay Gaidhane, and Sonali G Choudhari. 2022. Psychological Morbidities Associated With Excessive Usage of Smartphones Among Adolescents and Young Adults: A Review. Cureus (Oct 2022). https://doi.org/10.7759/cureus.30756
- Rump (2011) Simon Rump. 2011. What kind of thief are you? Linking perceptions, personality traits and music taste to illegal downloading-how preferences, traits and notions affect online crime. B.S. thesis. University of Twente.
- Saadeh et al. (2021) Heba Saadeh, Reem Q. Al Fayez, Assem Al Refaei, Nour Shewaikani, Hamzah Khawaldah, Sobuh Abu-Shanab, and Maysa Al-Hussaini. 2021. Smartphone Use Among University Students During COVID-19 Quarantine: An Ethical Trigger. Frontiers in Public Health 9 (July 2021), 600134. https://doi.org/10.3389/fpubh.2021.600134
- Saguna et al. (2013) Saguna Saguna, Arkady Zaslavsky, and Dipanjan Chakraborty. 2013. Complex activity recognition using context-driven activity theory and activity signatures. ACM Transactions on Computer-Human Interaction (TOCHI) 20, 6 (2013), 1–34.
- Santani et al. (2018) Darshan Santani, Trinh-Minh-Tri Do, Florian Labhart, Sara Landolt, Emmanuel Kuntsche, and Daniel Gatica-Perez. 2018. DrinkSense: Characterizing Youth Drinking Behavior Using Smartphones. IEEE Transactions on Mobile Computing 17, 10 (Oct. 2018), 2279–2292. https://doi.org/10.1109/TMC.2018.2797901
- Sasaki et al. (2016) Jeffer Eidi Sasaki, Amanda M. Hickey, John W. Staudenmayer, Dinesh John, Jane A. Kent, and Patty S. Freedson. 2016. Performance of Activity Classification Algorithms in Free-Living Older Adults. Medicine & Science in Sports & Exercise 48, 5 (May 2016), 941–950. https://doi.org/10.1249/MSS.0000000000000844
- Schelenz et al. (2021a) Laura Schelenz, Ivano Bison, Matteo Busso, Amalia de Götzen, Daniel Gatica-Perez, Fausto Giunchiglia, Lakmal Meegahapola, and Salvador Ruiz-Correa. 2021a. The Theory, Practice, and Ethical Challenges of Designing a Diversity-Aware Platform for Social Relations. In Proceedings of the 2021 AAAI/ACM Conference on AI, Ethics, and Society (Virtual Event, USA) (AIES ’21). Association for Computing Machinery, New York, NY, USA, 905–915. https://doi.org/10.1145/3461702.3462595
- Schelenz et al. (2021b) Laura Schelenz, Ivano Bison, Matteo Busso, Amalia de Götzen, Daniel Gatica-Perez, Fausto Giunchiglia, Lakmal Meegahapola, and Salvador Ruiz-Correa. 2021b. The Theory, Practice, and Ethical Challenges of Designing a Diversity-Aware Platform for Social Relations. In Proceedings of the 2021 AAAI/ACM Conference on AI, Ethics, and Society. ACM, Virtual Event USA, 905–915. https://doi.org/10.1145/3461702.3462595
- Schwartz (1994) Shalom H Schwartz. 1994. Are there universal aspects in the structure and contents of human values? Journal of social issues 50, 4 (1994), 19–45.
- Schwartz et al. (2001) Shalom H Schwartz, Gila Melech, Arielle Lehmann, Steven Burgess, Mari Harris, and Vicki Owens. 2001. Extending the cross-cultural validity of the theory of basic human values with a different method of measurement. Journal of cross-cultural psychology 32, 5 (2001), 519–542.
- Scikit-Learn (2022a) Scikit-Learn. 2022a. Scikit-Learn Metrics - AUROC. Retrieved February 14, 2022 from https://scikit-learn.org/stable/modules/generated/sklearn.metrics.roc_auc_score.html
- Scikit-Learn (2022b) Scikit-Learn. 2022b. Scikit-Learn Metrics - F1-Score. Retrieved February 14, 2022 from https://scikit-learn.org/stable/modules/generated/sklearn.metrics.f1_score.html
- Servia-Rodríguez et al. (2017) Sandra Servia-Rodríguez, Kiran K. Rachuri, Cecilia Mascolo, Peter J. Rentfrow, Neal Lathia, and Gillian M. Sandstrom. 2017. Mobile Sensing at the Service of Mental Well-being: a Large-scale Longitudinal Study. In Proceedings of the 26th International Conference on World Wide Web. International World Wide Web Conferences Steering Committee, Perth Australia, 103–112. https://doi.org/10.1145/3038912.3052618
- Sewall et al. (2020) Craig JR Sewall, Todd M Bear, John Merranko, and Daniel Rosen. 2020. How psychosocial well-being and usage amount predict inaccuracies in retrospective estimates of digital technology use. Mobile Media & Communication 8, 3 (2020), 379–399.
- Siirtola et al. (2011) Pekka Siirtola, Perttu Laurinen, Juha Roning, and Hannu Kinnunen. 2011. Efficient accelerometer-based swimming exercise tracking. In 2011 IEEE Symposium on Computational Intelligence and Data Mining (CIDM). IEEE, Paris, France, 156–161. https://doi.org/10.1109/CIDM.2011.5949430
- Southerton et al. (2012) Dale Southerton, Cecilla Díaz-Méndez, Alan Warde, et al. 2012. Behavioural change and the temporal ordering of eating practices: A UK–Spain comparison. The International Journal of Sociology of Agriculture and Food 19, 1 (2012), 19–36.
- Stockwell et al. (2021) Stephanie Stockwell, Mike Trott, Mark Tully, Jae Shin, Yvonne Barnett, Laurie Butler, Daragh McDermott, Felipe Schuch, and Lee Smith. 2021. Changes in physical activity and sedentary behaviours from before to during the COVID-19 pandemic lockdown: a systematic review. BMJ Open Sport & Exercise Medicine 7, 1 (Jan. 2021), e000960. https://doi.org/10.1136/bmjsem-2020-000960
- Straczkiewicz et al. (2021a) Marcin Straczkiewicz, Peter James, and Jukka-Pekka Onnela. 2021a. A systematic review of smartphone-based human activity recognition methods for health research. npj Digital Medicine 4, 1 (Dec. 2021), 148. https://doi.org/10.1038/s41746-021-00514-4
- Straczkiewicz et al. (2021b) Marcin Straczkiewicz, Peter James, and Jukka-Pekka Onnela. 2021b. A systematic review of smartphone-based human activity recognition methods for health research. NPJ Digital Medicine 4, 1 (2021), 1–15.
- Sun et al. (2017) Sining Sun, Binbin Zhang, Lei Xie, and Yanning Zhang. 2017. An unsupervised deep domain adaptation approach for robust speech recognition. Neurocomputing 257 (2017), 79–87.
- Tirri and Nokelainen (2008) Kirsi Tirri and Petri Nokelainen. 2008. Identification of multiple intelligences with the Multiple Intelligence Profiling Questionnaire III. Psychology Science 50, 2 (2008), 206.
- Tobin (2018) Taylor Tobin. 2018. What time people typically eat dinner in 12 different places around the world. https://www.insider.com/dinner-times-around-the-world-2018-11
- Van de Vijver and Tanzer (2004) Fons Van de Vijver and Norbert K Tanzer. 2004. Bias and equivalence in cross-cultural assessment: An overview. European Review of Applied Psychology 54, 2 (2004), 119–135.
- van Deursen et al. (2015) Alexander J.A.M. van Deursen, Colin L. Bolle, Sabrina M. Hegner, and Piet A.M. Kommers. 2015. Modeling habitual and addictive smartphone behavior: The role of smartphone usage types, emotional intelligence, social stress, self-regulation, age, and gender. Computers in Human Behavior 45 (2015), 411–420. https://doi.org/10.1016/j.chb.2014.12.039
- van Hees et al. (2013) Vincent T. van Hees, Rajna Golubic, Ulf Ekelund, and Søren Brage. 2013. Impact of study design on development and evaluation of an activity-type classifier. Journal of Applied Physiology 114, 8 (April 2013), 1042–1051. https://doi.org/10.1152/japplphysiol.00984.2012
- Wang et al. (2017) Rui Wang, Weichen Wang, Min SH Aung, Dror Ben-Zeev, Rachel Brian, Andrew T Campbell, Tanzeem Choudhury, Marta Hauser, John Kane, Emily A Scherer, et al. 2017. Predicting symptom trajectories of schizophrenia using mobile sensing. Proceedings of the ACM on Interactive, Mobile, Wearable and Ubiquitous Technologies 1, 3 (2017), 1–24. https://doi.org/10.1145/3130976
- Wang et al. (2020) Rui Wang, Weichen Wang, Mikio Obuchi, Emily Scherer, Rachel Brian, Dror Ben-Zeev, Tanzeem Choudhury, John Kane, Martar Hauser, Megan Walsh, et al. 2020. On predicting relapse in schizophrenia using mobile sensing in a randomized control trial. In 2020 IEEE International Conference on Pervasive Computing and Communications (PerCom). IEEE, 1–8. https://doi.org/10.1109/PerCom45495.2020.9127365
- Wang (2003) Sun-Chong Wang. 2003. Artificial neural network. In Interdisciplinary computing in java programming. Springer, 81–100.
- Wang et al. (2022) Weichen Wang, Subigya Nepal, Jeremy F Huckins, Lessley Hernandez, Vlado Vojdanovski, Dante Mack, Jane Plomp, Arvind Pillai, Mikio Obuchi, Alex daSilva, et al. 2022. First-Gen Lens: Assessing Mental Health of First-Generation Students across Their First Year at College Using Mobile Sensing. Proceedings of the ACM on Interactive, Mobile, Wearable and Ubiquitous Technologies 6, 2 (2022), 1–32. https://doi.org/10.1145/3543194
- Wang et al. (2012) Xinxi Wang, David Rosenblum, and Ye Wang. 2012. Context-Aware Mobile Music Recommendation for Daily Activities. In Proceedings of the 20th ACM International Conference on Multimedia (Nara, Japan) (MM ’12). Association for Computing Machinery, New York, NY, USA, 99–108. https://doi.org/10.1145/2393347.2393368
- Wiener et al. (1990) Joshua M Wiener, Raymond J Hanley, Robert Clark, and Joan F Van Nostrand. 1990. Measuring the activities of daily living: Comparisons across national surveys. Journal of gerontology 45, 6 (1990), S229–S237.
- Wilson et al. (2022) Garrett Wilson, Janardhan Rao Doppa, and Diane J Cook. 2022. Domain Adaptation Under Behavioral and Temporal Shifts for Natural Time Series Mobile Activity Recognition. arXiv preprint arXiv:2207.04367 (2022).
- Xu et al. (2023) Xuhai Xu, Xin Liu, Han Zhang, Weichen Wang, Subigya Nepal, Yasaman Sefidgar, Woosuk Seo, Kevin S Kuehn, Jeremy F Huckins, Margaret E Morris, et al. 2023. GLOBEM: Cross-Dataset Generalization of Longitudinal Human Behavior Modeling. Proceedings of the ACM on Interactive, Mobile, Wearable and Ubiquitous Technologies 6, 4 (2023), 1–34.
- Xu et al. (2021) Xuhai Xu, Jennifer Mankoff, and Anind K Dey. 2021. Understanding practices and needs of researchers in human state modeling by passive mobile sensing. CCF Transactions on Pervasive Computing and Interaction 3, 4 (2021), 344–366.
- Yang and Wang (2016) Rong Yang and Baowei Wang. 2016. PACP: A Position-Independent Activity Recognition Method Using Smartphone Sensors. Information 7, 4 (Dec. 2016), 72. https://doi.org/10.3390/info7040072
- Yuval-Davis (2004) Nira Yuval-Davis. 2004. Gender and nation. Routledge.
- Zhang et al. (2022) Jingwen Zhang, Dingwen Li, Ruixuan Dai, Heidy Cos, Gregory A Williams, Lacey Raper, Chet W Hammill, and Chenyang Lu. 2022. Predicting Post-Operative Complications with Wearables: A Case Study with Patients Undergoing Pancreatic Surgery. Proceedings of the ACM on Interactive, Mobile, Wearable and Ubiquitous Technologies 6, 2 (2022), 1–27.
- Zhang (2012) Shichao Zhang. 2012. Nearest neighbor selection for iteratively kNN imputation. Journal of Systems and Software 85, 11 (2012), 2541–2552.
- Zhang et al. (2021) Wanyi Zhang, Qiang Shen, Stefano Teso, Bruno Lepri, Andrea Passerini, Ivano Bison, and Fausto Giunchiglia. 2021. Putting human behavior predictability in context. EPJ Data Science 10, 1 (2021), 42.
- Zheng et al. (2020) Chen Zheng, Wendy Yajun Huang, Sinead Sheridan, Cindy Hui-Ping Sit, Xiang-Ke Chen, and Stephen Heung-Sang Wong. 2020. COVID-19 Pandemic Brings a Sedentary Lifestyle in Young Adults: A Cross-Sectional and Longitudinal Study. International Journal of Environmental Research and Public Health 17, 17 (Aug. 2020), 6035. https://doi.org/10.3390/ijerph17176035
- Zhou et al. (2018) Yuchao Zhou, Suparna De, Wei Wang, Ruili Wang, and Klaus Moessner. 2018. Missing data estimation in mobile sensing environments. IEEE Access 6 (2018), 69869–69882.
- Zhu et al. (2019) Ran Zhu, Zhuoling Xiao, Ying Li, Mingkun Yang, Yawen Tan, Liang Zhou, Shuisheng Lin, and Hongkai Wen. 2019. Efficient Human Activity Recognition Solving the Confusing Activities Via Deep Ensemble Learning. IEEE Access 7 (2019), 75490–75499. https://doi.org/10.1109/ACCESS.2019.2922104
- Zhuang and Xue (2019) Zhendong Zhuang and Yang Xue. 2019. Sport-Related Human Activity Detection and Recognition Using a Smartwatch. Sensors 19, 22 (Nov. 2019), 5001. https://doi.org/10.3390/s19225001