Towards Reliable Assessments of Demographic Disparities in Multi-Label Image Classifiers
Abstract.
Disaggregated performance metrics across demographic groups are a hallmark of fairness assessments in computer vision. These metrics successfully incentivized performance improvements on person-centric tasks such as face analysis and are used to understand risks of modern models. However, there is a lack of discussion on the vulnerabilities of these measurements for more complex computer vision tasks. In this paper, we consider multi-label image classification and, specifically, object categorization tasks. First, we highlight design choices and trade-offs for measurement that involve more nuance than discussed in prior computer vision literature. These challenges are related to the necessary scale of data, definition of groups for images, choice of metric, and dataset imbalances. Next, through two case studies using modern vision models, we demonstrate that naive implementations of these assessments are brittle. We identify several design choices that look merely like implementation details but significantly impact the conclusions of assessments, both in terms of magnitude and direction (on which group the classifiers work best) of disparities. Based on ablation studies, we propose some recommendations to increase the reliability of these assessments. Finally, through a qualitative analysis we find that concepts with large disparities tend to have varying definitions and representations between groups, with inconsistencies across datasets and annotators. While this result suggests avenues for mitigation through more consistent data collection, it also highlights that ambiguous label definitions remain a challenge when performing model assessments. Vision models are expanding and becoming more ubiquitous; it is even more important that our disparity assessments accurately reflect the true performance of models.
1. Introduction
As computer vision systems become ubiquitous, there is a growing collection of work focused on assessing “who these systems work for” (Mohamed et al., 2020; Birhane et al., 2022). This question is often explored through disaggregated measurements (Barocas et al., 2021), which compare performance across groups of people affected by these systems. Audits of face analysis systems are an example of disaggregated measurements that highlight problematic error discrepancies between groups and enable the monitoring of improvements (Buolamwini and Gebru, 2018; Raji and Buolamwini, 2019). As vision models grow in capabilities, fairness measurements of feature extractors and zero-shot learners trained on billions of images similarly rely on disaggregated measurements (Goyal et al., 2022b; Singh et al., 2022). A recent subset of analyses focus on per-label disaggregated measurements for multi-label object recognition tasks (Zhao et al., 2017; Wang and Russakovsky, 2021; Radford et al., 2021; Agarwal et al., 2021; Hall et al., 2023).
Compared to fairness assessments of object recognition tasks that use overall performance metrics (De Vries et al., 2019; Goyal et al., 2022a; Rojas et al., 2022), the finer granularity offered by per-label measurements reveals discrepancies that may be hidden by overall metrics. For example, an overall measurement may show that a model is equally good at identifying objects when images contain only men or only women. A per-label measurement, on the other hand, can provide finegrained detail such as finding that the model has struggled to classify neckties when men are not in the image and equally struggled for handbags when women are not in the image. These measurements also explicitly link error discrepancies with specific labels, making them a useful tool to better understand model errors.
Disaggregated measurements for multi-label classification are challenging because they are, by nature, imperfect representations of model errors. They are summary statistics that give only a high-level view of error patterns and are subject to confounding factors, including ambiguities in the determination of groups and correlations between labels and groups. Choices made for measurement directly impact these confounders and the reliability of the assessment. While these effects have been discussed in isolation in the machine learning and algorithmic fairness community (Barocas et al., 2021), per-concept, multi-label object recognition involves complexities that deserve specific attention. Multi-label tasks require an examination of metrics beyond binary classification, which has received the most interest so far (Chouldechova, 2017; Kleinberg, 2018; Gölz et al., 2019). Furthermore, there is no high-fidelity benchmark for object recognition that contains demographic attributes of people and captures many concepts co-occurring in images. The main datasets use model-provided annotations of objects that can have their own biases (Schumann et al., 2021b) or focus on location-based disparities with few labels per image (De Vries et al., 2019; Rojas et al., 2022).
The contributions of this paper are three-fold:
-
•
First, in Section 3 we highlight design choices that are unique to per-concept disaggregated measurements in multi-label object recognition tasks, including the data source and specification of groups, trade-offs when using multi-label data, and the interplay between metrics and sampling.
-
•
Second, in Sections 4 & 5 we perform two case studies that demonstrate how design choices affect observed performance disparities. We find that evaluation choices affect the magnitude and direction of observed disparities. For example, disparities in average precision between groups are dependent on the ratio of positive and negative samples for each group, and different mappings between dataset and model labels can magnify observed disparities between groups. We propose recommendations to improve assessments.
-
•
Finally, in Section 6 we qualitatively analyze disparities in the more reliable evaluation protocols of our case studies. We observe that concepts with large disparities often have ambiguous definitions, inconsistent annotations, or domain shifts. The variation of concept representations between groups suggests avenues for disparity mitigations while also posing a remaining challenge for performing reliable evaluations.
Limitations. Our work emphasizes the importance of carefully designing measurements disaggregated by group and concept. It also highlights trade-offs when evaluating disparities in object recognition tasks. While we believe our work will help practitioners better control sources of observed disparities that are not due to group-dependent model errors, we reiterate that disaggregated measurements are by nature imperfect. First, exactly controlling for within-group label correlations is likely infeasible. Second, the existing specifications of demographic groups are far from capturing the complexity and nuances of these constructions (Benthall and Haynes, 2019; Hanna et al., 2020; Hazirbas et al., 2021; Dodik et al., 2022; Tomasev et al., 2021). For example, the operationalization of gender through a binary variable and proxy labels as we do for the Visual Genome dataset in Section 4 is only a best effort to obtain high-level correlations between errors and should not be seen as a “correct” measurement of gender-based disparities (if that exists at all). We discuss these risks more in Section 3 and Section 4. Finally, while we discuss the interplay between metrics and sampling (see Section 3), which metric to choose is still left as an open question – which is all the more important considering incompatibility between metrics (Kleinberg, 2018; Chouldechova, 2017).
These limitations, in turn, affect the interpretation and use of these measurements. In this work, we use disaggregated measurements to guide a qualitative assessment of model errors. Similar to Goyal et al. (2022b), they can also be used to measure progress. However, remaining unknowns and risks related to the definition of groups and choice of metric make these measurements insufficient to certify fairness or provide fairness constraints.
2. Related work
Measuring and understanding bias in vision models typically focuses on either training data (Zhao et al., 2017; Wang et al., 2019, 2022) or the assessment of the model after training. We only discuss the latter in this section.
In the last decade, audits of AI systems based on disaggregated measurements showed higher errors for societally disadvantaged demographic groups (Grother et al., 2014; Angwin et al., 2016; Stock and Cisse, 2017; Buolamwini and Gebru, 2018). For recent image recognition and classification models (Rojas et al., 2022; Singh et al., 2022; Goyal et al., 2022a; Radford et al., 2021), fairness assessments crystallized primarily around two issues: disparities in object recognition performance (Shankar et al., 2017; De Vries et al., 2019; Singh et al., 2022; Rojas et al., 2022; Zhao et al., 2017) and identifying harmful or stereotypical associations (Radford et al., 2021; Goyal et al., 2022b; Zhao et al., 2017; Hall et al., 2023). A critical challenge in disaggregated analyses of object recognition models is the availability of datasets with clear demographic annotations. Data collection has mostly focused on annotations of demographic groups for images of faces and people (Hazirbas et al., 2021; Schumann et al., 2021a; Karkkainen and Joo, 2021; Buolamwini and Gebru, 2018), rather than explicit object annotations. While some datasets do contain object annotations in addition to geographic or income information (Gapminder, 2021; Rojas et al., 2022; Ramaswamy et al., 2023), they contain few labels per image (no more than five) and are more suited for single-label evaluations. Open Images MIAP (Schumann et al., 2021b) is an object recognition dataset with explicit gender and age annotations, but its object labels are supplied by models (Schumann et al., 2021b; Kuznetsova et al., 2018) rather than humans and may contain model-induced biases. Prior work (Zhao et al., 2017; Wang et al., 2019; Wang and Russakovsky, 2021; Hall et al., 2023) also adapts general purpose object recognition datasets by constructing proxies for gender groups based on annotations of gender-related terms. Our contribution includes a review of the design choices in these applications, such as how groups are deduced and the experimental setup, and we propose steps to make disparity measurements based on these datasets more reliable and clarify their limitations.
The choice of metrics has been debated in the context of bias in recidivism prediction tools (Angwin et al., 2016; Flores et al., 2016; Dieterich et al., 2016), as well as their incompatibilities (Chouldechova, 2017; Kleinberg, 2018). Metrics for fairness assessments in computer vision receive less focus: precision/recall or true/false positive rates (Buolamwini and Gebru, 2018) and hit-rate (De Vries et al., 2019; Goyal et al., 2022b; Singh et al., 2022) are used without critical discussion. Our work brings metrics to the forefront. In particular, the tuning of decision thresholds poses a difficulty for multi-label predictions and suggests the use of ranking metrics to avoid the issue. However, we show that for the commonly used average precision metric, group/label correlations have a major, undesirable impact on observed disparities.
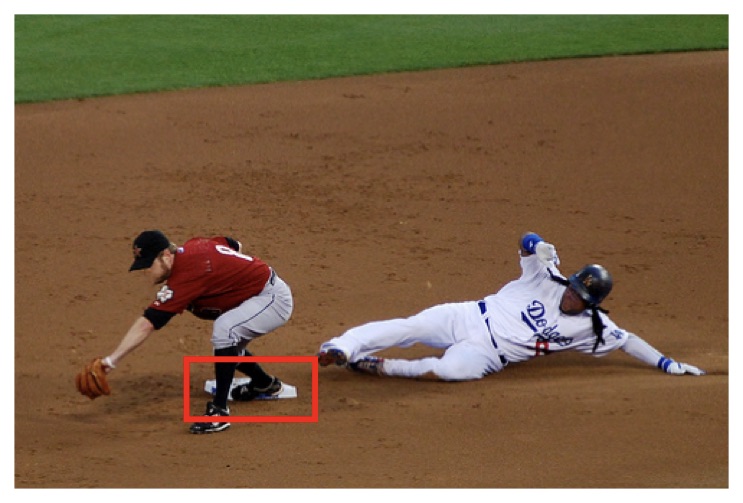
Previous work studying disparities within vision models focuses on different representations of a single concept definition, noting potential factors of variation across languages (De Vries et al., 2019) and visual cues (Idrissi et al., 2022). Our qualitative analysis highlights how - beyond different translations - a concept’s varied meaning between demographic groups can affect model performance. For example, in the Visual Genome dataset, the concept “base” is often a baseball field base in images containing people annotated as men and a structural base of an object for images containing annotations of women.
By investigating the malleability of concept definitions, our work is in line with recent works studying the breadth of concept meanings (for example, supplementing ImageNet with more annotations (Yun et al., 2021; Beyer et al., 2020; Shankar et al., 2020)), as well as examinations of classifications as evolving artifacts of the relationship between perception and inherent meaning (Denton et al., 2021; Bowker and Star, 2000; Phillips, 2019; Bender and Koller, 2020).
3. Choices Matter in Measurement
| Data Selection | Performance Metric | Data Sampling |
| Design Choices | ||
| A) data source B) operationalization of groups C) data & model class mapping | D) precision/recall or TP/FP rates E) ranking vs classification | F) filtering rare labels G) controlling for correlations |
| Trade-Offs | ||
|
A)
annotation cost vs
quality B) data coverage vs relevance to group |
C)
needs tuning thresholds vs
avoids tuning thresholds D) needs fixing class ratios vs avoids fixing class ratios |
E)
data coverage vs
statistical significance F) control for confounders vs distribution shift |
In this section we discuss important design choices for per-label, disaggregated measurements of object recognition models. We focus on recognition tasks defined by popular datasets like the Visual Genome (Krishna et al., 2017), MS-COCO (Lin et al., 2014) or Dollar Street (Rojas et al., 2022). These datasets contain object annotations, such as “tie” and “showers,” and have been used to analyze disparities between gender, geography, and income groups (De Vries et al., 2019; Zhao et al., 2017; Hall et al., 2023). We study cases when disparities in performance measurements may not be due to the model, but rather, idiosyncrasies or biases in how we perform the measurement.
We aim to improve the reliability of the assessment so that observed discrepancies between groups represent, as much as possible, actual differences in classification behavior between groups. We emphasize considerations that are particularly important for per-label disaggregated measurements of object recognition. Table 1 summarizes our exposition of design choices and trade-offs and covers Data Selection, Performance Metric, and Data Sampling.
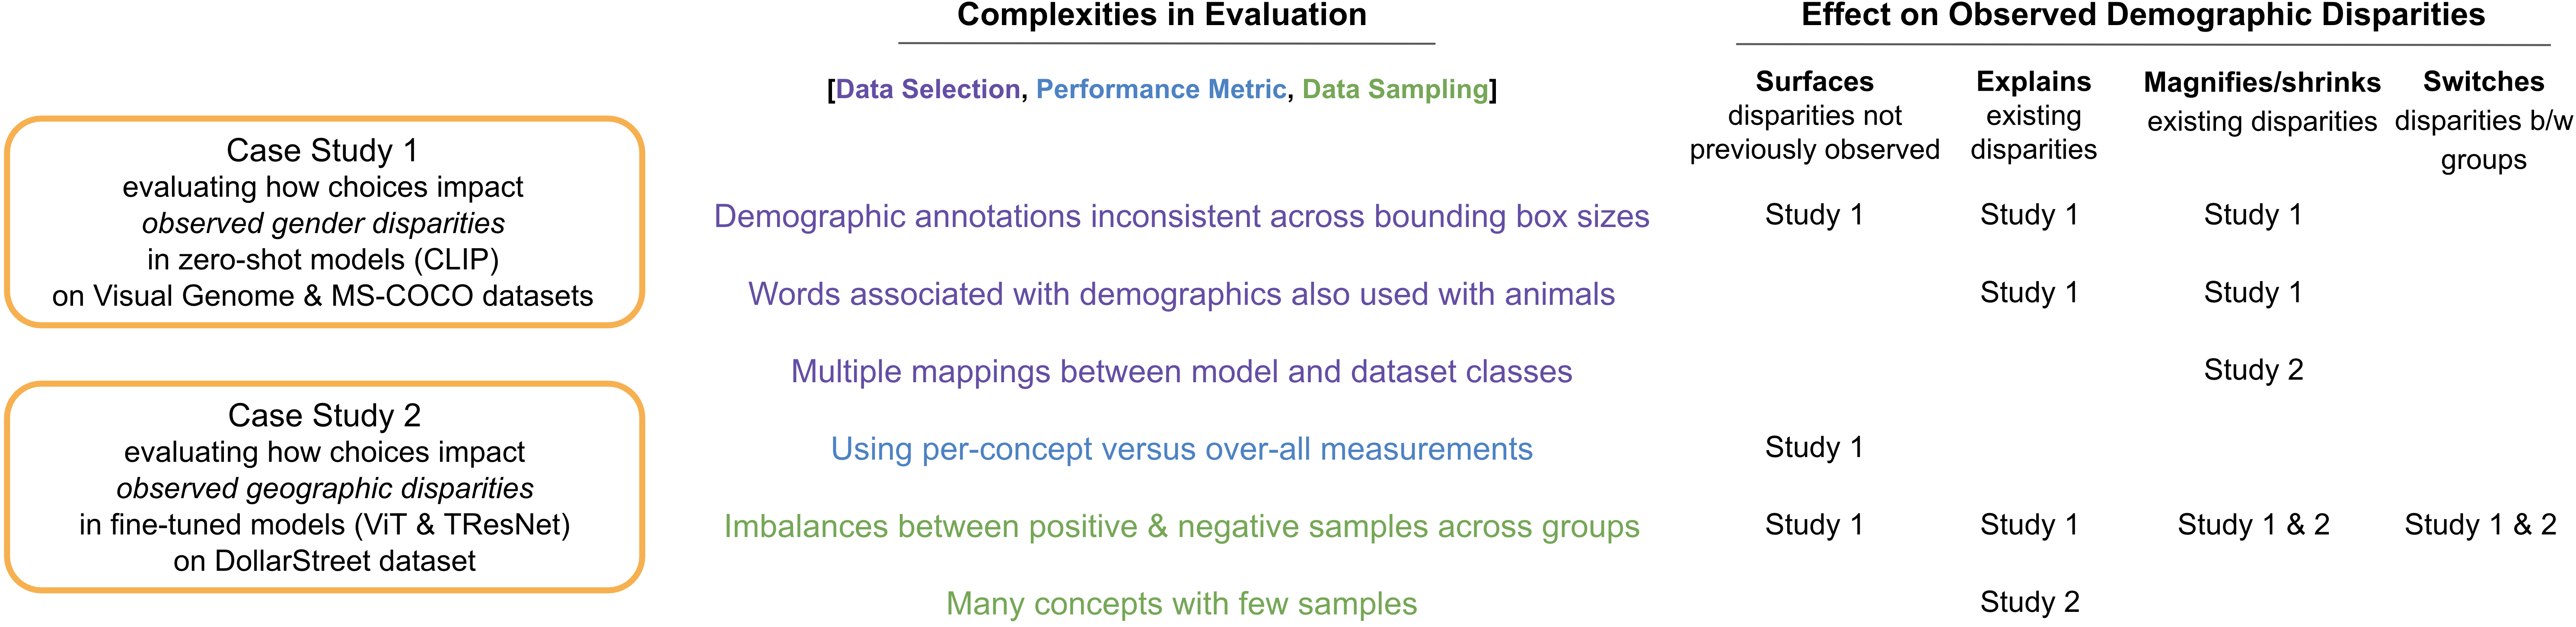
We ground our discussion with examples from two case studies investigating the effect of these choices on observed disparities: In Case Study #1 we study gender-related disparities in the zero-shot CLIP model (Radford et al., 2021) using the Visual Genome and MS-COCO, and in Case Study #2, we evaluate geographic disparities between supervised object recognition models using Dollar Street. We present these studies in Section 4 and Section 5 and summarize our learnings in Figure 1.
3.1. Data selection
The choice of data source is tied to the demographic groups that are the target of the evaluation and model task.
Choice A: Data source. For object recognition, existing datasets dedicated to disparity analyses address questions related primarily to where the image was taken, containing location or household-based income metadata (Shankar et al., 2017; Rojas et al., 2022; Ramaswamy et al., 2023). To date, the only dataset that assesses performance of object classification with respect to annotated demographic attributes of people in the image contains object labels that are provided by classifiers, rather than humans (Schumann et al., 2021b). The dataset likely inherits any biases contained in the models used for annotations, making it not ideal for disparity evaluations. To enable disaggregated measurements of more groups, prior work (Zhao et al., 2017; Wang et al., 2019; Wang and Russakovsky, 2021; Hall et al., 2023) constructs group labels from existing annotations in object recognition datasets that pertain to people. The main trade-off in the choice of data source relates to the cost of annotations: Compared to adapting existing datasets, collecting a dedicated dataset is expensive, but offers more control over how the groups are operationalized and which images compose the evaluation dataset. We discuss these further in the following paragraphs.
Choice B: Operationalization of groups. In images, group information pertaining to the individuals shown can be based on self-identification (Hazirbas et al., 2021) or “perception” (Schumann et al., 2021a) by an external source.
Inferring group identity from pre-existing annotations that are not focused on assigning demographic information introduces additional challenges. First, labels used for determining groups are likely not applied consistently by annotators, since their intent is not to explicitly operationalize the perceived group. For example, annotators may mention demographic groups more often when the situation depicted is unexpected for them, such as noting a “female doctor” when a woman is shown and a “doctor” when a man is shown. Thus, the inclusion of the demographic term can be inconsistent and encode annotator biases. Second, annotators may use words in unexpected ways. For example, in Case Study #1 we find that annotators of the Visual Genome often label images of animal pairs as “mother” and “child.”
Furthermore, disaggregated measurements assign group information to images, while demographic attributes are characteristics of individuals. This distinction has not received much consideration in prior work because models have been primarily assessed on images of individual people (Buolamwini and Gebru, 2018; Radford et al., 2021; Goyal et al., 2022b). Mapping an image to a single demographic group is more challenging when multiple people are in the photo. This introduces a trade-off: filtering images that are difficult to assign groups means less noise in terms of group labels but reduces coverage and inclusivity of the assessment. For example, prior work studying gender disparities removes images with reference to multiple groups to allow for distinct groups, even though doing so excludes many images (Zhao et al., 2017). In Case Study #1, we also investigate filtering images to ensure annotators had some minimum amount of information present for perceiving groups.
Finally, adapting pre-existing datasets means the only possible demographic groups are those explicitly labeled. For instance, while using captions to create group proxies might extend to age using references words like “young” or “old”, they do not extend to attributes that annotators do not reference consistently, such as skin tone or ethnicity.
While inferring group annotations from existing datasets provides insights of high-level error patterns of models, they are not sophisticated enough to provide fairness certificates and should not preclude the development of new datasets designed specifically for disparity analyses.
Choice C: Data and model class mapping. Evaluation datasets contain explicit object labels for each image. Like words, labels can have multiple meanings that are implied or modified depending on who is applying them. Object recognition models may be trained with class labels (concepts) that do not align with evaluation dataset labels, or collected with different specifications. In these cases, practitioners need to determine a mapping between evaluation dataset labels and model concepts. This presents a trade-off: creating this mapping means more concepts can included but a mis-match between dataset and model definitions means a less indicative evaluation of intended model performance. For example, in Case Study #2 we investigate how variation in mapping of concepts such as “parking lots” to “garage” versus “parking meter” can affect observed disparities.
3.2. Performance metric
For per-label disaggregated measurements of multi-label classifiers, we follow a one-vs-all approach: for each label, there is an associated binary classification task determining the presence or absence of the label in an image. We can then measure per-label disparities using similar metrics as with binary classification. In the discussion below, the positive class refers to the label being present in a given image and negative class refers to the label being absent.
Choice D: Choosing the family of metrics. The main families of metrics in binary classification are accuracy, precision/recall, and true positive/false positive rate (TPR/FPR) (Manning and Schutze, 1999). TPR and FPR are the proportions of predicted positives within the true positive examples and true negative examples, respectively. TPR and recall are the same, while precision is the proportion of true positive examples within the predicted positive.
The fundamental difference between precision/recall and TPR/FPR analyses lies in their respective dependence on the proportion of positive examples, called prevalence. Estimates of TPR/FPR remain approximately the same if we resample the data by changing the prevalence, but this is not the case for the precision. To be concrete, precision is related to TPR and FPR by (Davis and Goadrich, 2006):
| (1) |
For instance, when is small, precision is small unless the ratio TPR/FPR is large. This is why precision/recall analysis is sometimes preferred to TPR/FPR analysis for imbalanced data (Saito and Rehmsmeier, 2015).
However, when comparing two groups, TPR/FPR discrepancies are not affected by the relative numbers of positive/negative examples in each group, but precision is. In most vision datasets the proportion of images sampled within each class is a question of dataset construction. We argue that a dependence on prevalence within each group is undesirable: it creates disparities that do not reflect models’ errors but, rather, reflect correlations between label and group. Consequently, we argue that assessments should either focus on TPR/FPR discrepancies or guarantee the same proportion of positive and negative examples for every group when using precision or recall.
Accuracy is less suitable than precision/recall or TPR/FPR for computing per-label disparities: it suffers from the same drawback as precision since
| (2) |
while also having a low sensitivity to TPR when is small (often the case in object classification).
Choice E: Ranking vs classification metrics. Modern computer vision systems based on neural networks do not directly output binary classifications: models produce confidence scores for each label, and practitioners select decision thresholds to determine whether a label is present. The choice of the thresholds is application-dependent (Fawcett, 2006) and requires additional data and rules for models such as CLIP, where the scores do not have a meaningful scale (Agarwal et al., 2021). Since there is no clear definition of a “good” threshold, ranking metrics are often used for fairness assessments.
The common metrics are the area under the ROC curve (AUC-ROC) (Fawcett, 2006) and the average precision (AP). The ROC curve plots TPR as a function of FPR for classifiers obtained by varying the threshold from minimum to maximium score. AUC-ROC is the area under this curve. AP is an approximation of the area under the precision-recall curve (Davis and Goadrich, 2006; Su et al., 2015), which computes the mean of the precision at each threshold for which there is an increment in recall. AP is often preferred over AUC-ROC on imbalanced data for the same reason precision/recall is preferred to FPR/TPR analysis, but it suffers from the same drawback when computing disparities, i.e. a heavy dependence on prevalence. As with precision/recall, we argue that computing disparities using AP requires sampling the same number of positive/negative examples for each group and demonstrate the effects of doing so empirically in Case Study #1 and Case Study #2.
3.3. Data sampling
The last step in measurement is determining which images and labels to use.
Choice F: Filtering rare labels. It is not possible to provide statistically reliable estimates of disparities for rare labels. A standard solution is to remove labels with less than occurrences, where is chosen as a trade-off between the size of confidence intervals and coverage of data.
Choice G: Controlling for uneven label correlations. As explained when discussing metrics above, it is desirable to resample, for each label, the positive and negative class for each group to ensure the prevalence is the same across groups when using precision-based metrics (including AP). More generally, confusion matrices are non-uniform, and some labels are more easily confused with each other. This means, for every metric, each change in label distribution across groups can affect observed disparities. In multi-label data, label correlations differ per group (for instance, “suit” and “tie” may co-occur more within images of people who are perceived to be men than people who are perceived to be women), and controlling for the marginal distribution of each label is not enough. It is difficult to achieve, through selective sampling, a target distribution of labels (including co-occurrences) for all groups in the case of multi-label data. In this work, we focus solely on controlling positive and negative class ratios across groups, without fixing the true label distribution to ensure the same distribution of co-occurring concepts.
4. Case Study #1: Evaluating a Single Zero-Shot Model
In this section, we investigate how the design choices discussed in Section 3 affect observations of demographic disparities in a multi-label classifier. We begin with a baseline protocol (denoted as Baseline Evaluation) that follows prior work, then adapt the measurement methods for several design choices with the goal of evaluations that better capture model performance. The intermediate evaluations are denoted as Evaluation V[X] and the last iteration is denoted as the Reliable Evaluation method. While the Reliable Evaluation method is by no means the only or best form of evaluation, it addresses some weakness of the Baseline Evaluation (discussed in the Results section below) and allows for an insightful exploration of model performance disparities (discussed in Section 6).
4.1. Evaluation set-up
We focus our work on the CLIP ViT-B/32 (Radford et al., 2021), which jointly trains an image encoder and text encoder to enable zero-shot classification. While previous works have evaluated CLIP’s performance between demographic groups (Agarwal et al., 2021; Radford et al., 2021; Hall et al., 2023; Dehouche, 2021; Wolfe et al., 2022), there has been little discussion of how the method of assessment affects observed disparities. Following (Hall et al., 2023), we aim to identify concepts for which CLIP performs disparately between gender-based groups.
Data selection
Choice A: Data source. As explained in Section 3, there are no existing datasets with explicit, human-collected annotations for multiple objects per image and gender-based groups. We follow (Zhao et al., 2017; Wang et al., 2019; Wang and Russakovsky, 2021; Hall et al., 2023) and use the Visual Genome (Krishna et al., 2017) and MS-COCO (Lin et al., 2014) datasets. The Visual Genome contains 108k images, where each image is annotated with a set of bounding boxes and object labels. The labels correspond to synsets from WordNet (Miller, 1994), and each synset is a node representing a singular concept. COCO has 123k images containing bounding boxes for 80 objects and 5 captions per image. To prevent overlap, we filter out all images from COCO that are in the Visual Genome.
Choice B: Operationalization of groups. The Visual Genome and MS-COCO do not contain explicit group annotations. (Zhao et al., 2017; Wang et al., 2019; Wang and Russakovsky, 2021; Hall et al., 2023) use pre-existing object labels and captions to determine binary gender groups for images. We follow these works to investigate how this methodology can affect observed disparities. However, we note that definitions of demographic groups that categorize intrinsically continuous personal attributes have the potential for harm, and this is exacerbated when the mapping is performed by an external party (Scheuerman et al., 2019). Furthermore, the binarization of gender is exclusive of other genders (Devinney et al., 2022) as well as images that contain multiple groups. We use the term gender with groups {man, woman} to convey our specific operationalization of groups.
For our first evaluation, Evaluation Baseline, we follow previous work (Zhao et al., 2017; Wang et al., 2019; Wang and Russakovsky, 2021; Hall et al., 2023) and use a list of gender-based terms (see Appendix 9.1.1) to assign gender groups to each image. Images with multiple group labels are removed. We initially include all bounding boxes containing gender-based terms when determining groups for the Visual Genome111Because we only use captions for determining groups with COCO, filtering by annotation size is not relevant..
We find many of these bounding boxes are small with respect to the overall image size, likely making these annotations less reliable. With small bounding boxes, information related to gender presentation has low salience and the potential for annotator bias increases. Therefore, our next two evaluations focus on bounding box sizes. In Evaluation V1 we follow (Hall et al., 2023) and require that bounding boxes are 600+ pixels. In Evaluation V2 we use an alternative filtering schema in place of pixels: images must contain at least one gender annotation that fills 5+% of the image and can have gender annotations smaller than 2% of the image. We do not use the latter annotations for assigning groups. Focusing on relative instead of absolute bounding box sizes is helpful for the Visual Genome where not all images are the same size.
Our next evaluation, Evaluation V3, focuses on terms associated with gender in images that do not actually contain humans. For example, large and small animal pairings are frequently tagged with “mother” and “child” terms, adding noise to our evaluation. We remove the gender terms related to this relationship, denoted in Appendix 9.1.1.
Choice C: Data & model class mapping. The Visual Genome contains human-labeled, free-form object annotations that are mapped to canonicalized synsets using the WordNet (Miller, 1994) hierarchy, such as “dress.n.01” or “bat.n.05.” To reduce noise of multiple labels referring to the same object and increase our per-concept sample size, we use the synset mappings of each object label. For MS-COCO, we use object categories provided in the dataset, such as “person” or “bicycle”.
Because of CLIP’s zero-shot capability, the Visual Genome and MS-COCO labels do not need to be mapped to CLIP-compatible classes. Following standard practice, we leverage prompt engineering (Radford et al., 2021; Hall et al., 2023) to average CLIP predictions across 80 templates for each class, corresponding to phrases like “a photo of my ” and “an origami .” We truncate the synset texts to include only the text corresponding to the object itself and replace underscores with spaces.
Performance metric
Choice D: Choosing the family of metrics. To understand the interplay between metric and sampling, we include both average precision (AP) and true positive rate/false positive rate (TPR/FPR).
Choice E: Ranking vs classification metrics. Average precision is a ranking metric and does not require a threshold. TPR and FPR both require thresholding CLIP’s output, which is a similarity score between the labels and images. To determine this threshold, for each evaluation we split the data into a 20%/80% validation-test split and pick a threshold for each concept that maximizes the F1-score on the validation split, disallowing labeling everything as negative.
Data sampling
Choice F: Filtering rare labels. Following (Hall et al., 2023), in the Evaluation Baseline we remove concepts with less than 50 images per group and images without labels, yielding 364 concepts for the Visual Genome and 72 concepts MS-COCO.
Choice G: Controlling for correlations. In the Evaluation Baseline, we follow (Hall et al., 2023; Zhao et al., 2017) and do not perform additional sub-sampling. However, as discussed in Section 3, AP has a heavy dependence on prevalence. In the Reliable Evaluation we build on our previous adaptations and introduce a sampling ratio of 1:5 positive to negative samples for each group to attempt to control for variations in prevalence between groups. We also require that all objects use this same ratio to additionally control for variations in prevalence among concepts. This ratio allows us to include all possible concepts while still ensuring a reasonable number of samples. For each concept, we determine the maximum number of samples such that each group can have the same number of samples and maintain our desired sampling ratio. For each group, we select positive and negative samples randomly, maintaining the desired sampling ratio and sampling with replacement to perform bootstrapping. We explain our construction of confidence intervals in Appendix 9.1.2.
4.2. Results
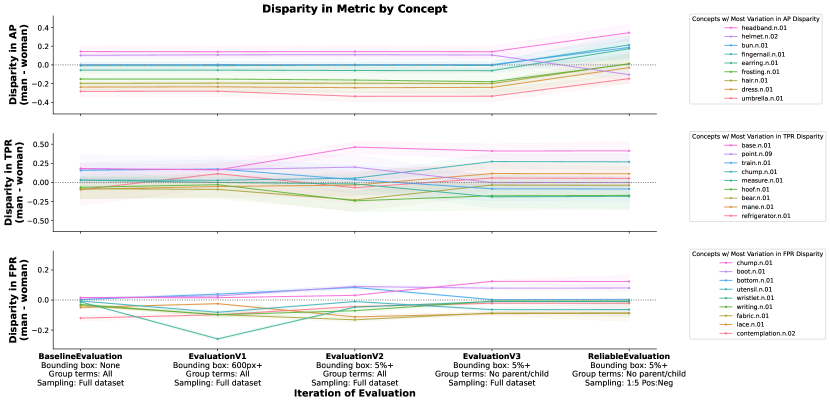
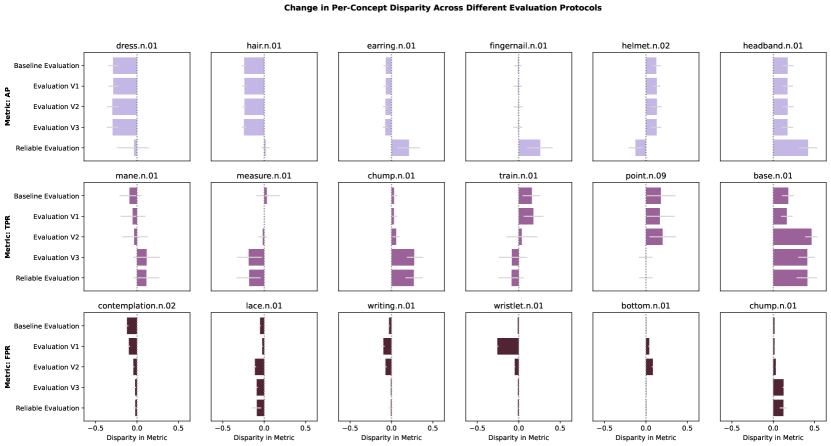
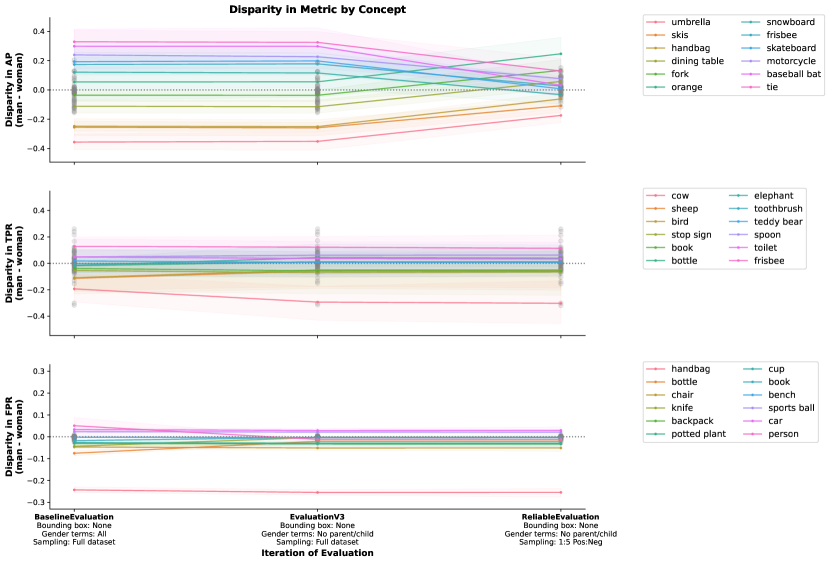
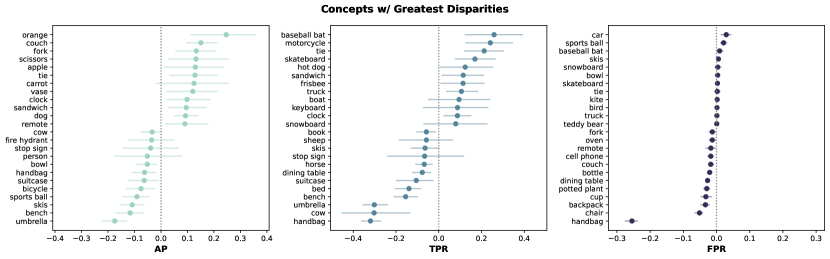
We now discuss variations in disparities between Evaluation Versions across our metrics (Choice D). Figure 2 shows concepts with the greatest changes in measurements for the Visual Genome.
First, we find that FPR and TPR are more susceptible than AP to the choice of terms and bounding box sizes used for operationalizing groups (Choice B). For example, disparities in TPR and FPR for concepts like base.n.01 and lace.n.01, respectively, increase when filtering out small gender bounding boxes, and disparities in FPR for wristlet.n.01 have significant and then insignificant demographic disparities as the filtering changes. Upon further inspection, we find that variation in thresholds caused by the filtering of samples may explain these disparities (Choice E). Furthermore, disparities in some animal annotations like bear.n.01 shrink when filtering out parent and child annotations that are often annotated for animals.
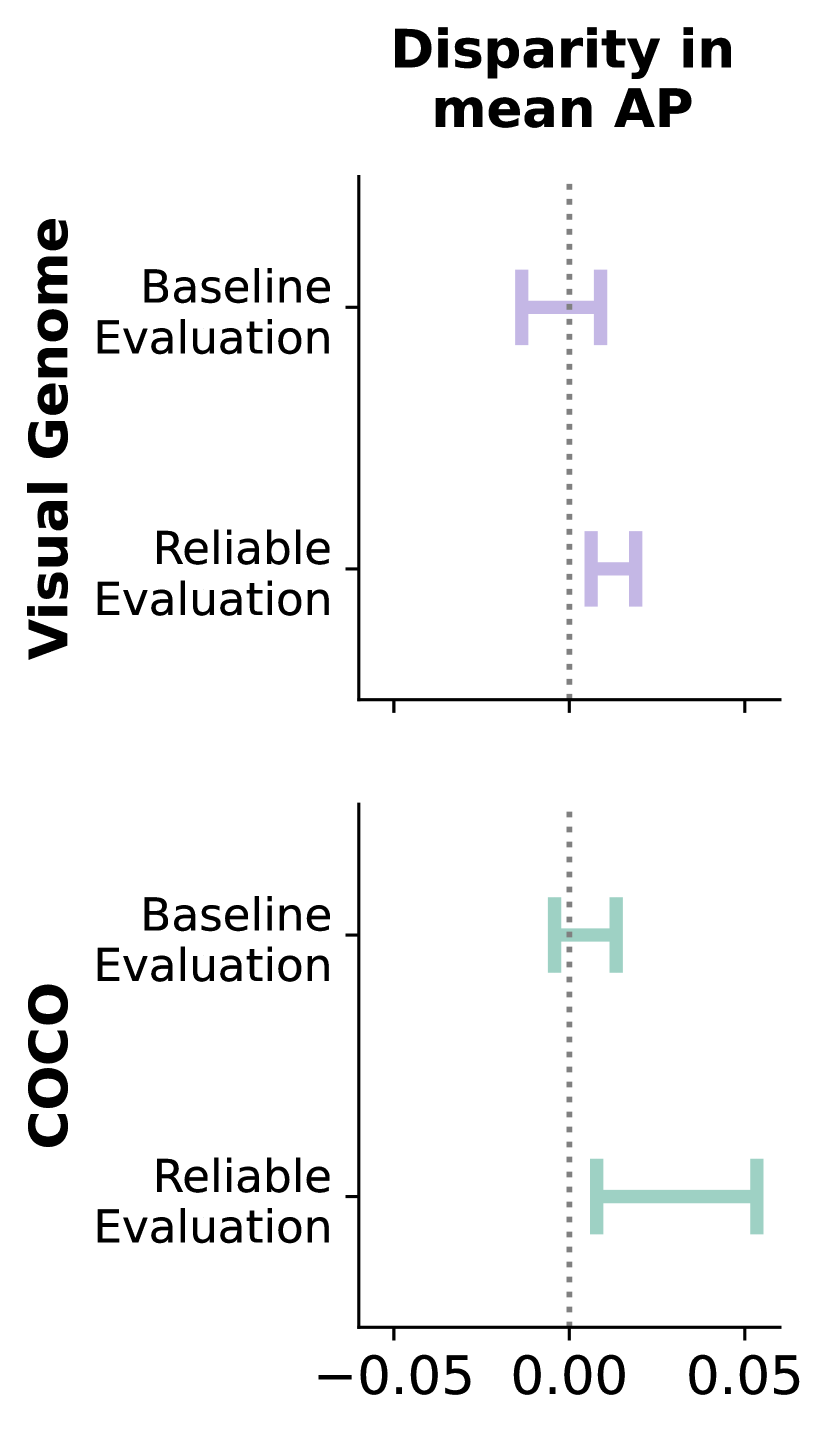
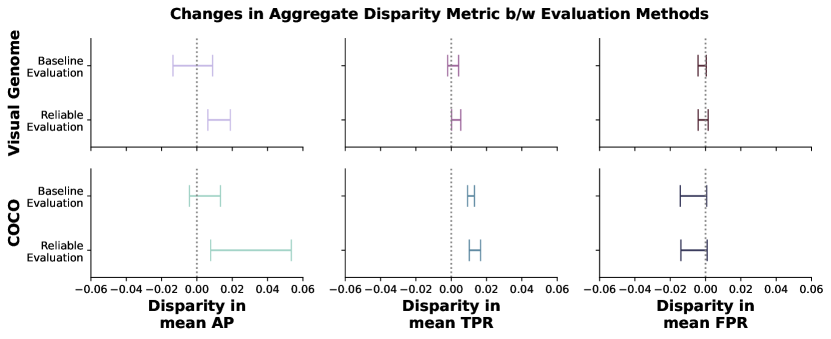
Second, TPR and FPR are less affected by correlations between prevalence and groups (Choice G) than AP. For AP, many concepts that initially showed better performance for group woman (such as umbrella.n.01, dress.n.01, and hair.n.01) have smaller or no disparities when using a fixed sampling ratio. Disparities for some concepts like earring.n.01 and helmet.n.02 switch, showing better performance for the other group. Furthermore, conclusions about disparities in average precision over all concepts change between evaluation methods (left-side of Figure 3): the Baseline Evaluation does not show a significant disparity between the two groups, whereas the Reliable Evaluation method shows better performance for group man. Patterns are similar for MS-COCO, shown in Appendix 9.1.3.
This Case Study shows the important relationship between average precision and sampling: when measuring with average precision, the magnitude and direction of disparities for many concepts are greatly affected when controlling for the ratio of positive and negative samples between groups. Furthermore, while the Evaluation Baseline shows no disparity in overall performance between groups, a notable disparity appears when controlling for the proportion of positive and negative samples between groups. Finally, the terminology and bounding box size used for operationalizing gender affects the existence and size of disparities for individual concepts.
These findings suggest that practitioners should aim for similar prevalences between groups when performing measurements with average precision. In addition, when assigning groups based on existing annotations we recommend performing manual inspections to ensure labels were applied in a way that is representative of the real-life groups that are the focus of measurement and that annotators used the terms with consistency according to information present in the image. Finally, disaggregating measurements across individual concepts is necessary for identifying large disparities that can be masked by summary metrics.
5. Case Study #2: Evaluating Multiple Models across Training Paradigms
For this second case study, we perform a comparison of geographic disparities using a vision transformer and convolutional neural network.
5.1. Evaluation set-up
Following (Goyal et al., 2022b, a), we select models that are both pre-trained and fine-tuned with ImageNet-22K but have different architectures. For the vision transformer we use ViT (Dosovitskiy et al., 2020) and for the convolutional model we use TResNet (Ridnik et al., 2021b), both optimized for ImageNet-22K classes following (Ridnik et al., 2021a). We explore how evaluation choices using the Dollar Street dataset affect disparity findings both at the individual model level and between models.
Data selection
Choice A: Data source. We use the Dollar Street (Gapminder, 2021) dataset, which has been used extensively to evaluate models for biases across geographic regions (De Vries et al., 2019; Singh et al., 2022; Goyal et al., 2022b; Rojas et al., 2022). It contains images of people and objects across the globe that are labeled based on the country where they were taken. Some images are duplicated with multiple labels; we collapse these so that each image only appears once, creating a multi-label classification set-up. We remove all images without labels.
Choice B: Operationalization of groups. Following (Goyal et al., 2022b), we focus on the continent where the photo was taken and map countries to continents and create groups: Africa, Asia, Europe, and the Americas (North and South America). Because the country information is provided by the photo uploader, we have high confidence that the group information is correct and therefore do not perform any filtering based on group information.
Choice C: Data & model class mappings. Because these models are not zero shot, we need to map the Dollar Street labels to the object classes the models were trained on. We perform two baseline evaluations with different mappings from Dollar Street to ImageNet: Baseline Evaluation (ImageNet-22K), where we map to ImageNet-22K classes following (Goyal et al., 2022b), and Baseline Evaluation (ImageNet-1K), where we map to ImageNet-1K classes following (Rojas et al., 2022). Examples of the mappings for both ImageNet-[22/1]K classes are shown in Appendix 9.2.1. These models predict only a subset of the ImageNet classes (Ridnik et al., 2021a), so we remove any incompatible concepts.
Performance metric
Choice D: Choosing the family of metrics. We evaluate disparities using hit-rate, where an image is a hit if one of the top-5 predictions is correct (Goyal et al., 2022b). Because hit-rate does not extend to per-concept measurements and the number of concepts per image varies, we also use average precision (AP).
Choice E: Ranking vs classification metrics. Both hit-rate and AP are ranking metrics and do not require a threshold.
Data sampling
Choice F: Filtering rare labels. Dollar Street’s small size and large quantity of groups introduces a tradeoff between coverage and noise. Initially, we follow (Goyal et al., 2022b) and evaluate all concepts. However, to reduce noise in our measurements, we remove concepts with less than 30 samples per group.
Choice G: Controlling for correlations. We initially follow (Goyal et al., 2022b; Rojas et al., 2022; De Vries et al., 2019) and do not perform additional sampling. However, in our Reliable Evaluation we follow the sampling method described in Case Study #1 with a sampling ratio of 1:4. We construct confidence intervals using bootstrapping, as described in Appendix 9.2.3.
5.2. Results
We investigate how different Evaluation Versions affect disparity findings.
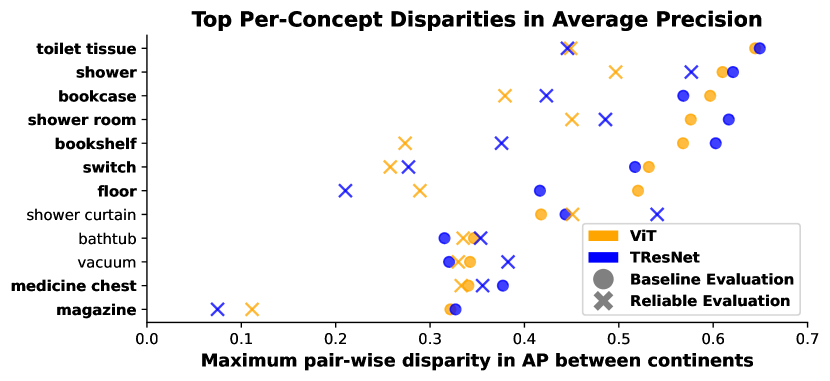
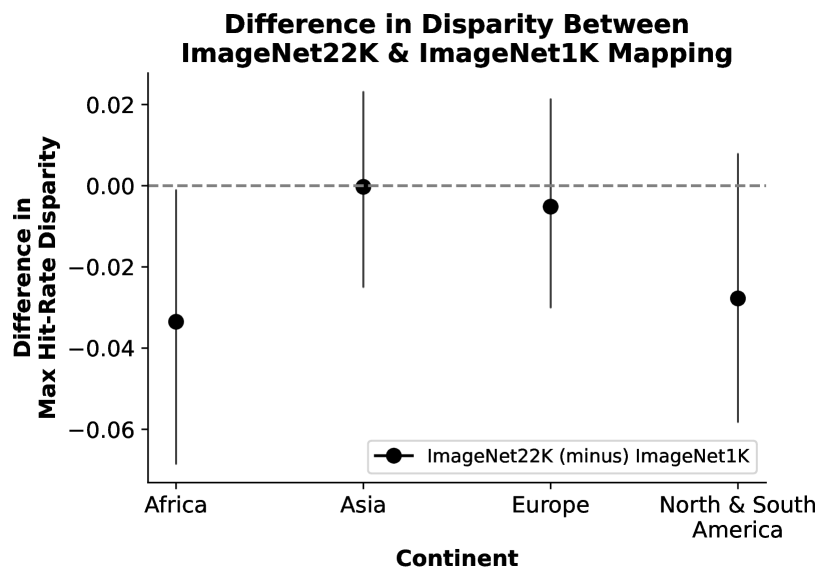
The left-side of Figure 4 shows that the comparison of disparities between ViT and TResNet are affected by correlations between prevalence and groups (Choice G) and that disparities tend to decrease across both models with the Reliable Evaluation method. Furthermore, the degree to which one model is better than the other can change between evaluation methods, as shown for concepts like shower curtain and comb. For other concepts like bookcase, the model that has the greater disparity changes based on which evaluation method is used. In Appendix 9.2.2, we also show that without removing rare concepts (Choice F), many of the largest disparities are for concepts with few samples. Finally, the mappings between dataset labels and model classes (Choice C) affect a single model’s disparity findings. The right-side of Figure 4 shows the difference in per-continent disparity between the two Dollar Street to ImageNet mappings when evaluating ViT. The magnitude of the performance disparities in ViT is larger for Africa when using the ImageNet1K class mappings than when using the ImageNet22K class mappings, indicating that the alignment of dataset classes to model classes can affect the magnitude of observed disparities.
This Case Study reinforces the importance of sampling when using average precision and shows that sampling also affects how much one model is better than another. Furthermore, the mapping of dataset labels to model classes affects the magnitude of observed disparities.
These findings suggest that practitioners should filter out concepts that have too few samples for each group when using Dollar Street. In addition, multiple mappings between dataset and model classes and their tradeoffs between coverage and alignment should be considered carefully.
6. Root Cause Analyses of Large-Disparity Concepts
40
| Low imageability: Concept is not concrete and is hard to portray with visual representations |
| background.n.02 (Visual Genome) \tab\tab\tab\tab\tab\tab\tab\tabmeasure.n.01 (Visual Genome) |
 \tab
\tab
|
| Indiscernible: Cannot determine if concept is present and may encourage use of biased shortcuts |
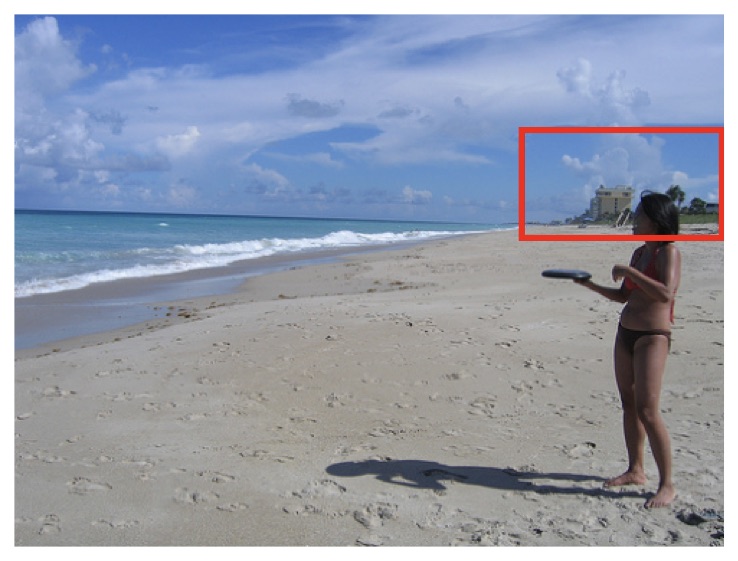
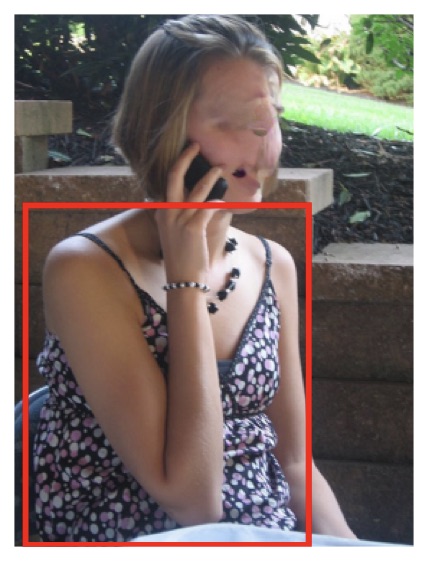
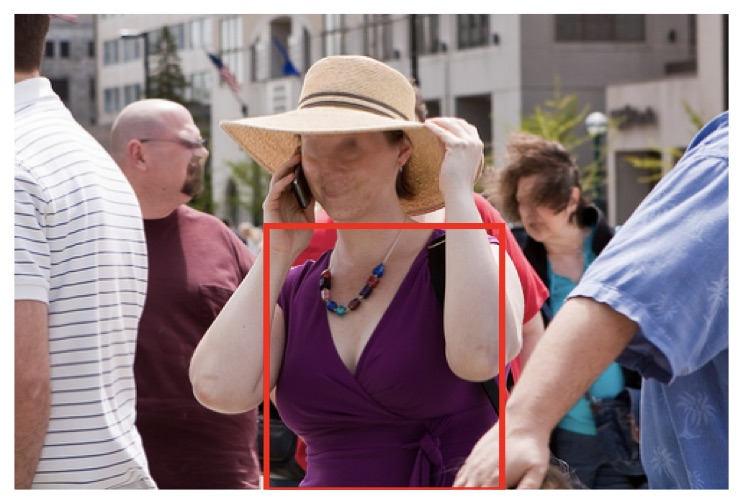
| dress.n.01 (Visual Genome) \tabfloor (Dollar Street) \tab\tab\tabhandbag (COCO) |
 \tab
\tab
 \tab
\tab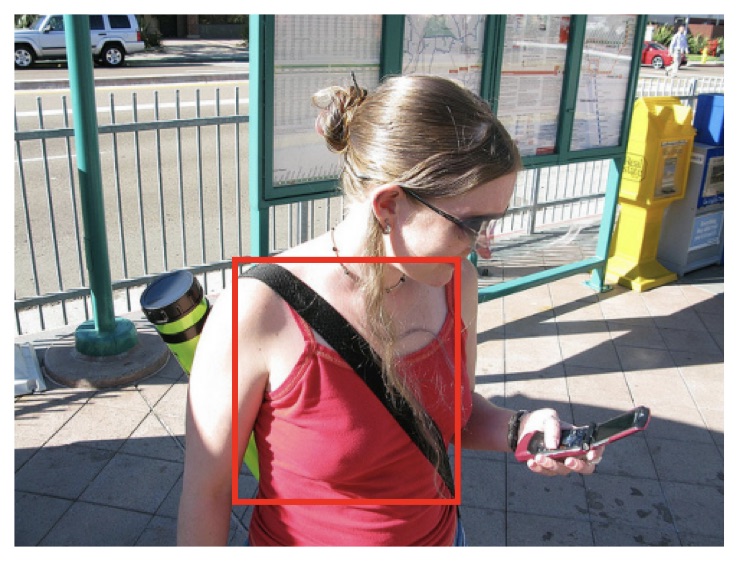
|
| Ambiguous definitions: Labels capture multiple valid definitions and can vary between groups |
| base.n.01 (Visual Genome) \tab\tab\tab\tabshower (Dollar Street) \tab\tab tie (COCO) |


|
| Incorrect labels: Pictured objects do not align with concept definition, which may reflect the majority |
| necktie.n.01 (Visual Genome) \tab toilet_paper (Dollar Street) \tabspectacles.n.01 (Visual Genome) |


 \tab\tab
|
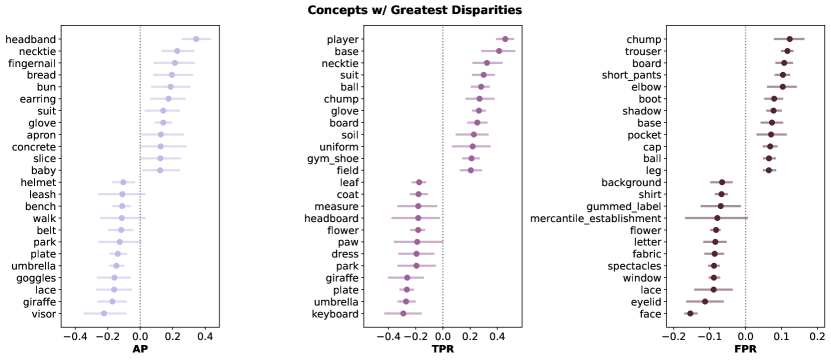
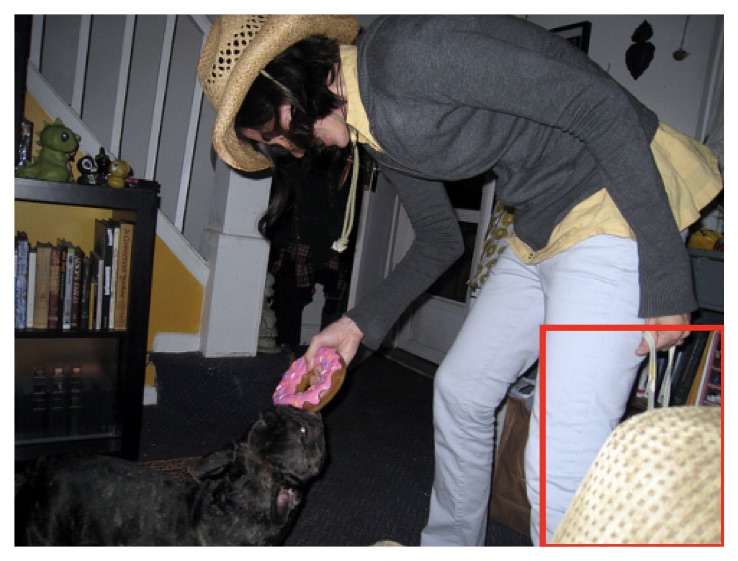
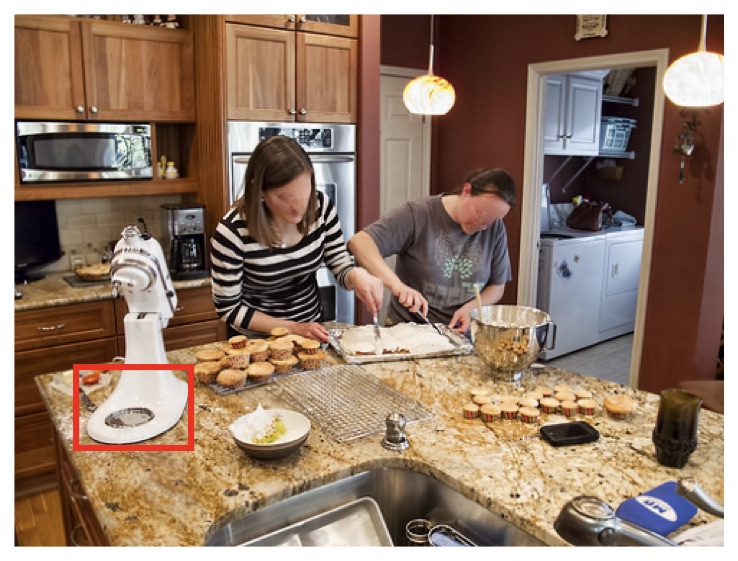
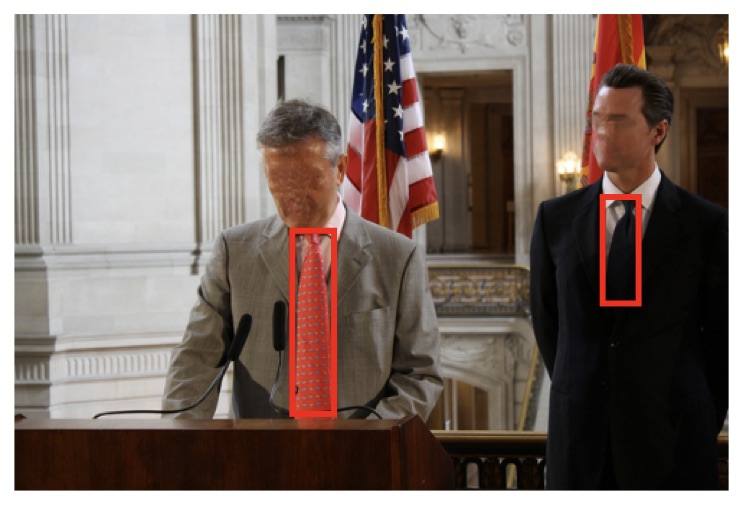
In the previous two sections, we showed how choices employed in evaluations affect observed demographic disparities in CLIP, ViT, and TResNet. These investigations led to more Reliable Evaluation methods, which themselves have trade-offs, as discussed in Section 3. However, they can provide high-level insights about model performance between groups. In this Section, we qualitatively investigate concepts with large disparities in performance observed with our Reliable Evaluation measurements (shown in Figures 3, 4, & 10). We find that they can have multiple or malleable definitions, especially between groups. Often, representations have low imageability, are indiscernible, have ambiguous definitions, or contain incorrect labels. These patterns are not mutually exclusive and can affect demographic groups differently. Figure 5 summarizes these variations, and we discuss more below.
First, some concepts have low imageability, i.e. they are difficult to portray with visual representations. This relates to “concreteness,” which measures the amount that a concept refers to a perceptible entity. Using an existing ranking of concreteness among 40,000 English lemmas (Brysbaert et al., 2014), we observe that some concepts with large performance disparities have lower concreteness: background.n.02 and measure.n.01 have concreteness ratings of 3.26/5.00 and 3.59/5.00, respectively, while most objects have a rating above 4.50/5.00. Figure 5 shows that backgrounds are not consistently delineated, and photos for measure.n.01 often represent stair steps rather than a “maneuver made as part of progress toward a goal” (Miller, 1994).
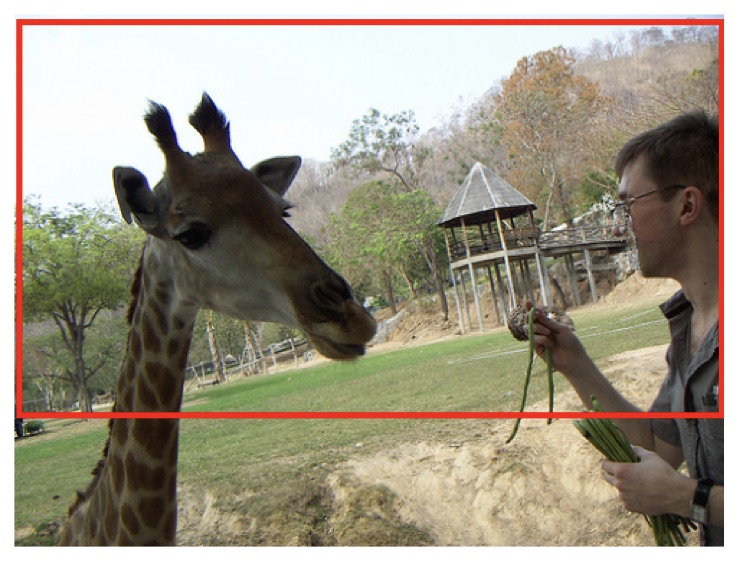
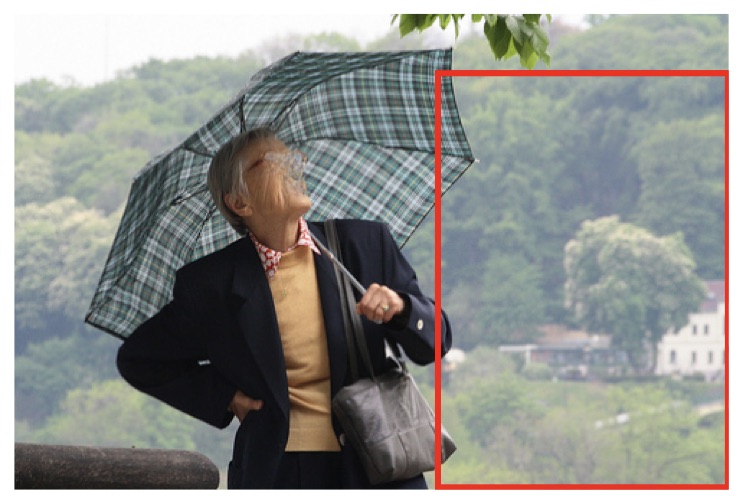
Second, whether the concept is present in the image may be indiscernible, forcing the viewer to use other context in the image. This could lead to bias amplification (Zhao et al., 2017; Hall et al., 2022; Wang and Russakovsky, 2021). For example, annotators label concepts dress.n.01 and handbag in images containing woman annotations, even when it is impossible to discern between a dress and a shirt, or a handbag and straps, respectively. Even if the image source provides labels, the image may not capture whether the concept is present: many photos of floors in Dollar Street do not contain grounding visuals like walls or furniture.
Third, some concepts have ambiguous definitions and labelers employ multiple distinct, valid interpretations of concrete concepts. This often happens along group lines, where the same label is used for different objects for different groups. For example, annotations for the concept base.n.01 tend to more frequently capture a baseball field base for images within the man group and the structural foundation of an object for images with the woman group. Tie includes decorative ties around the waist when co-occurring with the woman group but rarely with the man group. Within Dollar Street, approximately 30% of images of showers taken in Asia show a bucket or basin rather than an elevated shower head or hose, as opposed to less than 5% of images taken in Europe.
Finally, some concepts have incorrect labels where the pictured object does not align with the concept definitions. The labels may misalign more frequently for minority groups or represent the perspective of an advantaged group. For example, annotations of necktie.n.01 include hair-ties when co-occurring with the woman group much more than with the man group, and photos from Asia of toilet_paper often feature water sources devoid of paper sheets. If one considers hair-ties distinct from neckties, and toilet paper different than buckets of water, then in these cases a model’s observed performance disparity may relate more to a misalignment between a concept definition and a group than its inability to identify variants of the same object between two groups.
Furthermore, Appendix 9.3 shows that the Visual Genome and MS-COCO often depict the woman group in art or historical pieces, which can affect the classification difficulty between groups (Wang and Deng, 2018).
Our analyses suggest possible mitigations to improve performance between groups. For example, in training datasets, developers can clarify guidelines regarding missing information in images so that labelers need not rely on (potentially biased) inferences based on incomplete visual references. In addition, label definitions can be made more explicit to avoid ambiguous or incompatible meanings, or expanded to account for groups beyond predominant perspectives. Classes with low imageability may also be removed from model training if found to be unreliably annotated. When used for evaluation datasets, these changes could also improve the reliability of measurements.
7. Conclusion
In this work, we outlined key choices and tradeoffs for disaggregated evaluations of multi-label object recognition models across demographic groups and showed that they have fundamental complexities not seen in single concept binary classifiers.
We first described important design choices that span data selection, performance metrics, and sampling. These choices require thoughtful consideration of many tradeoffs, including annotation cost and quality, group coverage and specificity, and confounders between groups and label distributions. In two Case Studies, we showed that these evaluation choices affect the existence, magnitude, and direction of observed disparities for individual concepts and in aggregate. This yielded actionable guidance for practitioners, such as fixing the ratio of positive and negative samples between groups when using average precision and performing mappings between dataset and model labels with care. Finally, we identified potential root causes of disparities that exist even with more reliable evaluations, including low imageability concepts and ambiguous definitions, and suggested mitigations such as improved labeling guidelines for missing visual references.
This work captures only a subset of the decisions that can affect disparity analyses of multi-label, multi-class computer vision models. There remain many challenges in performing these evaluations, including the aforementioned complexities in concept definition and representation as well as non-trivial trade-offs involved in operationalizing groups and controlling for correlations between co-occurring labels and groups. As practitioners work towards identifying and reducing disparities in performance of multi-label object recognition models and image classifiers, we hope this is a meaningful step towards more reliable and insightful evaluations.
8. Acknowledgments
We thank Aaron Adcock, Alex Vaughan, Ishan Misra, Enpeng Yuan, Hailey Nguyen, Tsung-Yu Lin, Mannat Singh, Levent Sagun, Hervé Jegou, and Megan Richards for their feedback on this work.
References
- (1)
- Agarwal et al. (2021) Sandhini Agarwal, Gretchen Krueger, Jack Clark, Alec Radford, Jong Wook Kim, and Miles Brundage. 2021. Evaluating clip: towards characterization of broader capabilities and downstream implications. arXiv preprint arXiv:2108.02818 (2021).
- Angwin et al. (2016) Julia Angwin, Jeff Larson, Surya Mattu, and Lauren Kirchner. 2016. Machine bias. In Ethics of Data and Analytics. Auerbach Publications, 254–264.
- Barocas et al. (2021) Solon Barocas, Anhong Guo, Ece Kamar, Jacquelyn Krones, Meredith Ringel Morris, Jennifer Wortman Vaughan, W Duncan Wadsworth, and Hanna Wallach. 2021. Designing disaggregated evaluations of ai systems: Choices, considerations, and tradeoffs. In Proceedings of the 2021 AAAI/ACM Conference on AI, Ethics, and Society. 368–378.
- Bender and Koller (2020) Emily M. Bender and Alexander Koller. 2020. Climbing towards NLU: On Meaning, Form, and Understanding in the Age of Data. In Proceedings of the 58th Annual Meeting of the Association for Computational Linguistics. Association for Computational Linguistics, Online, 5185–5198. https://doi.org/10.18653/v1/2020.acl-main.463
- Benthall and Haynes (2019) Sebastian Benthall and Bruce D Haynes. 2019. Racial categories in machine learning. In Proceedings of the conference on fairness, accountability, and transparency. 289–298.
- Beyer et al. (2020) Lucas Beyer, Olivier J. Hénaff, Alexander Kolesnikov, Xiaohua Zhai, and Aäron van den Oord. 2020. Are we done with ImageNet? CoRR abs/2006.07159 (2020). arXiv:2006.07159 https://arxiv.org/abs/2006.07159
- Birhane et al. (2022) Abeba Birhane, Pratyusha Kalluri, Dallas Card, William Agnew, Ravit Dotan, and Michelle Bao. 2022. The Values Encoded in Machine Learning Research. In 2022 ACM Conference on Fairness, Accountability, and Transparency (Seoul, Republic of Korea) (FAccT ’22). Association for Computing Machinery, New York, NY, USA, 173–184. https://doi.org/10.1145/3531146.3533083
- Bowker and Star (2000) Geoffrey C. Bowker and Susan Leigh Star. 2000. Sorting Things Out: Classification and Its Consequences. The MIT Press. https://doi.org/10.7551/mitpress/6352.001.0001
- Brysbaert et al. (2014) Marc Brysbaert, Amy Beth Warriner, and Victor Kuperman. 2014. Concreteness ratings for 40 thousand generally known English word lemmas. Behavior research methods 46, 3 (2014), 904–911.
- Buolamwini and Gebru (2018) Joy Buolamwini and Timnit Gebru. 2018. Gender shades: Intersectional accuracy disparities in commercial gender classification. In Conference on fairness, accountability and transparency. PMLR, 77–91.
- Chouldechova (2017) Alexandra Chouldechova. 2017. Fair prediction with disparate impact: A study of bias in recidivism prediction instruments. Big data 5, 2 (2017), 153–163.
- Davis and Goadrich (2006) Jesse Davis and Mark Goadrich. 2006. The relationship between Precision-Recall and ROC curves. In Proceedings of the 23rd international conference on Machine learning. 233–240.
- De Vries et al. (2019) Terrance De Vries, Ishan Misra, Changhan Wang, and Laurens Van der Maaten. 2019. Does object recognition work for everyone?. In Proceedings of the IEEE/CVF Conference on Computer Vision and Pattern Recognition Workshops. 52–59.
- Dehouche (2021) Nassim Dehouche. 2021. Implicit Stereotypes in Pre-Trained Classifiers. IEEE Access 9 (2021), 167936–167947. https://doi.org/10.1109/ACCESS.2021.3136898
- Denton et al. (2021) Emily Denton, Alex Hanna, Razvan Amironesei, Andrew Smart, and Hilary Nicole. 2021. On the genealogy of machine learning datasets: A critical history of ImageNet. Big Data & Society 8, 2 (2021), 20539517211035955. https://doi.org/10.1177/20539517211035955 arXiv:https://doi.org/10.1177/20539517211035955
- Devinney et al. (2022) Hannah Devinney, Jenny Björklund, and Henrik Björklund. 2022. Theories of ”Gender” in NLP Bias Research. https://doi.org/10.48550/ARXIV.2205.02526
- Dieterich et al. (2016) William Dieterich, Christina Mendoza, and Tim Brennan. 2016. COMPAS risk scales: Demonstrating accuracy equity and predictive parity. Northpoint Inc (2016).
- Dodik et al. (2022) Ana Dodik, Silvia Sellán, Theodore Kim, and Amanda Phillips. 2022. Sex and Gender in the Computer Graphics Research Literature. arXiv preprint arXiv:2206.00480 (2022).
- Dosovitskiy et al. (2020) Alexey Dosovitskiy, Lucas Beyer, Alexander Kolesnikov, Dirk Weissenborn, Xiaohua Zhai, Thomas Unterthiner, Mostafa Dehghani, Matthias Minderer, Georg Heigold, Sylvain Gelly, Jakob Uszkoreit, and Neil Houlsby. 2020. An Image is Worth 16x16 Words: Transformers for Image Recognition at Scale. https://doi.org/10.48550/ARXIV.2010.11929
- Fawcett (2006) Tom Fawcett. 2006. An introduction to ROC analysis. Pattern recognition letters 27, 8 (2006), 861–874.
- Flores et al. (2016) Anthony W Flores, Kristin Bechtel, and Christopher T Lowenkamp. 2016. False Positives, False Negatives, and False Analyses: A Rejoinder to Machine Bias: There’s Software Used across the Country to Predict Future Criminals. And It’s Biased against Blacks. Fed. Probation 80 (2016), 38.
- Gapminder (2021) Gapminder. 2021. Dollar Street Dataset. https://www.gapminder.org/dollar-street. Accessed: 2023-01-24.
- Gölz et al. (2019) Paul Gölz, Anson Kahng, and Ariel D Procaccia. 2019. Paradoxes in fair machine learning. Advances in Neural Information Processing Systems 32 (2019).
- Goyal et al. (2022a) Priya Goyal, Quentin Duval, Isaac Seessel, Mathilde Caron, Mannat Singh, Ishan Misra, Levent Sagun, Armand Joulin, and Piotr Bojanowski. 2022a. Vision models are more robust and fair when pretrained on uncurated images without supervision. arXiv preprint arXiv:2202.08360 (2022).
- Goyal et al. (2022b) Priya Goyal, Adriana Romero Soriano, Caner Hazirbas, Levent Sagun, and Nicolas Usunier. 2022b. Fairness Indicators for Systematic Assessments of Visual Feature Extractors. In 2022 ACM Conference on Fairness, Accountability, and Transparency (Seoul, Republic of Korea) (FAccT ’22). Association for Computing Machinery, New York, NY, USA, 70–88.
- Grother et al. (2014) Patrick J Grother, Patrick J Grother, and Mei Ngan. 2014. Face recognition vendor test (frvt). US Department of Commerce, National Institute of Standards and Technology.
- Hall et al. (2023) Melissa Hall, Laura Gustafson, Aaron Adcock, Ishan Misra, and Candace Ross. 2023. Vision-Language Models Performing Zero-Shot Tasks Exhibit Gender-based Disparities. https://doi.org/10.48550/ARXIV.2301.11100
- Hall et al. (2022) Melissa Hall, Laurens van der Maaten, Laura Gustafson, and Aaron Adcock. 2022. A Systematic Study of Bias Amplification. CoRR abs/2201.11706 (2022). arXiv:2201.11706 https://arxiv.org/abs/2201.11706
- Hanna et al. (2020) Alex Hanna, Emily Denton, Andrew Smart, and Jamila Smith-Loud. 2020. Towards a critical race methodology in algorithmic fairness. In Proceedings of the 2020 conference on fairness, accountability, and transparency. 501–512.
- Hazirbas et al. (2021) Caner Hazirbas, Joanna Bitton, Brian Dolhansky, Jacqueline Pan, Albert Gordo, and Cristian Canton Ferrer. 2021. Towards measuring fairness in ai: the casual conversations dataset. IEEE Transactions on Biometrics, Behavior, and Identity Science (2021).
- Idrissi et al. (2022) Badr Youbi Idrissi, Diane Bouchacourt, Randall Balestriero, Ivan Evtimov, Caner Hazirbas, Nicolas Ballas, Pascal Vincent, Michal Drozdzal, David Lopez-Paz, and Mark Ibrahim. 2022. ImageNet-X: Understanding Model Mistakes with Factor of Variation Annotations. https://doi.org/10.48550/ARXIV.2211.01866
- Karkkainen and Joo (2021) Kimmo Karkkainen and Jungseock Joo. 2021. FairFace: Face Attribute Dataset for Balanced Race, Gender, and Age for Bias Measurement and Mitigation. In Proceedings of the IEEE/CVF Winter Conference on Applications of Computer Vision. 1548–1558.
- Kleinberg (2018) Jon Kleinberg. 2018. Inherent trade-offs in algorithmic fairness. In Abstracts of the 2018 ACM International Conference on Measurement and Modeling of Computer Systems. 40–40.
- Krishna et al. (2017) Ranjay Krishna, Yuke Zhu, Oliver Groth, Justin Johnson, Kenji Hata, Joshua Kravitz, Stephanie Chen, Yannis Kalantidis, Li-Jia Li, David A Shamma, et al. 2017. Visual Genome: Connecting language and vision using crowdsourced dense image annotations. International journal of computer vision 123, 1 (2017), 32–73.
- Kuznetsova et al. (2018) Alina Kuznetsova, Hassan Rom, Neil Alldrin, Jasper R. R. Uijlings, Ivan Krasin, Jordi Pont-Tuset, Shahab Kamali, Stefan Popov, Matteo Malloci, Tom Duerig, and Vittorio Ferrari. 2018. The Open Images Dataset V4: Unified image classification, object detection, and visual relationship detection at scale. CoRR abs/1811.00982 (2018). arXiv:1811.00982 http://arxiv.org/abs/1811.00982
- Lin et al. (2014) Tsung-Yi Lin, Michael Maire, Serge Belongie, James Hays, Pietro Perona, Deva Ramanan, Piotr Dollár, and C Lawrence Zitnick. 2014. Microsoft coco: Common objects in context. In European conference on computer vision. Springer, 740–755.
- Manning and Schutze (1999) Christopher Manning and Hinrich Schutze. 1999. Foundations of statistical natural language processing. MIT press.
- Miller (1994) George A. Miller. 1994. WordNet: A Lexical Database for English. In Human Language Technology: Proceedings of a Workshop held at Plainsboro, New Jersey, March 8-11, 1994. https://aclanthology.org/H94-1111
- Mohamed et al. (2020) Shakir Mohamed, Marie-Therese Png, and William Isaac. 2020. Decolonial AI: Decolonial Theory as Sociotechnical Foresight in Artificial Intelligence. Philosophy & Technology 33, 4 (jul 2020), 659–684. https://doi.org/10.1007/s13347-020-00405-8
- Phillips (2019) Ben Phillips. 2019. The Shifting Border Between Perception and Cognition. Noûs 53 (06 2019). https://doi.org/10.1111/nous.12218
- Radford et al. (2021) Alec Radford, Jong Wook Kim, Chris Hallacy, Aditya Ramesh, Gabriel Goh, Sandhini Agarwal, Girish Sastry, Amanda Askell, Pamela Mishkin, Jack Clark, et al. 2021. Learning transferable visual models from natural language supervision. In International Conference on Machine Learning. PMLR, 8748–8763.
- Raji and Buolamwini (2019) Inioluwa Deborah Raji and Joy Buolamwini. 2019. Actionable auditing: Investigating the impact of publicly naming biased performance results of commercial ai products. In Proceedings of the 2019 AAAI/ACM Conference on AI, Ethics, and Society. 429–435.
- Ramaswamy et al. (2023) Vikram V. Ramaswamy, Sing Yu Lin, Dora Zhao, Aaron B. Adcock, Laurens van der Maaten, Deepti Ghadiyaram, and Olga Russakovsky. 2023. Beyond web-scraping: Crowd-sourcing a geodiverse dataset. In arXiv preprint.
- Ridnik et al. (2021a) Tal Ridnik, Emanuel Ben-Baruch, Asaf Noy, and Lihi Zelnik-Manor. 2021a. ImageNet-21K Pretraining for the Masses. arXiv:2104.10972 [cs.CV]
- Ridnik et al. (2021b) Tal Ridnik, Hussam Lawen, Asaf Noy, Emanuel Ben Baruch, Gilad Sharir, and Itamar Friedman. 2021b. TResNet: High Performance GPU-Dedicated Architecture. In Proceedings of the IEEE/CVF Winter Conference on Applications of Computer Vision (WACV). 1400–1409.
- Rojas et al. (2022) William A Gaviria Rojas, Sudnya Diamos, Keertan Ranjan Kini, David Kanter, Vijay Janapa Reddi, and Cody Coleman. 2022. The Dollar Street Dataset: Images Representing the Geographic and Socioeconomic Diversity of the World. In Thirty-sixth Conference on Neural Information Processing Systems Datasets and Benchmarks Track.
- Saito and Rehmsmeier (2015) Takaya Saito and Marc Rehmsmeier. 2015. The Precision-Recall Plot Is More Informative than the ROC Plot When Evaluating Binary Classifiers on Imbalanced Datasets. PLOS ONE 10, 3 (03 2015), 1–21. https://doi.org/10.1371/journal.pone.0118432
- Scheuerman et al. (2019) Morgan Klaus Scheuerman, Jacob M. Paul, and Jed R. Brubaker. 2019. How Computers See Gender: An Evaluation of Gender Classification in Commercial Facial Analysis Services. Proceeding of ACM Human-Computer Interactions 3, CSCW, Article 144 (nov 2019), 33 pages.
- Schumann et al. (2021a) Candice Schumann, Susanna Ricco, Utsav Prabhu, Vittorio Ferrari, and Caroline Pantofaru. 2021a. A step toward more inclusive people annotations for fairness. In Proceedings of the 2021 AAAI/ACM Conference on AI, Ethics, and Society. 916–925.
- Schumann et al. (2021b) Candice Schumann, Susanna Ricco, Utsav Prabhu, Vittorio Ferrari, and Caroline Rebecca Pantofaru. 2021b. A Step Toward More Inclusive People Annotations for Fairness. In Proceedings of the AAAI/ACM Conference on AI, Ethics, and Society (AIES).
- Shankar et al. (2017) Shreya Shankar, Yoni Halpern, Eric Breck, James Atwood, Jimbo Wilson, and D Sculley. 2017. No classification without representation: Assessing geodiversity issues in open data sets for the developing world. arXiv preprint arXiv:1711.08536 (2017).
- Shankar et al. (2020) Vaishaal Shankar, Rebecca Roelofs, Horia Mania, Alex Fang, Benjamin Recht, and Ludwig Schmidt. 2020. Evaluating Machine Accuracy on ImageNet. In Proceedings of the 37th International Conference on Machine Learning (Proceedings of Machine Learning Research, Vol. 119), Hal Daumé III and Aarti Singh (Eds.). PMLR, 8634–8644. https://proceedings.mlr.press/v119/shankar20c.html
- Singh et al. (2022) Mannat Singh, Laura Gustafson, Aaron Adcock, Vinicius de Freitas Reis, Bugra Gedik, Raj Prateek Kosaraju, Dhruv Mahajan, Ross Girshick, Piotr Dollár, and Laurens van der Maaten. 2022. Revisiting Weakly Supervised Pre-Training of Visual Perception Models. In Proceedings of the IEEE/CVF Conference on Computer Vision and Pattern Recognition (CVPR). 804–814.
- Stock and Cisse (2017) Pierre Stock and Moustapha Cisse. 2017. ConvNets and ImageNet Beyond Accuracy: Understanding Mistakes and Uncovering Biases. https://doi.org/10.48550/ARXIV.1711.11443
- Su et al. (2015) Wanhua Su, Yan Yuan, and Mu Zhu. 2015. A relationship between the average precision and the area under the ROC curve. In Proceedings of the 2015 International Conference on The Theory of Information Retrieval. 349–352.
- Tomasev et al. (2021) Nenad Tomasev, Kevin R. McKee, Jackie Kay, and Shakir Mohamed. 2021. Fairness for Unobserved Characteristics: Insights from Technological Impacts on Queer Communities. In Proceedings of the 2021 AAAI/ACM Conference on AI, Ethics, and Society. ACM. https://doi.org/10.1145/3461702.3462540
- Wang et al. (2022) Angelina Wang, Alexander Liu, Ryan Zhang, Anat Kleiman, Leslie Kim, Dora Zhao, Iroha Shirai, Arvind Narayanan, and Olga Russakovsky. 2022. REVISE: A tool for measuring and mitigating bias in visual datasets. International Journal of Computer Vision (2022), 1–21.
- Wang and Russakovsky (2021) Angelina Wang and Olga Russakovsky. 2021. Directional Bias Amplification. https://doi.org/10.48550/ARXIV.2102.12594
- Wang and Deng (2018) Mei Wang and Weihong Deng. 2018. Deep Visual Domain Adaptation: A Survey. CoRR abs/1802.03601 (2018). arXiv:1802.03601 http://arxiv.org/abs/1802.03601
- Wang et al. (2019) Tianlu Wang, Jieyu Zhao, Mark Yatskar, Kai-Wei Chang, and Vicente Ordonez. 2019. Balanced datasets are not enough: Estimating and mitigating gender bias in deep image representations. In Proceedings of the IEEE/CVF International Conference on Computer Vision. 5310–5319.
- Wolfe et al. (2022) Robert Wolfe, Mahzarin R. Banaji, and Aylin Caliskan. 2022. Evidence for Hypodescent in Visual Semantic AI. https://doi.org/10.48550/ARXIV.2205.10764
- Yun et al. (2021) Sangdoo Yun, Seong Joon Oh, Byeongho Heo, Dongyoon Han, Junsuk Choe, and Sanghyuk Chun. 2021. Re-labeling ImageNet: from Single to Multi-Labels, from Global to Localized Labels. CoRR abs/2101.05022 (2021). arXiv:2101.05022 https://arxiv.org/abs/2101.05022
- Zhao et al. (2017) Jieyu Zhao, Tianlu Wang, Mark Yatskar, Vicente Ordonez, and Kai-Wei Chang. 2017. Men Also Like Shopping: Reducing Gender Bias Amplification using Corpus-level Constraints. In Proceedings of the 2017 Conference on Empirical Methods in Natural Language Processing. Association for Computational Linguistics, Copenhagen, Denmark, 2979–2989. https://aclanthology.org/D17-1323
9. Appendix
9.1. Additional Details: Case Study #1
9.1.1. Gender-based terms.
The synsets and caption terms used for adapting the Visual Genome and MS-COCO datasets to operationalize gender groups are shown in Table 2. These terms are selected from previous work (Hall et al., 2023), so that we can investigate the effects of term-based assignment of group information on disparity evaluations. Bolded terms are those that we exclude in Evaluation V3.
Visual Genome
terms for group
man
terms for group woman
man.n.01,
male_child.n.01,
guy.n.01,
male.n.01,
groom.n.01,
husband.n.01,
grandfather.n.01,
father.n.01,
son.n.01,
boyfriend.n.01,
brother.n.01,
grandson.n.01,
groomsman.n.01,
ex-husband.n.01,
uncle.n.01,
godfather.n.01
maid.n.02,
woman.n.01,
girl.n.01,
lady.n.01,
female.n.01,
mother.n.01,
lass.n.01,
ma.n.01,
widow.n.01,
bride.n.01,
daughter.n.01,
grandma.n.01,
granddaughter.n.01,
bridesmaid.n.01,
girlfriend.n.01,
sister.n.01,
wife.n.01,
female_child.n.01,
white_woman.n.01,
dame.n.01,
matriarch.n.01,
mother_figure.n.01,
dame.n.02,
great-aunt.n.01,
donna.n.01
MS-COCO
terms for group
man
terms for group woman
man,
mans,
men,
boy,
boys,
father,
fathers,
son,
sons,
he,
his,
him
woman,
womans,
women,
girl,
girls,
lady,
ladies,
mother,
mothers,
daughter,
daughters,
she,
her,
hers
9.1.2. Construction of confidence intervals.
We construct confidence intervals over 250 bootstraps (sampling with replacement each time), then showing 95-percentile error bars. For aggregate measurements, we calculate the mean of the metric for each concept for a given bootstrap. We then subtract the mean of the metric for each group for that bootstrap and calculate the mean and confidence intervals for the difference in metric across all bootstraps. For concept-level measurements, we take the mean and confidence intervals of the difference of the metric between groups for each concept.
9.1.3. Additional Results
Concepts with greatest variation across evaluations with the Visual Genome.
Figure 7 shows concepts with greatest variation across evaluations with the Visual Genome.
Disparity measurements aggregated across concepts.
Figure 8 shows how different choices in evaluation can affect analyses when examining disparities over all concepts more when using average precision than TPR/FPR. This pattern is consistent across both the Visual Genome and MS-COCO datasets.
Per-concept disparity evaluations using COCO
In Figure 9 we show per-concept disparity metrics for the MS-COCO (Lin et al., 2014) dataset. Because we use only captions for determining groups, and not bounding boxes, we skip Evaluation V1 and Evaluation V2 which focused on filtering the bounding box used for determining groups.
We observe that, as with Visual Genome, the method of sampling affects average precision much more than TPR and FPR. However, compared to the Visual Genome, there is a relatively small effect of removing the gender-based terms corresponding to parent and child relationships. This suggests that this annotation pattern associating animals with parental relationships may not occur often in MS-COCO, and could be specific to the Visual Genome.
As with the Visual Genome, we see that the choice of sampling has a much larger effect on average precision measurements than TPR and FPR measurements. In Figure 10 we show the concepts with the greatest disparities using the Reliable Evaluation method. These concepts are included in our qualitative analysis of large disparities presented in Section 6.
9.2. Additional Details: Case Study #2
9.2.1. Comparing the two class mappings.
Examples of how the DollarStreet labels are translated to different ImageNet classes between the two mappings are shown in Figure 11. We keep the original DollarStreet labels fixed; because some of the DollarStreet labels in the alternative ImageNet-1K mapping that we used are not present in our original DollarStreet dataset, we omit those ImageNet-1K classes.
| DollarStreet Label | ImageNet22K Class | ImageNet1K Class |
| phones | telephone, phone, telephone_set | cellphone |
| roofs | roof | tile roof |
| bikes | bicycle, bike, wheel, cycle | all-terrain bike |
| parking lots | garage | parking meter |
| lock on front door | lock | padlock |
We report per-concept results based on the ImageNet classes, not the DollarStreet classes, as this maps more directly to model behavior. This means that we may have an image has a DollarStreet label ”showers” and multiple ImageNet labels: ”shower_room”, ”shower”, ”bathtub, bathing_tub, bat, tub.” When calculating hit-rate, the image is considered as a ”hit” if any one of the ImageNet classes are in the top-5. When calculating AP, we evaluate each ImageNet concept distinctly and include as negative images any image that does not include the ImageNet concept.
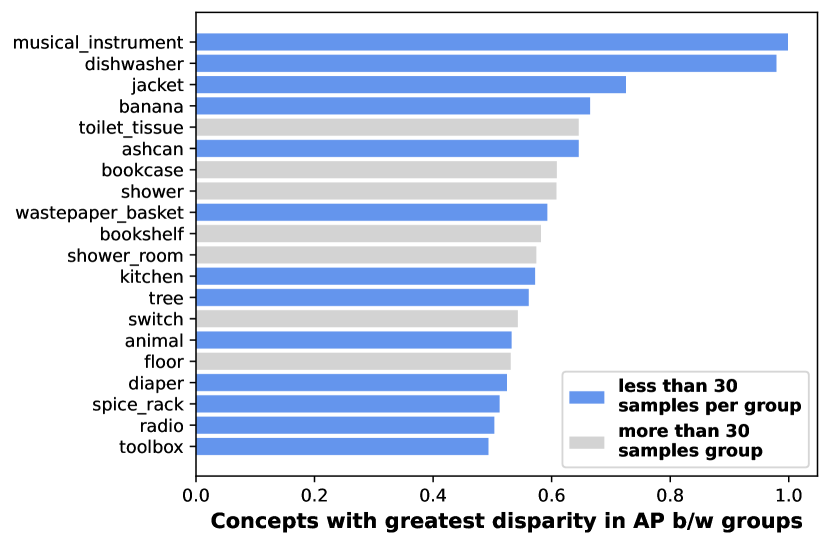
9.2.2. Rare concepts can have large disparities.
In Figure 12 we show the concepts in DollarStreet with the largest disparity in AP prior to filtering out concepts with few samples. Many concepts have fewer than 30 samples per group and can be susceptible to noise. For example, the concept musical_instrument has only one sample for Africa and seven samples for Europe, and the concept dishwasher has only two samples for Africa and four samples for Asia. We use the ImageNet22K mapping for these measurements, and the disparities shown are the maximum difference in AP between pairs of continents.
9.2.3. Construction of confidence intervals.
We construct confidence intervals over 250 bootstraps (sampling with replacement each time), then showing 95-percentile error bars. For aggregate measurements, we calculate the mean of the metric for each concept for a given bootstrap. We then subtract the mean of the metric for each group for that bootstrap and calculate the mean and confidence intervals for the difference in metric across all bootstraps. For concept-level measurements, we take the mean and confidence intervals of the difference of the metric between groups for each concept.
9.3. Additional Details: Root Cause Analyses
Figure 13 shows examples of how the Visual Genome and COCO have images that depict different media rather than a standard photograph, such as art pieces, black and white photographs, or signs. These tend to contain women more than men.
| dress.n.01 (Visual Genome) umbrella (COCO) \tab\tab\tab\tab\tab\tabcow (COCO) |

 \tab
\tab
 \tab
\tab

|