Is the large-scale structure traced by the BOSS LOWZ galaxies consistent with Planck?
Abstract
Recently, several studies reported a significant discrepancy between the clustering and lensing of the Baryon Oscillation Spectroscopic Survey (BOSS) galaxies in the Planck cosmology. We construct a simple yet powerful model based on the linear theory to assess whether this discrepancy points toward deviations from Planck. Focusing on scales , we model the amplitudes of clustering and lensing of BOSS LOWZ galaxies using three parameters: galaxy bias , galaxy-matter cross-correlation coefficient , and , defined as the ratio between the true and Planck values of . Using the cross-correlation matrix as a diagnostic, we detect systematic uncertainties that drive spurious correlations among the low-mass galaxies. After building a clean LOWZ sample with , we derive a joint constraint of and from clustering+lensing, yielding and , i.e., a tension with Planck. However, due to the strong degeneracy between and , systematic uncertainties in could masquerade as a tension with . To ascertain this possibility, we develop a new method to measure from the cluster-galaxy cross-correlation and cluster weak lensing using an overlapping cluster sample. By applying the independent bias measurement () as a prior, we successfully break the degeneracy and derive stringent constraints of and . Therefore, our result suggests that the large-scale clustering and lensing of LOWZ galaxies are consistent with Planck, while the different bias estimates may be related to some observational systematics in the target selection.
1 Introduction
Anchored by the latest Planck observations of the cosmic microwave background (CMB) anisotropies at recombination (Planck Collaboration et al., 2020), the standard CDM cosmological model under General Relativity (GR) provides a remarkably good description of the evolution of our Universe toward later epochs, including the expansion history measured by baryon acoustic oscillations (Alam et al., 2021) and Type Ia supernovae (Scolnic et al., 2018) as well as the growth history measured by redshift space distortion, cosmic shear, and galaxy clusters (see Weinberg et al., 2013, for an extensive review). However, tensions may still arise when one compares low-redshift measurements of the matter density and the present-day amplitude of matter clustering, characterized by , the rms matter fluctuation in spheres, to the values expected from extrapolating CMB anisotropies forward from recombination to , e.g., and using Planck.
Most notably, recent cosmic shear studies found a lower value (Asgari et al., 2021; Secco et al., 2022; Amon et al., 2022; Huterer, 2022) of the parameter combination compared to Planck (but see Amon & Efstathiou, 2022, for a plausible non-linear solution). An alternative manifestation of this -tension is the apparent mismatch between the clustering and galaxy-galaxy (g-g) lensing of the Baryon Oscillation Spectroscopic Survey (BOSS) galaxies when assuming Planck cosmology (a.k.a., lensing-is-low; Leauthaud et al., 2017; Lange et al., 2019). In this letter, we examine the consistency (or lack thereof) between and the measured from the clustering and g-g lensing of BOSS LOWZ galaxies over scales between and . In particular, we elucidate the role of the galaxy bias in this consistency test by introducing an independent prior on , measured with the help of an overlapping sample of clusters.
Although the existence of a lensing-is-low effect on scales below remains a subject of intense debate (More et al., 2015; Yuan et al., 2020; Lange et al., 2021; Chaves-Montero et al., 2022; Contreras et al., 2022), using data from three different lensing surveys Amon et al. (2023) demonstrated that on scales above , there exists a discrepancy between clustering and g-g lensing in the Planck cosmology for the entire BOSS sample ( for the LOWZ galaxies between ). Compared with the lensing-is-low effect on small scales, the large-scale discrepancy is a more “direct” tension with Planck — it does not depend on the complex modelling of galaxy-halo connection, which on small scales is plagued by galaxy assembly bias and baryonic feedback (Salcedo et al., 2022; Beltz-Mohrmann et al., 2022). Therefore, it is imperative that this direct tension be assessed in a simple framework that confronts the LOWZ clustering+lensing measurements with the prediction by the Planck CDM+GR model at asymptotically large scales (i.e., ), where structure growth follows the linear theory and galaxy bias becomes scale-independent.
On scales above , galaxy clustering and g-g lensing are measuring
| (1) |
and
| (2) |
respectively, where is the matter correlation and is the cross-correlation coefficient between galaxies and matter (Cacciato et al., 2012). Note that we fix the value of to be , so that the -tension simplifies into a -tension. A joint analysis of clustering and g-g lensing can then measure
| (3) |
thereby cancelling the unknown111The cancellation, however, requires , which puts a constraint on the galaxy-halo connection if the small scales are included. nuisance parameter . Thus, a strong discrepancy between clustering and g-g lensing in Planck is usually interpreted as the evidence of the ratio
| (4) |
significantly deviating from unity (e.g., means lensing-is-low). For instance, Wibking et al. (2020) constructed a Halo Occupation Distribution-based nonlinear emulator to constrain cosmology from jointly modelling the clustering and g-g lensing of the LOWZ galaxies on scales above , finding a ( if limited to ) evidence of . By explicitly modelling g-g lensing in the form of , Singh et al. (2020) found a similar discrepancy with Planck for a minimum scale of using the LOWZ galaxies. They also found the discrepancy persists at the level of when limited to scales .
Alternatively, a clustering-lensing mismatch could be the result of having systematic errors that drive below unity or/and an incorrect clustering amplitude, leading to an imperfect cancellation of in Equation 3. Although both possibilities are generally considered unlikely for well-defined galaxy samples and are thus omitted in previous studies, Zu (2020) found that the clustering of LOWZ galaxies on scales above exhibits a non-monotonic trend with stellar mass , with the low- bin having a higher clustering amplitude than the intermediate- one. Zu (2020) interpreted this clustering anomaly as the evidence for the low- galaxies being the satellites of massive haloes. In this letter, we demonstrate that the clustering anomaly is instead caused by some unknown systematic uncertainties associated with the BOSS LOWZ sample, probably due to the complex target selection criteria of BOSS galaxies (Reid et al., 2016).
After building a clean sample of LOWZ galaxies free of the clustering anomaly in §2, we reproduce the lensing-is-low effect using our linear framework in §3. After developing a novel method of measuring from an overlapping sample of galaxy clusters, we demonstrate in §4 that by applying this measurement as a prior on , we can mitigate the impact of systematic uncertainties in and resolve the direct tension between and originated from the large scales. We summarize our results and look to the future in §5.
2 A “Clean” Sample of LOWZ Galaxies
2.1 The BOSS LOWZ galaxies
As part of the SDSS-III programme (Eisenstein et al., 2011), BOSS (Dawson et al., 2013) observed the spectra of 1.5 million galaxies over a sky area of 10000 deg2 at . The BOSS targets were selected from the Data Release 8 (DR8; Aihara et al., 2011) of SDSS five-band imaging, using two separate sets of colour and magnitude cuts for the LOWZ () and CMASS () samples (Reid et al., 2016). We use the DR12 of the BOSS LOWZ sample (Alam et al., 2015) and limit our analysis to the Northern Galactic Cap. We adopt the aperture-corrected stellar mass measurements by Chen et al. (2012), but reduce the stellar mass values by 0.155 dex to be consistent with the SDSS main galaxies at (Guo et al., 2018).
In this letter, we focus on the LOWZ galaxies in the redshift range , for which we have a volume-complete sample of photometric clusters with excellent photo-z accuracy in the same footprint from redMaPPer (Rykoff et al., 2014). We use 4580 clusters with richness above from the SDSS redMaPPer v6.3 catalogue (Rykoff et al., 2016). Our results do not change when using a higher threshold of or only clusters with spectroscopic redshifts. As will be demonstrated later in §4, this overlapping cluster sample allows us the unique opportunity to make an independent measurement of , without resorting to galaxy clustering or g-g lensing.
2.2 Selecting a clean sample of LOWZ galaxies
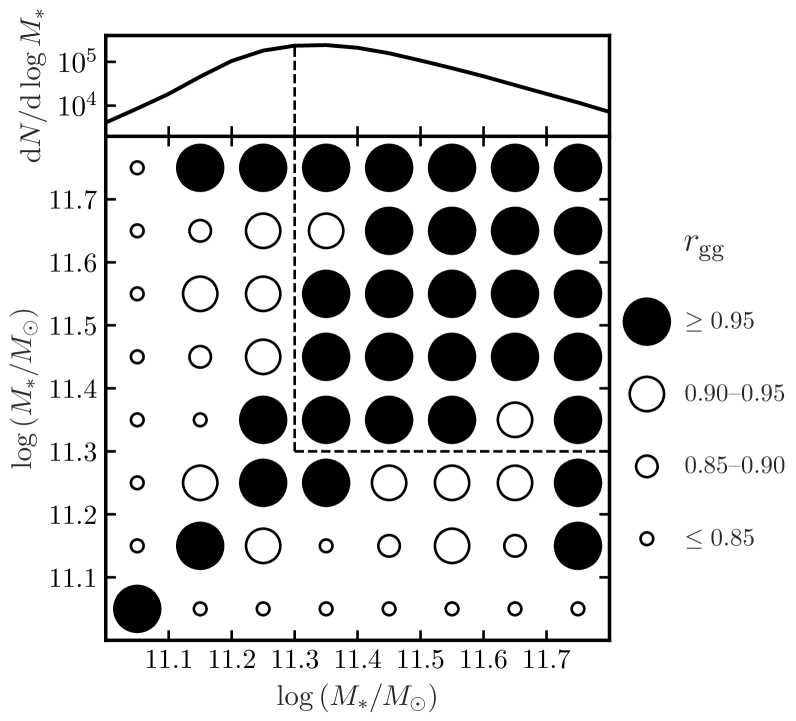
Ideally, we hope to select a “clean” LOWZ sample that has on scales above , but is not directly accessible. Following an indirect diagnostic proposed by Tegmark & Bromley (1999), we divide the overall LOWZ galaxy sample into eight narrow bins by stellar mass (), and then compute the galaxy-galaxy cross-correlation coefficient between each pair combination , yielding an cross-correlation matrix . We search for a contiguous block within which the average is close to unity, and identify the stellar mass range of that block as a clean sample. The rationale is as follows. If the -th and -th bins are both perfectly correlated with matter, then they must also be perfectly correlated with each other (i.e., ). Conversely, if we find imperfect correlations between the two, then must be true for at least one of the two bins. Therefore, by culling the regions from , we remove the galaxies that are potentially subjected to observational systematics.
We compute as
| (5) |
where and are the projected auto-correlation functions of the -th and -th bins, respectively, and is the projected cross-correlation function between the two bins, all evaluated over the projected separation of . We compute the projected correlation functions by integrating the 2D redshift-space correlation function along the line-of-sight distance
| (6) |
where we set the integration limit to . For measuring , we use the Landy-Szalay estimator (Landy & Szalay, 1993) and estimate the associated uncertainty matrix by applying the jackknife re-sampling method over 128 sub-divided regions across the footprint.
Figure 1 visualizes the correlation matrix , with the size of each circle at column and row representing the value of , which we classify into four categories listed on the right. Surprisingly, almost all of the matrix elements that involve bins with are below , hinting at the existence of unknown systematics among the low- galaxies. The highest- category () is highlighted by the filled circles, which are mostly enclosed within the dashed lines, i.e., . The dashed line also coincides with the peak of the stellar mass distribution of the LOWZ sample (top), suggesting that the unknown systematics are likely from the target selection in the low-mass range with high incompleteness. In particular, we detect significant spurious correlations over large line-of-sight distances within the galaxies with , which explains the aforementioned clustering anomaly found in Zu (2020).
Informed by the diagnostics, we select LOWZ galaxies with into our “clean” LOWZ sample (hereafter referred to as C-LOWZ), and use the C-LOWZ sample for all subsequent analyses in this letter.
2.3 Clustering and weak lensing measurements

We make use of the projected auto-correlations of C-LOWZ galaxies () and redMaPPer clusters (), as well as the cross-correlation between the two () in our analyses. The three correlation functions are measured in the same way as described by Equation 6. For the weak lensing by C-LOWZ galaxies and redMaPPer clusters, we measure the surface density contrast profile using the shear catalogue derived from the Dark Energy Camera Legacy Survey (DECaLS; Dey et al., 2019). The same DECaLS data were used in the fiducial cluster weak lensing study of Zu et al. (2021), who found excellent agreement between the measured from DECaLS and that from SDSS imaging using the re-Gaussianization algorithm (Reyes et al., 2012), but the uncertainties in the DECaLS measurements are smaller by roughly a factor of two thanks to the deeper depth. Note that the SDSS g-g lensing measurements were used by Wibking et al. (2020), Singh et al. (2020), and Lange et al. (2021) in their LOWZ analyses.
Unlike , the signal on scales above is contaminated by the non-linear structure growth below (Zu & Mandelbaum, 2015). To remedy this, we measure the annular differential surface density (ADSD) , defined as
| (7) |
where we set the minimum scale . Originally proposed by Baldauf et al. (2010), removes all the information from scales below and thus can be safely predicted using the linear theory. Following Mandelbaum et al. (2013), we interpolate the value of using the best-fitting power-law that describes between and (also see Singh et al., 2020).
3 Linear Assessment Method
To facilitate the -tension assessment on linear scales, we follow the practice of Zu et al. (2014) and keep the shape of the linear matter power spectrum fixed to that of Planck . With a fixed shape, a single value of specifies the full matter correlation function via
| (8) |
where is the nonlinear matter correlation predicted from using the prescription of Takahashi et al. (2012). We assume the mean redshift of C-LOWZ () for all calculations.
Focusing exclusively on scales , we model the measurement as
| (9) |
where is the projected matter auto-correlation
| (10) |
and accounts for the scale-dependent enhancement of due to the residual redshift-space distortion (RRSD) effect. We calculate using the modified linear Kaiser formalism of van den Bosch et al. (2013). For the C-LOWZ sample, is about 8% and 30% at and , respectively. The -dependence of is very weak and does not provide any meaningful constraint on . Therefore, our clustering model of Equation 9 constrains the parameter combination , which turns into a bias measurement for any given value of .
By the same token, the ADSD profile can be modelled as
| (11) |
and the matter-matter ADSD in Planck can be predicted from Equation 7 using
| (12) |
where
| (13) |
and
| (14) |
Similarly, our lensing model of Equation 11 constrains the parameter combination , which then provides a bias measurement for any given at fixed .
Combining the clustering model (Equation 9) and the lensing model (Equation 11), our linear assessment model has only three parameters: , , and . Among the three, is our key parameter which quantifies the -tension, is our primary nuisance parameter that may still be affected by observational systematics, and should be close to unity for our C-LOWZ galaxy sample. We perform a suite of three Bayesian inference analyses by applying the clustering model, the lensing model, and the combined model to the measurements of , , and , respectively, of the C-LOWZ sample on scales . Assuming Gaussian likelihoods, we can derive the posterior distributions of , , and the joint distribution of and . For the joint constraint, we apply a conservative Gaussian prior on .
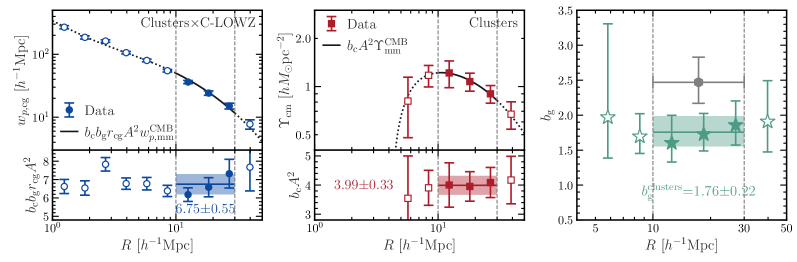
Figure 2 presents the results of the clustering-only (left), lensing-only (middle), and joint (right) constraints. On the left panel, the measurement (circles with errorbars) is well described by the prediction from the best-fitting clustering model (solid curve) on scales . Dotted curve segments are the extrapolation of the linear model into the nonlinear or very low signal-to-noise regimes, and should not be compared with the data (open circles). The bottom subpanel shows the square root of the ratio between the measurement and , which gives the constraint on as (horizontal band). Similarly, the middle panel presents the data vs. prediction comparison in the main panel, as well as the ratio profile in the bottom subpanel, yielding a constraint of . If assuming the Planck cosmology (i.e., ), we would obtain and , reproducing a lensing-is-low effect of on large scales.
The right panel of Figure 2 shows the 2D constraint on the vs. plane after marginalizing over the uncertainties of . The contour lines are the 68% and 95% confidence limits, yielding the 1D posterior constraints as and . Therefore, when applied to the clustering and g-g lensing measurements on large scales, our linear assessment method detects a discrepancy with Planck, reproducing the -tension reported by previous studies.
However, a strong degeneracy exists between and , and the 2D constraint remains marginally consistent with Planck within . Given the presence of unknown systematics in the LOWZ sample demonstrated by Figure 1, it is plausible that other systematics of the similar origin may remain within our C-LOWZ sample in a way that affects the measurement but evades our detection using the Tegmark & Bromley (1999) method. In order to break the strong degeneracy seen in the right panel of Figure 2, we need to place an external prior on using an independent measurement of from a different dataset than galaxy clustering and g-g lensing.
4 Cluster-based Measurement of
Adopting the same philosophy of §3, we can model the projected cluster-galaxy cross-correlation as
| (15) |
where is the cluster bias, accounts for the cluster-galaxy RRSD, and is the cluster-galaxy cross-correlation coefficient. We can directly measure via
| (16) |
where is the projected auto-correlation of clusters. Likewise, the cluster weak lensing can be modelled as
| (17) |
where is the cluster-matter cross-correlation coefficient. For the massive clusters that are robustly detected from imaging (i.e., without spectroscopic target selection), we can safely assume to be unity. Therefore, by combining the two measurements we can cancel to obtain
| (18) |
i.e., a cluster-based measurement that is independent of , galaxy clustering, and g-g lensing222Although the g-g and cluster lensing are measured from the same shear catalogue, the uncertainties are both dominated by the shape noise, so that the two lensing signals can be considered independent..
We apply the new bias measurement method to the C-LOWZ galaxies and the overlapping redMaPPer clusters, with the results shown in Figure 3. The left and middle panels illustrate the constraints from the clustering-only and lensing-only measurements, respectively, with the same format as that of Figure 2. In particular, the clustering constraint on the parameter combination is , and the lensing constraint is . With measured via Equation 16, we can compute via Equation 18. Our new independent constraint on is , indicated by the horizontal green band in the right panel of Figure 3. Compared to our previous constraint using galaxy clustering and g-g lensing (gray hexagon with errorbar), the new measurement is significantly lower, signalling a tension in .
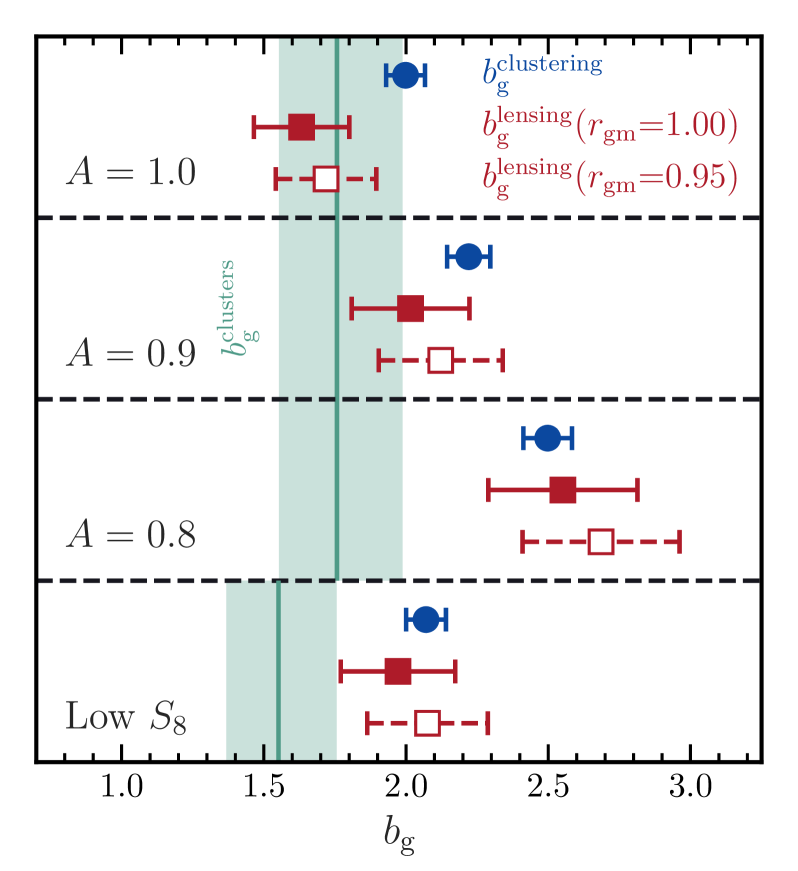
Figure 4 compares the measurement, which is -independent (green band), to the clustering-only (blue circles) and lensing-only (red squares) measurements assuming four different cosmologies. For the lensing-only measurements, we assume and for the filled and open squares, respectively. In the case of Planck (), although and are mutually discrepant beyond , both are individually consistent with well within . As we move away from Planck by decreasing , the and values increase by different amounts so as to become more consistent with each other, echoing the claim that a low- cosmology could resolve the lensing-is-low tension; Meanwhile, however, both bias values become progressively more discrepant with , which does not vary with . Therefore, although a low- cosmology could resolve the discrepancy between and , it exacerbates the tension of the two biases with .
The strong discrepancy between and the other two biases persists when we adopt a representative low- cosmology (bottom panel) that alleviates the lensing-is-low problem, with the parameters drawn from the table 2 of Lange et al. (2019). In this case, the shape is no longer fixed to that of Planck and . Accordingly, the value of shifts to , but still disagrees strongly with the clustering- and lensing-only estimates. Therefore, the existence of the -tension is robust against variations in the shape of or .
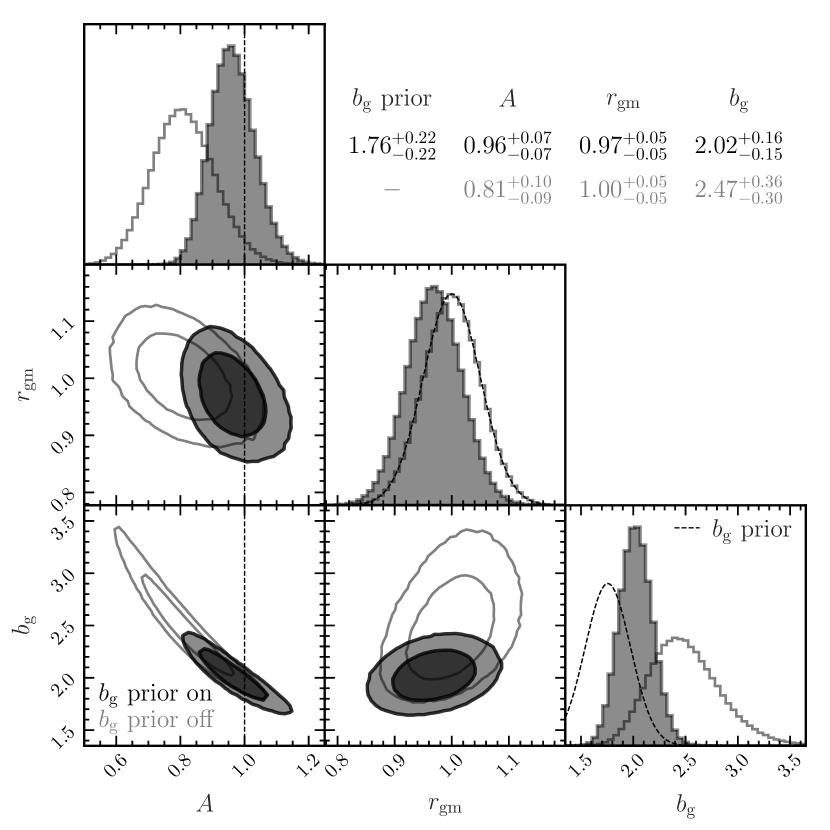
Since the cluster-based bias measurement is independent of and derived from external datasets, we can incorporate as a prior in the Bayesian analysis using our linear assessment model developed in §3. Figure 5 shows the two sets of posterior constraints on the model parameters in both 1D (diagonal) and 2D (off-diagonal) parameter spaces, one with the -prior on (dark filled histograms and contours) and the other off (light open). The contour levels are the 68% and 95% confidence limits, with the thin dashed curve in the bottom right panel indicating our prior, while the two sets of constraints are listed on the top right. The 1D posterior distribution of coincides with the Gaussian prior on (thin dashed) when the prior is off, but slides to when the prior is on, consistent with and . Meanwhile, our 1D posterior constraint on () is significantly lower than the prior-off constraint (), albeit slightly higher than the prior.
Finally, in the bottom left panel of Figure 5, we successfully break the otherwise strong degeneracy between and with the help of the external prior, yielding a much better agreement with the Planck cosmology (; vertical dashed line). After marginalizing over the uncertainties in and , we derive a stringent 1D constraint of , finding no tension with Planck.
5 Conclusion
In this letter, we develop a simple method based on the linear theory to assess the consistency between the clustering+lensing of BOSS LOWZ galaxies and the Planck cosmology. Focusing on scales and assuming a fixed shape for the , we can accurately model the clustering and lensing of galaxies using only three parameters, , , and , where in the Planck cosmology.
By examining the cross-correlation matrix of galaxy subsamples divided by stellar mass, we discover that the LOWZ galaxies with are affected by some unknown observational systematics that lead to spurious correlations across large line-of-sight distances. We then build a clean LOWZ galaxy sample (C-LOWZ) by only including galaxies with . Applying our linear assessment model to the C-LOWZ sample, we obtain a constraint of , which reproduces a tension with Planck.
However, there exists a strong degeneracy between our key parameter and the nuisance parameter . We develop a novel method of measuring by combining the cluster-galaxy cross-correlation and cluster weak lensing using an overlapping sample of redMaPPer clusters. Intriguingly, despite the discrepancy between the biases inferred from clustering () and lensing () in Planck, both are consistent with our new cluster-based bias estimate (). Applying this independent bias measurement as a prior to our Bayesian analysis, we successfully break the degeneracy between and , and derive a stringent 1D posterior constraint of , in good agreement with the Planck cosmology.
Our result suggests that the large-scale structure traced by the LOWZ galaxies at is statistically consistent with Planck, while the clustering-lensing mismatch may be caused by some observational systematics (e.g., during the target selection). With the upcoming flux-limited galaxy sample at the same redshift from the Dark Energy Spectroscopic Instrument (Abareshi et al., 2022), we will acquire a clearer understanding of the clustering-lensing mismatch of the BOSS LOWZ sample, whether it be a tension of or .
References
- Abareshi et al. (2022) Abareshi, B., Aguilar, J., Ahlen, S., et al. 2022, AJ, 164, 207, doi: 10.3847/1538-3881/ac882b
- Aihara et al. (2011) Aihara, H., Allende Prieto, C., An, D., et al. 2011, ApJS, 193, 29, doi: 10.1088/0067-0049/193/2/29
- Alam et al. (2015) Alam, S., Albareti, F. D., Allende Prieto, C., et al. 2015, ApJS, 219, 12, doi: 10.1088/0067-0049/219/1/12
- Alam et al. (2021) Alam, S., Aubert, M., Avila, S., et al. 2021, Phys. Rev. D, 103, 083533, doi: 10.1103/PhysRevD.103.083533
- Amon & Efstathiou (2022) Amon, A., & Efstathiou, G. 2022, MNRAS, 516, 5355, doi: 10.1093/mnras/stac2429
- Amon et al. (2022) Amon, A., Gruen, D., Troxel, M. A., et al. 2022, Phys. Rev. D, 105, 023514, doi: 10.1103/PhysRevD.105.023514
- Amon et al. (2023) Amon, A., Robertson, N. C., Miyatake, H., et al. 2023, MNRAS, 518, 477, doi: 10.1093/mnras/stac2938
- Asgari et al. (2021) Asgari, M., Lin, C.-A., Joachimi, B., et al. 2021, A&A, 645, A104, doi: 10.1051/0004-6361/202039070
- Baldauf et al. (2010) Baldauf, T., Smith, R. E., Seljak, U., & Mandelbaum, R. 2010, Phys. Rev. D, 81, 063531, doi: 10.1103/PhysRevD.81.063531
- Beltz-Mohrmann et al. (2022) Beltz-Mohrmann, G. D., Szewciw, A. O., Berlind, A. A., & Sinha, M. 2022, arXiv e-prints, arXiv:2211.16105, doi: 10.48550/arXiv.2211.16105
- Cacciato et al. (2012) Cacciato, M., Lahav, O., van den Bosch, F. C., Hoekstra, H., & Dekel, A. 2012, MNRAS, 426, 566, doi: 10.1111/j.1365-2966.2012.21762.x
- Chaves-Montero et al. (2022) Chaves-Montero, J., Angulo, R. E., & Contreras, S. 2022, arXiv e-prints, arXiv:2211.01744. https://arxiv.org/abs/2211.01744
- Chen et al. (2012) Chen, Y.-M., Kauffmann, G., Tremonti, C. A., et al. 2012, MNRAS, 421, 314, doi: 10.1111/j.1365-2966.2011.20306.x
- Contreras et al. (2022) Contreras, S., Angulo, R. E., Chaves-Montero, J., White, S. D. M., & Aricò, G. 2022, arXiv e-prints, arXiv:2211.11745. https://arxiv.org/abs/2211.11745
- Dawson et al. (2013) Dawson, K. S., Schlegel, D. J., Ahn, C. P., et al. 2013, AJ, 145, 10, doi: 10.1088/0004-6256/145/1/10
- Dey et al. (2019) Dey, A., Schlegel, D. J., Lang, D., et al. 2019, AJ, 157, 168, doi: 10.3847/1538-3881/ab089d
- Eisenstein et al. (2011) Eisenstein, D. J., Weinberg, D. H., Agol, E., et al. 2011, AJ, 142, 72, doi: 10.1088/0004-6256/142/3/72
- Guo et al. (2018) Guo, H., Yang, X., & Lu, Y. 2018, ApJ, 858, 30, doi: 10.3847/1538-4357/aabc56
- Huterer (2022) Huterer, D. 2022, arXiv e-prints, arXiv:2212.05003, doi: 10.48550/arXiv.2212.05003
- Landy & Szalay (1993) Landy, S. D., & Szalay, A. S. 1993, ApJ, 412, 64, doi: 10.1086/172900
- Lange et al. (2021) Lange, J. U., Leauthaud, A., Singh, S., et al. 2021, MNRAS, 502, 2074, doi: 10.1093/mnras/stab189
- Lange et al. (2019) Lange, J. U., Yang, X., Guo, H., Luo, W., & van den Bosch, F. C. 2019, MNRAS, 488, 5771, doi: 10.1093/mnras/stz2124
- Leauthaud et al. (2017) Leauthaud, A., Saito, S., Hilbert, S., et al. 2017, MNRAS, 467, 3024, doi: 10.1093/mnras/stx258
- Mandelbaum et al. (2013) Mandelbaum, R., Slosar, A., Baldauf, T., et al. 2013, MNRAS, 432, 1544, doi: 10.1093/mnras/stt572
- More et al. (2015) More, S., Miyatake, H., Mandelbaum, R., et al. 2015, ApJ, 806, 2, doi: 10.1088/0004-637X/806/1/2
- Planck Collaboration et al. (2020) Planck Collaboration, Aghanim, N., Akrami, Y., et al. 2020, A&A, 641, A6, doi: 10.1051/0004-6361/201833910
- Reid et al. (2016) Reid, B., Ho, S., Padmanabhan, N., et al. 2016, MNRAS, 455, 1553, doi: 10.1093/mnras/stv2382
- Reyes et al. (2012) Reyes, R., Mandelbaum, R., Gunn, J. E., et al. 2012, MNRAS, 425, 2610, doi: 10.1111/j.1365-2966.2012.21472.x
- Rykoff et al. (2014) Rykoff, E. S., Rozo, E., Busha, M. T., et al. 2014, ApJ, 785, 104, doi: 10.1088/0004-637X/785/2/104
- Rykoff et al. (2016) Rykoff, E. S., Rozo, E., Hollowood, D., et al. 2016, ApJS, 224, 1, doi: 10.3847/0067-0049/224/1/1
- Salcedo et al. (2022) Salcedo, A. N., Zu, Y., Zhang, Y., et al. 2022, Science China Physics, Mechanics, and Astronomy, 65, 109811, doi: 10.1007/s11433-022-1955-7
- Scolnic et al. (2018) Scolnic, D. M., Jones, D. O., Rest, A., et al. 2018, ApJ, 859, 101, doi: 10.3847/1538-4357/aab9bb
- Secco et al. (2022) Secco, L. F., Samuroff, S., Krause, E., et al. 2022, Phys. Rev. D, 105, 023515, doi: 10.1103/PhysRevD.105.023515
- Singh et al. (2020) Singh, S., Mandelbaum, R., Seljak, U., Rodríguez-Torres, S., & Slosar, A. 2020, MNRAS, 491, 51, doi: 10.1093/mnras/stz2922
- Takahashi et al. (2012) Takahashi, R., Sato, M., Nishimichi, T., Taruya, A., & Oguri, M. 2012, ApJ, 761, 152, doi: 10.1088/0004-637X/761/2/152
- Tegmark & Bromley (1999) Tegmark, M., & Bromley, B. C. 1999, ApJ, 518, L69, doi: 10.1086/312068
- van den Bosch et al. (2013) van den Bosch, F. C., More, S., Cacciato, M., Mo, H., & Yang, X. 2013, MNRAS, 430, 725, doi: 10.1093/mnras/sts006
- Weinberg et al. (2013) Weinberg, D. H., Mortonson, M. J., Eisenstein, D. J., et al. 2013, Phys. Rep., 530, 87, doi: 10.1016/j.physrep.2013.05.001
- Wibking et al. (2020) Wibking, B. D., Weinberg, D. H., Salcedo, A. N., et al. 2020, MNRAS, 492, 2872, doi: 10.1093/mnras/stz3423
- Yuan et al. (2020) Yuan, S., Eisenstein, D. J., & Leauthaud, A. 2020, MNRAS, 493, 5551, doi: 10.1093/mnras/staa634
- Zu (2020) Zu, Y. 2020, arXiv e-prints, arXiv:2010.01143. https://arxiv.org/abs/2010.01143
- Zu & Mandelbaum (2015) Zu, Y., & Mandelbaum, R. 2015, MNRAS, 454, 1161, doi: 10.1093/mnras/stv2062
- Zu et al. (2014) Zu, Y., Weinberg, D. H., Rozo, E., et al. 2014, MNRAS, 439, 1628, doi: 10.1093/mnras/stu033
- Zu et al. (2021) Zu, Y., Shan, H., Zhang, J., et al. 2021, MNRAS, 505, 5117, doi: 10.1093/mnras/stab1712