Assisting Human Decisions in Document Matching
Abstract
Many practical applications, ranging from paper-reviewer assignment in peer review to job-applicant matching for hiring, require human decision makers to identify relevant matches by combining their expertise with predictions from machine learning models. In many such model-assisted document matching tasks, the decision makers have stressed the need for assistive information about the model outputs (or the data) to facilitate their decisions. In this paper, we devise a proxy matching task that allows us to evaluate which kinds of assistive information improve decision makers’ performance (in terms of accuracy and time). Through a crowdsourced ( participants) study, we find that providing black-box model explanations reduces users’ accuracy on the matching task, contrary to the commonly-held belief that they can be helpful by allowing better understanding of the model. On the other hand, custom methods that are designed to closely attend to some task-specific desiderata are found to be effective in improving user performance. Surprisingly, we also find that the users’ perceived utility of assistive information is misaligned with their objective utility (measured through their task performance).
1 Introduction
An important application in which human decision makers play a critical role, is document matching, i.e., when a query document needs to be matched to one of the many candidate documents from a larger pool based on their relevance. Concrete instances of this setup include: academic peer review, where meta-reviewers—associate editors in journals (e.g., https://jmlr.org/tmlr/ae-guide.html) or area chairs in conferences (Shah, 2022) or program directors conducting proposal reviews (Kerzendorf et al., 2020)—are asked to assign one or more candidate reviewers to submitted papers with relevant expertise based on their previously published work (illustrated in Figure 1, solid arrows); recruitment, where recruiters screen through a list of resumes from candidate applicants for an available position at the company (Schumann et al., 2020; Poovizhi et al., 2022); and plagiarism detection, where governing members (e.g., ethics board members of a conference, instructors of a course) review submissions to determine the degree of plagiarism (Foltỳnek et al., 2019). Because the pool of candidate documents is typically large and the decision makers have limited time, they first use automated matching models to pre-screen the candidate documents. These matching models typically base their screening on affinity scores, which measure the relevance of each candidate document to the query document (Alzahrani et al., 2012; Charlin & Zemel, 2013; Cohan et al., 2020; Li et al., 2021). The human decision makers subsequently determine the best-matching document, taking both their expertise and the affinity scores computed by the matching models into account. Such intervention by human decision makers is required for such tasks, as often times either errors made by the models are so consequential that they warrant human oversight, or the overall performance can be considerably improved by incorporating the domain knowledge of human experts.
Despite the growing prevalence of automated matching models and human decision makers working jointly for such practical matching tasks, humans generally find it difficult to completely rely on the models due to a lack of assistive information other than the models’ output itself. For instance, in peer review, 20% of the meta-reviewers from past NLP conferences found the affinity scores from the matching model to be “not very useful or not useful at all” in a recent survey (Thorn Jakobsen & Rogers, 2022). The survey also reports that the affinity scores rank the least important for the respondents, compared to more tangible and structured information about the candidate reviewers such as whether they have worked on similar tasks, datasets, or methods. Additionally, the survey finds that providing just the affinity scores increases the meta-reviewers’ workload as they “have to identify the information they need from a glance at the reviewers’ publication record.” and “are presented with little structured information about the reviewers.” Similarly, in hiring, the recruiters need to manually evaluate more profiles further down the search result pages due to too generalized matches suggested by the model (Li et al., 2021).
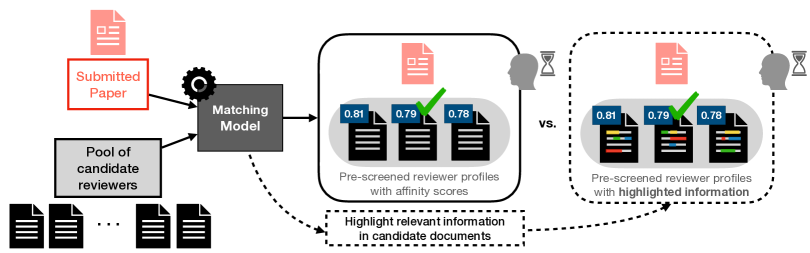
To address the lack of additional assistive information in the document matching setup, we conduct the first evaluation of what additional information can help the human decision makers to find matches accurately and quickly (Figure 1, dotted arrows). To do so, we first design a proxy task of summary-article matching that is representative of the general setup so that several methods providing different types of assistive information can be readily tested at scale via crowdsourced users (Section 3.1). The choice of proxy task addresses the logistical difficulty and expenses of directly experimenting with real domain-specific decision makers.
On this proxy task, we explore different classes of methods that have been previously suggested as tools for users to understand model outputs or document content. To standardize the format of assistance, we focus on methods that highlight assistive information within the candidate documents that the decision makers can utilize for matching (Section 3.2):
-
•
SHAP (Lundberg & Lee, 2017), a popular black-box model explanation (Doshi-Velez & Kim, 2017; Chen et al., 2022), highlights input tokens in the document that contribute both positively and negatively to the affinity scores. The utility of SHAP on several concrete downstream tasks remain controversial with conflicting results (Kaur et al., 2020; Jesus et al., 2021; Amarasinghe et al., 2022), and has yet to be evaluated for its effectiveness in document matching.
-
•
BERTSum (Liu & Lapata, 2019), a state-of-the-art text summarization method, which highlights key sentences in the candidate documents to help reduce the user’s cognitive load for the task.
-
•
Two task-specific methods, that we design ourselves (Section 3.2), to highlight details in the candidate documents relevant to the details in the query (by using sentence and phrase-level similarity measures).
With assistive information provided by these methods as treatments, and a control group provided with just the affinity scores and no additional assistive information, we conduct a pre-registered user study (with 271 participants) on a crowdsourcing platform.111Pre-registration document is available here: https://aspredicted.org/LMM_4K9 The study finds that (Section 4):
-
•
Despite its usage in numerous applications, SHAP decreases the participants’ matching performance compared to the control group.
-
•
Contrary to the expectation that summarizing long articles could improve task efficiency, the summaries generated by BERTSum adversely impact the participants. Participants take longer to finish and are less accurate compared to the control group.
-
•
Our task-specific methods, which are tailored to better identify details useful for the task, help the participants to be quicker and more accurate compared to the control group.
-
•
An overwhelming number of participants in all treatment groups perceive that the highlighted information is helpful, whereas the quantitative performance (accuracy and time) says otherwise.
The results suggest the benefits of designing task-specific assistive tools over general black-box solutions, and highlight the importance of quantitative evaluation of the methods’ utility that is grounded on a specific task over subjective user perceptions (Chen et al., 2022). The code from the study is available at https://github.com/wnstlr/document-matching.
2 Related Work
Prior Evaluation of Assistive Information. We discuss how our proposed evaluation of different types of assistive information, which include affinity scores, black-box model explanations, and text summaries, differs from how they have been previously evaluated.
Affinity scores, computed by comparing the similarity of representations learned by language models, are commonly used in practice to rank or filter the candidate documents (Mimno & McCallum, 2007; Rodriguez & Bollen, 2008; Charlin & Zemel, 2013; Tran et al., 2017; Wieting et al., 2019; Cohan et al., 2020) Their quality has been evaluated both with or without human decision makers: some may evaluate them based on the user’s self-reported confidence score (Mimno & McCallum, 2007), while others may use performance from proxy tasks like document topic classification, where a higher test accuracy of the classification model using the learned representation indicates better ability to reflect more meaningful components in the documents (Cohan et al., 2020). However, the utility of affinity scores for assisting human decision makers for the document matching task is less studied.
While information provided by black-box model explanations have been evaluated for their utility to assist human decision makers in various downstream tasks, the results have been lackluster. On the deception detection task, where users are asked to determine if a given hotel review is fake or not, prior work have shown that only some explanation methods improve a user’s task performance (Lai & Tan, 2019; Lai et al., 2020). Arora et al. (2022) further show that none of the off-the-shelf explanations help the users better understand the model’s decisions on the task. On more common NLP tasks like sentiment classification and question-answering, providing explanations to the users decreases the task performance compared to providing nothing when the model’s prediction is incorrect (Bansal et al., 2021). For the fraud detection task with domain experts, providing some model explanations showed conflicting effects on improving the performance (Jesus et al., 2021; Amarasinghe et al., 2022). In this work, we expand user evaluations of black-box model explanations to the document matching task and propose alternatives that could be more helpful.
Summaries generated by text summarization models (Lewis et al., 2020; Liu & Lapata, 2019; Shleifer & Rush, 2020; Zhang et al., 2020) are typically either evaluated by metrics like ROUGE with respect to the annotated ground-truth summary in a standardized dataset, or by a human’s subjective rating of the quality. To the best of our knowledge, the usefulness of these automatically summarized information to the human decision makers in concrete downstream tasks is rarely studied. Even for a few applied works that utilize these methods to practical documents in legal or business domains, the final evaluations do not explore beyond these task-independent metrics (Elnaggar et al., 2018; Bansal et al., 2019; Huang et al., 2020). In this work, we explicitly evaluate whether the generated summaries can help improve the decision makers’ task performance in document matching.
Practical Concerns in Document Matching Applications. There are a number of real-world document matching applications including peer review, hiring, and plagiarism detection. For each application, we discuss practical issues that have been raised by users that can be mitigated by providing more assistive information about the data and the model.
In scientific peer review, submitted papers need to be matched to appropriate reviewers with proper expertise or experience in the paper’s subject area. First, a set of candidate reviewers are identified using an affinity scoring model based on representations learned by language models (Charlin & Zemel, 2013; Mimno & McCallum, 2007; Rodriguez & Bollen, 2008; Tran et al., 2017; Wieting et al., 2019; Cohan et al., 2020). Additional information such as reviewer bids or paper/reviewer subject areas may also be elicited (Shah et al., 2018; Meir et al., 2020; Fiez et al., 2020). Based on this information, meta-reviewers may either be asked to directly assign one or more reviewers to each paper, or to modify the assignment that has been already made as they see appropriate. For example, in the journal Transactions on Machine Learning Research, for any submitted paper the meta-reviewer (action editor) is shown a list of all non-conflicted reviewers sorted according to the affinity scores. The meta-reviewer may also click on any potential reviewer’s name to see their website or list of publication. The meta-reviewer is then required to assign three reviewers to the paper based on this information. However, a recent survey of meta-reviewers from past NLP conferences reveal that the affinity scores alone are not as useful, and most respondents prefer to see more tangible and structured information about the reviewers (Thorn Jakobsen & Rogers, 2022).
In hiring, many companies resort to various algorithmic tools to efficiently filter and search for suitable candidates for a given job listing (Fernández & Fernández, 2019; Black & van Esch, 2020; Poovizhi et al., 2022). Many recruiters, while using these tools, express difficulties in reconciling a mismatch between algorithmic results and the recruiter’s own assessments. This is mainly attributed to “too generalized and imprecise” relevant matches suggested by the model, which lead to more “manually evaluating more profiles further down the search result pages” increasing the task completion time (Li et al., 2021). Also, the general lack of understanding about the algorithmic assessments makes the recruiters more reluctant to adopt them.
In plagiarism detection, many existing software tools aim to reduce the governing members’ workload by providing detailed information about the match, e.g., what specific parts of the query document are identical or similar to parts of the candidate documents. However, their performance in identifying various forms of plagiarism (e.g., ones involving paraphrasing or cross-language references) is still limited (Jiffriya et al., 2021). Also many existing tools lack user-friendly presentation of information that can better assist the task (Foltỳnek et al., 2020). As the governing members need to ultimately assess the proposed evidence by the model to determine the degree of penalty (Foltỳnek et al., 2019), additional assistive information about the match may improve their experience.
3 Task Setup and Methods
In Section 3.1, we describe the design of a summary-article matching task, which is an instance of the document matching tasks. We use this task as a proxy for other document matching tasks (e.g., matching reviewers to papers in peer-review), as it is more amenable for crowdsourcing experiments at scale. The summary-article matching task addresses common difficulties encountered when directly experimenting on real-world applications like recruiting real domain-specific decision makers (e.g., meta-reviewers in academia), building on complex systems in practice (e.g., internal systems that govern workflows in academic conferences), and coordinating logistical issues (e.g., longer turnaround for receiving feedback for each paper assignment). Our task may also be useful for early prototyping and validation of different methods. Then in Section 3.2, we present existing and our proposed methods that provide assistive information that we evaluate with human users on the the summary-article matching task.
3.1 Instantiating Document Matching
In the general document matching task, a matching model pre-selects a set of candidate documents based on the affinity scores, which capture the relevance between the query document and the candidate document. These affinity scores facilitate filtering candidates from a large pool of documents, but are nevertheless prone to errors. The user therefore goes over the candidate documents with the scores and selects the most relevant candidate document. A practical concern which we would like to address is when the affinity scores from the matching model alone may not provide sufficient information to determine a match quickly and accurately. We outline how we instantiate the summary-article matching task that captures these details.
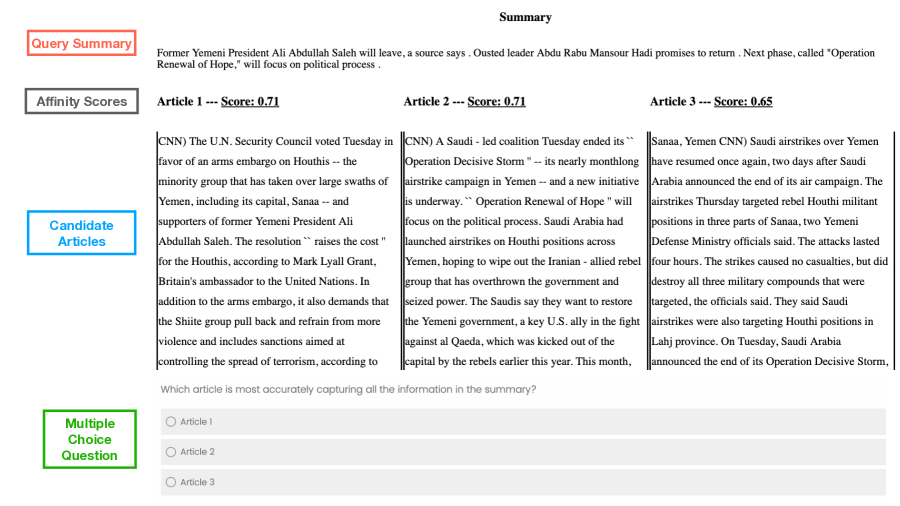
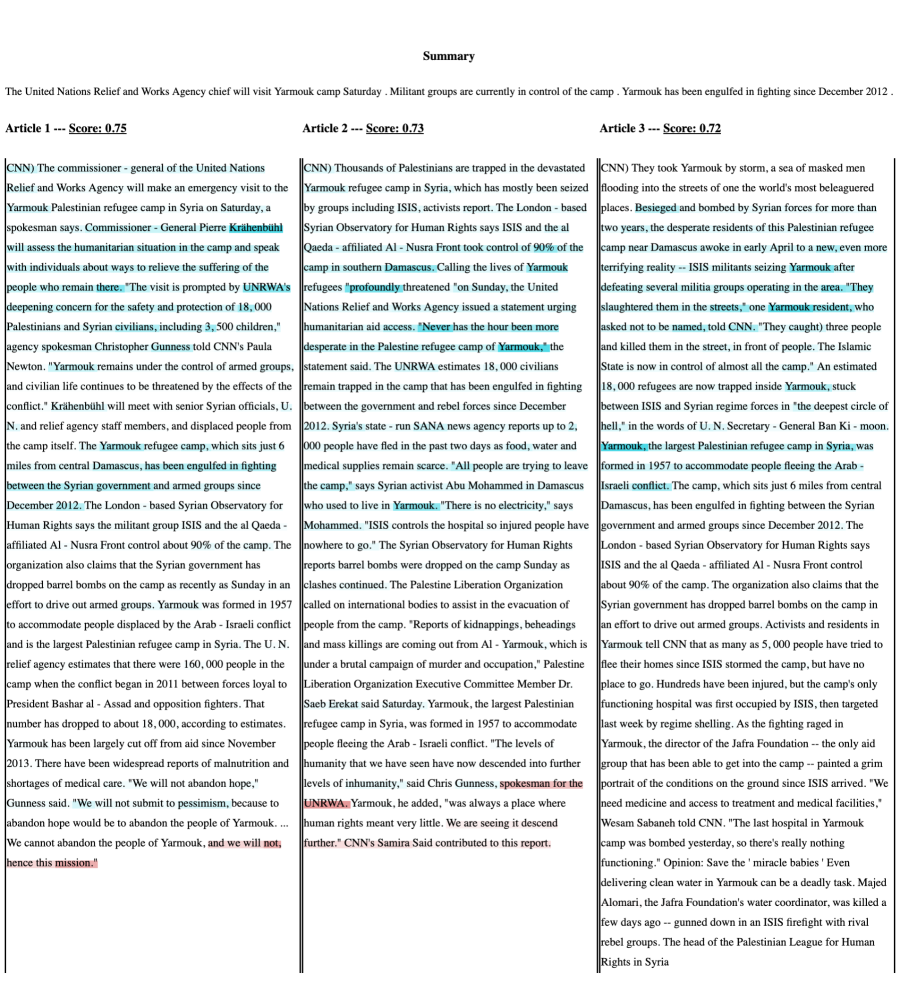
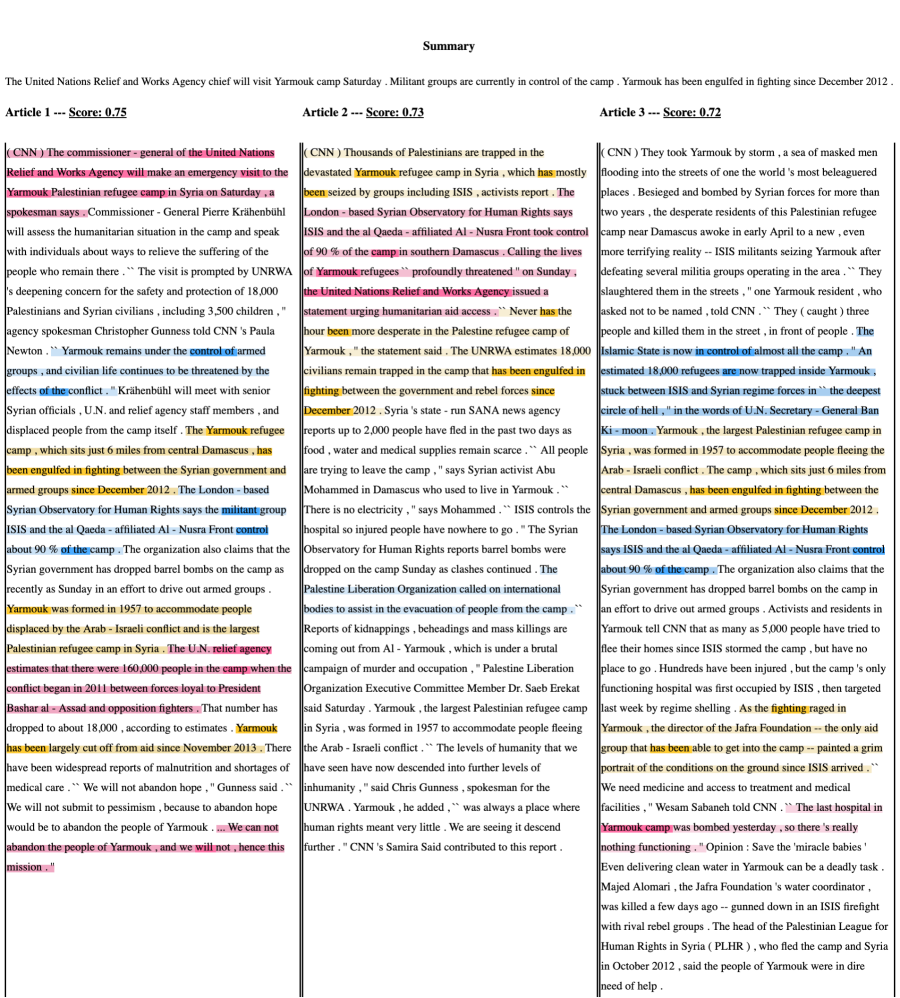
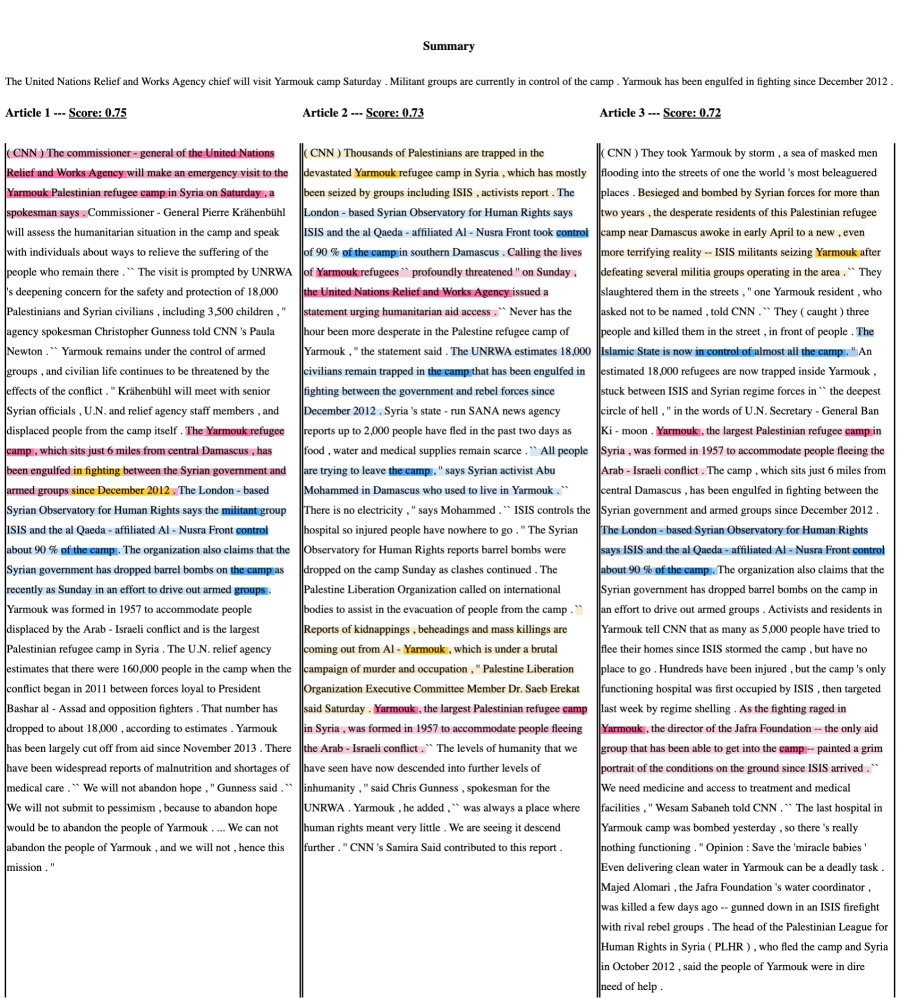
Task setup. We instantiate the general document matching tasks with a summary-article matching task. Here, the query and candidate documents are each sampled from human-written summaries and news articles in the CNN/DailyMail dataset (Hermann et al., 2015; See et al., 2017), a common NLP dataset used for summarization task. We select this dataset because the contents are accessible to a general audience, which enables us to evaluate a variety of assistive methods by employing crowdworkers as in Lai et al. (2020); Wang & Yin (2021). So in our task, the participants are given a series of questions composed of a query summary with three candidate articles222While the decision makers in a general matching task may observe more than three candidate articles, we devise a simpler instantiation here to reduce the complexity of the task, which will be better suited for the crowdsourcing task., and are asked to select an article from which the summary is generated under a time constraint (Figure 2).
As in the general document matching task, each candidate article is presented with an affinity score computed by a language model, which captures the similarity between the article and the summary. The affinity scores are computed by taking a cosine similarity between the final hidden representation of a language model for the article and the summary (Charlin & Zemel, 2013; Wu et al., 2020). We use the representations from the DistilBART (Shleifer & Rush, 2020) model fine-tuned on the CNN/DailyMail dataset.
Question types. In practice, there are some questions where the correct (document) match is obvious, whereas other questions require a more thorough inspection of the specifics. For instance, in scientific peer review, a paper about a new optimization method in deep learning may be assigned to a broad range of candidate reviewers whose general research area is within deep learning. However, a reviewer who has worked both on optimization theory and deep learning may be a better fit compared to others who have primarily worked on large-scale deep-learning based vision models. Even among the reviewers in optimization theory, the reviewers who have worked on similar type of methods to the one proposed may be better suited for the match. Such subtleties require more careful examination by the meta-reviewers.
We capture such scenarios by creating a data pool composed of two types of questions via manual inspection: easy and hard. Easy questions have candidate answers (articles) from different topics or events that are easily discernible from one another, and therefore can be easily matched correctly. On the other hand, hard questions have candidate articles with a shared topic that only differ in small details, requiring a more careful inspection by the users.

On easy versus hard questions, the affinity scores naturally show distinctive behaviors. The gap of the scores between the correct and the wrong matches is smaller for the hard questions than for the easy ones (Figure 3). Because the scores for all candidate articles are similar to one another in the hard questions, the affinity scores are not as helpful in identifying the best match. Additionally, it is more likely that the candidate article with the highest affinity score is not the correct match in the hard questions. If a hypothetical user was to simply select a candidate article which has the highest affinity score by completely relying on the matching model’s output, they would be accurate only for 33.3 percent of the time for the hard questions, compared to 100 percent of the time for the easy questions. We believe that providing users with assistive information might be critical for improving outcomes when making decisions on the hard questions, when the model is less accurate and the correct match is more difficult to find.
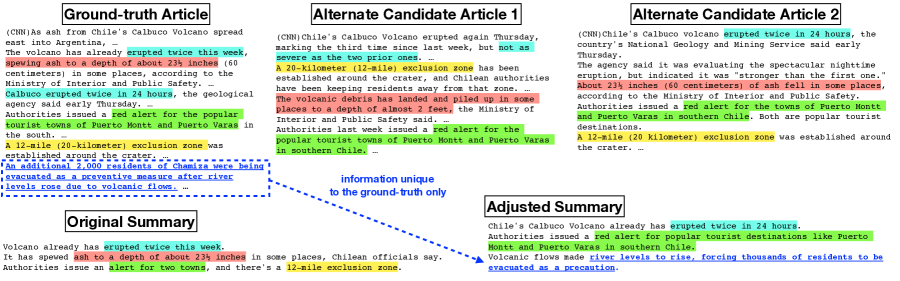
Defining ground-truth matches. A ground-truth match for a given summary and a set of candidate articles is necessary to measure participant performance. To construct pairs of summary and candidate articles, we first sample a summary-article pair from raw dataset and consider the article as the ground-truth for the given summary. We then select two other articles from the dataset which have the highest affinity scores with respect to the given summary as the incorrect candidate articles for the given summary.
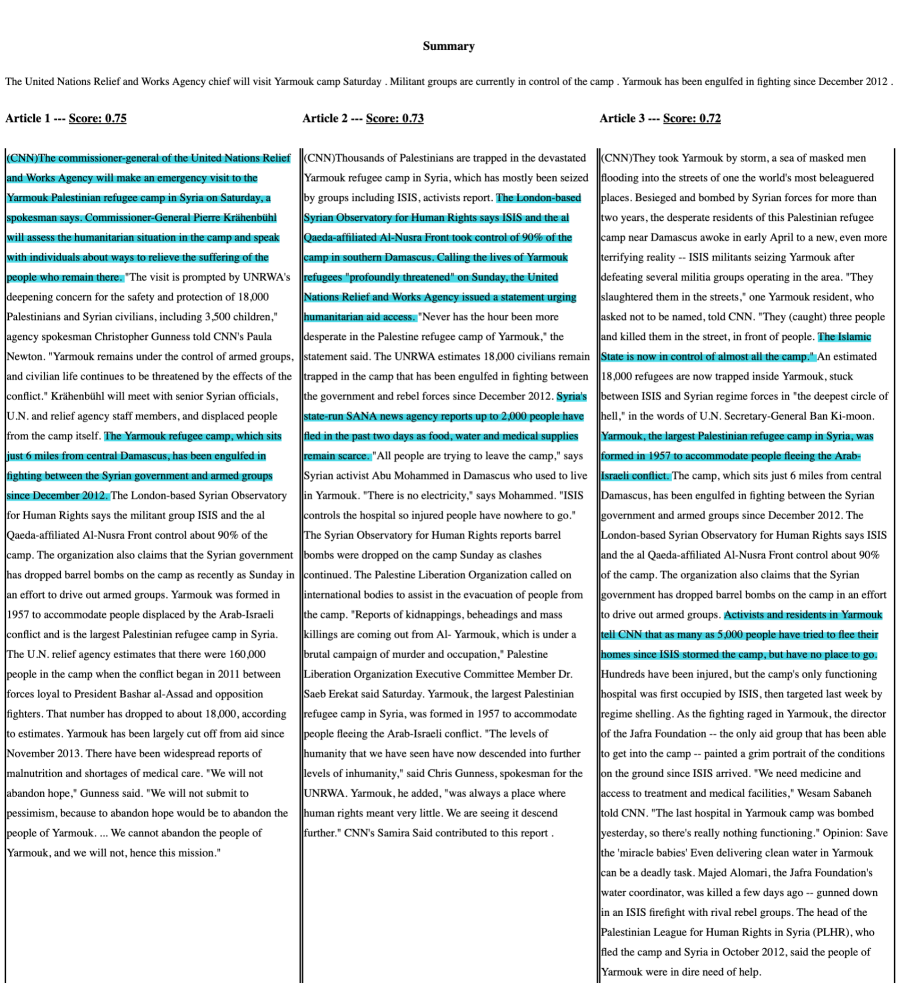
There are several instances where the two alternate candidate articles, which should be incorrect choices, may arguably be a suitable choice for the given summary. This happens because the dataset contains multiple articles covering the same event. To resolve this issue of having multiple ground-truths, we manually modify the given summary so that it is consistent only with the ground-truth article. Specifically, we manually identify unique information in the ground-truth article that is not part of the alternate candidate articles and add that information to the summary (Figure 4).
3.2 Tested Methods
In this section, we describe the methods used to highlight assistive information that we evaluate in our study and how they are presented to the users.
Black-box Model Explanation. Black-box model explanations include techniques that aim to highlight important input tokens for a model’s prediction (Simonyan et al., 2013; Shrikumar et al., 2016; Sundararajan et al., 2017; Lundberg & Lee, 2017). While there are several candidates to consider, we use a widely-applied method called SHAP (Lundberg & Lee, 2017). SHAP assigns attribution scores to each input token that indicate how much they contribute to the prediction output. We select SHAP from a pool of prominent explanation methods (which include Integrated Gradients (Sundararajan et al., 2017) and Input x Gradients (Shrikumar et al., 2016)) by examining how much the distribution of attribution scores deviate from random distribution of attribution scores (see Appendix A for details).
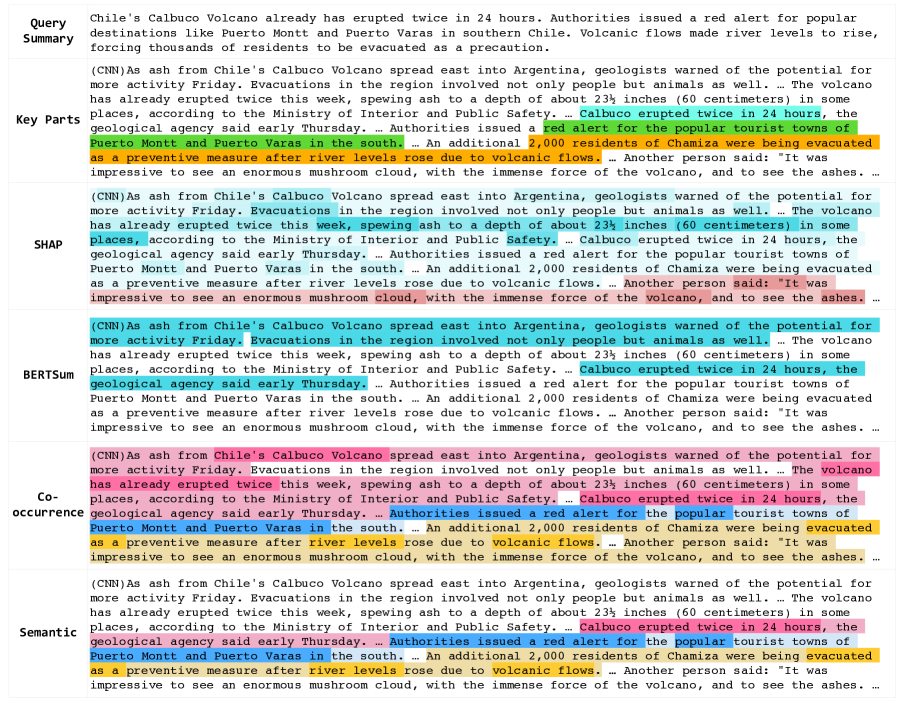
We visualize SHAP (example shown in Figure 5, third row) by highlighting the input tokens according to their attribution scores. Tokens that contribute to increasing the affinity score (i.e., those with positive attribution scores) are highlighted in cyan, while those that decrease the score (i.e., those with negative attribution scores) are highlighted in pink. The color gradients of the highlights indicate the magnitude of the attribution scores: the darker the color, the bigger the magnitude.
Extractive Summarization. Summarization methods are trained to select key information within a large body of text. These methods can potentially help users process multiple lengthy articles in a shorter amount of time (Liu & Lapata, 2019; Zhong et al., 2020; Lewis et al., 2020; Zhang et al., 2020). Summaries generated by these methods are typically either abstractive (i.e., the summary is a newly-generated text that may not be part of the original text) or extractive (i.e., the summary is composed of text pieces extracted from the original text) (Hahn & Mani, 2000). Because abstractive summaries are more susceptible to hallucinating information not present in the original text (Cao et al., 2018; Maynez et al., 2020; Ji et al., 2022), we focus on evaluating extractive summaries. In particular, we use BERTSum (Liu & Lapata, 2019), which achieves state-of-the-art performance on the CNN/DailyMail dataset (Pagnoni et al., 2021), to extract three key sentences from the article. We visualize the extracted summary by highlighting the selected sentences from the original text with a single solid color (example shown in Figure 5, fourth row).
Task-specific Methods. The summary-article matching task requires users to accurately and quickly identify whether all details in the summary are correctly presented in each article. This is particularly challenging for hard questions, where the ground-truth can only be identified by looking at the right part of the articles due to their subtle differences. Next we propose two task-specific methods that are more tailored to addressing this challenge.
The methods operate at sentence and phrase-level information in the summary and candidate articles. Specifically, we select and show the top sentences333We pick , but this can be tuned for different levels of detail, depending on the length of the summary or the article. from each article with the highest similarity measure to each sentence in the summary. To further provide more fine-grained detail on why that sentence could have been selected, we then show exactly-matching phrases within those selected sentences. Essentially, the methods are designed to guide the users to relevant parts in the article for each summary sentence by presenting the relevance hierarchically – by first showing the key sentences and then the key phrases within.
We consider two versions of the method which use different similarity measures to select the sentences:
-
•
Co-occurrence method uses F1 score of ROUGE-L (Lin, 2004), a common performance metric used to capture the degree of n-gram co-occurrence between two texts.
-
•
Semantic method uses the cosine similarity between the sentence representations from SentenceBERT (Reimers & Gurevych, 2019), a transformer model trained for sentence-level tasks. These scores are more sensitive to semantic similarities among texts like paraphrased components that may not be effectively captured by ROUGE-L.
Once we select sentences based on the similarity measures, we visualize them using different colors to differentiate sentences in the article related to different sentence in the summary. Like before, we use color gradients to indicate the magnitude of the similarity score for each sentence (the higher the similarity, the darker the color). We then color the exactly-matching phrases using the darkest shade. For instance, in Figure 5 (fifth and sixth rows), the pink, blue and yellow highlights indicate relevant parts to first, second, and third sentence in the summary respectively. We include additional examples from each of the explored methods in Appendix B.
4 Experiments
We run a pre-registered444Pre-registration document is available at https://aspredicted.org/LMM_4K9 user study on the summary-article matching task introduced in Section 3.1 to evaluate the methods described in Section 3.2 as treatment conditions. In this section, we outline the details of the user study (Section 4.1), followed by our main hypotheses (Section 4.2) and results (Sections 4.3).
4.1 User Study Design
We present questions to each participant. The 16 questions comprise easy and hard questions in random order. Participants complete all questions in one sitting. For each question, participants see a query summary followed by three longer candidate articles (see Figure 2 for an example). To incorporate the time constraints typical decision makers may face in practical settings, as similarly done in (Pier et al., 2017), we limit participants to spend minutes to answer each question, after which they automatically see the next question. We offer bonus payments to encourage high-quality responses in terms of both accuracy and time (more details in Appendix C.4).
We recruit participants from a balanced pool of adult males and females located in the U.S. with minimum approval ratings of on Prolific (www.prolific.co), with diverse demographic background (more details in Appendix C.2). The sample size is determined from Monte Carlo power analysis based on data collected from a separate pilot study, for a statistical power above 0.8 (more details in Appendix C.1). Each participant is then randomly assigned to one of five groups:
-
•
Control: participants see the basic information (summary, articles, affinity scores)
-
•
SHAP: participants see the basic information + highlights from SHAP
-
•
BERTSum: participants see the basic information + highlights from BERTSum
-
•
Co-occurrence: participants see the basic information + highlights from Co-occurrence method
-
•
Semantic: participants see the basic information + highlights from Semantic method
We include two attention check questions in the study in addition to the questions above. out of participants pass both attention-check questions, and we exclude responses from the non-qualifying participants from our further analysis. We include mode details about the user study in Appendix C.
4.2 Main Hypotheses
We pose the following null hypotheses with two-sided alternatives about the mean accuracy of participants on the hard questions, using different kinds of assistive information:
-
(H1) The mean accuracy of participants using SHAP is not different from that of the control.
-
(H2) The mean accuracy of participants using BERTSum is not different from that of the control.
-
(H3) The mean accuracy of participants using Co-occurrence method is not different from the control.
-
(H4) The mean accuracy of participants using Semantic method is not different from the control.
To test each hypothesis, we compare the mean accuracy of the participants in different treatment settings against the control group with two-tailed permutation tests, where the test statistic is the difference in the mean accuracy. We account for multiple comparisons with Sidak correction (Sidak, 1967) for the family-wise error rate of 0.05.
4.3 Results
We now discuss the participants’ task accuracy (Section 4.3.1), completion time (Section 4.3.2), and qualitative responses (Section 4.3.3) in different treatment groups.
4.3.1 Accuracy Difference
We find a statistically significant difference in the mean accuracy of all treatment groups compared to the control and reject the null hypotheses H1 through H4 in Section 4.2.
-
•
Participants using SHAP perform significantly worse than the control ().
-
•
Participants using BERTSum perform significantly worse than the control ().
-
•
Participants using Co-occurrence method perform significantly better than the control ().
-
•
Participants using using the Semantic method perform significantly better than the control ().
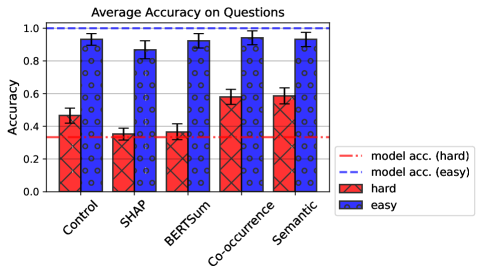
Comparing the participants’ accuracy against the model accuracy on different question types, we verify that the assistive information is particularly helpful for the hard questions (Figure 6a). Note that the model is only accurate around 33.3% of the time in hard questions (red dotted line) while being 100% accurate on easy questions (blue dotted line). The information from Semantic method is the most effective for the hard questions with the highest average accuracy of 58.6%, which is a 26% increase in accuracy compared to the control (46.6%) and a 77% increase compared to the model accuracy (33.3%), while SHAP (35.2%) and BERTSum (36.7%) remain less effective (red checker-patterned bars). On the other hand, there appears no significant difference in accuracy among the methods for the easy questions (blue dotted bars), all of them slightly less accurate than the model accuracy. The results suggest that while it is more efficient to rely on the affinity scores for the easy questions, assistive information via Semantic methods can be particularly helpful for the hard questions, when the correct match is less obvious for both the models and humans. This further suggests that for the best results in practice, it may be useful to consider first identifying the difficulty of the question and then determine if additional information is necessary.
4.3.2 Time Difference
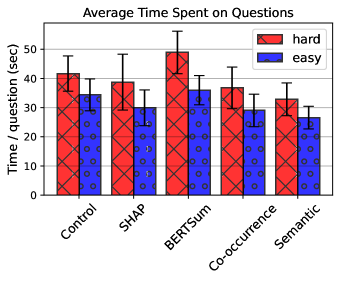
We record the average response time (in seconds/question) for participants in each treatment group. We observe that on average the participants using SHAP, Co-occurrence, and Semantic methods respond more quickly compared to the control group for both types of questions (Figure 6b). For both easy and hard questions, the participants using the Semantic method take the shortest average time (26.6 seconds for easy and 32.9 seconds for hard), which is approximately a 20% improvement over the control (34.4 seconds for easy and 41.7 seconds for hard). The participants using BERTSum take the longest (36 seconds for easy and 48.9 seconds for hard), where they experience a 17% increase in time for the hard questions. Given that the Semantic method is also able to significantly boost the task accuracy, it is the most effective method among the tested ones. On the other hand, as BERTSum simultaneously decreases the task accuracy and increases the completion time, it may be considered the least effective method.
4.3.3 Qualitative Responses
At the end of the user study, the participants are asked several qualitative questions about the task.
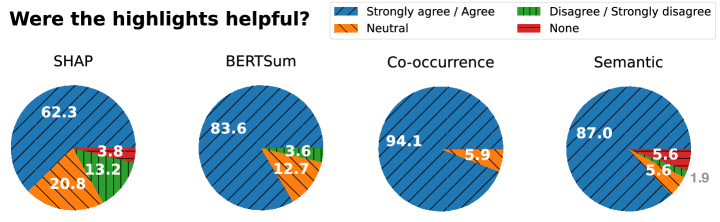
“Were the highlights helpful?” Participants from all of the treatment groups generally respond positively to this question – Figure 7 shows the proportion of different responses from the participants in each group, and positive responses in blue form the majority in all groups. While the participants believe the highlights to be helpful, their task performance shows the contrary for participants using SHAP and BERTSum. Such discrepancy between the subjective perception of a tool’s utility and the objective utility measured by task-grounded performance metrics corroborate similar previous observations on different assistive tools (Kaur et al., 2020; Bansal et al., 2021).
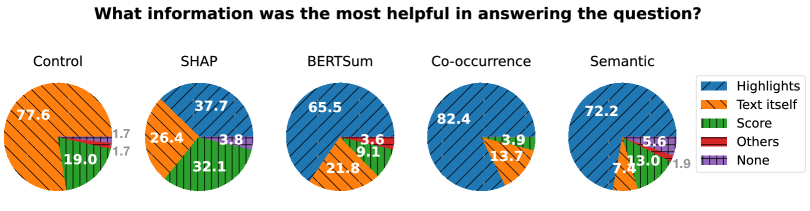
“What information was the most helpful in answering the question?” While the majority of the participants using BERTSum, Co-occurrence, and Semantic methods respond that the highlights were the most helpful, the participants using SHAP have more diverse responses that showed no particular preference (Figure 8). It is interesting to note that the participants using either Co-occurrence or Semantic methods find the role of highlights to be significantly helpful when compared to other methods.
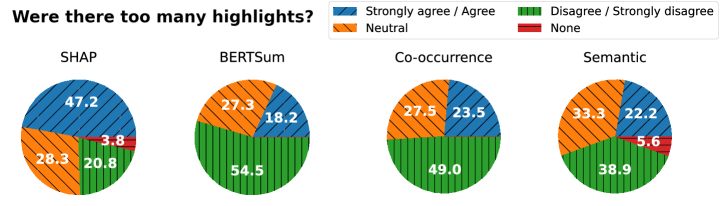
“Were there too many highlights?” We find that the participants using SHAP most strongly agree to this sentiment (Figure 9). One factor that could have contributed to this is the default output values from SHAP used to generate the highlights, which are not post-processed for more succinct representation of information. Appropriate post-processing of the attribution scores may be necessary to better account for this—the impact of the amount of highlights on the task performance is an open research question that requires future work.
5 Conclusion
Motivated by practical concerns in document matching tasks with human decision makers, we conducted a user study to investigate the utility of different kinds of assistive information for the summary-article matching task. We found that even well-established black-box model explanations can potentially impair the users’ decisions, while task-specific approaches can effectively assist them. Existing methods are typically not explicitly optimized for the task’s objective: Model explanations are contingent on the matching model; it attempts to explain what the model considers important, not necessarily what human users find important to perform well in the task. General text summarization methods can be helpful for succinctly expressing a high-level topic of the article, but may lack the precision of picking the details directly related to the given summary. Furthermore, we observed that the users’ subjective perception on the utility of (assistive) information was misaligned with their performance on the task. These results altogether emphasize that it is important for the developers of such assistive tools to articulate the specific use (and users) it serves, and rigorously evaluate their proposals.
We believe that the summary-article matching task can be used as a first-pass test to validate promising methods (and promote development of new approaches). Relaxing some assumptions in our setup can provide further insights on strengths and weaknesses of individual methods in more complex scenarios (e.g., allowing multiple or no ground-truths in questions). Complex and lengthy documents in practice (e.g., academic papers and reviewer profiles) may require longer data collection phase and more scalable adaptations of the presented methods. For instance, visualizing all highlights with different colors at once (as we did in the summary-article matching task) may not be practical for longer documents. Necessary changes in the user interface can address such issues, e.g., the highlights can be shown interactively based on what information the user is interested in.
Acknowledgments
We thank Kasun Amarasinghe, Siddhant Arora, Keegan Harris, Nari Johnson, and Yilun Zhou for helpful feedback and discussions. This research was approved by CMU Institutional Review Board (IRB). This work was supported in part by the National Science Foundation grants CIF1942124, IIS1705121, IIS1838017, IIS2046613, IIS2112471, CIF1763734 and funding from Meta, Morgan Stanley, Amazon, and Google. Any opinions, findings and conclusions or recommendations expressed in this material are those of the author(s) and do not necessarily reflect the views of any of these funding agencies.
References
- Alzahrani et al. (2012) Salha M. Alzahrani, Naomie Salim, and Ajith Abraham. Understanding plagiarism linguistic patterns, textual features, and detection methods. IEEE Transactions on Systems, Man, and Cybernetics, Part C (Applications and Reviews), 42(2):133–149, 2012. doi: 10.1109/TSMCC.2011.2134847.
- Amarasinghe et al. (2022) Kasun Amarasinghe, Kit T Rodolfa, Sérgio Jesus, Valerie Chen, Vladimir Balayan, Pedro Saleiro, Pedro Bizarro, Ameet Talwalkar, and Rayid Ghani. On the importance of application-grounded experimental design for evaluating explainable ml methods. arXiv preprint arXiv:2206.13503, 2022.
- Arora et al. (2022) Siddhant Arora, Danish Pruthi, Norman Sadeh, William W. Cohen, Zachary C. Lipton, and Graham Neubig. Explain, edit, and understand: Rethinking user study design for evaluating model explanations. Proceedings of the AAAI Conference on Artificial Intelligence, 36(5):5277–5285, Jun. 2022. doi: 10.1609/aaai.v36i5.20464. URL https://ojs.aaai.org/index.php/AAAI/article/view/20464.
- Bansal et al. (2021) Gagan Bansal, Tongshuang Wu, Joyce Zhou, Raymond Fok, Besmira Nushi, Ece Kamar, Marco Tulio Ribeiro, and Daniel Weld. Does the whole exceed its parts? the effect of ai explanations on complementary team performance. In Proceedings of the 2021 CHI Conference on Human Factors in Computing Systems, pp. 1–16, 2021.
- Bansal et al. (2019) Neha Bansal, Arun Sharma, and RK Singh. A review on the application of deep learning in legal domain. In IFIP International Conference on Artificial Intelligence Applications and Innovations, pp. 374–381. Springer, 2019.
- Black & van Esch (2020) J Stewart Black and Patrick van Esch. AI-enabled recruiting: What is it and how should a manager use it? Business Horizons, 63(2):215–226, 2020.
- Cao et al. (2018) Ziqiang Cao, Furu Wei, Wenjie Li, and Sujian Li. Faithful to the original: Fact aware neural abstractive summarization. In thirty-second AAAI conference on artificial intelligence, 2018.
- Charlin & Zemel (2013) Laurent Charlin and Richard Zemel. The Toronto paper matching system: an automated paper-reviewer assignment system. 2013.
- Chen et al. (2022) Valerie Chen, Jeffrey Li, Joon Sik Kim, Gregory Plumb, and Ameet Talwalkar. Interpretable machine learning: Moving from mythos to diagnostics. Queue, 19(6):28–56, 2022.
- Cohan et al. (2020) Arman Cohan, Sergey Feldman, Iz Beltagy, Doug Downey, and Daniel Weld. SPECTER: Document-level representation learning using citation-informed transformers. In Proceedings of the 58th Annual Meeting of the Association for Computational Linguistics, pp. 2270–2282, Online, July 2020. Association for Computational Linguistics. doi: 10.18653/v1/2020.acl-main.207. URL https://aclanthology.org/2020.acl-main.207.
- Doshi-Velez & Kim (2017) Finale Doshi-Velez and Been Kim. Towards a rigorous science of interpretable machine learning. arXiv preprint arXiv:1702.08608, 2017.
- Elnaggar et al. (2018) Ahmed Elnaggar, Christoph Gebendorfer, Ingo Glaser, and Florian Matthes. Multi-task deep learning for legal document translation, summarization and multi-label classification. In Proceedings of the 2018 Artificial Intelligence and Cloud Computing Conference, pp. 9–15, 2018.
- Fernández & Fernández (2019) Carmen Fernández and Alberto Fernández. Ethical and legal implications of ai recruiting software. Ercim News, 116:22–23, 2019.
- Fiez et al. (2020) T Fiez, N Shah, and L Ratliff. A SUPER* algorithm to optimize paper bidding in peer review. In Conference on Uncertainty in Artificial Intelligence, 2020.
- Foltỳnek et al. (2019) Tomáš Foltỳnek, Norman Meuschke, and Bela Gipp. Academic plagiarism detection: a systematic literature review. ACM Computing Surveys (CSUR), 52(6):1–42, 2019.
- Foltỳnek et al. (2020) Tomáš Foltỳnek, Dita Dlabolová, Alla Anohina-Naumeca, Salim Razı, Július Kravjar, Laima Kamzola, Jean Guerrero-Dib, Özgür Çelik, and Debora Weber-Wulff. Testing of support tools for plagiarism detection. International Journal of Educational Technology in Higher Education, 17(1):1–31, 2020.
- Hahn & Mani (2000) U. Hahn and I. Mani. The challenges of automatic summarization. Computer, 33(11):29–36, 2000. doi: 10.1109/2.881692.
- Hermann et al. (2015) Karl Moritz Hermann, Tomas Kocisky, Edward Grefenstette, Lasse Espeholt, Will Kay, Mustafa Suleyman, and Phil Blunsom. Teaching machines to read and comprehend. Advances in neural information processing systems, 28, 2015.
- Huang et al. (2020) Yuxin Huang, Zhengtao Yu, Junjun Guo, Zhiqiang Yu, and Yantuan Xian. Legal public opinion news abstractive summarization by incorporating topic information. International Journal of Machine Learning and Cybernetics, 11(9):2039–2050, 2020.
- Jesus et al. (2021) Sérgio Jesus, Catarina Belém, Vladimir Balayan, João Bento, Pedro Saleiro, Pedro Bizarro, and João Gama. How can i choose an explainer? an application-grounded evaluation of post-hoc explanations. In Proceedings of the 2021 ACM Conference on Fairness, Accountability, and Transparency, pp. 805–815, 2021.
- Ji et al. (2022) Ziwei Ji, Nayeon Lee, Rita Frieske, Tiezheng Yu, Dan Su, Yan Xu, Etsuko Ishii, Yejin Bang, Andrea Madotto, and Pascale Fung. Survey of hallucination in natural language generation. ACM Computing Surveys, 2022.
- Jiffriya et al. (2021) M Jiffriya, MA Jahan, and R Ragel. Plagiarism detection tools and techniques: A comprehensive survey. Journal of Science-FAS-SEUSL, 2(02):47–64, 2021.
- Kaur et al. (2020) Harmanpreet Kaur, Harsha Nori, Samuel Jenkins, Rich Caruana, Hanna Wallach, and Jennifer Wortman Vaughan. Interpreting interpretability: understanding data scientists’ use of interpretability tools for machine learning. In Proceedings of the 2020 CHI conference on human factors in computing systems, pp. 1–14, 2020.
- Kerzendorf et al. (2020) Wolfgang E Kerzendorf, Ferdinando Patat, Dominic Bordelon, Glenn van de Ven, and Tyler A Pritchard. Distributed peer review enhanced with natural language processing and machine learning. Nature Astronomy, pp. 1–7, 2020.
- Lai & Tan (2019) Vivian Lai and Chenhao Tan. On human predictions with explanations and predictions of machine learning models: A case study on deception detection. In Proceedings of the conference on fairness, accountability, and transparency, pp. 29–38, 2019.
- Lai et al. (2020) Vivian Lai, Han Liu, and Chenhao Tan. “Why is ‘Chicago’ deceptive?” towards building model-driven tutorials for humans. In Proceedings of the 2020 CHI Conference on Human Factors in Computing Systems, pp. 1–13, 2020.
- Lewis et al. (2020) Mike Lewis, Yinhan Liu, Naman Goyal, Marjan Ghazvininejad, Abdelrahman Mohamed, Omer Levy, Veselin Stoyanov, and Luke Zettlemoyer. BART: Denoising sequence-to-sequence pre-training for natural language generation, translation, and comprehension. In Proceedings of the 58th Annual Meeting of the Association for Computational Linguistics, pp. 7871–7880, Online, July 2020. Association for Computational Linguistics. doi: 10.18653/v1/2020.acl-main.703. URL https://aclanthology.org/2020.acl-main.703.
- Li et al. (2021) Lan Li, Tina Lassiter, Joohee Oh, and Min Kyung Lee. Algorithmic hiring in practice: Recruiter and HR professional’s perspectives on AI use in hiring. In Proceedings of the 2021 AAAI/ACM Conference on AI, Ethics, and Society, AIES ’21, pp. 166–176, New York, NY, USA, 2021. Association for Computing Machinery. ISBN 9781450384735. doi: 10.1145/3461702.3462531. URL https://doi.org/10.1145/3461702.3462531.
- Lin (2004) Chin-Yew Lin. ROUGE: A package for automatic evaluation of summaries. In Text Summarization Branches Out, pp. 74–81, Barcelona, Spain, July 2004. Association for Computational Linguistics. URL https://aclanthology.org/W04-1013.
- Liu & Lapata (2019) Yang Liu and Mirella Lapata. Text summarization with pretrained encoders. In Proceedings of the 2019 Conference on Empirical Methods in Natural Language Processing and the 9th International Joint Conference on Natural Language Processing (EMNLP-IJCNLP), pp. 3730–3740, Hong Kong, China, November 2019. Association for Computational Linguistics. doi: 10.18653/v1/D19-1387. URL https://aclanthology.org/D19-1387.
- Lundberg & Lee (2017) Scott M Lundberg and Su-In Lee. A unified approach to interpreting model predictions. Advances in neural information processing systems, 30, 2017.
- Maynez et al. (2020) Joshua Maynez, Shashi Narayan, Bernd Bohnet, and Ryan McDonald. On faithfulness and factuality in abstractive summarization. In Proceedings of the 58th Annual Meeting of the Association for Computational Linguistics, pp. 1906–1919, Online, July 2020. Association for Computational Linguistics. doi: 10.18653/v1/2020.acl-main.173. URL https://aclanthology.org/2020.acl-main.173.
- Meir et al. (2020) Reshef Meir, Jérôme Lang, Julien Lesca, Natan Kaminsky, and Nicholas Mattei. A market-inspired bidding scheme for peer review paper assignment. In Games, Agents, and Incentives Workshop at AAMAS, 2020.
- Mimno & McCallum (2007) David Mimno and Andrew McCallum. Expertise modeling for matching papers with reviewers. In KDD, 2007.
- Novakovsky et al. (2022) Gherman Novakovsky, Nick Dexter, Maxwell W Libbrecht, Wyeth W Wasserman, and Sara Mostafavi. Obtaining genetics insights from deep learning via explainable artificial intelligence. Nature Reviews Genetics, pp. 1–13, 2022.
- Pagnoni et al. (2021) Artidoro Pagnoni, Vidhisha Balachandran, and Yulia Tsvetkov. Understanding factuality in abstractive summarization with frank: A benchmark for factuality metrics. In Proceedings of the 2021 Conference of the North American Chapter of the Association for Computational Linguistics: Human Language Technologies, pp. 4812–4829, 2021.
- Pier et al. (2017) Elizabeth Pier, Joshua Raclaw, Anna Kaatz, Markus Brauer, Molly Carnes, Mitchell Nathan, and Cecilia Ford. Your comments are meaner than your score: score calibration talk influences intra-and inter-panel variability during scientific grant peer review. Research Evaluation, 26(1):1–14, 2017.
- Poovizhi et al. (2022) P. Poovizhi, K. Ezhilarasi, G. Gayathri, R. Megala, and D. Anisha. Automatic scraping of employment record using machine learning—an assistance for the recruiter. In R. Asokan, Diego P. Ruiz, Zubair A. Baig, and Selwyn Piramuthu (eds.), Smart Data Intelligence, pp. 561–577, Singapore, 2022. Springer Nature Singapore. ISBN 978-981-19-3311-0.
- Pucci et al. (2022) Fabrizio Pucci, Martin Schwersensky, and Marianne Rooman. Artificial intelligence challenges for predicting the impact of mutations on protein stability. Current opinion in structural biology, 72:161–168, 2022.
- Reimers & Gurevych (2019) Nils Reimers and Iryna Gurevych. Sentence-bert: Sentence embeddings using siamese bert-networks. In Proceedings of the 2019 Conference on Empirical Methods in Natural Language Processing. Association for Computational Linguistics, 11 2019. URL http://arxiv.org/abs/1908.10084.
- Rodriguez & Bollen (2008) Marko A. Rodriguez and Johan Bollen. An algorithm to determine peer-reviewers. In ACM Conference on Information and Knowledge Management, 2008.
- Schumann et al. (2020) Candice Schumann, Jeffrey Foster, Nicholas Mattei, and John Dickerson. We need fairness and explainability in algorithmic hiring. In International Conference on Autonomous Agents and Multi-Agent Systems (AAMAS), 2020.
- See et al. (2017) Abigail See, Peter J. Liu, and Christopher D. Manning. Get to the point: Summarization with pointer-generator networks. In Proceedings of the 55th Annual Meeting of the Association for Computational Linguistics (Volume 1: Long Papers), pp. 1073–1083, Vancouver, Canada, July 2017. Association for Computational Linguistics. doi: 10.18653/v1/P17-1099. URL https://aclanthology.org/P17-1099.
- Shah et al. (2018) Nihar Shah, Behzad Tabibian, Krikamol Muandet, Isabelle Guyon, and Ulrike Von Luxburg. Design and analysis of the NIPS 2016 review process. JMLR, 19(1):1913–1946, 2018.
- Shah (2022) Nihar B Shah. Challenges, experiments, and computational solutions in peer review. Communications of the ACM, 65(6):76–87, 2022.
- Shleifer & Rush (2020) Sam Shleifer and Alexander M Rush. Pre-trained summarization distillation. arXiv preprint arXiv:2010.13002, 2020.
- Shrikumar et al. (2016) Avanti Shrikumar, Peyton Greenside, Anna Shcherbina, and Anshul Kundaje. Not just a black box: Learning important features through propagating activation differences. arXiv preprint arXiv:1605.01713, 2016.
- Sidak (1967) Zbynek Sidak. Rectangular confidence regions for the means of multivariate normal distributions. Journal of the American Statistical Association, 62(318):626–633, 1967. ISSN 01621459. URL http://www.jstor.org/stable/2283989.
- Simonyan et al. (2013) Karen Simonyan, Andrea Vedaldi, and Andrew Zisserman. Deep inside convolutional networks: Visualising image classification models and saliency maps. arXiv preprint arXiv:1312.6034, 2013.
- Sundararajan et al. (2017) Mukund Sundararajan, Ankur Taly, and Qiqi Yan. Axiomatic attribution for deep networks. In International conference on machine learning, pp. 3319–3328. PMLR, 2017.
- Thorn Jakobsen & Rogers (2022) Terne Thorn Jakobsen and Anna Rogers. What factors should paper-reviewer assignments rely on? community perspectives on issues and ideals in conference peer-review. In Proceedings of the 2022 Conference of the North American Chapter of the Association for Computational Linguistics: Human Language Technologies, pp. 4810–4823, Seattle, United States, July 2022. Association for Computational Linguistics. doi: 10.18653/v1/2022.naacl-main.354. URL https://aclanthology.org/2022.naacl-main.354.
- Tran et al. (2017) H. D. Tran, G. Cabanac, and G. Hubert. Expert suggestion for conference program committees. In 2017 11th International Conference on Research Challenges in Information Science (RCIS), pp. 221–232, May 2017. doi: 10.1109/RCIS.2017.7956540.
- Wang & Yin (2021) Xinru Wang and Ming Yin. Are explanations helpful? a comparative study of the effects of explanations in AI-assisted decision-making. In 26th International Conference on Intelligent User Interfaces, pp. 318–328, 2021.
- Wieting et al. (2019) John Wieting, Kevin Gimpel, Graham Neubig, and Taylor Berg-Kirkpatrick. Simple and effective paraphrastic similarity from parallel translations. In ACL, pp. 4602–4608, Florence, Italy, July 2019.
- Wu et al. (2020) Fangzhao Wu, Ying Qiao, Jiun-Hung Chen, Chuhan Wu, Tao Qi, Jianxun Lian, Danyang Liu, Xing Xie, Jianfeng Gao, Winnie Wu, and Ming Zhou. MIND: A large-scale dataset for news recommendation. In Proceedings of the 58th Annual Meeting of the Association for Computational Linguistics, pp. 3597–3606, Online, July 2020. Association for Computational Linguistics. doi: 10.18653/v1/2020.acl-main.331. URL https://aclanthology.org/2020.acl-main.331.
- Yang et al. (2022) Guang Yang, Qinghao Ye, and Jun Xia. Unbox the black-box for the medical explainable AI via multi-modal and multi-centre data fusion: A mini-review, two showcases and beyond. Information Fusion, 77:29–52, 2022.
- Zablocki et al. (2022) Éloi Zablocki, Hédi Ben-Younes, Patrick Pérez, and Matthieu Cord. Explainability of deep vision-based autonomous driving systems: Review and challenges. International Journal of Computer Vision, pp. 1–28, 2022.
- Zhang et al. (2020) Jingqing Zhang, Yao Zhao, Mohammad Saleh, and Peter Liu. Pegasus: Pre-training with extracted gap-sentences for abstractive summarization. In International Conference on Machine Learning, pp. 11328–11339. PMLR, 2020.
- Zhong et al. (2020) Ming Zhong, Pengfei Liu, Yiran Chen, Danqing Wang, Xipeng Qiu, and Xuanjing Huang. Extractive summarization as text matching. In Proceedings of the 58th Annual Meeting of the Association for Computational Linguistics, pp. 6197–6208, Online, July 2020. Association for Computational Linguistics. doi: 10.18653/v1/2020.acl-main.552. URL https://aclanthology.org/2020.acl-main.552.
Appendices
Appendix A Proxy Test of Black-box Model Explanations
There are several black-box model explanations to consider for the task. While testing all of them on real users can be an interesting research on its own, as we are more broadly interested in what distinct types of information could be helpful, we decide to select one representative method in the literature. As there is no absolute answer to which method is superior, we conduct a simple proxy test of what method can be a better choice for the task.
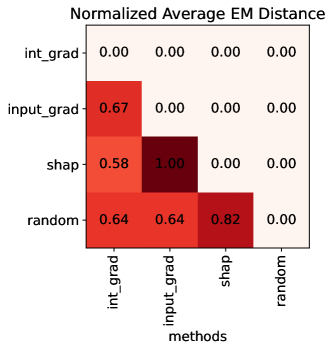
We consider the following feature attribution methods: Integrated Gradients (Sundararajan et al., 2017), Input x Gradients (Shrikumar et al., 2016), and SHAP (Lundberg & Lee, 2017). In Figure 10, we plot the mean EM distance (averaged across 50 different random attributions, normalized to be between 0 and 1) between the distribution of attribution scores for the input tokens in our ground-truth articles. The higher the value (darker the color), the more distinct the distribution of the attribution scores computed by respective methods. Notice that SHAP shows the most distinct distribution from random attributions compared to other methods, indicating it may be a better choice that carry more information about the important tokens. We have also qualitatively verified that the highlights from other two methods were not as meaningful as SHAP on the articles.
Note also that SHAP is a promising candidate to apply to the task due to its popularity and its common presence in more sophisticated domains like biology, physics, chemistry, and finance (Jesus et al., 2021; Novakovsky et al., 2022; Yang et al., 2022; Zablocki et al., 2022; Pucci et al., 2022).
Appendix B Method Examples
We show below some example highlights presented to the users using different methods.
Appendix C User Study Details
C.1 Pilots and Sample Size
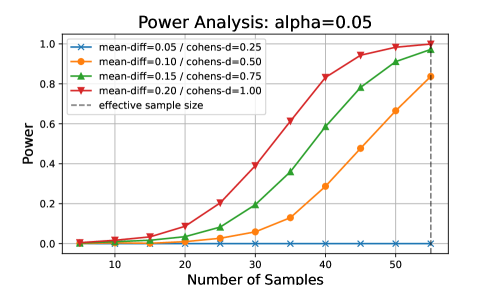
Prior to conducting the actual user study, we ran pilot studies on a smaller number of participants. Using the data points collected from these studies, we conducted a Monte Carlo simulation-based power analysis to determine the effective sample size. We determined to recruit 55 participants per condition (so total of 275 = 55 5 conditions) for a statistical power over 0.8 with the effect size (Cohen’s d) of 0.5 (orange line with circle markers in Figure 15). This effect size corresponds to 0.1 difference in the mean accuracy between the control and the treatment.
C.2 Demographic Background
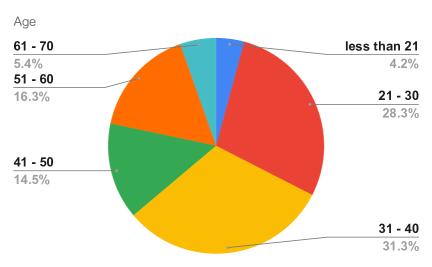
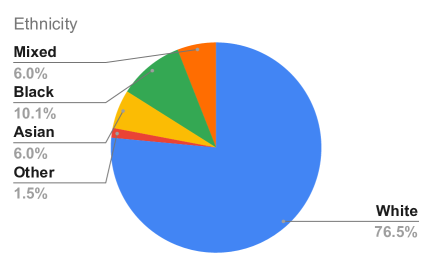
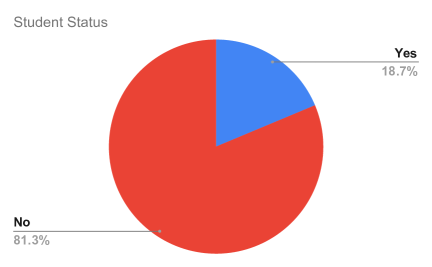
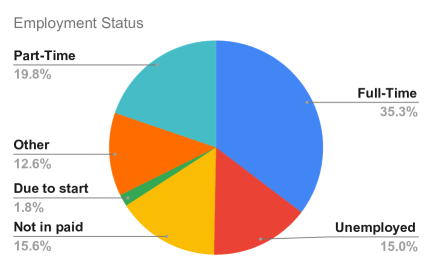
In Figure 16, we provide demographic background of the participants (age, ethnicity, student status, employment status) recruited for the study. participants were recruited from a balanced pool of adult males and females located in the U.S. with minimum approval ratings of using Prolific (www.prolific.co).
C.3 Tutorial
We provide the participants with a set of instructions laying out what the highlights indicate and how one might use them for the task. The instruction is followed by two sample questions on which the participants could take unlimited time to get an understanding of what the questions look like. For the sample questions, the participants were provided the correct answers and the justification behind them as feedback.
C.4 Payments
Base payment per participants was $3.15, determined based on the minimum hourly payment set by the platform and the median completion time of all participants, resulting in an average reward of $12.07 per hour. To encourage quicker and more accurate responses, we designed bonus payments so that each participant could earn additional $ (base payment for the question multiplier) for each correctly answered questions, where the multiplier is determined by the response time on the question (Table 1). One could ideally earn up to the base payment by answering all questions correctly, all within 30 seconds. All payments (base and bonus) were processed after the data collection was complete, accounting for invalid responses.
| Response Time (seconds) | < 30 | < 60 | < 90 | < 120 | > 120 |
|---|---|---|---|---|---|
| Multiplier | x0.5 | x0.4 | x0.3 | x0.2 | x0.0 |