ClaPIM: Scalable Sequence CLAssification using Processing-In-Memory
Abstract
DNA sequence classification is a fundamental task in computational biology with vast implications for applications such as disease prevention and drug design. Therefore, fast high-quality sequence classifiers are significantly important. This paper introduces ClaPIM, a scalable DNA sequence classification architecture based on the emerging concept of hybrid in-crossbar and near-crossbar memristive processing-in-memory (PIM). We enable efficient and high-quality classification by uniting the filter and search stages within a single algorithm. Specifically, we propose a custom filtering technique that drastically narrows the search space and a search approach that facilitates approximate string matching through a distance function. ClaPIM is the first PIM architecture for scalable approximate string matching that benefits from the high density of memristive crossbar arrays and the massive computational parallelism of PIM. Compared with Kraken2, a state-of-the-art software classifier, ClaPIM provides significantly higher classification quality (up to improvement in F1 score) and also demonstrates a throughput improvement. Compared with EDAM, a recently-proposed SRAM-based accelerator that is restricted to small datasets, we observe both a improvement in normalized throughput per area and a increase in classification precision.
Index Terms:
Processing-in-memory, Accelerator, Bioinformatics, DNA classification, Approximate string matching.I Introduction
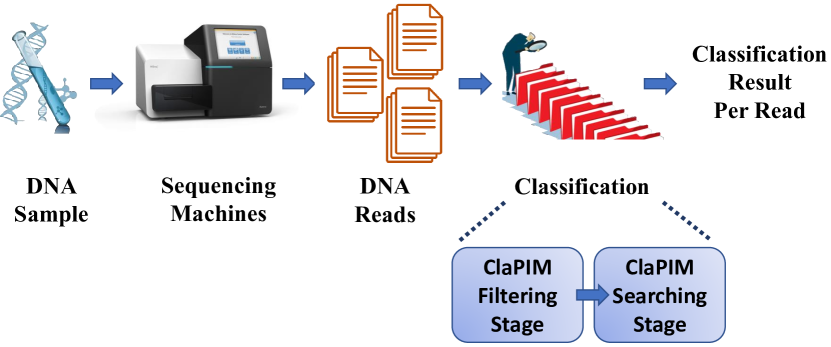
Bioinformatics has significantly contributed to modern medical care through advances such as personalized medicine and accurate disease diagnostics. A fundamental task in bioinformatics is taxonomic DNA classification: classifying genomes by species. This task is accomplished by first establishing a database of reference DNA sequences representing potential species and then sequencing a query DNA sample using sequencing machines that produce numerous short reads (sub-sequences of the sampled DNA). The goal of DNA classification is to determine the most likely species to which the sample belongs by comparing the reads to the database. As sequencing machines are prone to sequencing errors and given that mutations are common even between different samples of the same species, approximate sequence (string) matching is advantageous when comparing reads to the reference DNA segments [1]. The classification pipeline is presented in Fig. 1.
As opposed to the common case of exact string comparison, approximate string matching can tolerate edits up until a pre-defined edit distance (number of substitutions, insertions, and deletions) between the two strings. Notice that approximate string matching also arises in other classification-based data-intensive applications such as data filtration for security monitoring, digital forensics, and data analytics [2].
Unfortunately, traditional efficient solutions for string searching (e.g., suffix trees [3]) cannot support approximate matching. Other classification tools [4] implement approximate string matching by applying traditional optimal sequence alignment algorithms such as BLAST [5]; these tools are slow since they are based on a dynamic-programming approach. Therefore, an efficient approximate heuristic-based approach known as -mer matching (-mer is a short DNA sub-sequence) is emerging in modern classifiers. The approach’s idea is to extract -mers from the DNA sequences and match the -mers rather than the full sequences. Classifiers include CLARK [6], LMAT [7], Kraken2 [8], KrakenOnMem [9], and Sieve [10] are using this approach but the main drawback of these classifiers is that the -mers are compared using exact matching, leading to high throughput at the cost of limited sensitivity.
Conversely, the recently introduced HD-CAM [11] and EDAM [12] accelerators proposes a heuristic that enables fast approximate comparisons of -mers. The algorithm proposed by EDAM provides higher classification quality than HDCAM. Still, the main limitation of EDAM stems from the memory technology on which it is implemented: SRAM-based Content-Addressable Memory (SRAM-CAM). This memory technology suffers from poor density and performance scalability and thus cannot support large databases. Scalability is essential for sequence analysis infrastructures as databases on tens of billions of bases are common [13].
Since DNA classification is a data-intensive task that compares up to billions of sequences, processing-in-memory (PIM) platforms are highly suitable. Such platforms enable the data to be processed directly inside the memory without transferring it to a centralized processor. This enables PIM to overcome the \saymemory wall, a performance and energy bottleneck arising from data transfer between the processor and the memory. Memristive memories are an emerging form of PIM platforms as they inherently support data storage and computation within the same memory array [14].
This paper proposes ClaPIM, a novel taxonomic classification accelerator based on emerging PIM techniques. ClaPIM comprises filtering and search stages (Fig. 1) that together enable efficient sequence classification. The search stage is inspired by an algorithm proposed in EDAM. Yet, the algorithm is modified to benefit from the massive density of memristive crossbar arrays (necessary for processing large databases). Furthermore, we propose an additional filtering step that drastically reduces the search space to increase energy efficiency and enable simultaneous in-memory comparisons for multiple DNA queries. Together, these solutions provide massive throughput on large datasets while retaining the superior quality provided by approximate -mer matching. Compared with Kraken2, a state-of-the-art exact-matching software classifier, ClaPIM classification F1 score is greater while still providing a improvement in throughput. Moreover, compared to EDAM, ClaPIM provides a improvement in normalized throughput per area (area efficiency) while also providing an improvement of up to in classification precision.
This paper makes the following contributions:
-
•
To the best of our knowledge, ClaPIM is the first scalable PIM-based accelerator for edit-distance-tolerant classification and is also the first taxonomic classification solution based on memristive memory.
-
•
We propose a hybrid in/near-crossbar approach which exploits sensing circuitry towards efficient count and comparison operations.
-
•
We propose a software filtering stage that improves both energy efficiency and classification precision on large datasets by and up to , respectively.
-
•
We propose a parallel query allocation scheme that increases throughput by dynamically activating different parts of the PIM architecture simultaneously.
II Background
II-A DNA Sequence Classification
A DNA sequence is a string comprised of four basic molecules represented by the letters A, T, G, and C (known as bases).DNA sequence classification matches an unlabeled DNA sample to the closest sequence in an existing reference database. Different classification tasks, such as virus sub-typing or taxonomic classification, follow the same fundamental stages: (1) A metagenomic sample (mixture of DNA from multiple organisms and entities) is obtained, (2) the sample is inserted into a sequencer that outputs numerous small sequences of the DNA known as reads, and (3) each read is compared against the existing database to associate it with known sequences. The sequencing errors carried by the reads, together with the mutations expected between samples of the same species, oblige classifiers to perform approximate string matching when evaluating the similarity between strings.
Classification quality is evaluated through a combination of the sensitivity and precision metrics, defined as follows:
| (1) |
where true positives (TP) represents the number of correctly matched strings, false negatives (FN) denotes the number of strings that should have matched but were not (potentially due to a sequencing error), and false positives (FP) represents the number of strings that were falsely matched. Thus, 100% sensitivity indicates that all true matches were identified, while 100% precision indicates that all identified matches were correct. Since sensitivity trades off with precision and maximizing both metrics is desired, the F1 score is used to evaluate classification quality. This score is the harmonic mean of sensitivity and precision:
| (2) |
Traditional classifiers, e.g., BLAST-based models [15], [4], apply sequence alignment algorithms to determine the similarity between strings. These alignment-based models are computationally expensive and time-consuming, and thus are limited when dealing with large-scale sequences. Alternatively, alignment-free tools have enabled high-throughput processing of sequencing data primarily due to their computational efficiency. The latter tools, such as Kraken2 [8], mainly exploit -mer (read fragment of length ) exact matching heuristics; however, this results in reduced sensitivity in the presence of sequencing errors and mutations within -mers.
HD-CAM [11], on the other hand, proposes tolerating Hamming distance to find the similarity regions. However, such technique mainly allows tolerating substitutions while providing little support to insertion and deletion tolerance.
EDAM [12] resolves this shortcoming by tolerating edit rather than Hamming distance (i.e., supporting all types of edits). EDAM achieves edit distance tolerance by comparing each DNA basepair (a base) not only against the corresponding base in the query but also against its left and right neighbors. Each -mer from the database is stored in a CAM row. Each cell in the row stores one base. The query is fed to the CAM for comparison. As the algorithm can tolerate edit distances (substitutions as well as insertions and deletions of bases), it provides a improvement in sensitivity, and provides a () higher F1 score than Kraken2 (HD-CAM) for DNA sequences with high sequencing error rate. However, the low scalability EDAM suffers from does not stem only from the low density of the memory technology. One of the apparent disadvantages of EDAM is that its cell is wire-bounded: every cell is physically wired to its right and left neighbors. This is a source of potential routing congestion and, therefore, more scalability limitations.
II-B Classification Algorithm
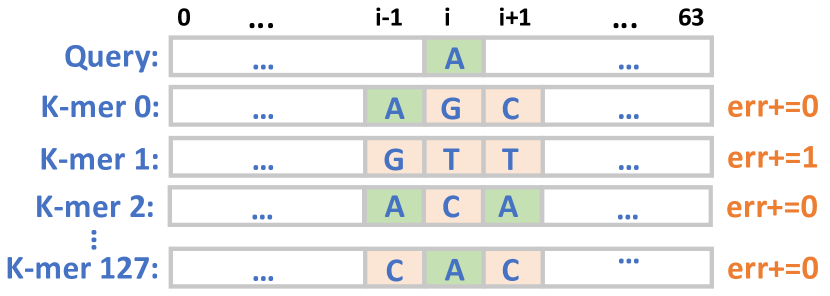
All -mers (sub-sequences of length ) from different known genomes are pre-stored in a single database. ClaPIM assumes ; thus, for each DNA read from the sample, 64-mers are extracted and then queried against the database. The operating principle of EDAM’s classification algorithm is based on the observation that an insertion or deletion shifts part of the data pattern to the right or left, respectively. Hence, by matching not only the co-located bases but also their left and right neighbors, it is possible to tolerate insertions and deletions, as illustrated in Fig. 2. If none of the three candidate data elements (co-located, left, and right neighbors) matches, a single element mismatch occurs, and one edit is counted. A query is considered a hit against the -mer only if the total number of edits does not exceed a predefined edit distance threshold. Lastly, the read is classified by selecting the genome with the maximum number of query hits for the read -mers.
II-C Base-Count Filter
The base-count filter [16] is a heuristic that aims to quickly estimate if the edit distance between two sequences exceeds , a predefined error threshold. FiltPIM [17], for example, uses the base-count filter as a filtering stage for the read alignment task. The filter compares histograms of two sequences and . The number of occurrences of each base in is compared to the number of occurrences of the same base in . For example, if has three more occurrences of A than , we infer that at least three edits exist. For each base , we denote the number of its occurrences in the sequence as . Generally, two sequences are considered similar (the edit distance between them does not exceed ) and will pass the filter only if:
| (3) |
II-D Processing within (Memristive) Memory
Data transfer between processing and memory units is among the leading factors limiting the performance, scalability, and energy efficiency of modern computing systems [18]. PIM platforms may surmount this hurdle by uniting processing and memory units, especially for data-intensive applications. In this paper, we employ a memristive memory processing unit [14] as the underlying PIM architecture, where memristor crossbar arrays both store the data and perform the computation. A memristor is an emerging nonvolatile memory technology that can store data in the form of resistance, logical ‘’ (‘’) for high (low) resistance. This resistance is modified by applying a voltage across the memristor. ClaPIM utilizes two techniques for computation in/near the memory array: (1) digital stateful logic and (2) near-crossbar computing. While digital computing provides more accurate computing, near-crossbar computing is faster. We aim to benefit from both worlds.
II-D1 Stateful Logic
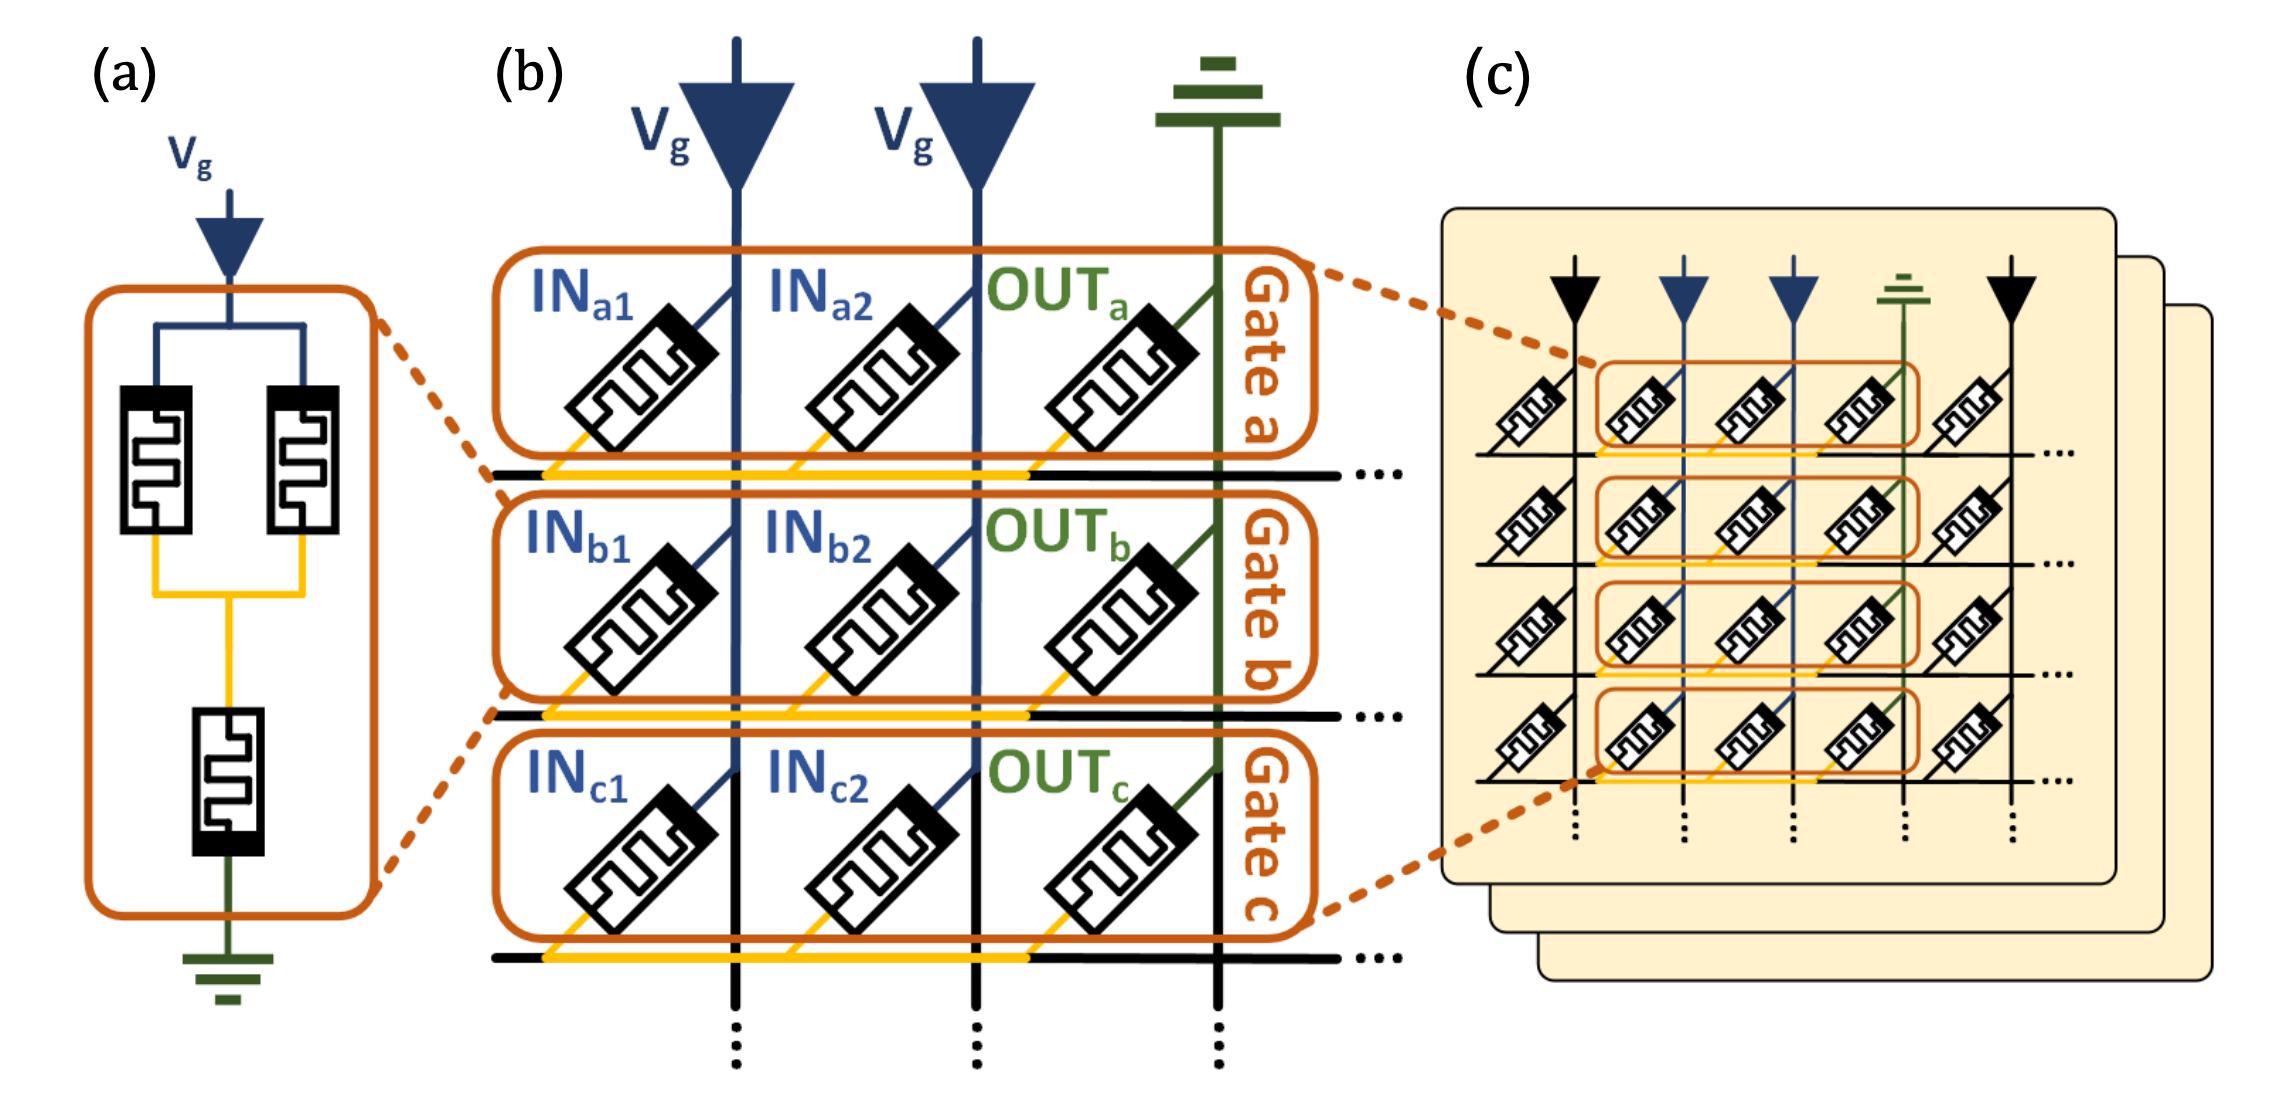
An approach for memristor-based logic where the inputs and outputs of the gates are represented in the same form of data storage, e.g., resistance for memristors. A popular stateful-logic technique is Memristor Aided Logic (MAGIC) [19], in which logic gates are performed on the resistances of the memristors directly inside the crossbar. The inputs of the MAGIC gate are the initial states (resistances) of the input memristors, and applying a fixed voltage to the memristor terminals results in the resistance of the output memristor after the computation storing the logical output. Fig. 3(a) illustrates a MAGIC NOR gate as an example. The MAGIC NOR gate is crossbar compatible, as it can be performed using memristor cells within the same row of the crossbar by applying the voltages on crossbar bitlines. Moreover, MAGIC supports inherent parallelism as the same in-row gate can be performed in parallel across numerous rows (see Fig. 3(b)) and across multiple crossbars (see Fig. 3(c)).
MAGIC NOR is executed in two steps (clock cycles): (1) initializing the output memristor to logical ‘’ (low resistance), (2) applying a voltage across the gate. Since NOR is functionally complete, all other functions can be performed using a sequence of MAGIC NORs. For example, in this work, we perform XOR using five MAGIC NOR cycles (not including initialization cycles, as they can be performed in parallel for all output memristors prior to the computation):
| (4) |
Other MAGIC (or different stateful logic) techniques can also be applied to implement XOR.
II-D2 Near Crossbar Computing
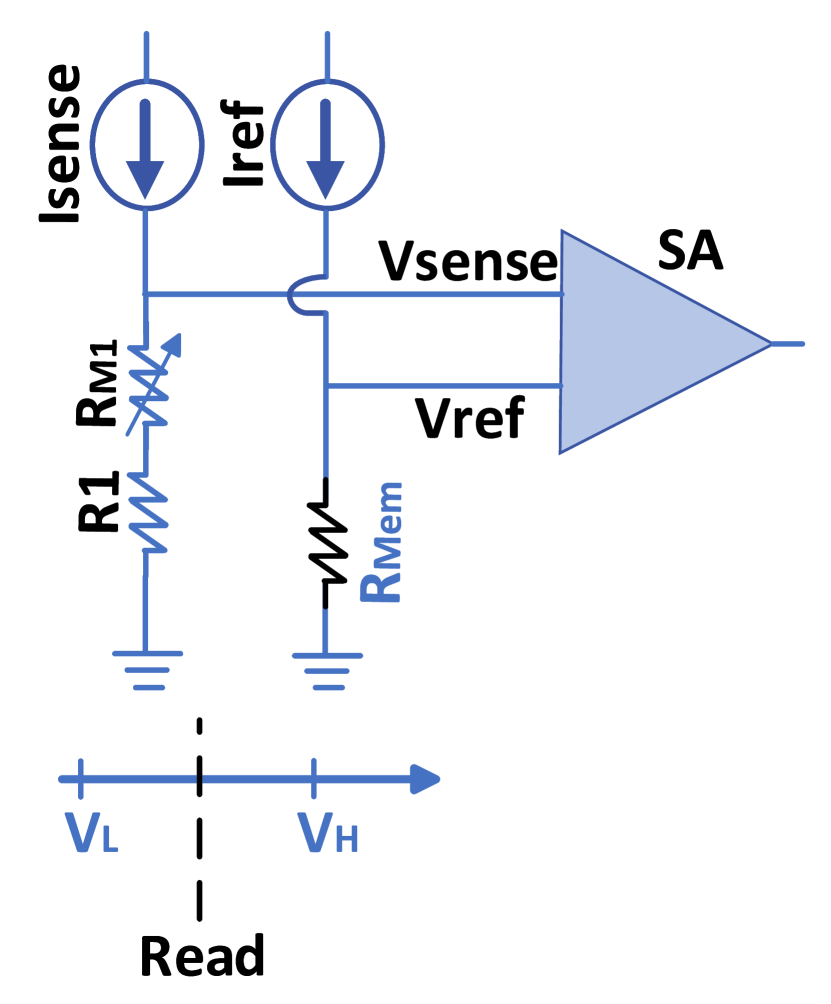
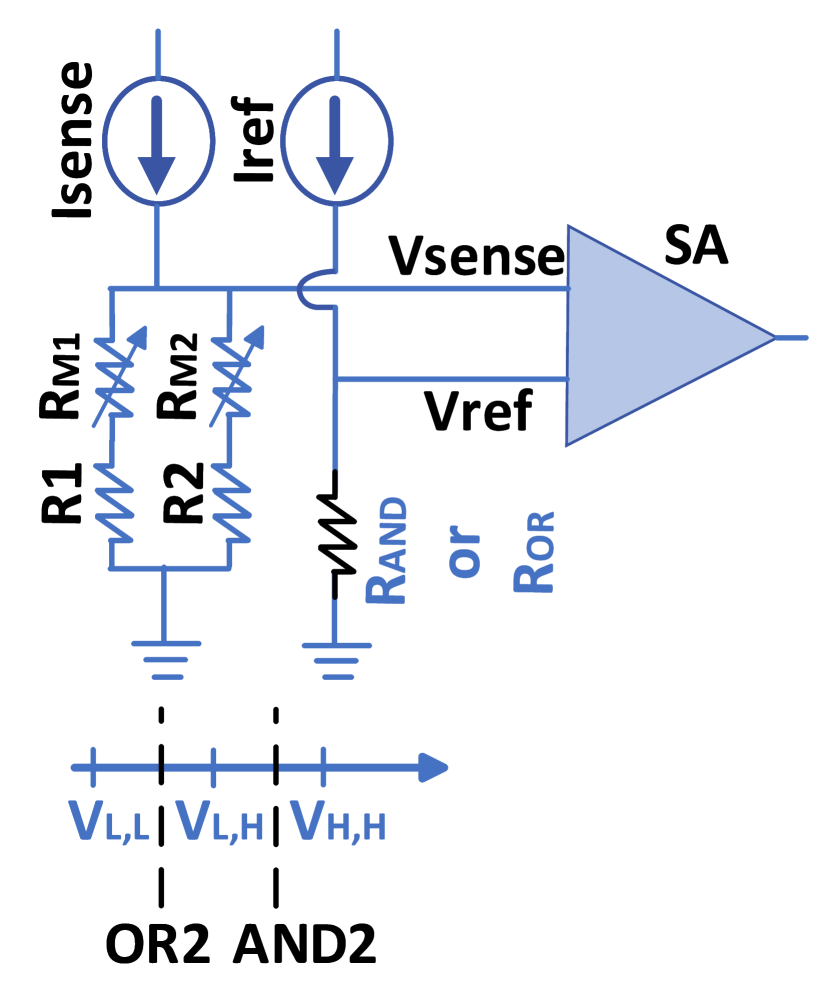
In this approach, data is transferred to the peripheral circuitry (e.g., for state conversion) during the computation [20]. One such technique enables bulk bitwise near-crossbar logic by performing a read operation with two (or more) columns activated simultaneously. By activating multiple memristors per word-line in parallel, we are essentially sensing the equivalent parallel resistance of the selected memristors. Then, the sense amplifier’s (SA) reference is chosen according to the equivalent resistances to perform different basic operations like AND, OR, and MAJ, as explained in AlignS [21] and illustrated in Fig.4.
III ClaPIM Architecture
This section proposes the comparison operation performed in each memristive crossbar and then extends the proposed architecture to the filtering stage. Finally, the overall architecture and the data flow are presented. We use -mer and 64-mer interchangeably as .
III-A Querying within a Memristive Memory Array
The operating principle of ClaPIM’s searching stage is adapted from EDAM’s classification algorithm. We present the implementation of the search algorithm within a single memristive crossbar array. The array is structured to support up to 64–mers and queries; yet, the same principles, with the same data mapping technique, can be applied to larger crossbars to support higher values of .
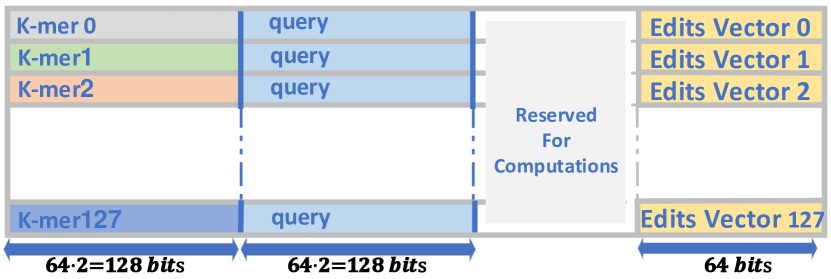
We consider 128512 arrays. 128 rows allow pre-storage of 128 64-mers from the database as each 64-mer is stored in a single row. To represent all four bases (A, T, G, C), two bits are required for each base. When a query arrives, it is written simultaneously to all rows. The data mapping inside the array is shown in Fig. 5.
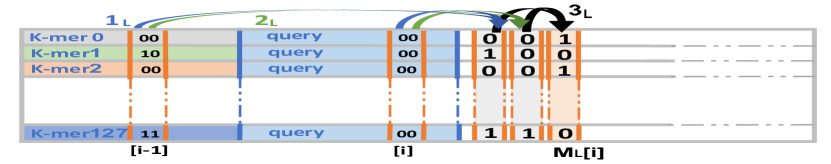
For each index in [0,63], we compare the two columns containing the query base to the two columns containing the corresponding -mer base . We use two MAGIC XOR gates to compare the two bits of the bases simultaneously in all rows (steps and in Fig. 6(a)). We repeat this for the query base with respect to the left neighbor (right neighbor) -mer base (), through steps and ( and ) in Fig. 6(b) (Fig. 6(c)).
A logical ‘’ in columns ,, or represents a match between the query base and its corresponding, left neighbor, or right neighbor base in the -mer, respectively. A match occurs only if both bits of the bases match, i.e., only if the result of both XORs is 0. Thus, to compute , a MAGIC NOR is executed (step ); the same applies for and .
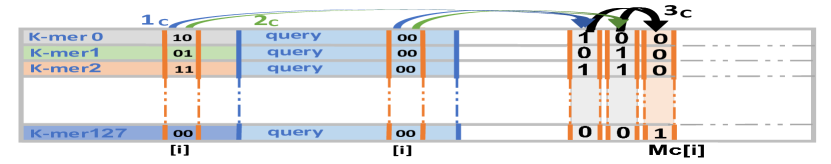
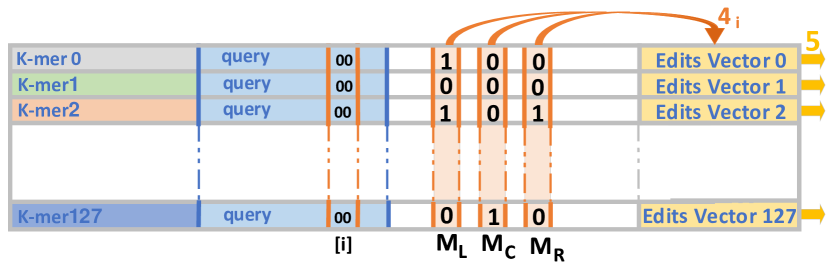
Edits Vector bits are calculated in steps serially, where in step , a three-input MAGIC NOR gate is performed between the three columns ( and ) of the query base (Fig. 7). A logical ‘’ bit in Edits Vector indicates that this query base did not match any of the three bases to which it was compared (three horizontal zeros in and ); thus, it represents a single edit. To fit all these computations in a single row, we reuse intermediate cells; therefore, to reset memristor states, initialization cycles are utilized.
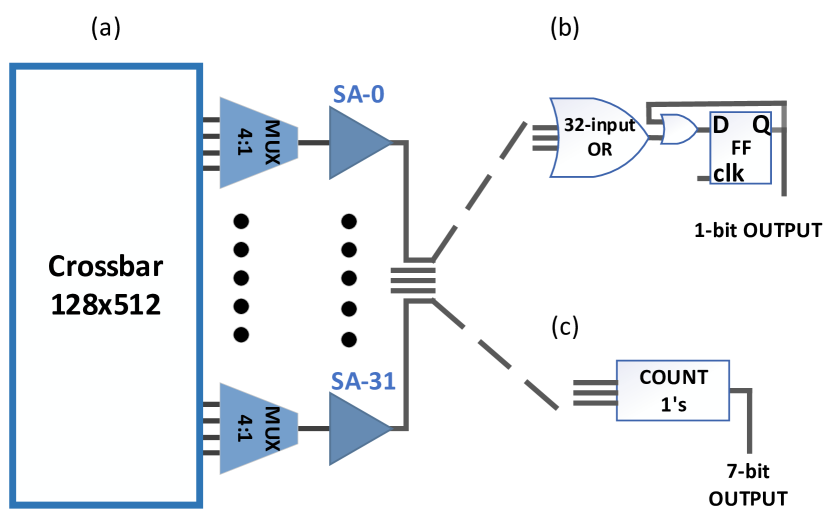
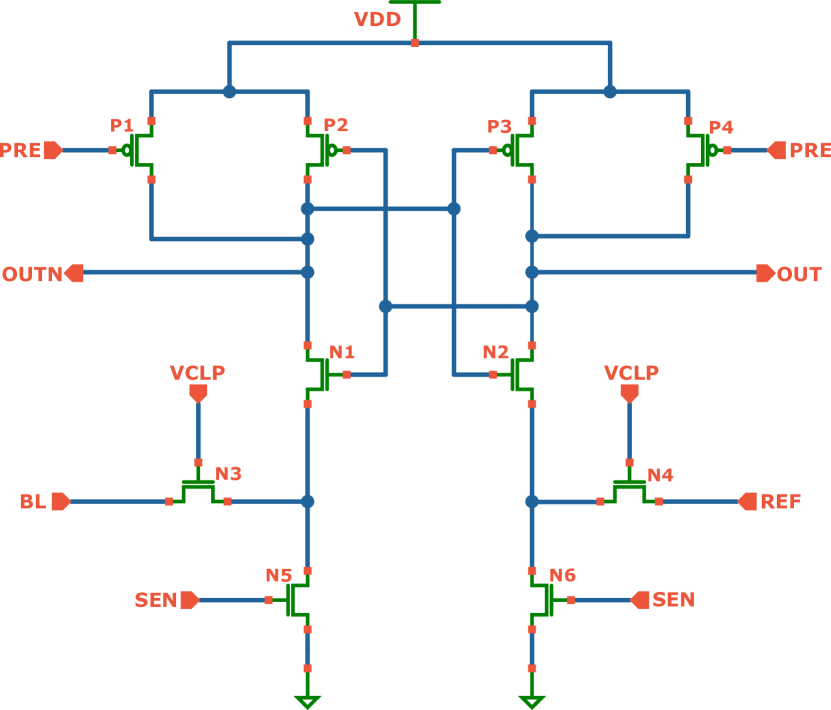
Finally, in step , the number of ‘’s in each Edits Vector is counted and compared to a certain threshold through a near-crossbar operation. We perform a single-cycle ‘read and count’ operation by grounding all the bitlines and connecting a latched current-based sense amplifier (SA) to the wordline. Since all bitlines are activated simultaneously, we can measure the sum of their currents. The SA compares this sum to a reference current to determine if the number of bitlines storing logical ‘’ exceeds the threshold. The circuit design of the SA, shown in Fig. 9, is based on [22], with the reference circuit adjusted to support the required threshold. Hence, the required area for the SA is similar to that of a single-bit SA. To further reduce the area overhead, we use only 32 SAs for a 128512 crossbar, with the appropriate 4:1 multiplexing circuits, as shown in Fig. 8a. To be able to process all rows, step is performed four times with 32 different rows selected each time.
For the general classification case, a single query can match different -mers, in different crossbars belonging to other species. The species with the higher number of hits is selected to associate the query with a certain species. Therefore, we are interested in knowing if there is a hit or not and how many hits were found in each crossbar. Therefore, the output of the SAs is fed into a counter that produces and returns the total match count (Fig. 8c). Suppose we are interested only in detection (detecting specific species in the sample) instead of classification. In that case, we only need to know if there is a hit in the reference database. Thus, the periphery can be reduced, with the counter replaced by an OR gate and the crossbar returning only a 1-bit hit/miss (Fig. 8b). Finally, a simple network on chip in a tree-like topology is employed to gather the hit results from all the crossbars.
In summary, we propose parallel in-crossbar and near-crossbar operations that are efficiently used towards a query check against the -mers stored inside the crossbar.
III-B Filtering Stage
Naively performing the search for each query against all crossbars in massive datasets (up to tens of millions of crossbars) will lead to enormous energy consumption. Furthermore, this will shorten the lifetime of the limited write-endurance memory devices as they are frequently written.
Therefore, we introduce a filtering stage to produce a more efficient design. This stage is executed in the CPU before performing the search in the memristive memory. For each query, rather than comparing it against all crossbars, the query is compared only to crossbars containing -mers with a potential hit as defined by the filter. To find such -mers, the histogram of bases for each -mer in the database is pre-computed offline, and all -mers (of the same species) with the same histogram are stored together in sequential crossbars (if more than one crossbar is required). K-mers with different histograms reside in different crossbars. This manner of storing the k-mers hardly affects crossbar utilization. Applying this method when mapping the k-mers of chromosomes 1, 20, and 21, for example, resulted in crossbar utilization of , , and , respectively. Then, we store two numbers (start and finish indexes) for every potential -mer histogram, specifying the range of its corresponding crossbars.
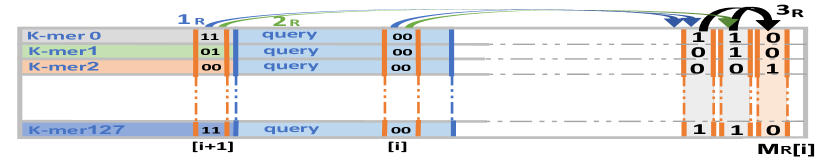
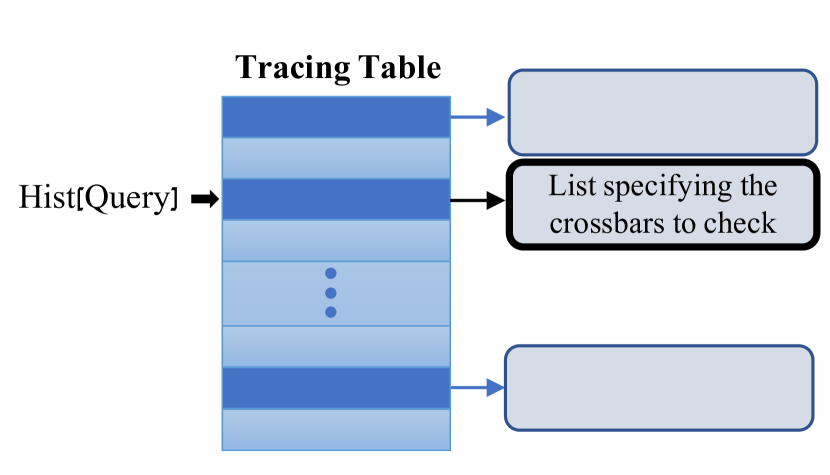
During the operation, the histogram of each query is also computed. The query will only be compared to crossbars correlated with all its neighboring histograms: histograms passing the base-count filter against our query histogram (see Section II-C). To efficiently perform the tracing of the crossbars with corresponding neighboring histograms, the processor maintains a tracing table that contains, for each possible histogram, a pointer to a complete list of crossbar ranges belonging to the neighboring histograms, as illustrated in Fig. 10.
There are approximately 50K different possible histograms for a string of length 64111Each histogram is represented by four integers whose sum is 64 (specifying the number of A, T, G, and C in the string). The number of possible histograms is equal to the combinatorial problem of distributing identical balls into four distinct boxes: .. The histogram representation is used as an index to access the tracing table. The tracing table has rows as each histogram is represented by eighteen bits (six bits for #A, #T, and #G while #C can be calculated from these numbers). There are a total of different possible histograms and thus a total of lists. By setting an eth of, e.g., 4, each arbitrary histogram will have at most 309 neighboring histograms. Since three bytes will be enough to represent the largest crossbar index in the chip and two indexes are needed to represent each range Thus, the size of each list will be . Thus, the table will use of memory.
The number of searches performed in each crossbar will be substantially reduced since the lookup in a crossbar is performed only if it has potential hits. This reduction will considerably increase the lifetime of the devices and reduce energy consumption as fewer devices are activated per query.
Additionally, the base-count filter boosts the precision of the classification algorithm since it can discard potential FP results, which the basic EDAM algorithm would have falsely matched. For example, let “” be the reference -mer, “” be the query, and the edit distance threshold 1. The edit distance between the two strings is 2 (substitution-match-substitution); therefore, these two strings should generate a negative result (a mismatch). While EDAM would have considered it as a hit (thus generating an FP result), the base-count filter removes such -mer from the list of potential hits, thereby improving the classification precision.
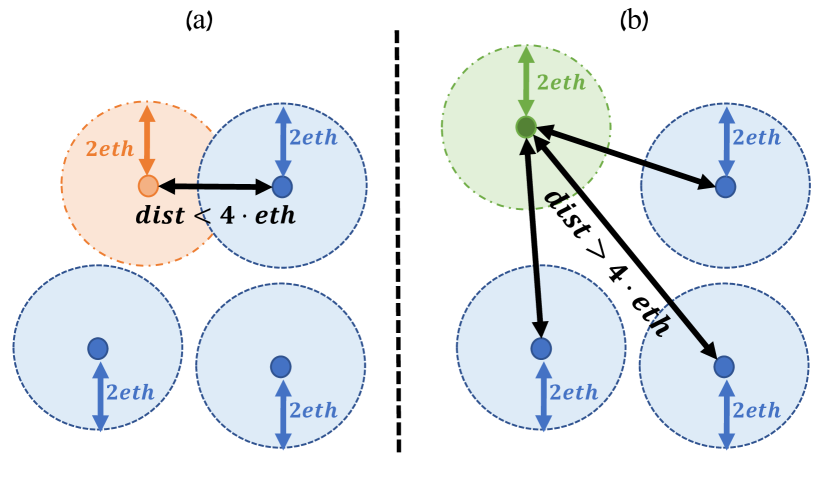
Improvement in throughput can also be achieved by allowing different queries that access different crossbars to be checked simultaneously. To that end, we propose a batching step on the CPU that dynamically allocates parallel queries. The algorithm proceeds as follows. We begin by adding the first query to the batch. Then, for each new query, if the query histogram is at least twice apart from all histograms of the queries already in the batch, this new query will also be inserted. This condition guarantees that all of the chosen queries have non-overlapping neighboring histograms, meaning they access different crossbars and thus can be queried simultaneously. Fig. 11 shows an example of adding two different queries with two different histograms to a batch. The center of each blue circle represents a histogram () of a query already in the batch while new queries are added. The orange center in (a) represents the histogram for a new query that will not be added to the batch since its neighboring histograms overlap with already selected histograms. On the other hand, the green center in (b) will be added to the batch as its neighboring histograms, which will be selected, do not overlap with the already selected histograms.
III-C ClaPIM: Putting it Altogether
Figs. 12 and 13 present an overview of the ClaPIM filtering and searching stages, respectively. A memristive chip is assumed to be 8 GB in size (as suggested in [23]), containing 1M crossbars. Therefore, it can support a database of up to 128M 64-mers. For larger databases, several chips are used. Intel Optane, for example, uses DIMMs that embed up to 512GB [24], thus enabling an 8G 64-mer database per DIMM.
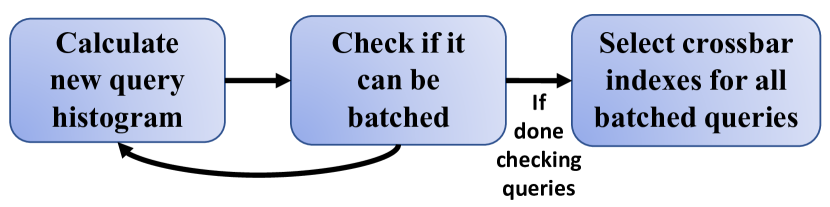
The process starts with the batching step as it simultaneously fills a list with different queries to be looked up in the chips. Then, for each query in the list, the range of crossbars to be compared against is extracted from the tracing table, as explained in Section III-B. These steps are performed in the CPU. The batching and tracing steps are combined in the filtering stage and pipelined with the PIM search stage. To ensure that the search operations completely mask the filtering time, we limit the number of queries that the batching step examines such that the run time should not exceed the run time of the searching stage.
The filtering time is independent of the number of chips used and will not change. Furthermore, the searching time will not change if more chips are used since the searching is done simultaneously in all chips. Thus, the limit for the number of queries checked in the batching size is independent of the number of chips used.
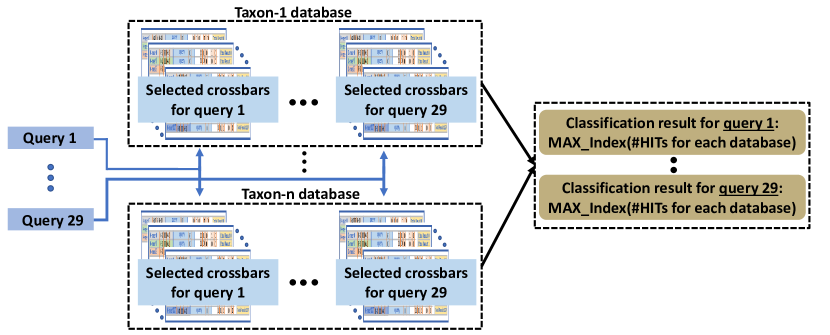
Finally, the memristive chips receive queries with different crossbar indices. The queries are serially written to their correlated crossbars, and only then the searching stage described in Section III-A starts in all crossbars for different queries simultaneously. For each query, the controller of the chip receives the number of hits against each reference organism (the sum of the number of hits received from all crossbars belonging to such an organism) and will classify the queries accordingly.
IV Evaluation
| Attribute | Source | |
|---|---|---|
| Cell Area | [23] | |
| MAGIC Cycle | [23] | |
| Switching Energy | [23] | |
| SA Latency | This work | |
| SA Energy | This work |
We now present the evaluation of ClaPIM. We begin with circuit evaluation to determine the latency and accuracy of the near-crossbar computing via the sense amplifiers (SAs). Then, the latency of the searching stage is determined to evaluate the maximally allowed latency for the filtering stage. The determination process is explained in the performance evaluation of the filtering stage. After that, the energy and lifetime improvements provided by the filtering stage are evaluated. Finally, the classification quality, throughput, and energy of ClaPIM are evaluated and presented.
IV-A Circuit Evaluation
Table I lists the area, switching latency, and energy for the SA and the ReRAM memristive devices used in the design. The peripheral circuits were designed and evaluated with Cadence Virtuoso using the iHP SG13S process with MEMRES PDK, a fabrication-ready CMOS-ReRAM integrated process [25]. To evaluate the correctness of the near-crossbar count and compare (performed using the SA), extensive Monte Carlo simulations, 1000 iterations, were employed. The evaluation considered the presence of device mismatches and process variation for both the memristors and transistors. Fig. 14 shows the hit confidence of the SA. For example, if the edit distance threshold (thr) is four, then all rows containing up to four logical ‘’s should be considered a hit. The graph shows that if the row contains three (five) logical ‘’s, then there is a () chance of considering the row as a hit. Nevertheless, for a row containing exactly four logical ‘’s, the SA will consider it a hit of the times. As an ideal SA would have provided a step function for each thr, we conclude that our SA performs adequately.
High Error Rate Reads
Low Error Rate Reads
IV-B Search Stage Latency
To assess the searching latency of ClaPIM, we counted and determined the number of cycles needed to perform the classification algorithm described in Section III-A. As parallel in-crossbar and near-crossbar operations are used, the examination of a query can be performed in approximately (2167 MAGIC clock cycles including initialization cycles, in addition to four SA cycles).
The search stage latency is affected by the number of SA attached to each crossbar. Adding more SAs adds more area overhead to the crossbar and achieves better search latency since more sensing is done in parallel (less iterations for step 5). Table II presents the trade-off exciting between area overhead and latency for a different number of SAs.
IV-C Filtering Stage Performance
To evaluate the filter’s run time, we developed an optimized implementation for batching the non-overlapping queries and extracting their lists of crossbars from the tracing table. As mentioned in Section III-C, to ensure the filtering and searching stages are well-balanced, we need to limit the filtering’s run time to as well. The filtering was executed on an Intel(R) Xeon(R) CPU E5-2683 v4 containing 32 cores, at 2.1 GHz, with 256GB of DRAM, 2400MHz DDR4, 2x 1TB HD, and 480GB SSD, using eight threads. The filter was limited to examining 350 random queries at a time. This limitation resulted in a filtering run time of , allowing an average of 29 queries to be performed in parallel. Adding the filtering stage to ClaPIM increases its throughput by .
| #SA | Area overhead | step 5 latency [] | Total search |
| stage latency [] | |||
| 1 | 4608 | 11.109 | |
| 2 | 2304 | 8.805 | |
| 4 | 1152 | 7.653 | |
| 8 | 576 | 7.077 | |
| 16 | 288 | 6.789 | |
| 32 | 144 | 6.645 | |
| 64 | 72 | 6.573 | |
| 128 | 36 | 6.537 |
IV-D The Filter Effect on Energy and Lifetime of the Design
An in-house simulator222 https://github.com/marcelkh13/ClaPIM.git was developed to evaluate the improvement enabled by the filter in energy consumption and the lifetime of the design. The filter was assessed using the following reference DNA: human chromosomes 1, 20, 21, and SARS-CoV-2, downloaded from the National Center for Biotechnology Information (NCBI) online data sets [26]. On average, less than of k-mers had a potential hit (, , and for the human chromosomes 1, 20, 21, and SARS-CoV-2, respectively). This leads to at least a reduction in energy consumption compared to the same system without a filtering stage. Nevertheless, querying in a crossbar involves switching memristor devices, therefore affecting the memory lifetime, given the limited endurance of ReRAM devices [27]. As the filtering drastically reduces the number of crossbars each query should be compared against. Assuming a uniform distribution over the accessed crossbars, a increase in the lifetime of the design is also achieved. Thus, for a memory lifetime of () writes, limited by the endurance of the most frequently accessed cells while assuming wear leveling [28] (a technique applied to achieve a uniform distribution of writes in a row). When activating an array to perform a searching task, 7 writes per cell are required. Thus, for the lifetime of the arrays, ClaPIM can perform up to () searching tasks.
IV-E Classification Quality
ClaPIM classification quality is compared to (1) EDAM [12], an approximates string matching SRAM-based PIM architecture, (2) Kraken2 [8], a state-of-the-art software classifier, and (3) HD-CAM [11], a Hamming distance tolerant content-addressable memory. The hit confidence numbers from section IV-A were integrated with ClaPIM’s classification algorithm.
Similar to EDAM and HD-CAM, we evaluated the detection of single species rather than full classification mode. A database containing SARS-CoV-2 (and its variants alpha – B.1.1.7, beta – B.1.351, and gamma – P.1) was used. A synthetic metagenomic sample was created, containing DNA reads of SARS-CoV-2 and its variants and the DNA of several other organisms: SARS-CoV-1, MERSCoV, Coronavirus HKU1 and Human Papillomavirus (HPV) 14. All the above DNA sequences were downloaded from the NCBI online data sets [26]. The 64-base-long DNA reads in the sample were extracted from random positions in the DNA sequences of each of these organisms. Consecutively, sequencing errors (insertions, deletions, and substitutions) were randomly injected, according to two error-rate profiles [29]: (1) Low error reads of the second generations DNA sequencers (replacement = , insertion = , deletion = ) and (2) high error reads of the third generation DNA sequencers (replacement = , insertion = , deletion = ). Fig. 15 shows the precision, sensitivity, and F1 of ClaPIM (with the filter) against EDAM, HD-CAM and Kraken2, as a function of the user-defined edit distance threshold. This value is used in EDAM’s, HD-CAM’s, and ClaPIM’s classification algorithms, while Kraken2 is unaffected, and thus has a constant value. The value the user chooses for the edit distance threshold is the one that provides the best classification quality for the algorithm (highest F1 score). The dotted black lines in the graph show the working point of the algorithm (the chosen threshold). The upper four graphs show that adding the filter improved the precision of the basic algorithm without hurting its sensitivity. The precision of the classification increased by up to () compared to EDAM for high (low) error rate reads. Furthermore, compared to Kraken2, as ClaPIM performs approximate -mer matching rather than exact -mer matching, ClaPIM improved the F1 score up to () over Kraken2 for the high (low) error profile synthetic reads, as can be seen in the lower two graphs. Compared to HD-CAM, ClaPIM improves the F1 score by () for the high (low) error profile reads. Using the Hamming distance tolerance to perform -mer approximate matching yields good results for low error reads. However, the classification efficiency drops significantly when HD-CAM is applied to high error reads.
IV-F ClaPIM Throughput and Energy
Table III summarizes the results for ClaPIM (with and without the filter) and compares them to EDAM and Kraken2. The results emphasize our design’s scalability over EDAM, as we improve the density by . As noted earlier, EDAM does not scale for large databases. Thus, even though it provides impressive results for small databases, it cannot scale to larger, more practical databases. Furthermore, since the periphery used in both ClaPIM and EDAM designs has almost the exact area cost, we infer that under the same area constraints, ClaPIM outperforms EDAM by , in terms of throughput. Compared to Kraken2, ClaPIM improves the throughput by , while, as mentioned before, providing much higher classification quality. Moreover, as EDAM uses SRAM, additional leakage power is consumed even when searching is not performed, while ClaPIM utilizes nonvolatile devices with approximately zero leakage power.
V Supporting Other PIM Technologies
The design principles presented in this paper can also be applied to additional PIM technologies beyond memristive PIM. This arises from the fact that ClaPIM is essentially built upon bulk bit-wise logic operations (as described in the searching stage of ClaPIM in Section III-A) that are also enabled by other memory technologies.
For example, ClaPIM may also be implemented using DRAM-based PIM such as Ambit [30]. Ambit exploits the analog properties of DRAM technology to perform bit-wise operations (AND, OR, and NOT) completely inside DRAM banks. As these gates constitute a functionally-complete set, in-DRAM computation can generalize to any logic function. Therefore, the intra-crossbar searching stage in ClaPIM, which utilizes bulk bit-wise XOR and NOR, may be performed through a sequence of in-DRAM logic operations. For the near-crossbar operations of (1) counting and (2) comparison in ClaPIM, an in-DRAM implementation may perform (1) counting via a sequence of full adders and then (2) comparison by subtracting the count result from the pre-defined threshold. The most significant bit of the subtraction result will determine whether the search is a match (as it represents the sign of the difference). While an in-DRAM mapping may result in lower throughput as the counting and comparison stages are performed digitally and not through an efficient analog comparator, it will simultaneously eliminate concerns with memristive PIM, such as endurance.
VI Conclusion
As sequenced DNA is prone to sequencing errors, performing classification using approximate matching, rather than exact matching, provides significantly higher classification quality. ClaPIM implements a two-stage algorithm – filtering and searching – to perform efficient classification based on approximate matching. The filtering stage improves the energy efficiency and the system’s lifetime and provides higher classification precision. Additionally, the filtering stage supports a parallel query allocation that increases the overall throughput. In the searching stage, as dense memristive crossbars are used, ClaPIM offers high scalability to support large databases for classification.
Compared with Kraken2, a state-of-the-art CPU baseline classifier, ClaPIM provides significantly higher classification quality and demonstrates a improvement in throughput. Compared with HD-CAM, a Hamming distance tolerant content addressable memory, ClaPIM achieves higher classification sensitivity and precision with up to higher F1 score. Compared with a recent SRAM-based PIM architecture, EDAM, which is limited to small datasets, ClaPIM provides a improvement in area efficiency and provides higher classification precision.
Furthermore, ClaPIM principles and ideas presented in this paper can be easily modified to be implemented using other PIM technologies, such as DRAM-based PIM [30]. Designs using other PIM technologies should be studied in the future and compared to determine the best platform.
References
- [1] M. Alser et al., “Accelerating Genome Analysis: A Primer on an Ongoing Journey,” IEEE Micro, vol. 40, 2020.
- [2] F. Breitinger et al., “Approximate Matching: Definition and Terminology,” NIST Special Publication, vol. 800, 2014.
- [3] B. Dorohonceanu and C. G. Nevill-Manning, “Accelerating protein classification using suffix trees.” in ISMB, 2000, pp. 128–133. [Online]. Available: http://europepmc.org/abstract/MED/10977073
- [4] B. Liu, T. Gibbons, M. Ghodsi, and M. Pop, “MetaPhyler: Taxonomic Profiling for Metagenomic Sequences,” in 2010 IEEE International Conference on Bioinformatics and Biomedicine (BIBM), 2010, pp. 95–100.
- [5] S. F. Altschul et al., “Basic Local Alignment Search Tool,” Journal of Molecular Biology, vol. 215, 1990.
- [6] R. Ounit, S. Wanamaker, T. J. Close, and S. Lonardi, “Clark: Fast and Accurate Classification of Metagenomic and Genomic Sequences Using Discriminative k-mers,” BMC Genomics, vol. 16, 2015.
- [7] S. K. Ames et al., “Scalable Metagenomic Taxonomy Classification Using a Reference Genome Database,” Bioinformatics, vol. 29, 2013.
- [8] D. E. Wood, J. Lu, and B. Langmead, “Improved Metagenomic Analysis with Kraken 2,” Genome biology, vol. 20, 2019.
- [9] T. Shahroodi et al., “KrakenOnMem: A Memristor-Augmented HW/SW Framework for Taxonomic Profiling,” in Proceedings of the 36th ACM International Conference on Supercomputing, 2022, pp. 1–14.
- [10] L. Wu et al., “Sieve: Scalable In-situ DRAM-based Accelerator Designs for Massively Parallel k-mer Matching,” in 2021 ACM/IEEE 48th Annual International Symposium on Computer Architecture (ISCA), 2021, pp. 251–264.
- [11] E. Garzón et al., “Hamming distance tolerant content-addressable memory (hd-cam) for dna classification,” IEEE Access, vol. 10, pp. 28 080–28 093, 2022.
- [12] R. Hanhan et al., “EDAM: Edit Distance Tolerant Approximate Matching Content Addressable Memory,” in Proceedings of the 49th Annual International Symposium on Computer Architecture, 2022, p. 495–507.
- [13] D. E. Wood, S. L. Salzberg, “Kraken: Ultrafast Metagenomic Sequence Classification Using Exact Alignments,” Genome biology, vol. 15, 2014.
- [14] S. Kvatinsky, “Real Processing-in-Memory with Memristive Memory Processing Unit (mMPU),” in ASAP, 2019, pp. 142–148.
- [15] M. Dumont, C. Lüke, Y. Deng, and P. Frenzel, “Classification of pmoA Amplicon Pyrosequences using BLAST and The Lowest Common Ancestor Method in MEGAN,” Frontiers in Microbiology, vol. 5, 2014.
- [16] W. Wang, P. Zhang, and X. Liu, “Short Read DNA Fragment Anchoring Algorithm,” BMC bioinformatics, vol. 10, 2009.
- [17] M. Khalifa et al., “FiltPIM: In-Memory Filter for DNA Sequencing,” in 2021 28th IEEE International Conference on Electronics, Circuits, and Systems (ICECS), 2021, pp. 1–4.
- [18] M. Horowitz, “1.1 computing’s energy problem (and what we can do about it),” in 2014 IEEE International Solid-State Circuits Conference Digest of Technical Papers (ISSCC), 2014, pp. 10–14.
- [19] S. Kvatinsky et al., “MAGIC—Memristor-Aided Logic,” IEEE Transactions on Circuits and Systems II: Express Briefs, vol. 61, 2014.
- [20] J. Reuben et al., “Memristive logic: A framework for evaluation and comparison,” in 2017 27th International Symposium on Power and Timing Modeling, Optimization and Simulation (PATMOS), 2017, pp. 1–8.
- [21] S. Angizi, J. Sun, W. Zhang, and D. Fan, “Aligns: A processing-in-memory accelerator for dna short read alignment leveraging sot-mram,” in 2019 56th ACM/IEEE Design Automation Conference (DAC), 2019, pp. 1–6.
- [22] C.-P. Lo et al., “Embedded 2Mb ReRAM macro with 2.6ns read access time using dynamic-trip-point-mismatch sampling current-mode sense amplifier for IoE applications,” in 2017 Symposium on VLSI Circuits, 2017, pp. C164–C165.
- [23] M. S. Q. Truong et al., “RACER: Bit-Pipelined Processing Using Resistive Memory,” in MICRO-54: 54th Annual IEEE/ACM International Symposium on Microarchitecture, 2021, p. 100–116.
- [24] A. Shanbhag, N. Tatbul, D. Cohen, and S. Madden, “Large-scale in-Memory Analytics on Intel® Optane™ DC Persistent Memory,” in Proceedings of the 16th International Workshop on Data Management on New Hardware, 2020, pp. 1–8.
- [25] “EUROPRACTICE — IHP asics.” [Online]. Available: https://europractice-ic.com/technologies/asics/ihp/
- [26] D. L. Wheeler et al., “Database resources of the National Center for Biotechnology Information,” Nucleic Acids Research, vol. 36, 2007.
- [27] Q. Luo et al., “Nb1-xo2 based universal selector with ultra-high endurance (), high speed (10ns) and excellent vth stability,” in 2019 Symposium on VLSI Technology, 2019, pp. T236–T237.
- [28] M. M. Sabry Aly et al., “The n3xt approach to energy-efficient abundant-data computing,” Proceedings of the IEEE, pp. 19–48, 2019.
- [29] S. Goodwin, J. D. McPherson, and W. R. McCombie, “Coming of Age: Ten Years of Next-Generation Sequencing Technologies,” Nature Reviews Genetics, vol. 17, 2016.
- [30] V. Seshadri et al., “Ambit: In-Memory Accelerator for Bulk Bitwise Operations Using Commodity DRAM Technology,” in 2017 50th Annual IEEE/ACM International Symposium on Microarchitecture (MICRO), 2017, pp. 273–287.
![[Uncaptioned image]](/html/2302.08284/assets/pics/marcel.png) |
Marcel Khalifa is a graduate student at the Andrew and Erna Viterbi Faculty of Electrical and Computer Engineering at the Technion - Israel Institute of Technology. She received the B.Sc. degree in computer engineering, cum laude, in 2020 from the Technion - Israel Institute of Technology. From 2018 to 2020 she was with Intel as a chip designer. Her current research is focused on accelerating bioinformatics algorithms using processing–in–memory computer architectures with the emerging memory technologies, memristors. |
![[Uncaptioned image]](/html/2302.08284/assets/pics/barak.png) |
Barak Hoffer is a Ph.D. candidate at the Andrew and Erna Viterbi Faculty of Electrical and Computer Engineering, Technion – Israel Institute of Technology. Barak received the B.Sc. degree in Electrical Engineering in 2018 from the Technion – Israel Institute of Technology. His main research interests are design and experimental demonstration of processing-in-memory circuits using emerging memory technologies. |
![[Uncaptioned image]](/html/2302.08284/assets/pics/orian.png) |
Orian Leitersdorf is currently studying towards the B.Sc, M.Sc., and Ph.D. degrees at the Technion – Israel Institute of Technology. He is a scholar at both the Technion Excellence Program and the Technion Lapidim CS Excellence Program, and is also a recipient of the Gutwirth Excellence Scholarship. His current research aims to advance digital processing-in-memory (PIM) towards fundamental applications (e.g., matrix operations, graph algorithms, cryptography) while also addressing challenges such as reliability. Further, his research interests also include several topics in theoretical computer science, such as distributed algorithms and information theory. |
![[Uncaptioned image]](/html/2302.08284/assets/pics/robert.png) |
Robert Hanhan received the B.Sc. degree in computer engineering from the Technion-Israel Institute of Technology, Haifa, in 2021, where he is currently pursuing the M.Sc. degree in computer engineering. His research interest includes hardware acceleration for genome analysis. |
![[Uncaptioned image]](/html/2302.08284/assets/pics/ben.png) |
Ben Perach (Student Member, IEEE) is a Ph.D. candidate at the Andrew and Erna Viterbi Faculty of Electrical and Computer Engineering, Technion – Israel Institute of Technology. Ben received his B.Sc. degree in mathematics from The Hebrew University of Jerusalem in 2010 and his M.Sc. degree in electrical engineering from Tel Aviv University in 2017. Ben’s current research interests include computer architecture with a focus on processor design, and also field-programmable gate arrays, security, and data networks. |
![[Uncaptioned image]](/html/2302.08284/assets/pics/leonid.png) |
Leonid Yavits is with the Faculty of Engineering, Bar-Ilan University, Israel. He received his MSc and PhD degrees in electrical engineering from Technion, Israel. Leonid is also a hightech entrepreneur. He co-founded VisionTech, where he co-designed a variety of video compression ICs. VisionTech was acquired by Broadcom in 2001. Leonid’s research interests include processing in memory, domain specific accelerators, emerging memories, machine learning and bioinformatics. |
![[Uncaptioned image]](/html/2302.08284/assets/pics/shahar.png) |
Shahar Kvatinsky is an Associate Professor at the Andrew and Erna Viterbi Faculty of Electrical and Computer Engineering, Technion – Israel Institute of Technology. Shahar received the B.Sc. degree in Computer Engineering and Applied Physics and an MBA degree in 2009 and 2010, respectively, both from the Hebrew University of Jerusalem, and the Ph.D. degree in Electrical Engineering from the Technion – Israel Institute of Technology in 2014. From 2006 to 2009, he worked as a circuit designer at Intel. From 2014 to 2015, he was a post-doctoral research fellow at Stanford University. Kvatinsky is a member of the Israel Young Academy. He is the head of the Architecture and Circuits Research Center at the Technion, chair of the IEEE Circuits and Systems in Israel, and an editor of Microelectronics Journal and Array. Kvatinsky has been the recipient of numerous awards: the 2021 Norman Seiden Prize for Academic Excellence, the 2020 MDPI Electronics Young Investigator Award, the 2019 Wolf Foundation’s Krill Prize for Excellence in Scientific Research, the 2015 IEEE Guillemin-Cauer Best Paper Award, the 2015 Best Paper of Computer Architecture Letters, Viterbi Fellowship, Jacobs Fellowship, an ERC starting grant, the 2017 Pazy Memorial Award, 2014, 2017 and 2021 Hershel Rich Technion Innovation Awards, the 2013 Sanford Kaplan Prize for Creative Management in High Tech, 2010 Benin prize, and seven Technion excellence teaching awards. His current research is focused on circuits and architectures with emerging memory technologies and the design of energy-efficient architectures. |