11email: d.malesani@astro.ru.nl 22institutetext: Cosmic Dawn Center (DAWN), Denmark. 33institutetext: Niels Bohr Institute, University of Copenhagen, Jagtvej 128, 2200 Copenhagen N, Denmark. 44institutetext: Department of Physics, University of Warwick, CV4 7AL Coventry, United Kingdom 55institutetext: DARK, Niels Bohr Institute, University of Copenhagen Jagtvej 128, 2200 Copenhagen N, Denmark. 66institutetext: Artemis, Université Côte d’Azur, Observatoire de la Côte d’Azur, CNRS, F-06304 Nice, France. 77institutetext: INAF, Osservatorio Astronomico di Brera, via E. Bianchi 46, I-23807 Merate (LC), Italy. 88institutetext: INFN - Sezione di Milano-Bicocca, piazza della Scienza 3, I-20146 Milano (MI), Italy 99institutetext: Hessian Research Cluster ELEMENTS, Giersch Science Center, Max-von-Laue-Strasse 12, Goethe University Frankfurt, Campus Riedberg, 60438 Frankfurt am Main, Germany. 1010institutetext: Astrophysics Research Institute, Liverpool John Moores University, 146 Brownlow Hill, Liverpool L3 5RF, UK. 1111institutetext: GEPI, Observatoire de Paris, Université PSL, CNRS, 5 Place Jules Janssen, 92190 Meudon, France. 1212institutetext: INAF, Istituto di Astrofisica Spaziale e Fisica cosmica, Via Alfonso Corti 12, I-20133 Milano (MI), Italy. 1313institutetext: School of Physics and Astronomy, University of Leicester, University Road, LE1 7RH Leicester, United Kingdom. 1414institutetext: Instituto de Astrofísica de Andalucía - CSIC, Glorieta de la Astronomía s/n, 18008 Granada, Spain. 1515institutetext: ASI - Italian Space Agency, Space Science Data Centre, Via del Politecnico snc, 00133 Rome, Italy. 1616institutetext: INAF, Osservatorio Astronomico di Capodimonte, Salita Moiariello 16, 80131, Napoli, Italy. 1717institutetext: Department of Mathematics, Informatics, Physics and Earth Sciences, University of Messina, via F.D. D’Alcontres 31, Papardo, Messina, 98166 Italy. 1818institutetext: School of Physics and Astronomy & Institute for Gravitational Wave Astronomy, University of Birmingham, Birmingham B15 2TT, United Kingdom. 1919institutetext: Department of Physics and Astronomy, Kinard Lab of Physics, Clemson University, Clemson, SC 29634, USA. 2020institutetext: Centre for Astrophysics and Cosmology, Science Institute, University of Iceland, Dunhagi 5, 107 Reykjavík, Iceland. 2121institutetext: INAF–Osservatorio di Astrofisica e Scienza dello Spazio, via Piero Gobetti 93/3, 40024, Bologna, Italy. 2222institutetext: Astronomical Institute Anton Pannekoek, University of Amsterdam, 1090 GE Amsterdam, The Netherlands. 2323institutetext: Department of Physics, University of Bath, Bath BA2 7AY, United Kingdom. 2424institutetext: Kavli Institute for Astrophysics and Space Research, Massachusetts Institute of Technology, 77 Massachusetts Ave, Cambridge, MA 02139, USA. 2525institutetext: The Oskar Klein Centre, Department of Astronomy, Stockholm University, AlbaNova, SE-106 91 Stockholm, Sweden. 2626institutetext: Astronomical Institute of the Czech Academy of Sciences, Fričova 298, 251 65 Ondřejov, Czech Republic. 2727institutetext: Department of Physics, George Washington University, 725 21st St NW, Washington, DC, 20052, USA. 2828institutetext: Physics Department, Lancaster University, Lancaster, LA1 4YB, United Kingdom. 2929institutetext: Key Laboratory of Space Astronomy, National Astronomical Observatories, Chinese Academy of Sciences, Beijing, 100101, China. 3030institutetext: Australian Astronomical Optics, Macquarie University, 105 Delhi Road, North Ryde, NSW 2113, Australia.
The brightest GRB ever detected: GRB 221009A as a highly luminous event at
Abstract
Context. The extreme luminosity of gamma-ray bursts (GRBs) makes them powerful beacons for studies of the distant Universe. The most luminous bursts are typically detected at moderate/high redshift, where the volume for seeing such rare events is maximized and the star-formation activity is greater than at . For distant events, not all observations are feasible, such as at TeV energies.
Aims. Here we present a spectroscopic redshift measurement for the exceptional GRB 221009A, the brightest GRB observed to date with emission extending well into the TeV regime.
Methods. We used the X-shooter spectrograph at the ESO Very Large Telescope (VLT) to obtain simultaneous optical to near-IR spectroscopy of the burst afterglow 0.5 days after the explosion.
Results. The spectra exhibit both absorption and emission lines from material in a host galaxy at . Thus GRB 221009A was a relatively nearby burst with a luminosity distance of Mpc. Its host galaxy properties (star-formation rate and metallicity) are consistent with those of LGRB hosts at low redshift. This redshift measurement yields information on the energy of the burst. The inferred isotropic energy release, erg, lies at the high end of the distribution, making GRB 221009A one of the nearest and also most energetic GRBs observed to date. We estimate that such a combination (nearby as well as intrinsically bright) occurs between once every few decades to once per millennium.
Key Words.:
gamma-ray burst: individual: GRB 221009A1 Introduction
The population of so-called “long-duration” gamma-ray bursts (GRBs) formed via the collapse of massive stars, typically having prompt phase durations in the range to s, constitute the most luminous events in the known Universe (e.g. Kann et al., 2007; Racusin et al., 2008; Bloom et al., 2009; Frederiks et al., 2013). They have been detected from a redshift as small as (Galama et al., 1998) to (Tanvir et al., 2009; Salvaterra et al., 2009; Tanvir et al., 2018) and possibly beyond (Cucchiara et al., 2011). Their apparent isotropic-equivalent energies also span a large range. The observed local () burst population is typically of low-luminosity, with energies (assuming isotropic emission) of – erg (e.g. Soderberg et al., 2004). This reflects the fact that the space density of low-luminosity events is much higher than that of energetic ones. In contrast, the more distant events span a wider range in isotropic energy release, up to six orders of magnitude higher, erg (e.g. Cenko et al., 2011), due to the larger sampled volume and the higher star formation activity compared to the Local Universe. The range of GRB luminosities reflects some observational effects, such as the angle between our line-of-sight and the axis of the geometrically beamed relativistic jet, but it is also likely that the conditions of the progenitor star at the point of core collapse impact the properties of the subsequent GRB.
Studies of GRBs in the relatively local universe are of particular value, because their proximity offers diagnostics that are typically not available for the more distant events. For example, since the supernovae (SNe) associated with GRBs peak at much fainter magnitudes than the GRB afterglows themselves (especially in the UV) we can study the associated SNe in detail only at (Hjorth & Bloom, 2012; Cano et al., 2017; Schulze et al., 2014; D’Elia et al., 2015). Similarly, the lower luminosity distances and better spatial resolution enable studies of their host galaxies and underlying stellar populations in considerably greater detail (e.g. Izzo et al., 2017; Krühler et al., 2017; Tanga et al., 2018; de Ugarte Postigo et al., 2020).
Here we consider the case of GRB 221009A, the brightest GRB observed in over five decades of wide field of view gamma-ray sky monitoring. The detection of TeV photons from this GRB (Huang et al., 2022; Dzhappuev et al., 2022) are also unprecedented, both in terms of their energy and flux, making the distance to this event of particular significance, because the mean free path of such photons is limited by their interactions with background light photons (Gilmore et al., 2012; Franceschini & Rodighiero, 2017). Our X-shooter spectroscopy of the burst provides a robust redshift measurement of , consistent with being a cosmological GRB and not a transient originating in the Milky Way (MW) as its location on the sky may suggest. The implied luminosity distance111Assuming a flat CDM cosmology with km s-1 Mpc-1 and (Planck Collaboration et al., 2020). of Mpc places it amongst the most energetic GRBs ever observed, and makes it by far the closest GRB with erg.
2 Observations
2.1 High energy discovery
GRB 221009A was detected at 2022 October 9 at 13:16:59 UT by a raft of high-energy missions including Fermi-GBM (Veres et al., 2022), Fermi-LAT (Bissaldi et al., 2022), AGILE/MCAL (Ursi et al., 2022), AGILE/GRID (Piano et al., 2022), INTEGRAL (Gotz et al., 2022), Konus-Wind (Frederiks et al., 2022) Insight-HMXT (Tan et al., 2022), STPSat-6/SIRI-2 (Mitchell et al., 2022), SATech-01/GECAM-C HEBS (Liu et al., 2022), SRG/ART-XC (Lapshov et al., 2022), Solar Orbiter/STIX (Xiao et al., 2022), and GRBalpha (Ripa et al., 2022). However, the event was first reported by a Swift detection of the afterglow over 50 minutes later (Dichiara et al., 2022b). The location of the burst within the Galactic plane (, ), combined with its brightness, led to confusion over the nature of the outburst: initially it was suspected to be due to a new Galactic X-ray transient (Dichiara et al., 2022b, a), but its subsequent behaviour appeared more like that of an extragalactic GRB (Kennea et al., 2022).
Despite high foreground extinction (Section 3.2), an optical afterglow was seen by various telescopes (e.g. Dichiara et al. 2022b; Lipunov et al. 2022; Fulton et al. 2023 and many more). The counterpart was localised at coordinates (J2000): (2), (7) by the VLBA at 15.2 GHz (Atri et al., 2022).
Detection with several high energy instruments have also been reported, including GeV emission with Fermi-LAT (potentially up to 400 GeV; Xia et al. 2022), TeV emission extending to 18 TeV from LHAASO (Huang et al., 2022), and even a suggestion of a possible association with a 250 TeV photon (Dzhappuev et al., 2022).
2.2 X-shooter spectroscopy
Following the detection of GRB 221009A, and motivated by the significant ambiguity in its distance (Galactic versus extragalactic) we initiated observations with the European Southern Observatory Very Large Telescope (ESO VLT Unit 3, Melipal) located on Cerro Paranal (Chile) and the X-shooter spectrograph (Vernet et al., 2011). These observations began on 2022 October 10 at 00:49:26 UT (11.54 hr after the Fermi trigger), with a total exposure time of 2400 s ( s). The source brightness at this time, as measured in our acquisition image, was mag (AB, calibrated against nearby stars from the Pan-STARRS catalog).
Observations were executed using the ABBA nod-on-slit mode, with a nod throw of about along the slit. Each single arm spectrum has been reduced using the “stare” mode reduction, using the standard X-shooter pipeline (Goldoni et al., 2006; Modigliani et al., 2010), with the extraction window at the position of the GRB afterglow trace, and background windows at both sides of the spectral trace. Then, for each exposure, residual sky features have been interpolated using the background as reference (Selsing et al., 2019). The flux-calibrated spectra were renormalized to the available photometry, using the , and bands for the UVB, VIS, and NIR arms, respectively, interpolated at the mean time of the spectrum. Magnitudes were computed from the acquisition camera or from a broader photometric set (de Ugarte Postigo et al. 2023, in preparation). Finally, we have applied a telluric correction using models estimated using the line-by-line radiative transfer model (LBLRTM; Clough et al. 1992) and atmospheric properties, such as humidity, temperature, pressure and zenith angle, which are stored in the header of each exposure.
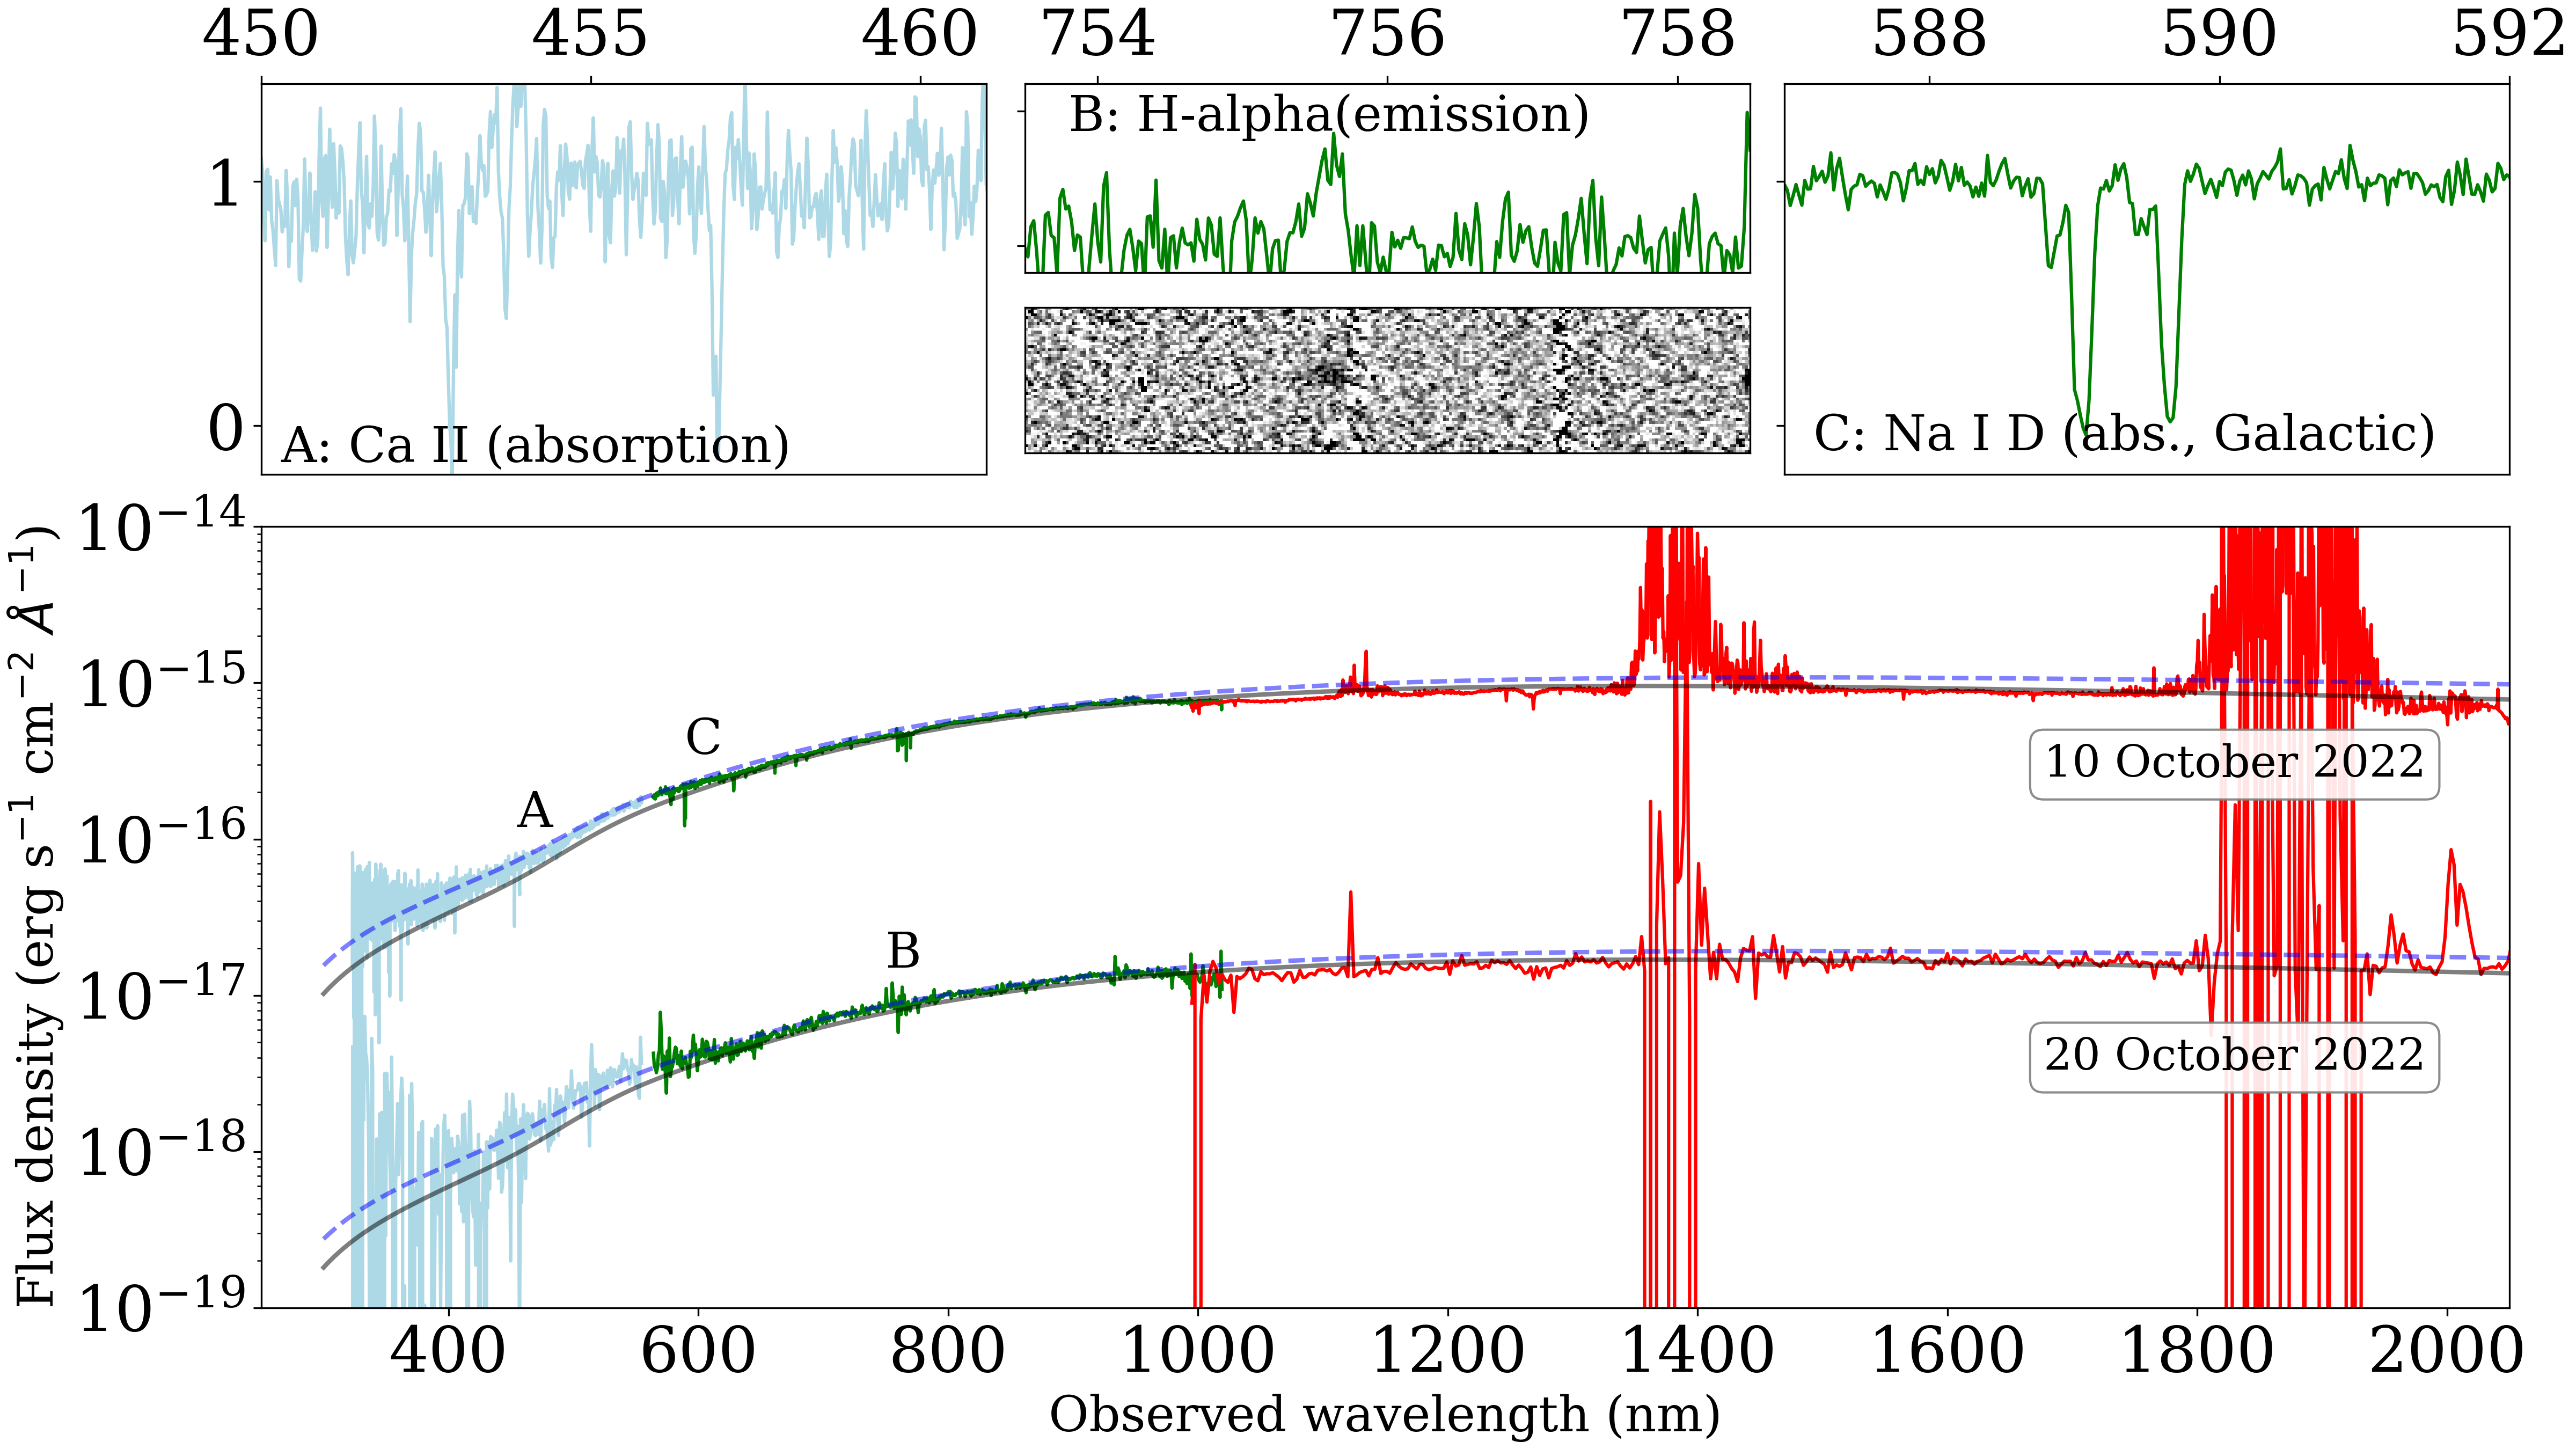
The observations revealed a very bright trace in the red and infrared, strongly attenuated towards the blue end by the high Galactic extinction. Figure 1 shows the overall shape of the spectrum and zoom-in panels highlighting specific features.
We subsequently obtained further X-shooter observations to follow the afterglow evolution. These are discussed in detail by de Ugarte Postigo et al. (2023, in preparation). Among the later spectra, here we only exploit the s spectrum taken with mid time 2022 Oct 20 00:19:38 UT, which provides the best detection of the emission features (Fig. 1 and Sec. 3.3).
The results reported in this paper supersede our preliminary analysis (de Ugarte Postigo et al., 2022; Izzo et al., 2022). Our spectroscopic measurement was subsequently confirmed by Castro-Tirado et al. (2022).
3 Results
3.1 Absorption line system and redshift
In addition to several Galactic absorption features at , we identify a series of absorption lines including Ca ii (4530, 4570 Å), Ca i (4867 Å) and Na i (6782, 6789 Å) at redshift . Unfortunately, at this low redshift most of the strong metal lines are too far in the UV to be detected from the ground, so we cannot carry out any in-depth analysis of the GRB host ISM.
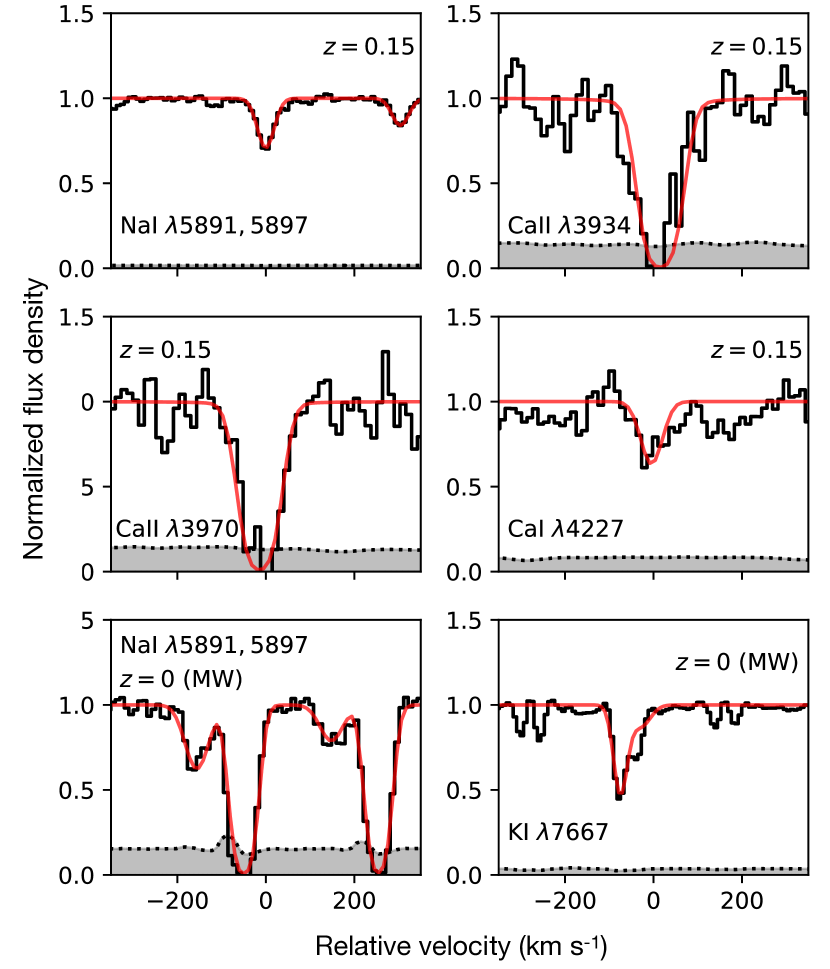
We first analyse the absorption features imprinted from the host-galaxy ISM on the afterglow spectrum. For the analysis, we use the Python package VoigtFit (Krogager, 2018). This code creates a convolved spectrum based on the observed spectral resolution of the X-shooter spectra and simultaneously fits for the redshift , broadening parameter , and column density of each line complex. We tie the redshift to be identical across the five detected transitions (see Table 1). We find best-fit parameters . We also find that a single broadening parameter km s-1 is able to reproduce the observed line profiles (see Fig. 2), with total column densities of , , and . We note that the Ca ii transitions are both saturated, so the inferred column densities are quoted as lower limits.
| Observed | Feature | EW | |
|---|---|---|---|
| (Å) | (Å) | () | |
| 4530.09 | Ca ii 3934.78 | 1.580.1 | |
| 4570.44 | Ca ii 3969.59 | 1.350.09 | |
| 4867.4 | Ca i 4227.92 | 0.360.06 | |
| 6782.87 | Na i 5891.58 | 0.290.01 | |
| 6789.71 | Na i 5897.56 | 0.150.01 |
3.2 Extinction
The line of sight to GRB 221009A goes through significant foreground extinction from dust in the MW, and potentially as well within the host galaxy. The large foreground extinction is highlighted by strong absorption features seen at , such as strongly saturated Na i D (Fig. 1). In Figure 1, we overplot the X-shooter spectra with a single power-law with index (the same as observed in the X-ray afterglow, e.g. Williams et al. 2023) with a foreground extinction of mag (Schlafly & Finkbeiner, 2011). This provides a reasonable description of the observations, but over-predicts the measured flux substantially in the blue, and slightly in the red. This suggests the presence of additional extinction, either in the MW (a small underestimate, particularly towards the plane of the MW, is not unlikely), or due to additional dust inside the host galaxy. Given the low redshift of the event and the diversity of the extinction laws (Pei, 1992), disentangling host from foreground extinction is non-trivial, but the overall results are not very sensitive to the dust location. A better match to the data can be obtained with a total mag. However, in this case the intrinsic spectral slope must be substantially bluer , matching the preferred results of Kann et al. (2023) well. This would be consistent with the presence of a cooling break lying somewhere between the X-ray and optical/IR band. We also note that there is a significant revision in the foreground extinction between the map of Schlegel et al. (1998) and the re-calibration of Schlafly & Finkbeiner (2011), which we have adopted, with the former value of mag overall consistent with our higher extinction scenario.
Further insight on the dust location can be provided by the detection of Na i D at , which is often considered a dust tracer. Following Poznanski et al. (2012) and using the EWs from Table 1, we derive mag, suggesting that indeed a (modest) amount of dust is present in GRB host galaxy along its line-of-sight, but that extra dust is also present in the MW, in excess of the Schlafly & Finkbeiner (2011) estimate.
3.3 Host galaxy
In addition to absorption lines, our X-shooter spectroscopy shows two emission lines from the underlying host galaxy. We detect H (in the visible) and Pa (in the NIR), while we cannot recover significantly the bluer [O iii], [O iii], H, or [O ii], presumably due to the higher foreground extinction. A small spatial offset is observed between the afterglow trace and the H emission line, consistent with the extension seen in Hubble Space Telescope imaging of the field (Levan et al. 2022; Levan et al. 2023, in preparation; Fulton et al. 2023; Shrestha et al. 2023). This also implies that the measured fluxes are lower limits, as there is likely emission from regions not covered by the instrument slit. The slit was 0.9″ (1.1″) wide in the optical (NIR), and was oriented along the N-S direction, covering only partially the extended host galaxy. Line flux ratios are however robust against slit losses. The flux of the detected lines was determined by fitting the continuum around each line and integrating the continuum-subtracted flux over the region of the line. We additionally fitted each detected line with a Gaussian profile, checking the consistency between the two values. The fits are shown in Fig. 3. We also computed an upper limit for [N ii] as the flux of a Gaussian line with the same velocity width as H and an amplitude equal to the noise estimated over the region where the line should lie.
The fluxes was then corrected for Galactic dust extinction using and the MW extinction curve of Pei (1992). We determined the host galaxy comparing the observed and theoretical ratio of the H and Pa lines () in the case B recombination scenario, with an electron temperature of 10000 K and density of cm-3 (Osterbrock & Ferland, 2006). This method yields where the uncertainties are computed with Monte Carlo error propagation. As with the afterglow SED, it is not possible to disentangle whether this extra extinction is due to dust in the MW or in the GRB host, but this has little effect on our estimate given the low redshift of the object. All the fluxes and their corrected values are shown in Tab. 2.
Using the dust-corrected H flux, we infer a star-formation rate (SFR) of , assuming a Chabrier (2003) initial mass function, setting and a standard Planck Collaboration et al. (2020) cosmology. Due to slit losses, this value should be considered as a lower limit. Using the upper limit on the [N ii] line, we can infer an upper limit on the metallicity of the host galaxy using the strong line calibrations of Maiolino et al. (2008), and taking (Asplund et al., 2009). We find which is sub-solar and comparable to the typical metallicities found using the same method in long GRB hosts (Krühler et al., 2015; Japelj et al., 2016; Palmerio et al., 2019).
| Line | Observed wavelength | Observed flux | Corrected flux (MW) | Corrected flux (MW + host) |
|---|---|---|---|---|
| (Å) | ( ) | ( ) | ( ) | |
| H | ||||
| Pa | ||||
| [N ii] | - |

4 Discussion
4.1 Robustness of redshift
Given the challenges of explaining VHE emission from , it is relevant to consider if there are other, lower redshift possibilities to explain the burst. The presence of narrow absorption lines implies the light from the GRB is passing through cool, low-velocity gas moving at a recessional velocity of km s-1. This is well beyond any plausible peculiar velocities for more local galaxies, or possible velocities of individual gas clouds within them. Although outflows (e.g. from supernovae) can achieve high velocities, most do not reach 45,000 km s-1, and in this case we would then expect to observe broad lines. Furthermore, the presence of narrow emission lines at demonstrates that a star-forming galaxy at this redshift underlies the GRB position.
Formally, we note that the detection of narrow lines at only places a limit on the burst redshift of . The redshift is such that we cannot detect individual variable fine-structure lines pumped by the UV emission from the GRB (e.g. Vreeswijk et al., 2004). It is plausible that the burst could be at even higher redshift. A higher redshift would ameliorate rate constraints, and could even be lensed by the system (although such a scenario is very unlikely). However, placing the burst at an even higher redshift would only make the challenges of VHE emission and extreme prompt isotropic energy release even more acute. The lack of any detected features at redshift higher than (including across wavelength ranges with high S/N) also argues against .
4.2 Energetics and implications
GRB 221009A is, by some margin, the brightest GRB ever observed (Burns et al. 2023, in preparation). Measurements of both the peak flux and fluence are underestimated because it was sufficiently bright to saturate many of the detectors, but, even allowing for this, GRB 221009A was a factor of 40 more fluent than the next-brightest well-studied burst, GRB 130427A (Maselli et al., 2014).
The precise isotropic energy release of GRB 221009A is non-trivial to estimate, due to the difficulty of correcting for saturation effects. However, estimates of the fluence lie in the range erg cm-2 (Gotz et al., 2022; Lesage et al., 2022; Frederiks et al., 2022; Kann & Agui Fernandez, 2022) and the burst isotropic energy release in the 0.1 keV–100 MeV “ultra-bolometric” band (Agüí Fernández et al., 2023) is at least erg (Kann & Agui Fernandez, 2022). This makes GRB 221009A one of the most intrinsically energetic GRBs ever observed, in addition to its relative proximity. If more detailed saturation correction analysis yields a true fluence erg cm-2, GRB 221009A could well be also the most energetic GRB ever observed, at least within the sample of GRBs with known redshift.
4.3 Rates
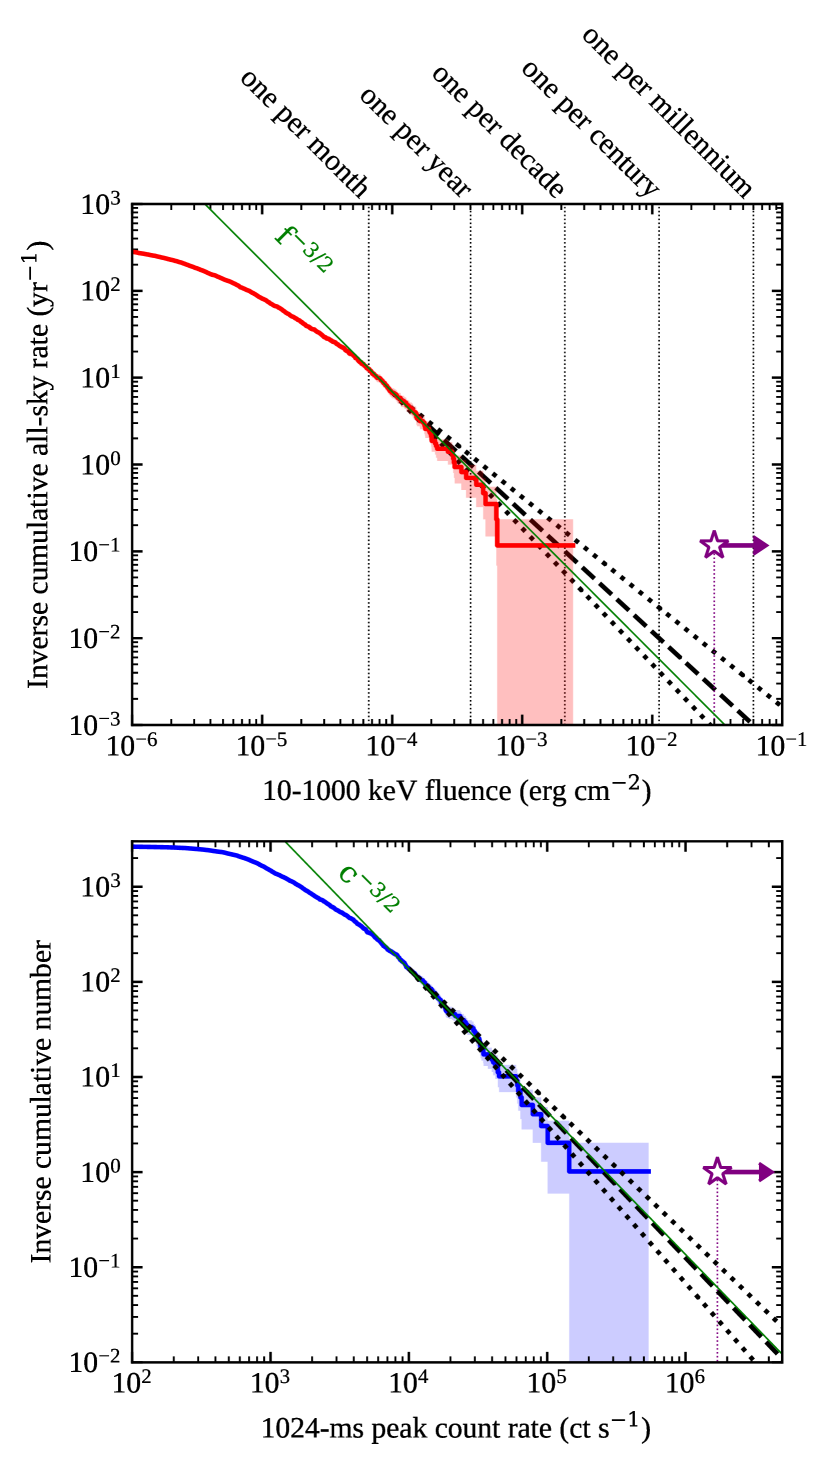
The combination of proximity and brightness/energy release raises the question of just how unusual GRB 221009A is. To place it in context, we compared it with long GRB events (i.e. those with ) previously observed by Fermi/GBM. It is relevant to consider both the peak flux and the fluence. While peak flux is often more relevant for triggering, in the case of GRB 221009A it is also likely to be more heavily impacted by saturation, compared to fluence, which is integrated over a longer time, when the flux is lower on average. We compared both the 10–1000 keV band fluence reported in the online GBM catalogue222The catalogue can be accessed online at https://heasarc.gsfc.nasa.gov/W3Browse/fermi/fermigbrst.html. We used the Flux_BATSE_1024 entry in the catalogue. and the peak count rates, calculated with 1024 ms binning, summed over all NaI detectors and all channels. To construct the latter, we downloaded all trigdata files related to long GRBs from the Fermi/GBM trigger catalogue333https://heasarc.gsfc.nasa.gov/W3Browse/fermi/fermigtrig.html and used the count-rate data therein. In 98% of cases, peak count rates were reported with a binning of 1024 ms or finer (in which case we downsampled to 1024 ms by summing neighboring bins near the peak). We assumed the remaining 2% of the events to be sampled from the same distribution. From these, we constructed the corresponding inverse cumulative distributions, which are shown in Fig. 4. In order to convert the number of observed events into an all-sky rate, we divided the number by the GBM mission duration to date () and by a factor that represents the effective duty cycle of GBM due to the combination of the limited field-of-view and the downtime due to the need to turn off the detectors during the transit through the South Atlantic Anomaly (Burns et al., 2016). In order to extrapolate the observed inverse cumulative distribution to the fluence (or count rate) of GRB 221009A, we identified a fluence (or count rate) above which the distribution resembles a single power-law and fitted to the data above that point a simple power-law model with index . The fit is performed in a Bayesian fashion, as follows. The assumed probability of observing a given fluence is , hence the posterior probability on given the observed fluences is
| (1) |
where is our data and is the prior on , which we take as uniform, . We set for fluences and for count rates. The posterior probability distributions on are nearly Gaussian for both the fluence and count rate cases, and yield for fluences and for count rates (median and symmetric 68% credible interval). In both cases, this is in good agreement with the expected value in the case of homogeneously distributed sources in Euclidean space, which should be the correct scaling at the bright end of the distribution. Given the power-law scaling, the expected all-sky rate of events above a flux is simply
| (2) |
Taking the values corresponding to the 90th percentiles, these correspond to fewer than 1 event in 112 years (fluences) or 68 years (peak count rate) as bright or brighter than GRB 221009A. These values are of the same order as those found by Atteia (2022).
Given these expected rates, the probability of observing at least one event, assuming Poisson statistics, is given by
| (3) |
which yields using the fluences, and using the count rates. Again, these must be taken as upper limits due to saturation. These values, especially as upper limits, confirm that GRB 221009A is a very rare event, albeit not so low as to make GRB 221009A inconsistent with the extrapolation of the known population at a highly significant level.
4.4 Estimate based on a GRB population model
We also provide an estimate of the rate of GRB 221009A-like events based on the state-of-the-art model for the population of long GRBs described in Ghirlanda & Salvaterra (2022). This model predicts the intrinsic properties of the population of long GRBs, such as their luminosity function and cosmic rate, as obtained by reproducing the observed distributions of the properties of bursts detected by Fermi/GBM and CGRO/BATSE, and the distributions of rest-frame properties of a flux-limited sample of bright GRBs detected by Swift/BAT (Salvaterra et al., 2012).
By sampling the posterior distribution of the model population parameters (Tab. 1 in Ghirlanda & Salvaterra 2022), we estimate the probability of occurrence of an event with an isotropic-equivalent luminosity within a redshift , where (, ) correspond to the values of GRB 221009A.
Given the brightness of GRB 221009A, which saturated the GBM detectors, it is hard to evaluate its peak luminosity as well as the spectrum during the main emission event. Based on a preliminary analysis of Konus data, the spectrum during the unsaturated emission episode corresponding to 184–200 s (from the GBM trigger, that is, preceding the brightest pulse), is best fit with a Band function with a low-energy photon index , high-energy photon index and an observer-frame peak energy keV (Frederiks et al., 2022). According to the GBM preliminary data analysis (Lesage et al., 2022), the estimated peak flux measured in the 10–1000 keV band at 238.8 s (around the brightest time) is ph s-1 cm-2. By assuming this photon flux, and the same spectrum as that reported by Konus in the previous time interval, we estimate erg s-1, where we set .
With these values, considering that the luminosity is only a lower limit, we sampled the population model posterior probability and derived a rather less extreme 90th percentile upper limit on the rate of occurrence of GRB 221009A-like bursts of less than 1 in 22 years.
However, in the entirety of 55 years of GRB observations, no event has been reported that even comes close to GRB 221009A in terms of fluence (Burns et al. 2023, in preparation). Barring GRB 221009A, GRB 130427A was very likely the most fluent GRB of the combined CGRO/BATSE, Konus-Wind, and Fermi GBM era beginning in 1991, which is well-documented and readily publicly available (Paciesas et al., 1999; Kaneko et al., 2006; Nava et al., 2011; Goldstein et al., 2013; Tsvetkova et al., 2017, 2021; Ajello et al., 2019; von Kienlin et al., 2020).
The situation for the first years of GRB studies is less transparent, but there are several events with fluences similar to that of GRB 130427A, namely the famous GRB 830801B (Kuznetsov et al., 1986, 1987; Schaefer et al., 2001), the significantly less well-documented GRB 840304 (Klebesadel et al., 1984; Itoh et al., 1985), and two events detected by the Pioneer Venus Orbiter (PVO), GRBs 920212 and 900808 (the latter mentioned in Fenimore et al. 1996 as the brightest GRB in terms of peak flux detected by PVO). However, none of these events had a fluence in excess of erg cm-2, so GRB 221009A is potentially times as fluent as any other detected GRB ever detected (Burns et al. 2023, in prepation).
4.5 VHE emission
One of the most striking features of the detection of GRB 221009A is the identification of very high energy emission. In particular the LHAASO water Cherenkov observatory has reported the detection of more than 5000 TeV photons associated with the burst (Huang et al., 2022), with a highest energy photon at 18 TeV. The Carpet-2 experiment detected a possible 250 TeV photon (Dzhappuev et al., 2022).
Knowledge of the redshift is critical to interpreting these observations, because TeV photons scatter off the extragalactic background light (EBL) photons or even, at the very highest energy, off the Cosmic Microwave Background (CMB) photons. The EBL is the result of photons from essentially every photon emitter in the Universe, and so, as well as the CMB, is of important cosmological utility. These photon scatterings result in progressively higher opacity for photons of increasing energy. The detection of high-energy TeV photons is therefore a valuable route to probe models for the EBL.
Indeed, the detection of such emission from GRB 221009A at is particularly intriguing. For example, by reconstructing the expected intrinsic emission from blazars Domínguez et al. (2013) estimate the effective horizon as a function of photon energy: at 18 TeV this horizon (corresponding to an optical depth of 1, or an attenuation factor of ) lies at , while at , (attenuation ). Although the details of the attenuation will depend on the (currently unreported) details of the VHE emission, it is apparent that the intrinsic production of VHE emission must have been extreme in GRB 221009A (see Zhao et al. 2022 for a deeper discussion).
5 Conclusions
We have presented a measurement of the redshift of GRB 221009A with the VLT/X-shooter. Our observations fix the redshift to be , demonstrating that GRB 221009A is not only the brightest GRB ever seen (in terms of flux and fluence), but also intrinsically one of the most energetic.
From the fluxes of a few emission lines, detected on top of the afterglow spectrum, we could constrain the SFR, metallicity, and dust content of the host galaxy. The values found are consistent with those of GRB host galaxies at low redshift.
Besides the large tabulated amount of extinction in the direction of the GRB due to the MW ( mag), extra absorption is detected towards the GRB (by mag). From the shape of the afterglow SED, the fluxes of the host emission lines, and the detection of NaI in absorption, we suggest that about mag of extinction are located in the GRB host, with the remaining lying in the MW.
Our analysis suggests that a burst this close and this luminous should only be witnessed at best once every few decades, and may be as rare as a once per millennium event, depending on its actual flux and fluence values.
Acknowledgements.
We do not appreciate the Milky Way’s effort to block the light from GRB 221009A. Based on observations collected at the European Southern Observatory under ESO programme 110.24CF (PI Tanvir). AJL, DBM and NRT are supported by the European Research Council (ERC) under the European Union’s Horizon 2020 research and innovation programme (grant agreement No. 725246). The Cosmic Dawn Center is supported by the Danish National Research Foundation. DAK acknowledges the support by the State of Hessen within the Research Cluster ELEMENTS (Project ID 500/10.006). KW acknowledges support through a UK Research and Innovation Future Leaders Fellowship awarded to Dr. B. Simmons (MR/T044136/1). LI and JH were supported by a VILLUM FONDEN Investigator grant (project number 16599). AS and SDV acknowledge support from DIM-ACAV+. DX acknowledges the science research grants from the China Manned Space Project with NO. CMS-CSST-2021-A13 and CMS-CSST-2021-B11. PDA acknowledge funding from the Italian Space Agency, contract ASI/INAF n. I/004/11/4 and from PRIN-MIUR 2017 (grant 20179ZF5KS).References
- Agüí Fernández et al. (2023) Agüí Fernández, J. F., Thöne, C. C., Kann, D. A., et al. 2023, MNRAS, 520, 613, doi: 10.1093/mnras/stad099
- Ajello et al. (2019) Ajello, M., Arimoto, M., Axelsson, M., et al. 2019, ApJ, 878, 52, doi: 10.3847/1538-4357/ab1d4e
- Asplund et al. (2009) Asplund, M., Grevesse, N., Sauval, A. J., & Scott, P. 2009, ARA&A, 47, 481, doi: 10.1146/annurev.astro.46.060407.145222
- Atri et al. (2022) Atri, P., An, T., Giroletti, M., et al. 2022, GRB Coordinates Network, 32907
- Atteia (2022) Atteia, J. L. 2022, GRB Coordinates Network, 32793
- Bissaldi et al. (2022) Bissaldi, E., Omodei, N., Kerr, M., & Fermi-LAT Team. 2022, GRB Coordinates Network, 32637
- Bloom et al. (2009) Bloom, J. S., Perley, D. A., Li, W., et al. 2009, ApJ, 691, 723, doi: 10.1088/0004-637X/691/1/723
- Burns et al. (2016) Burns, E., Connaughton, V., Zhang, B.-B., et al. 2016, ApJ, 818, 110, doi: 10.3847/0004-637X/818/2/110
- Cano et al. (2017) Cano, Z., Wang, S.-Q., Dai, Z.-G., & Wu, X.-F. 2017, Advances in Astronomy, 2017, 8929054, doi: 10.1155/2017/8929054
- Cardelli et al. (1989) Cardelli, J. A., Clayton, G. C., & Mathis, J. S. 1989, ApJ, 345, 245, doi: 10.1086/167900
- Castro-Tirado et al. (2022) Castro-Tirado, A. J., Sanchez-Ramirez, R., Hu, Y. D., et al. 2022, GRB Coordinates Network, 32686
- Cenko et al. (2011) Cenko, S. B., Frail, D. A., Harrison, F. A., et al. 2011, ApJ, 732, 29, doi: 10.1088/0004-637X/732/1/29
- Chabrier (2003) Chabrier, G. 2003, PASP, 115, 763, doi: 10.1086/376392
- Clough et al. (1992) Clough, S. A., Iacono, M. J., & Moncet, J.-L. 1992, J. Geophys. Res., 97, 15,761, doi: 10.1029/92JD01419
- Cucchiara et al. (2011) Cucchiara, A., Levan, A. J., Fox, D. B., et al. 2011, ApJ, 736, 7, doi: 10.1088/0004-637X/736/1/7
- de Ugarte Postigo et al. (2020) de Ugarte Postigo, A., Thöne, C. C., Martín, S., et al. 2020, A&A, 633, A68, doi: 10.1051/0004-6361/201936668
- de Ugarte Postigo et al. (2022) de Ugarte Postigo, A., Izzo, L., Pugliese, G., et al. 2022, GRB Coordinates Network, 32648
- D’Elia et al. (2015) D’Elia, V., Pian, E., Melandri, A., et al. 2015, A&A, 577, A116, doi: 10.1051/0004-6361/201425381
- Dichiara et al. (2022a) Dichiara, S., Gropp, J. D., Kennea, J. A., et al. 2022a, The Astronomer’s Telegram, 15650
- Dichiara et al. (2022b) —. 2022b, GRB Coordinates Network, 32632
- Domínguez et al. (2013) Domínguez, A., Finke, J. D., Prada, F., et al. 2013, ApJ, 770, 77, doi: 10.1088/0004-637X/770/1/77
- Dzhappuev et al. (2022) Dzhappuev, D. D., Afashokov, Y. Z., Dzaparova, I. M., et al. 2022, The Astronomer’s Telegram, 15669
- Fenimore et al. (1996) Fenimore, E. E., Klebesadel, R. W., & Laros, J. G. 1996, ApJ, 460, 964, doi: 10.1086/177024
- Franceschini & Rodighiero (2017) Franceschini, A., & Rodighiero, G. 2017, A&A, 603, A34, doi: 10.1051/0004-6361/201629684
- Frederiks et al. (2022) Frederiks, D., Lysenko, A., Ridnaia, A., et al. 2022, GRB Coordinates Network, 32668
- Frederiks et al. (2013) Frederiks, D. D., Hurley, K., Svinkin, D. S., et al. 2013, ApJ, 779, 151, doi: 10.1088/0004-637X/779/2/151
- Fulton et al. (2023) Fulton, M. D., Smartt, S. J., Rhodes, L., et al. 2023, arXiv e-prints, arXiv:2301.11170, doi: 10.48550/arXiv.2301.11170
- Galama et al. (1998) Galama, T. J., Vreeswijk, P. M., van Paradijs, J., et al. 1998, Nature, 395, 670, doi: 10.1038/27150
- Ghirlanda & Salvaterra (2022) Ghirlanda, G., & Salvaterra, R. 2022, ApJ, 932, 10, doi: 10.3847/1538-4357/ac6e43
- Gilmore et al. (2012) Gilmore, R. C., Somerville, R. S., Primack, J. R., & Domínguez, A. 2012, MNRAS, 422, 3189, doi: 10.1111/j.1365-2966.2012.20841.x
- Goldoni et al. (2006) Goldoni, P., Royer, F., François, P., et al. 2006, in Society of Photo-Optical Instrumentation Engineers (SPIE) Conference Series, Vol. 6269, Society of Photo-Optical Instrumentation Engineers (SPIE) Conference Series, ed. I. S. McLean & M. Iye, 62692K, doi: 10.1117/12.669986
- Goldstein et al. (2013) Goldstein, A., Preece, R. D., Mallozzi, R. S., et al. 2013, ApJS, 208, 21, doi: 10.1088/0067-0049/208/2/21
- Gotz et al. (2022) Gotz, D., Mereghetti, S., Savchenko, V., et al. 2022, GRB Coordinates Network, 32660
- Hjorth & Bloom (2012) Hjorth, J., & Bloom, J. S. 2012, in Chapter 9 in ”Gamma-Ray Bursts, 169–190, doi: 10.48550/arXiv.1104.2274
- Huang et al. (2022) Huang, Y., Hu, S., Chen, S., et al. 2022, GRB Coordinates Network, 32677
- Itoh et al. (1985) Itoh, M., Fenimore, E. E., Fikani, M., et al. 1985, in Bulletin of the American Astronomical Society, Vol. 17, 850
- Izzo et al. (2017) Izzo, L., Thöne, C. C., Schulze, S., et al. 2017, MNRAS, 472, 4480, doi: 10.1093/mnras/stx2244
- Izzo et al. (2022) Izzo, L., Saccardi, A., Fynbo, J. P. U., et al. 2022, GRB Coordinates Network, 32765
- Japelj et al. (2016) Japelj, J., Vergani, S. D., Salvaterra, R., et al. 2016, A&A, 590, A129, doi: 10.1051/0004-6361/201628314
- Kaneko et al. (2006) Kaneko, Y., Preece, R. D., Briggs, M. S., et al. 2006, ApJS, 166, 298, doi: 10.1086/505911
- Kann & Agui Fernandez (2022) Kann, D. A., & Agui Fernandez, J. F. 2022, GRB Coordinates Network, 32762
- Kann et al. (2007) Kann, D. A., Masetti, N., & Klose, S. 2007, AJ, 133, 1187, doi: 10.1086/511066
- Kann et al. (2023) Kann, D. A., Agayeva, S., Aivazyan, V., et al. 2023, arXiv e-prints, arXiv:2302.06225. https://arxiv.org/abs/2302.06225
- Kennea et al. (2022) Kennea, J. A., Williams, M., & Swift Team. 2022, GRB Coordinates Network, 32635
- Klebesadel et al. (1984) Klebesadel, R. W., Laros, J. G., & Fenimore, E. E. 1984, in Bulletin of the American Astronomical Society, Vol. 16, 1016
- Krogager (2018) Krogager, J.-K. 2018, arXiv e-prints, arXiv:1803.01187, doi: 10.48550/arXiv.1803.01187
- Krühler et al. (2017) Krühler, T., Kuncarayakti, H., Schady, P., et al. 2017, A&A, 602, A85, doi: 10.1051/0004-6361/201630268
- Krühler et al. (2015) Krühler, T., Malesani, D., Fynbo, J. P. U., et al. 2015, A&A, 581, A125, doi: 10.1051/0004-6361/201425561
- Kuznetsov et al. (1987) Kuznetsov, A. V., Sunyaev, R. A., Terekhov, O. V., et al. 1987, Pisma v Astronomicheskii Zhurnal, 13, 1055
- Kuznetsov et al. (1986) Kuznetsov, A. V., Syunyaev, R. A., Terekhov, O. V., et al. 1986, Soviet Astronomy Letters, 12, 315
- Lapshov et al. (2022) Lapshov, I., Molkov, S., Mereminsky, I., et al. 2022, GRB Coordinates Network, 32663
- Lesage et al. (2022) Lesage, S., Veres, P., Roberts, O. J., et al. 2022, GRB Coordinates Network, 32642
- Levan et al. (2022) Levan, A. J., Barclay, T., Bhirombhakdi, K., et al. 2022, GRB Coordinates Network, 32921
- Lipunov et al. (2022) Lipunov, V., Kornilov, V., Gorbovskoy, E., et al. 2022, GRB Coordinates Network, 32634
- Liu et al. (2022) Liu, J. C., Zhang, Y. Q., Xiong, S. L., et al. 2022, GRB Coordinates Network, 32751
- Maiolino et al. (2008) Maiolino, R., Nagao, T., Grazian, A., et al. 2008, A&A, 488, 463, doi: 10.1051/0004-6361:200809678
- Maselli et al. (2014) Maselli, A., Melandri, A., Nava, L., et al. 2014, Science, 343, 48, doi: 10.1126/science.1242279
- Mitchell et al. (2022) Mitchell, L. J., Phlips, B. F., & Johnson, W. N. 2022, GRB Coordinates Network, 32746
- Modigliani et al. (2010) Modigliani, A., Goldoni, P., Royer, F., et al. 2010, in Society of Photo-Optical Instrumentation Engineers (SPIE) Conference Series, Vol. 7737, Observatory Operations: Strategies, Processes, and Systems III, ed. D. R. Silva, A. B. Peck, & B. T. Soifer, 773728, doi: 10.1117/12.857211
- Nava et al. (2011) Nava, L., Ghirlanda, G., Ghisellini, G., & Celotti, A. 2011, A&A, 530, A21, doi: 10.1051/0004-6361/201016270
- Osterbrock & Ferland (2006) Osterbrock, D. E., & Ferland, G. J. 2006, Astrophysics of gaseous nebulae and active galactic nuclei
- Paciesas et al. (1999) Paciesas, W. S., Meegan, C. A., Pendleton, G. N., et al. 1999, ApJS, 122, 465, doi: 10.1086/313224
- Palmerio et al. (2019) Palmerio, J. T., Vergani, S. D., Salvaterra, R., et al. 2019, A&A, 623, A26, doi: 10.1051/0004-6361/201834179
- Pei (1992) Pei, Y. C. 1992, ApJ, 395, 130, doi: 10.1086/171637
- Piano et al. (2022) Piano, G., Verrecchia, F., Bulgarelli, A., et al. 2022, GRB Coordinates Network, 32657
- Planck Collaboration et al. (2020) Planck Collaboration, Aghanim, N., Akrami, Y., et al. 2020, A&A, 641, A6, doi: 10.1051/0004-6361/201833910
- Poznanski et al. (2012) Poznanski, D., Prochaska, J. X., & Bloom, J. S. 2012, MNRAS, 426, 1465, doi: 10.1111/j.1365-2966.2012.21796.x
- Racusin et al. (2008) Racusin, J. L., Karpov, S. V., Sokolowski, M., et al. 2008, Nature, 455, 183, doi: 10.1038/nature07270
- Ripa et al. (2022) Ripa, J., Pal, A., Werner, N., et al. 2022, GRB Coordinates Network, 32685
- Salvaterra et al. (2009) Salvaterra, R., Della Valle, M., Campana, S., et al. 2009, Nature, 461, 1258, doi: 10.1038/nature08445
- Salvaterra et al. (2012) Salvaterra, R., Campana, S., Vergani, S. D., et al. 2012, ApJ, 749, 68, doi: 10.1088/0004-637X/749/1/68
- Schaefer et al. (2001) Schaefer, B. E., Deng, M., & Band, D. L. 2001, ApJ, 563, L123, doi: 10.1086/338651
- Schlafly & Finkbeiner (2011) Schlafly, E. F., & Finkbeiner, D. P. 2011, ApJ, 737, 103, doi: 10.1088/0004-637X/737/2/103
- Schlegel et al. (1998) Schlegel, D. J., Finkbeiner, D. P., & Davis, M. 1998, ApJ, 500, 525, doi: 10.1086/305772
- Schulze et al. (2014) Schulze, S., Malesani, D., Cucchiara, A., et al. 2014, A&A, 566, A102, doi: 10.1051/0004-6361/201423387
- Selsing et al. (2019) Selsing, J., Malesani, D., Goldoni, P., et al. 2019, A&A, 623, A92, doi: 10.1051/0004-6361/201832835
- Shrestha et al. (2023) Shrestha, M., Sand, D. J., Alexander, K. D., et al. 2023, arXiv e-prints, arXiv:2302.03829, doi: 10.48550/arXiv.2302.03829
- Soderberg et al. (2004) Soderberg, A. M., Kulkarni, S. R., Berger, E., et al. 2004, Nature, 430, 648, doi: 10.1038/nature02757
- Tan et al. (2022) Tan, W. J., Li, C. K., Ge, M. Y., et al. 2022, The Astronomer’s Telegram, 15660
- Tanga et al. (2018) Tanga, M., Krühler, T., Schady, P., et al. 2018, A&A, 615, A136, doi: 10.1051/0004-6361/201731799
- Tanvir et al. (2009) Tanvir, N. R., Fox, D. B., Levan, A. J., et al. 2009, Nature, 461, 1254, doi: 10.1038/nature08459
- Tanvir et al. (2018) Tanvir, N. R., Laskar, T., Levan, A. J., et al. 2018, ApJ, 865, 107, doi: 10.3847/1538-4357/aadba9
- Tsvetkova et al. (2017) Tsvetkova, A., Frederiks, D., Golenetskii, S., et al. 2017, ApJ, 850, 161, doi: 10.3847/1538-4357/aa96af
- Tsvetkova et al. (2021) Tsvetkova, A., Frederiks, D., Svinkin, D., et al. 2021, ApJ, 908, 83, doi: 10.3847/1538-4357/abd569
- Ursi et al. (2022) Ursi, A., Panebianco, G., Pittori, C., et al. 2022, GRB Coordinates Network, 32650
- Veres et al. (2022) Veres, P., Burns, E., Bissaldi, E., Lesage, S., & Roberts, O. 2022, GRB Coordinates Network, 32635
- Vernet et al. (2011) Vernet, J., Dekker, H., D’Odorico, S., et al. 2011, A&A, 536, A105, doi: 10.1051/0004-6361/201117752
- von Kienlin et al. (2020) von Kienlin, A., Meegan, C. A., Paciesas, W. S., et al. 2020, ApJ, 893, 46, doi: 10.3847/1538-4357/ab7a18
- Vreeswijk et al. (2004) Vreeswijk, P. M., Ellison, S. L., Ledoux, C., et al. 2004, A&A, 419, 927, doi: 10.1051/0004-6361:20040086
- Williams et al. (2023) Williams, M. A., Kennea, J. A., Dichiara, S., et al. 2023, arXiv e-prints, arXiv:2302.03642, doi: 10.48550/arXiv.2302.03642
- Xia et al. (2022) Xia, Z.-Q., Wang, Y., Yuan, Q., & Fan, Y.-Z. 2022, arXiv e-prints, arXiv:2210.13052, doi: 10.48550/arXiv.2210.13052
- Xiao et al. (2022) Xiao, H., Krucker, S., & Daniel, R. 2022, GRB Coordinates Network, 32661
- Zhao et al. (2022) Zhao, Z.-C., Zhou, Y., & Wang, S. 2022, arXiv e-prints, arXiv:2210.10778. https://arxiv.org/abs/2210.10778