email: Conny.Aerts@kuleuven.be 22institutetext: Department of Astrophysics, IMAPP, Radboud University Nijmegen, PO Box 9010, 6500 GL, Nijmegen, The Netherlands 33institutetext: Max Planck Institute for Astronomy, Koenigstuhl 17, 69117, Heidelberg, Germany 44institutetext: Guest Researcher, Center for Computational Astrophysics, Flatiron Institute, 162 Fifth Ave, New York, NY 10010, USA 55institutetext: I-BioStat, Universiteit Hasselt, Martelarenlaan 42, B-3500 Hasselt, Belgium 66institutetext: I-BioStat, KU Leuven, Kapucijnenvoer 35, B-3000 Leuven, Belgium
Astrophysical properties of 15062 Gaia DR3 gravity-mode pulsators
Abstract
Context. Gravito-inertial asteroseismology saw its birth thanks to high-precision CoRoT and Kepler space photometric light curves. So far, it gave rise to the internal rotation frequency of a few hundred intermediate-mass stars, yet only several tens of these have been weighed, sized, and age-dated with high precision from asteroseismic modelling.
Aims. We aim to increase the sample of optimal targets for future gravito-inertial asteroseismology by assessing the properties of 15062 newly found Gaia DR3 gravity-mode pulsators. We also wish to investigate if there is any connection between their fundamental parameters and dominant mode on the one hand, and their spectral line broadening measured by Gaia on the other hand.
Methods. After re-classifying about 22% of the F-type gravity-mode pulsators as B-type according to their effective temperature, we construct histograms of the fundamental parameters and mode properties of the 15062 new Gaia DR3 pulsators. We compare these histograms with those of 63 Kepler bona fide class members. We fit errors-in-variables regression models to couple the effective temperature, luminosity, gravity, and oscillation properties to the two Gaia DR3 parameters capturing spectral line broadening for a fraction of the pulsators.
Results. We find that the selected 15062 gravity-mode pulsators have properties fully in line with those of their well-known Kepler analogues, revealing that Gaia has a role to play in asteroseismology. The dominant g-mode frequency is a significant predictor of the spectral line broadening for the class members having this quantity measured. We show that the Gaia vbroad parameter captures the joint effect of time-independent intrinsic and rotational line broadening and time-dependent tangential pulsational broadening.
Conclusions. While the Gaia mission was not designed to detect non-radial oscillation modes, its multitude of data and homogeneous data treatment allow us to identify a vast amount of new gravity-mode pulsators having fundamental parameters and dominant mode properties in agreement with those of such Kepler bona fide pulsators. This large new sample of Gaia DR3 pulsators can be followed up with dedicated high-precision photometric or high-resolution spectroscopic instruments to embark upon asteroseismic modelling.
Key Words.:
Asteroseismology – Methods: Statistical – Astronomical Data Bases – Stars: Rotation – Stars: Interiors – Stars: oscillations (including pulsations)1 Introduction
The Gaia space mission of the European Space Agency (Gaia Collaboration et al., 2016b) is currently revolutionising the entire field of astrophysics. Even though Gaia is in the first place an astrometric mission, it also delivers the largest homogeneous survey of broad-band photometric and medium-resolution spectroscopic data (Gaia Collaboration et al., 2016a). While the Gaia mission was not at all designed to deliver input for the research field of asteroseismology (Aerts et al., 2010), it does contribute important information for that recent emerging topic within stellar astrophysics. Indeed, aside from stellar luminosities deduced from the high-precision parallaxes (Bailer-Jones et al., 2018), the Gaia instrumentation also delivers years-long photometric time-series data at milli-magnitude (mmag) precision in the Gaia G band. Although these Gaia G light curves are only sparsely sampled, they do allow to populate a wide range of stellar variability classes (see Eyer & Mowlavi, 2008, for a description of the “variability tree”). In particular, Gaia data allows us to study the classes of pulsating variables (cf., Aerts et al., 2010, Chapter 2) with unprecendented numbers of membership. Rimoldini et al. (2022) classified more than 12 million variables, among which RR Lyr stars (Clementini et al., 2022), Cepheids (Ripepi et al., 2022), young stellar objects (Marton et al., 2022), and long period variables (Lebzelter et al., 2022).
In this work, we focus on stars observed by Gaia and classified from its Data Release 3 (DR3 Gaia Collaboration et al., 2021, 2022b) as gravity-mode (g-mode hereafter) pulsators by Coordination Unit 7 treating variable stars (Holl et al., 2018; Gaia Collaboration et al., 2019; Eyer et al., 2022). In their Gaia DR3 Performance Verification Paper (PVP), Gaia Collaboration et al. (2022a, hereafter termed Paper I) assigned the stars we revisit in the present study to the classes of the Slowly Pulsating B (SPB stars, Waelkens, 1991; De Cat & Aerts, 2002) or Doradus stars (Dor, Kaye et al., 1999; Handler, 1999). These main-sequence g-mode pulsators are the best laboratories for asteroseismic probing of the deep interior of dwarfs with a mass between 1.3 M⊙ and 9 M⊙ (Aerts, 2021, for a general review of asteroseismology of such stars). By now, hundreds of single and binary dwarfs with a convective core have their rotation measured just outside their core from series of consecutive radial-order dipole g-mode oscillations (Kurtz et al., 2014; Triana et al., 2015; Keen et al., 2015; Saio et al., 2015; Van Reeth et al., 2016; Moravveji et al., 2016; Murphy et al., 2016; Pápics et al., 2017; Zwintz et al., 2017; Van Reeth et al., 2018; Li et al., 2019, 2020; Sekaran et al., 2021). Both the Dor and SPB pulsators reveal time-dependent spectral line variations due to the tangential velocity fields at the stellar surface (Aerts et al., 1999; De Cat & Aerts, 2002; Aerts et al., 2004; De Cat et al., 2006). These pulsators are intermediate-mass dwarfs in the core-hydrogen burning phase without strong stellar winds.
The Gaia DR3 light curves analysed in Paper I resulted in an order-of-magnitude increase in the population of the two classes of non-radial g-mode main-sequence pulsators. The position of these new candidate SPB and Dor pulsators in the Hertzsprung-Russell diagram was compared with theoretically predicted instability strips, each of which based on the dominant excitation mechanism for one particular choice of input physics, leading to coherent g modes with infinite lifetime in Paper I. It was found that many of the Gaia g-mode pulsators occur outside the borders of such instability strips for these two classes of g-mode pulsators. This was ascribed to inaccuracies in the Gaia effective temperature, their fast rotation and/or different input physics or (past) binarity not treated in instability predictions, in addition to too low opacities of heavy elements such as iron and nickel in the excitation layers as is well-known from previous excitation studies of SPB pulsators (Moravveji, 2016; Daszyńska-Daszkiewicz et al., 2017; Szewczuk & Daszyńska-Daszkiewicz, 2017). Moreover, aside from coherent eigenmodes with long lifetime driven by opacity layers or at the bottom of the outer convective envelope, internal gravity waves with short lifetimes excited at the interface between the convective core and/or the convective outer envelope and radiative zones have been suggested from multi-dimensional hydrodynamical simulations mimicking dwarfs in the considered mass regime (Rogers et al., 2013; Grassitelli et al., 2015b, a; Edelmann et al., 2019; Horst et al., 2020). All these predicted g modes and internal gravity waves act together in the stellar interior and those reaching the stellar surface with detectable amplitude give rise to complex light curves and time-dependent spectral line profile variations. This is in agreement with modern time-resolved space photometric large surveys delivering mag precision and highlighting a continuous coverage of observed intermediate-mass pulsating dwarfs along the main sequence (Uytterhoeven et al., 2011; Bowman et al., 2019; Pedersen et al., 2019; Antoci et al., 2019; Bowman et al., 2020; Balona & Ozuyar, 2020, and Paper I), after earlier similar findings from high-resolution ground-based time-resolved spectroscopy mentioned above.
Here, we study the astrophysical properties of the new Gaia DR3 g-mode pulsators found in Paper I. We consider all these pulsators having their luminosity, effective temperature, and gravity determined by the Gaia Data Processing Analysis Consortium (DPAC, Gaia Collaboration et al., 2016a, 2021). We compare the properties of these Gaia DR3 g-mode pulsators with those of the sample of 63 best-known bona fide g-mode pulsators observed with the NASA Kepler space telescope, for which high-resolution follow-up spectroscopy was assembled and interpreted. These Kepler and spectroscopic data led to the identification of dipole g modes of consecutive radial order and to asteroseismic modelling for these 63 dwarfs (Mombarg et al., 2021; Pedersen et al., 2021).
In the current follow-up study of Paper I we consider the amplitude of the dominant frequency in the Gaia G band and relate it to the fundamental parameters for both the Gaia DR3 and Kepler g-mode pulsators. Moreover, we consider the sub-samples of Gaia DR3 g-mode pulsators for which an estimation of the spectral line broadening is available from Gaia’s Radial Velocity Spectrometer (RVS) within the large homogeneous Gaia DR3 data set (Creevey et al., 2022; Frémat et al., 2022). Our general aim is to search for relationships between the fundamental parameters and pulsational properties of g-mode pulsators. In particular, we investigate if there is any connection between the properties of the dominant g mode of the stars and their rotation and/or spectral line broadening. So far, similar studies have been hampered by small sample sizes (Aerts et al., 2014a) or by separate and/or inhomogeneous treatment of statistical modelling based on the observables deduced from photometric and spectroscopic data (Simón-Díaz et al., 2017; Burssens et al., 2020). Even though the Gaia photometric and spectroscopic instruments were not designed to study non-radial oscillations nor optimised to deduce the line broadening of stars hotter than 7 000 K, DR3 does provide unprecedentedly large samples of homogeneously treated g-mode pulsators in terms of their line broadening and fundamental parameters compared to those available in the literature prior to Gaia DR3.
We discuss the sample selection for the current paper in Sect. 2 and consider the fundamental parameters and dominant variability characteristics of 15062 g-mode pulsators in Sect. 3 and Sect. 4, respectively. Section 5 focuses on the astrophysical interpretation of the measured spectral line broadening of the sample, based on the method of errors-in-variables and on multi-variable regression models constructed via the technique of backward selection. We discuss our findings and conclude in Sect. 6.
2 Sample selection
Paper I resulted in 106 207 Gaia DR3 main-sequence pulsators of spectral types O, B, A, or F fullfilling four criteria: 1) their Gaia DR3 G light curve consists of at least 40 epochs; 2) their dominant cyclic frequency (denoted here as ) in the Gaia G light curve occurs in the range d-1; 3) this frequency differs from any of the instrumental frequencies 4, 8, 12, 16, 20, and 24 d-1 by more than 0.05 d-1; 4) has a false alarm probability in the definition by Baluev (2008) below 0.001. Despite these already strict selection rules, additional restrictions on the frequency interval to which had to belong for each of the four considered pulsation classes were imposed in Paper I to beat instrumental effects in Fourier space, because they occur at mmag level and intervene with the signal of non-radial oscillations also occuring at such level for dwarf stars of intermediate mass.
The following four classes of pulsators were considered in Paper I: Cep stars, Slowly Pulsating B (SPB) stars, Sct stars, and Dor stars (cf. Aerts et al., 2010, Chapter 2). We refer to Paper I and its literature references for the details of the additional selection rules imposed upon based on common knowledge of the pulsational properties for these four well-known classes of variables, but recall here that the dominant modes of Cep and Sct stars are p modes with observed frequencies typically above 3 d-1, while SPB and Dor stars have dominant g modes with observed frequencies mostly below 3 d-1, except for the fastest rotators.
Within the sample of 106 207 candidate pulsators assigned to the four pulsation classes in Paper I, those having frequencies above the spin frequency of the Gaia satellite are most affected by mmag-level instrumental effects, which may lead to spurious frequencies unrelated to the star. For this reason, we focus the current work on the two classes of main-sequence pulsators having their dominant frequency well below the 4 d-1 spin frequency of the Gaia satellite. For now, with the relatively sparse DR3 light curves, this is the best approach to study the astrophysical properties of the Gaia DR3 g-mode pulsators without being contaminated by spurious instrumental frequencies.
Appendix B of Paper I discussed the results for the dominant frequency in the Gaia DR3 light curves of the 63 bona fide g-mode pulsators (26 SPB and 37 Dor stars) whose entire amplitude spectrum is known with a level of precision better than about d-1 in cyclic frequency and a few mag in amplitude (Van Reeth et al., 2015; Pedersen et al., 2021). Aerts et al. (2021) relied on the mode identification for all these stars’ detected and identified dipole modes of consecutive radial order to deduce the convective and wave Rossby numbers for these best-known Kepler g-mode pulsators, covering the mass range from 1.3 M⊙ up to about 9 M⊙. All these 63 pulsators have a dominant Gaia G amplitude, , below 35 mmag and their dominant frequency occurs in the interval d-1 (see Figs B.1 and B.2 in Paper I). Some of the new g-mode pulsators identified from Gaia DR3 in Paper I have higher dominant frequencies. Moreover, some of the Gaia DR3 g-mode pulsators have frequencies that are hard to unravel from the Gaia instrument frequencies caused by the spinning of the satellite.
Guided by Figs. B.1 and B.2 in Paper I summarising the dominant frequency and amplitude for the 63 bona fide Kepler g-mode pulsators, we further apply a fifth and sixth constraint in this work, in addition to the selecton criteria of Paper I mentioned above, namely we demand that 5) d-1 and 6) mmag. These two extra restrictions are applied to the SPB and Dor stars assigned to those two g-mode pulsator classes in Paper I. This is to ensure that we are dealing with non-radial oscillations rather than satellite frequencies. Moreover, we restrict these two samples to those pulsators having a measurement of , , and in the DR3 gspphot tables. We use those values in order to maximise the sample size of g-mode pulsators treated in one homogeneous way by DPAC routines, given that we need to cover temperatures from K all the way up to 25 000 K (see Paper I for details and Gaia Collaboration et al., 2022b; Creevey et al., 2022).
A continuous coverage of pulsating B, A, and F stars along the main sequence was found in Paper I, in agreement with Kepler and TESS results (e.g., Balona & Ozuyar, 2020). Since the variability classification used in Paper I relied only on the Gaia G-band DR3 light curves, it cannot distinguish between B- and F-type pulsators without spectroscopic information (cf., Pedersen et al., 2019; Gebruers et al., 2021). On the other hand, the Kepler data clearly revealed that Dor and SPB pulsators have different astrophysical and pulsational properties (Van Reeth et al., 2015; Saio et al., 2018; Pedersen et al., 2021). Thus, we wish to treat them as two separate classes. We do so by relying on the Gaia DR3 effective temperature to reclassify the g-mode pulsators. Following the upper limit in effective temperature from the instability predictions by Xiong et al. (2016) for Dor stars as treshold, we use K to distinguish between Dor and SPB candidates. In practice, we reclassify all Dor candidates as SPB if their effective temperature is above 8500 K and, vice versa, we re-assign all SPB stars with a temperature below 8500 K as Dor pulsator. This leads to a re-classification of 3244 Dor candidates as new SPB pulsators based on their Gaia DR3 effective temperature. This re-assignment gives a fractional memberships of 29% SPB and 71% Dor pulsators, which is fully in line with a Salpeter-type initial mass function (IMF, Salpeter, 1955) for the typical masses of 1.6 M⊙ for Dor stars (Mombarg et al., 2021) and of 4 M⊙ for SPB stars (Pedersen, 2022b). As we discuss later in the paper, another choice of the treshold temperature to distinguish the two classes does not impact any of the results.
A critical aspect of the current study compared to other surveys of g-mode pulsating dwarfs is that all the DR3 data and observables were obtained in one homogeneous way in terms of data selection and analysis. This is in contrast to the treatment of ground-based photometry and spectroscopy obtained for the much smaller dedicated asteroseismology samples for these two classes so far. While Gaia DR3 can only deliver the dominant mode at this stage, it provides by far the largest homogeneous survey of Dor and SPB pulsators to date.
3 Fundamental parameters of the g-mode pulsators in the two samples

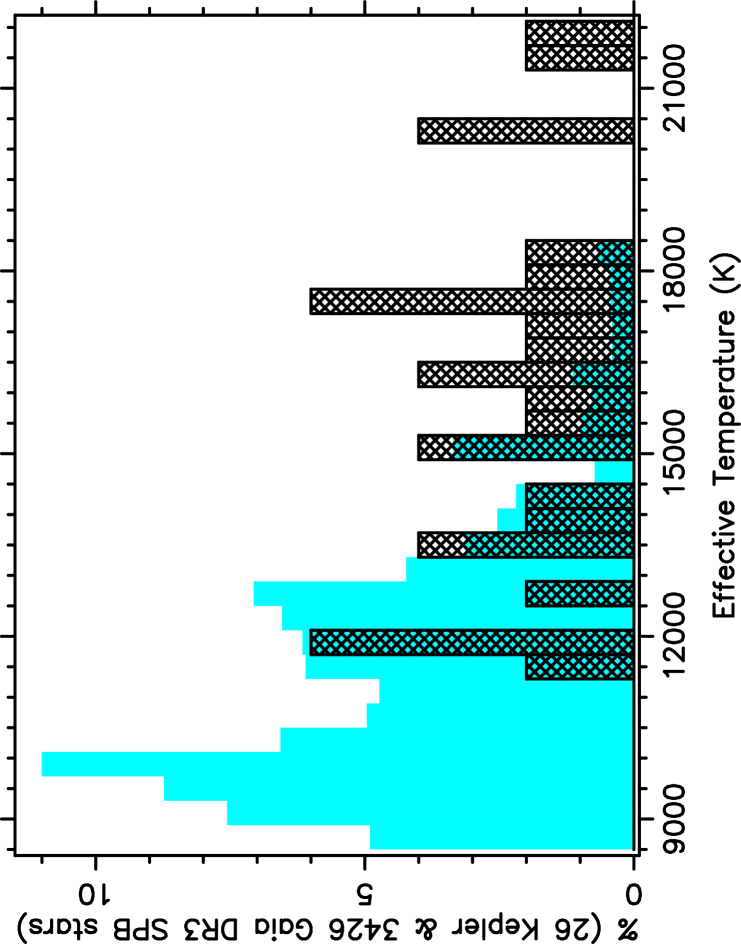
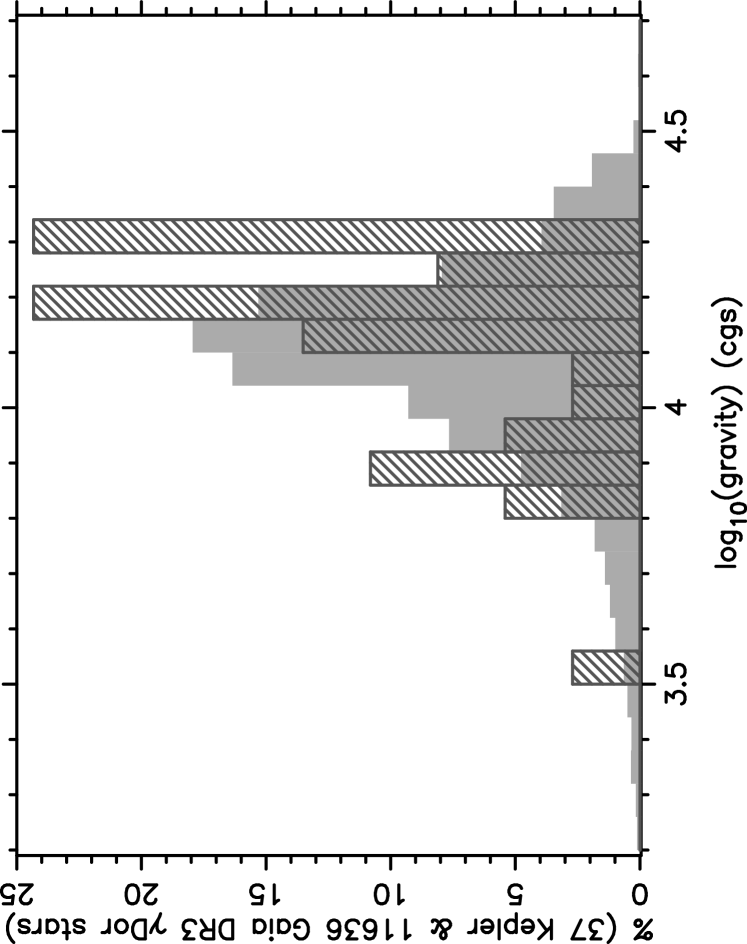
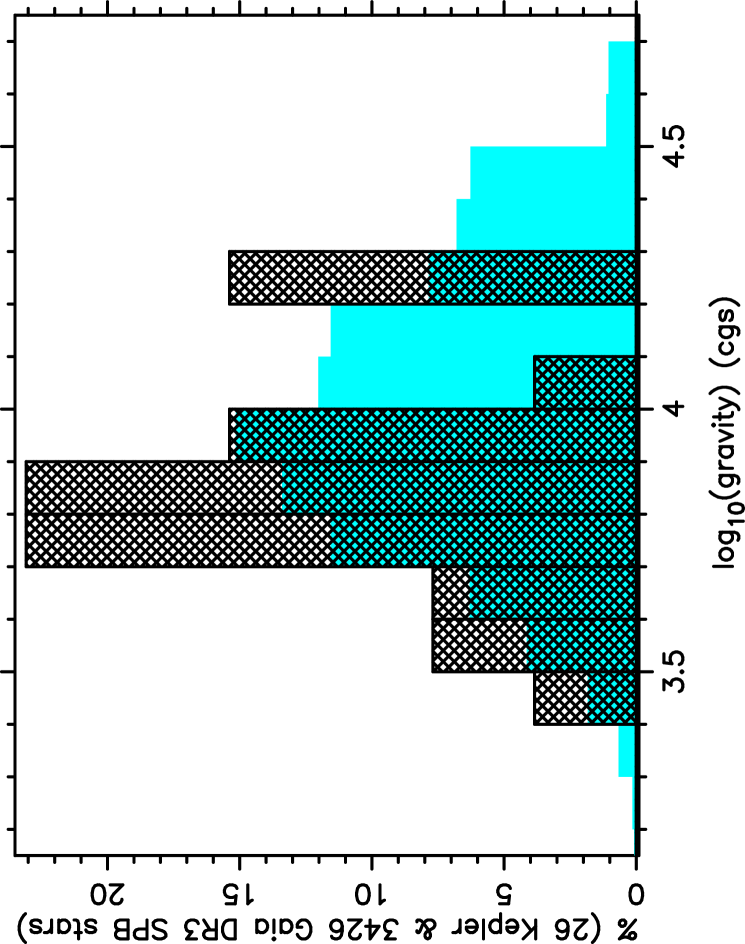
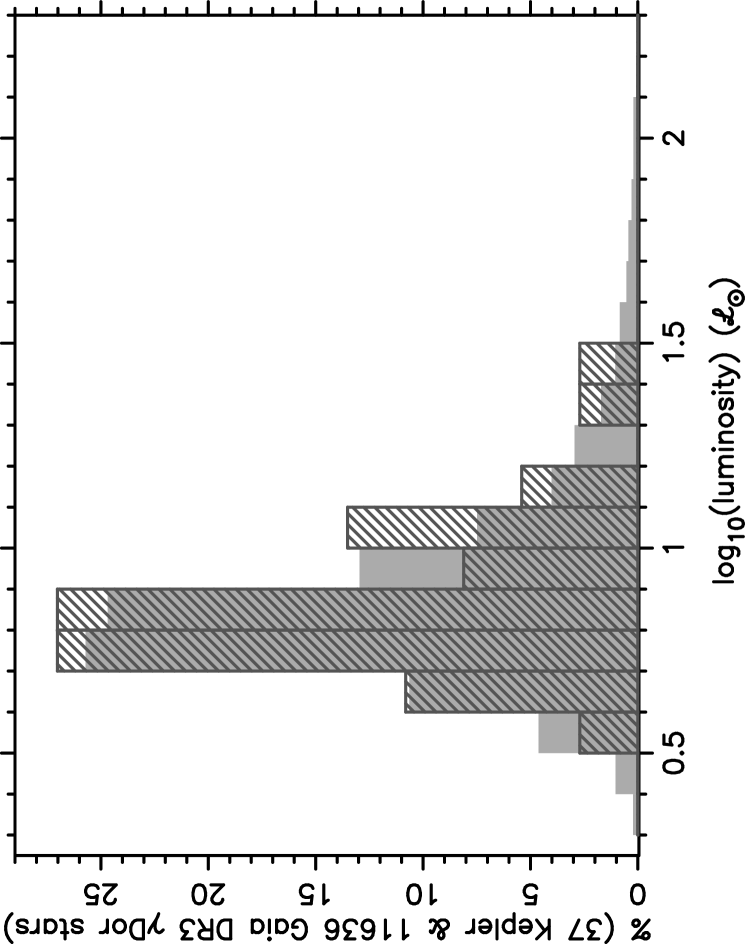
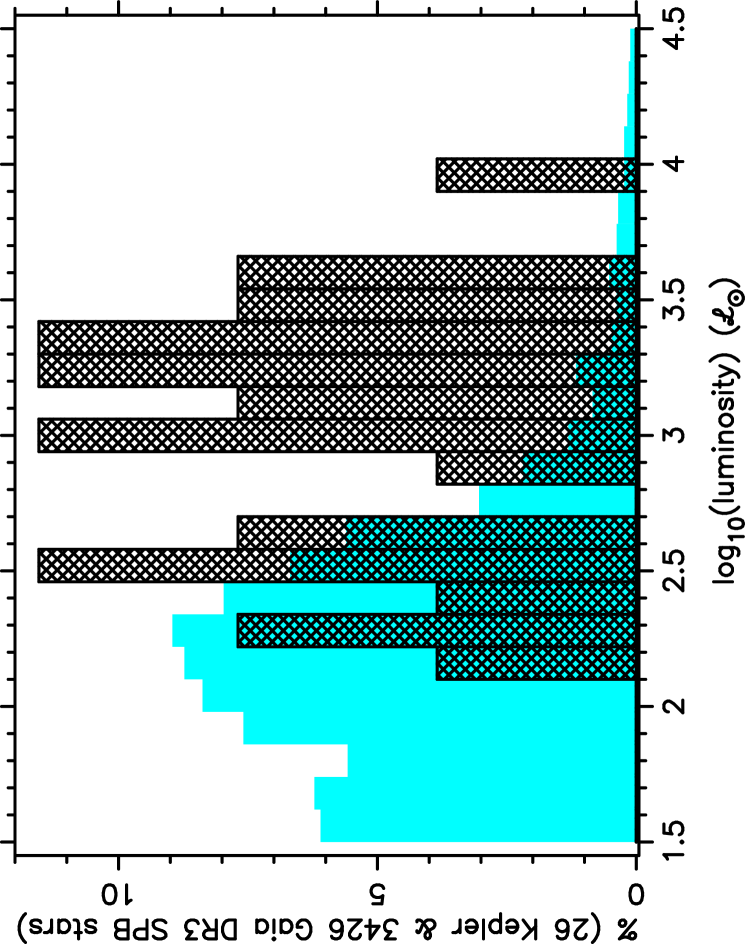
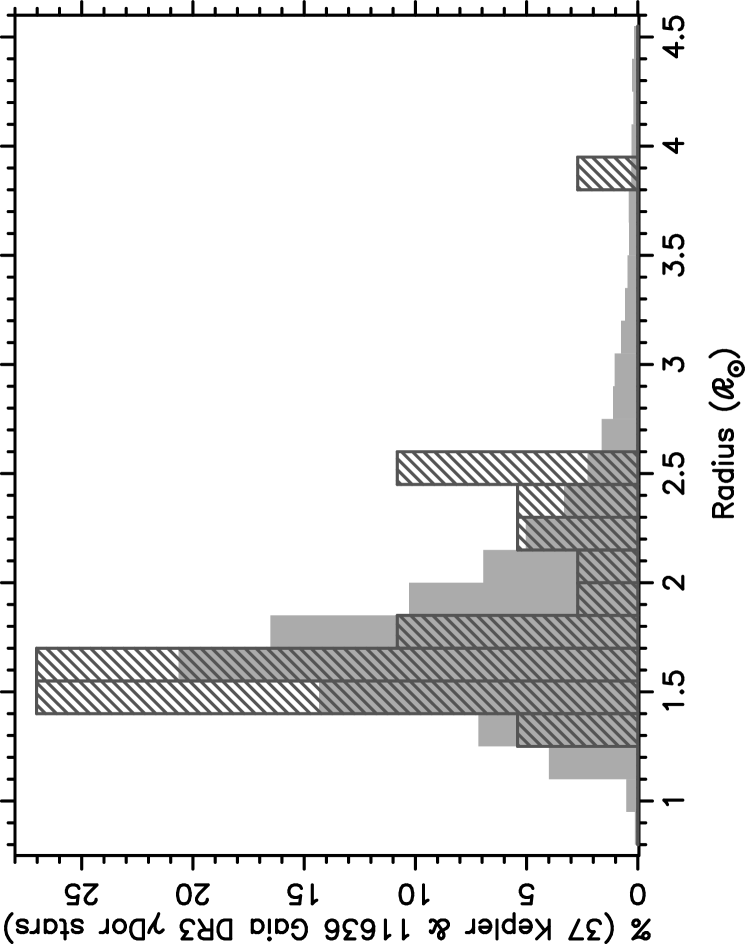
Figures 1, 2, and 3 show the histograms of the effective temperature, surface gravity, and luminosity for all 15062 Gaia DR3 g-mode pulsators in our two samples taken from the gspphot tables, in comparison with those quantities deduced for the 63 bona fide pulsators. For the latter, we took the high-precision values for these quantities from detailed asteroseismic modelling of their interior based on numerous identified dipole g modes by Pedersen (2022b, 26 SPB stars) and Mombarg et al. (2021, 37 Dor stars). Both these asteroseismic studies followed the methodology in Aerts et al. (2018) for the modelling of the internal stucture of these stars. In order to be able to compare the distributions of the samples with vastly different numbers of stars, we show the normalised histograms as percentages of the entire sample population. For the Dor stars, the distributions of the effective temperature () and luminosity (), with the solar luminosity) agree remarkably well between the 37 bona fide versus 11636 Gaia DR3 pulsators, revealing Gaia’s power to deduce these two fundamental parameters for large samples of such hot F-type pulsators. The gravities are somewhat lower than the asteroseismic values. Comparing the Gaia radii deduced from the DR3 and values shown in the left panel of Fig. 4 reveals that they are entirely compatible with the asteroseismic distribution, keeping in mind that the latter only consists of 37 pulsators.
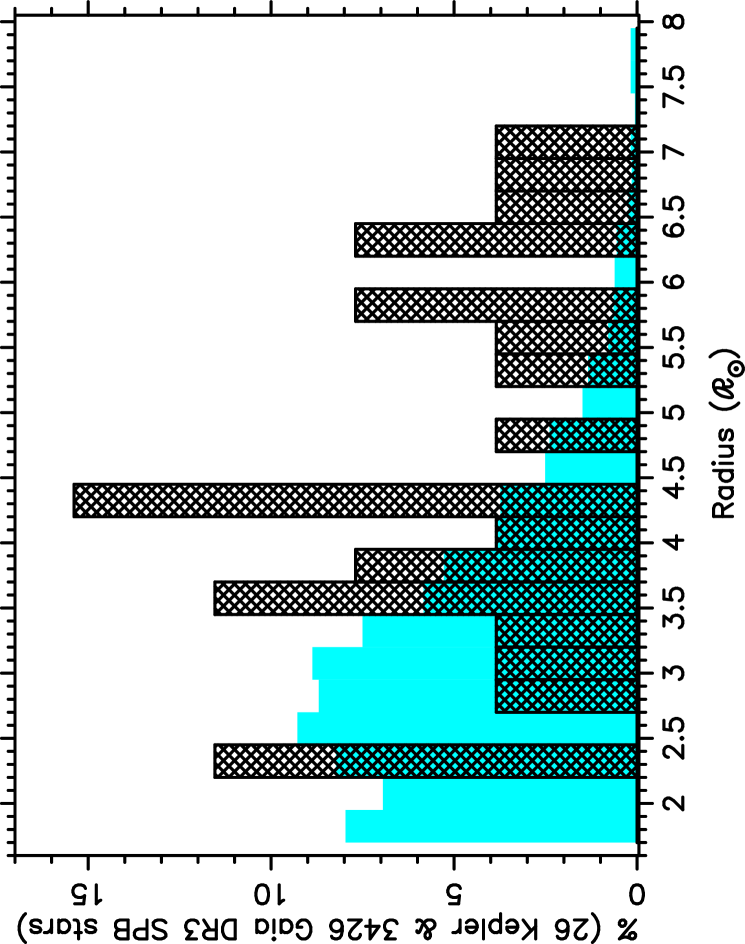
As for the SPB stars, the Gaia DR3 sample is concentrated in the lower part of the SPB instability strip as already found in Paper I. This paper also reported on possible systematic biases in the astrophysical parameters of hot stars as derived from the Gaia DR3 gspphot tables, more particularly shifts to lower temperatures due to poorly estimated reddening. Since we only work with the dominant frequency, we cannot exclude that some of the (reclassified) cool SPB stars are actually early A-type stars with rotational modulation. The majority of 3426 SPB stars in our sample have relatively low Gaia luminosities compared to the 26 SPB stars in the asteroseismic sample. These two aspects combined limit the power of Gaia DR3 to estimate radii based on the gspphot tables for the entire class of SPB stars, yet the radius distribution of the 3426 SPB stars is compatible with the one of the 26 bona fide SPB stars (Fig. 4, right panel).
Overall, the distributions for the three fundamental parameters , , and of the Gaia Dor and SPB stars are in good agreement with the asteroseismic values of the bona fide Kepler pulsators in these two classes, keeping in mind that the Gaia sample of SPB stars mainly contains cool class members. We conclude that Gaia DR3 gspphot values reveal proper distributions of radii for g-mode pulsators from their luminosity and effective temperature estimates when compared with the radii of the 63 bona fide pulsators from the best asteroseismic model for each of them.
4 Pulsational properties of the dominant g modes


As already emphasised in Paper I, Gaia has good capacity to detect non-radial oscillation modes in main-sequence stars. The two Gaia g-mode pulsator samples treated here result from quite strict selection rules on the Gaia G photometric light curves, yet they are already an order of magnitude larger than the corresponding Kepler samples. Despite the sparse Gaia sampling, it is to be anticipated that many more g-mode pulsators will be selected once the DR4 and DR5 data sets will become available.
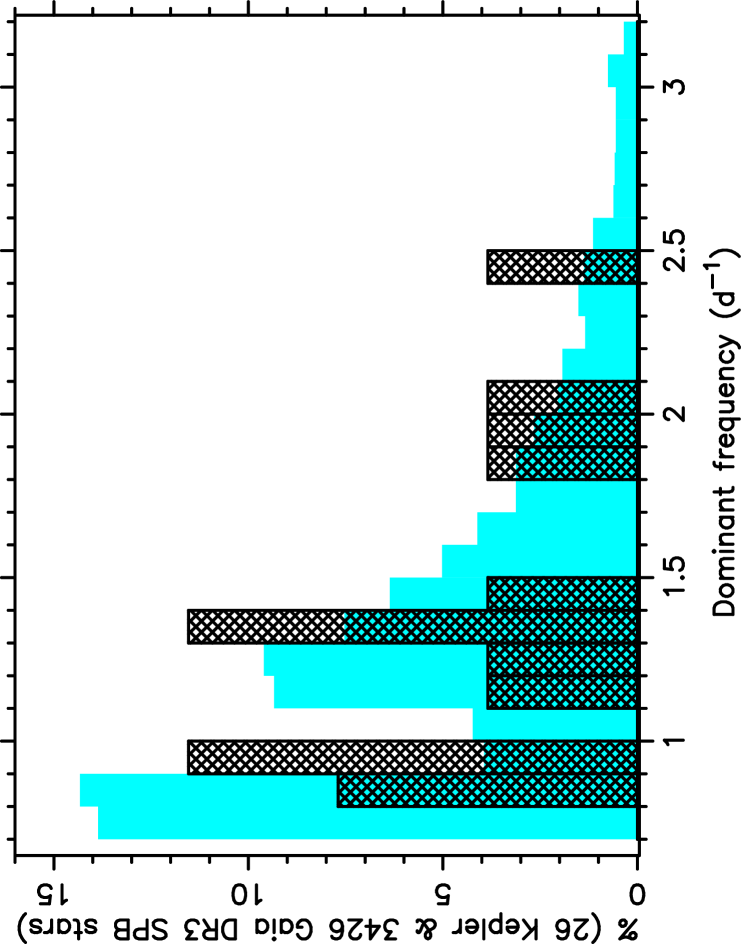
Figure 5 shows the distributions for the dominant frequency in the DR3 Gaia G band light curves. Overplotted are the distributions for the dominant frequency deduced from the far higher-precision and 4-yr uninterrupted high-cadence Kepler light curves taken from Van Reeth et al. (2015) and Pedersen et al. (2021) for the Dor and SPB stars, respectively. We recall that we used the dominant g-mode frequency range covered by these two samples of bona fide g-mode pulsators as selection criterion, to restrict the Gaia DR3 samples to pulsators adhering to this same appropriate frequency range. Hence it is built in that we find compatible ranges. Yet, also the distributions are reasonably well in agreement between the Gaia DR3 and Kepler pulsators, keeping in mind the small samples sizes for the latter.
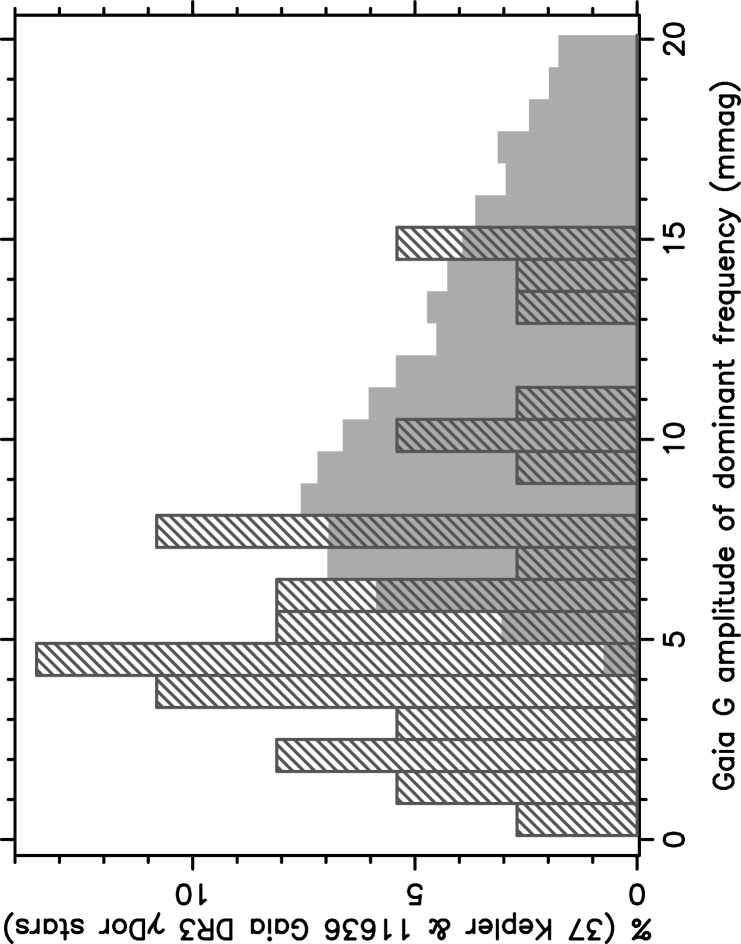
Figure 6 shows the histograms for the amplitude of the dominant frequency found in the Gaia G light curve. These bona fide pulsators did not survive our six selection criteria, mainly because they have fewer than 40 epochs in Gaia DR3 and/or their dominant frequency did not meet the FAP criterion. In order to be able to compare the amplitudes between the Gaia DR3 and Kepler pulsators, and to exclude instrumental effects for the bona fide pulsators, we computed their Gaia G amplitude by imposing their dominant frequency found in their Kepler light curve onto the Gaia G data, irrespective of the number of epochs in the latter and their FAP value. Both histograms in Fig. 6 visualise the current detection threshold to find g modes in the Gaia G light curves. It is seen that DR3 allows us to detect g-mode frequencies with an amplitude above 4 mmag. The Kepler data delivered g modes with far lower amplitudes as seen in the histogram, because the mission was designed to assemble mag-precision uninterrupted 30-min cadence photometry for exoplanet hunting (Borucki et al., 2010) and for asteroseismology (Gilliland et al., 2010). We find that the g-mode amplitude distributions for Gaia DR3 and Kepler hardly overlap for the class of the SPB pulsators as most of the 26 bona fide Kepler SPB stars have low dominant amplitudes outside Gaia’s reach.
5 Properties of spectral line broadening
Aside from photometric and astrometric data, the Gaia satellite also delivers spectroscopic data. Its spectrometer RVS has a median resolving power of 11 500 and is sensitive to the wavelength range from 846 to 870 nm. While it was built with the primary goal to measure the radial velocity of as many Gaia sources as possible (Katz et al., 2022), we use the RVS data to study the spectral line broadening of g-mode pulsators. Our aim is to investigate if, aside from rotational line broadening, there is any connection between the overall line broadening, the fundamental parameters, and the oscillation properties for the two large Gaia DR3 samples of g-mode pulsators, as suggested previously based on line-profile simulations (Aerts et al., 2009; Aerts & Rogers, 2015). While RVS on average provides a resolving power of only km s-1, non-radial oscillations generate variations in the width and the skewness of spectral lines (Aerts & De Cat, 2003) and these may affect the way that the line broadening values were determined (we refer to Frémat et al., 2022, for a detailed description omitted here).
Line-profile variations caused by the g modes of Dor and SPB stars occur at the level of several to tens of km s-1 in the centroid of the line (e.g., Aerts et al., 1999; De Cat et al., 2000; Mathias et al., 2001; De Cat & Aerts, 2002; Mathias et al., 2004; De Cat et al., 2006). High-resolution time-series spectroscopy of bright g-mode pulsators offers a powerful tool to identify the spherical wavenumbers of the dominant oscillation mode(s) provided that the oscillation cycle is well covered (Briquet et al., 2003; De Cat et al., 2005). Such applications couple the velocity field, computed from the theory of non-radial oscillations, to the observed line-profile variations to infer the radial and tangential components of the velocity vector due to each non-radial oscillation mode (Aerts et al., 2010, Chapter 6). This requires the spectroscopy to have high resolving power and signal-to-noise ratio (SNR) (typically above 50 000 and 300, respectively; Aerts & De Cat, 2003).
In the absence of high-quality spectroscopy, or in the case where only a few snapshot spectra are available, line-profile modelling by means of the proper time-dependent pulsational velocity field is impossible. In such a case, it is customary to approximate the overall line broadening due to oscillations and rotation together by a single time-independent function called macroturbulence (Simón-Díaz et al., 2010). Even though its functional form assumes a symmetrical line profile (cf. Aerts et al., 2014b, Fig. 9), the macroturbulence correlates strongly with quantities representing the line-profile variability (Simón-Díaz et al., 2017), such as the velocity moments (Balona, 1986; Aerts et al., 1992).
Fitting time-resolved line-profile variations due to oscillations or spots artificially with a symmetrical macroturbulent profile leads to time-variability in the macroturbulence which is in excellent agreement with the mode frequencies or rotation periods of intermediate-mass dwarfs (Aerts et al., 2014b). This suggests that macroturbulence is merely a downgraded (and often poor) time-independent symmetrical simplification of the true spectral line profiles caused by oscillations and/or spots. Nevertheless, in the absence of time-resolved spectroscopy, it is a sensible approach to fit the line profiles of snapshot spectra with a synthetic time-independent macroturbulent broadening profile, particularly for large surveys of stars such as offered by Gaia.
The g modes have dominant tangential displacements, implying that their velocity at the limb of the star dominates the detected line-profile variability. Yet, a common attitude in the literature has been to rely on the ad-hoc assumption that the radial and tangential components of the macroturbulent broadening profile are equal (Simón-Díaz & Herrero, 2014). This is the reason why unrealistic, often supersonic, values for the macroturbulent surface velocities are obtained. This in turn affects the estimation of the surface rotation (Aerts et al., 2014b). For that reason, it is essential to estimate the surface rotation first, independently from the macroturbulent broadening (Serebriakova et al., 2023).
In the following sections we investigate Gaia’s capacity to shed light on the astrophysical cause(s) of its measurements of the spectral line broadening from RVS. We do so for the two classes of Dor and SPB stars, whose velocity field at the stellar surface due to their non-radial oscillations is dominantly tangential (De Cat & Aerts, 2002; Aerts et al., 2004).
5.1 Gaia DR3 line broadening parameters
While Gaia’s medium-resolution RVS was not built to assess line broadening by stellar oscillations combined with rotation, it offers unprecedently large stellar samples analysed with a common methodology. We test the behaviour of line broadening measured with RVS with respect to the acting velocity fields at the stellar surface, where we know that our two samples undergo the joint effect of time-independent rotational and time-dependent pulsational line broadening. To do so, we rely on two Gaia DR3 parameters offered as measurement of spectral line broadening: vbroad (Frémat et al., 2022) and vsini-esphs (Creevey et al., 2022). Frémat et al. (2022) already made a careful study of these two quantities to interpret spectral line broadening for more than 33 million stars having kK. This range fully encapsulates the one of our Dor sample and largely overlaps with the SPB sample.
The Gaia DR3 parameter vbroad captures the overall line broadening after deconvolving the spectra with Gaia’s RVS instrument Along-Scan Line Spread Function (Sartoretti et al., 2022). This parameter vbroad thus includes the joint effect of all possible astrophysical causes that give rise to spectral line broadening, such as oscillations, rotation, spots, turbulent convective velocities, etc. The catalogued value of vbroad is the median value obtained by the Multiple Transit Analysis (MTA) over at least six valid transits. The corresponding catalogued uncertainty is the standard deviation with respect to this median value. This implies that the uncertainty may be a measure of the line-profile variability, because its range captures the line broadening occurring at minimally six different epochs aside from the contribution of the noise. For the current study, we have vbroad measurements for 1775 of the 11636 Dor stars and for 190 of the 3426 SPB pulsators.
Another estimate of the RVS line broadening denoted as vsini-esphs is obtained by the so-called Extended Stellar Parametrizer module developed within the Astrophysical ParameterS Inferences System APSIS (Creevey et al., 2022). APSIS is able to treat the parameters of hot stars and delivers vsini-esphs as an intermediate data product approximating time-independent rotational broadening. Its computation was done on the basis of the averaged values of BP and RP and the averaged RVS spectrum. Although this implies the variability to be filtered out from the quantity vsini-esphs to some level, it still contains a contribution from the oscillations (cf., De Pauw et al., 1993, for the theoretical expression of the line width due to non-radial oscillations). Nevertheless, vsini-esphs is a cleaner measurement of the time-independent projected surface rotation velocity than vbroad when rotation dominates the spectral line broadening, as is the case for g-mode pulsators. The error published for vsini-esphs is an approximation of the statistical error and does not represent a measurement of the time-variable line broadening like the standard deviation for vbroad. The quantity vsini-esphs deduced by APSIS results from an optimal RVS and BP/RP treatment for stars having a above 7500 K, while it relies on BP/RP alone for all stars with K that were not observed by RVS. Values for vsini-esphs are available for 384 of the 11636 Dor stars and for 1104 of the 3426 SPB stars.
The wavelength coverage of RVS was constructed so as to achieve optimal radial-velocity data for a broad range of stellar populations. Here we rely on its data for the purpose of studying spectral line broadening, for which the RVS wavelength domain is not optimal. This is particularly so for the hottest stars under study here. As a consequence, some of the vbroad and vsini-esphs measurements have large uncertainties. It is therefore essential to include these uncertainties, aside from the values themselves, in any proper astrophysical interpretation. We refer to Frémat et al. (2022) for a detailed and nuanced discussion about the quality of the vbroad and vsini-esphs measurements deduced from template spectra relying on the Gaia estimates. In particular, Frémat et al. (2022) discussed in detail the correlations between these two parameters for stars covering a broad range of magnitudes and temperatures. Of particular relevance for the current work is Fig. 16 in Frémat et al. (2022), illustrating two Hertzsprung-Russell diagrams with density maps as a function of median vbroad values. That figure clearly reveals high vbroad values along the upper main sequence, where the Dor and SPB pulsators are situated (encompassing the p-mode dominated class of Sct stars not treated here due to the much higher risk that their dominant frequency has an instrumental origin, as explained in Sect. 2). The figure reveals higher vbroad values for hotter stars but Frémat et al. (2022) do not provide any formal quantitative comparisons between vbroad and the stellar parameters.
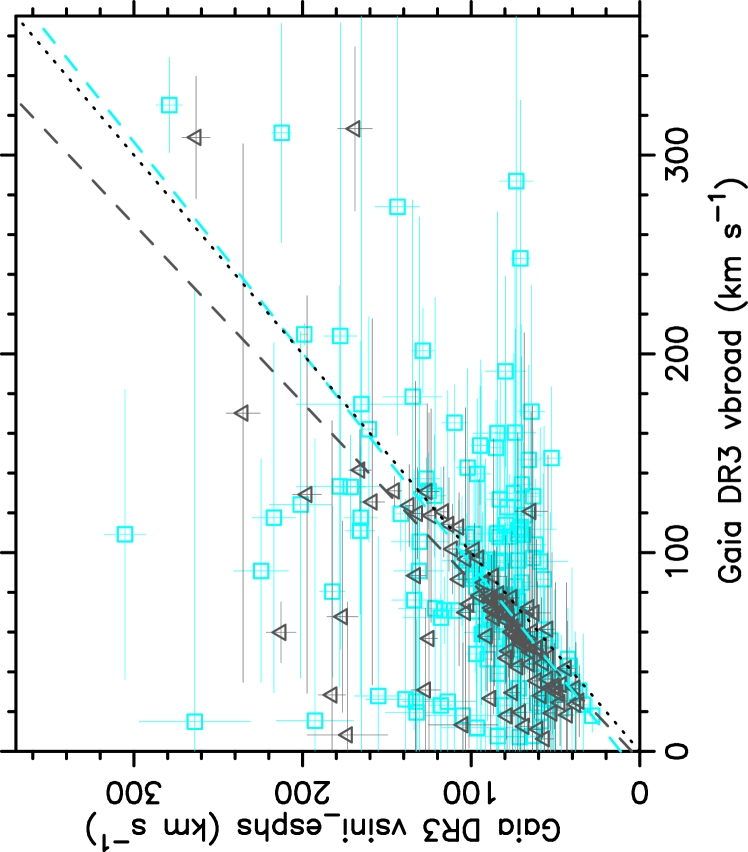
We show the 100 Dor and 156 SPB pulsators having a measurement of both vbroad and vsini-esphs in Fig. 7, along with their uncertainties. It can be seen that the overall range of the two quantities is rougly the same for these Dor and SPB stars. For each of the stars in Fig. 7, the two plotted quantities have similar yet not always equal values according to the uncertainty estimates. We remind that similarities between the two samples as a whole also occur for their ranges of the dominant mode amplitude and mode frequency (cf. Figs 5 and 6). It is then a natural question whether the oscillation properties cause the time-variability measured by vbroad and its standard deviation. On the other hand, we investigate whether the decrease of observed mode amplitude for faster rotators, as found in Paper I for the dominant p modes of the Gaia DR3 Sct stars, also occurs for g-mode pulsators.
In what follows we offer regression models accomodating errors-in-variables, which allows one to handle different measurements of the same astrophysical quantity (here the overall time-averaged spectral line broadening) having both star-specific and measurement-specific errors. These errors must be propagated properly when constructing the regression models and interpreting their outcome. This has been used in the context of Gaia data before, for example in a comparison between asteroseismic and astrometric parallaxes following DR1 (De Ridder et al., 2016). We first provide a general description of the methodology. Subsequently we apply it to the sample of the 37 bona fide Dor stars. For all these 37 stars we also have, in addition to their Gaia DR3 data, estimates of their “true” pulsational and rotational line broadening deduced from one homogeneous treatment of high-resolution high signal-to-noise ground-based spectroscopy taken with one instrument (such homogeneous spectroscopic information is not available for all 26 bona fide SPB pulsators). We use the results obtained for the 37 bona fide Dor stars to treat the Gaia DR3 g-mode samples optimally with the aim to interpret their spectral line broadening properties.
5.2 Errors-in-variables model
Let us denote two observed quantities by and and their true but unknown values by and . The errors-in-variables model is then specified by:
| (1) | |||||
| (2) | |||||
| (3) |
with indexing the stars in a sample. Here, and are fixed but unknown regression coefficients to be estimated from the data. The measurement error variances and are obtained from the observations. The residual error component , with variance , quantifies imperfection in the regression relationship.
If and would be nearly identical, then is expected to be close to 0 and would be close to 1. If the regression relationship in Eq. (3) is very precise relative to the measurement error, then would be near 0. Expressions (1)–(3) yield the mean and variance relationships:
| (4) | |||||
| (5) |
Assuming (approximate) normality, a fully parametric specification follows, thus enabling maximum likelihood estimation:
| (6) |
The SAS procedure NLMIXED (SAS Institute Inc., 2014) was used for the maximum likelihood estimation.
Extension to multiple predictors is straightforward, upon replacing Eq. (6) by:
| (7) |
with obvious notation. It is convenient to write Eq. (7) in vector notation as:
| (8) |
where and is a diagonal matrix with along the diagonal.
Model-based prediction of and its standard deviation can be expressed as:
| (9) | |||||
| (10) |
where the unknown parameters have been replaced by their data-based estimates. Expressions (9)–(10) can be used to assess the quality of the model fit. The second term under the square root in Eq. (10) takes the uncertainty in the estimated regression coefficient into account.
5.3 Spectral line broadening for the 37 bona fide Dor stars

For the 37 bona fide Dor stars, we now add three more quantities to the dominant frequency from Kepler photometry and the Gaia DR3 values for , , ), and . Following their discovery as g-mode pulsators in the Kepler data, Tkachenko et al. (2013) set up a ground-based spectroscopic campaign with the HERMES spectrograph attached to the 1.2m Mercator telescope situated at La Palma Observatory, Spain (Raskin et al., 2011). HERMES has a spectral resolution of 85000 and covers wavelengths from 377 to 900 nm. The HERMES spectra allowed Van Reeth et al. (2015) to deduce the overall spectral line broadening, here denoted as vbroadH, for the 37 stars and to unravel it into separate components stemming from time-independent rotational broadening () and a broadening component due to the joint effect of microturbulence and the oscillation modes at the particular epoch of the observed spectrum. Microturbulence represents an artificial Gaussian line broadening needed to bring observed spectral lines into agreement with line predictions from 1-dimensional atmospheric models. This small broadening is needed to take into account the occurrence of small-scale turbulent motions in the line forming region that are not included in atmosphere models. On the other hand, the velocities due to non-radial g-mode oscillations result in time-dependent line broadening. In the case of Dor stars, their joint net effect in the line-of-sight is of similar order of a few km s-1 (Aerts et al., 2004; De Cat et al., 2006). We therefore take the Gaussian line broadening determined by Van Reeth et al. (2015) as a good approximation for the overall pulsational broadening and denote it as voscH.
The two quantities and voscH were derived from the observed spectra after ensuring that none of the 37 stars are spectroscopic binaries. In practice, Van Reeth et al. (2015) found the following ranges for these two parameters for the sample of 37 stars: voscH km s-1 and vsiniH km s-1. The values and ranges reveal that this sample of bona fide Dor stars consists of slow to moderate rotators (compared to their breakup velocity) and that their rotational velocity is typically an order of magnitude larger than their tangential g-mode and microturbulent velocity together, where we recall that both quantities are integrations across the visible stellar surface in the line-of-sight. Since these two velocity components influence the width of spectral lines added in quadrature, these ranges show that it is extremely challenging to unravel pulsational from rotational broadening, even for high-resolution spectroscopy (cf., Aerts et al., 2004, their Fig. 8). Moreover, since snapshot spectra cannot deliver proper time-dependent line-profile variations and only the line broadening is deduced, assuming a symmetrical line while ignoring its true shape, the relative uncertainties for voscH are considerable.
We use the 37 measured values for vbroadH, , and voscH to interpret the Gaia DR3 measurements of the overall line broadening (denoted as vbroadG for the bona fide Dor stars), realising that the RVS resolving power is in principle insufficient to unravel pulsational from rotational line broadening. DR3 delivered vbroadG for 27 of the bona fide Dor stars. We used these values to treat the following questions:
-
1.
Is the quantity vbroadG obtained by Gaia RVS different from the independently obtained higher-precision quantities vbroadH or vsiniH?
-
2.
Can the variability in vbroadH measured from HERMES for the sample of the 37 bona fide Dor stars be predicted by the Gaia DR3 covariates , , ), , and and if so with what kind of quality?
Answering these two questions will help to find an astrophysical interpretation of Gaia’s vbroad values for the two new large samples of g-mode pulsators without being able to rely on measurements of line broadening deduced from high-resolution spectroscopy as we only have it available from a homogeneous data analysis for the 37 bona fide Dor pulsators.
| vbroadG | vbroadH | vsiniH | vsiniH | ||
| vbroadH | vbroadG | vbroadH | vbroadG | ||
| Effect | Par. | Estimates (s.e.) | |||
| Intercept | 4.8(2.4) | 2.5(2.5) | 0.53(0.97) | 2.3(2.4) | |
| Slope | 1.02(0.04) | 0.94(0.04) | 0.99(0.02) | 0.94(0.04) | |
| Res. var. | 0.0000(0.0002) | 0.0000(0.0000) | 0.0000(0.0000) | 0.0000(0.0000) | |
| Effect | Par. | 95% confidence intervals | |||
| Intercept | [0.16;9.74] | [7.63;2.55] | [1.44;2.49] | [7.19;2.56] | |
| Slope | [0.94;1.11] | [0.86;1.02] | [0.95;1.03] | [0.86;1.01] | |
To tackle the first question, we fit the statistical model in Eqn. (6) for four combinations of and . The parameter estimates and statistical properties of the regression models are presented in Table 1. We find that the residual variances are all extremely close to zero. None of the intercepts are significantly different from zero, and none of the slopes are significantly different from unity. This implies that all three quantities are essentially equal to each other, within the uncertainty limits specified by the measurement errors. The fractions of the variance explained by each of the four models range from 94% to 100%.
Given that vbroadG is missing for 10 of the 37 Dor stars, the models involving this variable were refitted after multiple imputation (Molenberghs & Kenward, 2007) to examine the potential impact of missingness on the results. This well-known statistical technique was only recently introduced in astrophysics for the treatment of missing data, such as the multivariate stellar astrophysics study relating nine measured quantities to surface nitrogen by Aerts et al. (2014a) and the time-series analysis of visual binaries by Claveria et al. (2019). The method was applied here as follows. First, based on a so-called imputation model, 100 copies of each missing values are drawn from the predictive distribution of what is missing, given what is observed. Second, each so-completed dataset is then analysed with the model that would be used had the data been complete. Third, the 100 results combined into a single result using appropriate combination rules. Results were qualitatively very similar to those reported in Table 1, offering confidence that missingness does not play an important role in the relationships offered in Table 1. For this reason and simplicity, we proceed with the results presented in Table 1.
Following up on the study by Van Reeth et al. (2015), we conclude from the bona fide Dor g-mode pulsators that single epoch spectra, even if of high resolution and high SNR, cannot distinguish the overall line broadening from the line broadening caused by just rotation when working with a fudge parameter relying on the assumption of a time-independent symmetrical line profile. Given this spectral line modelling limitation, we find that Gaia RVS delivers good approximate values for spectral line broadening compared to those deduced from snapshot high-resolution spectroscopy for early F-type stars. Yet the uncertainties deduced from the HERMES spectra are lower, because its better suitable spectral coverage includes more spectral lines whose shape is determined by the temperature rather than pressure broadening.
To address the second question, we examine the effect of the Gaia DR3 variables ), , , , and on the independently obtained parameter vbroadH. This can be done with or without adding vbroadG and with or without adding voscH to the set of predictors. We proceed by backward selection, starting with the full set of predictors and then progressively removing the one with the highest -value, until only significant effects remain (i.e., all ). In both versions with vbroadG included in the predictor set, this is the only one remaining after model selection, and we recover the result already reported in Table 1, as expected.
| Effect | Par. | Est. (s.e.) | -value | 95% conf. int. |
|---|---|---|---|---|
| Intercept | 95(4) | [86;104] | ||
| 28(5) | 0.0001 | [37;18] | ||
| 60(14) | 0.0001 | [32;88] | ||
| 57(6) | 0.0001 | [44;70] | ||
| Res. var. | 70(152) | 0.3623 | [238;378] |
When vbroadG cannot be considered, as is the case for the majority of Gaia targets, the following insignificant predictors are removed by means of backward selection: first , second ), and third voscH. Since the latter variable is removed, whether or not it is included among the predictors to select from does not matter. Hence, only one additional model is obtained, the fit of which is presented in Table 2. This model explains about 58% of the variance present in vbroadH via the effective temperature, surface gravity, and dominant frequency as covariates, which are all delivered by Gaia DR3. We note that the ranges of the covariates are for , for , and d-1 for , which is why they were linearly transformed as displayed in Table 2 to stabilise the model fit optimally.
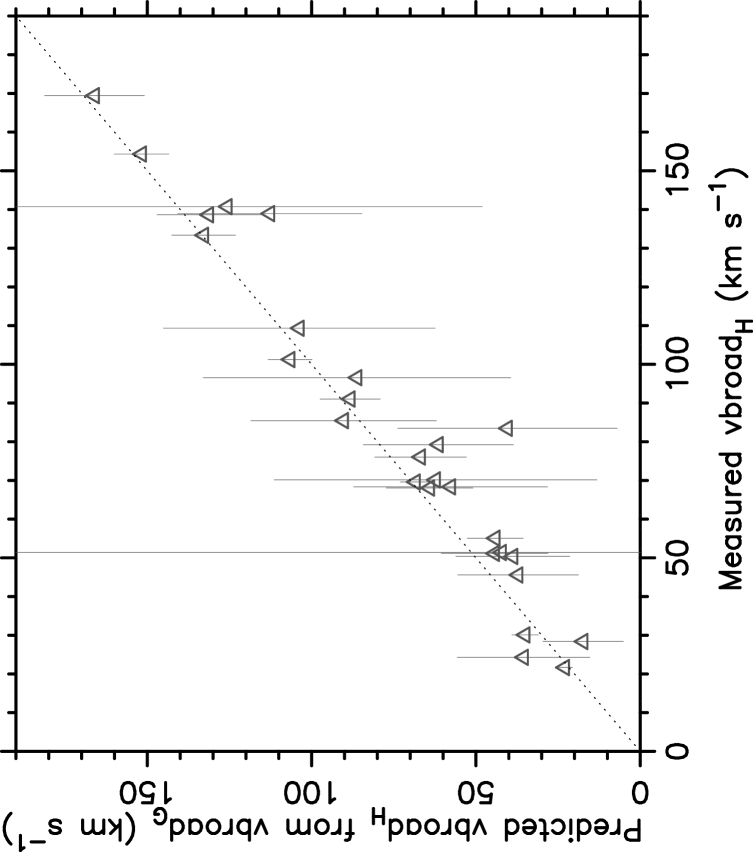
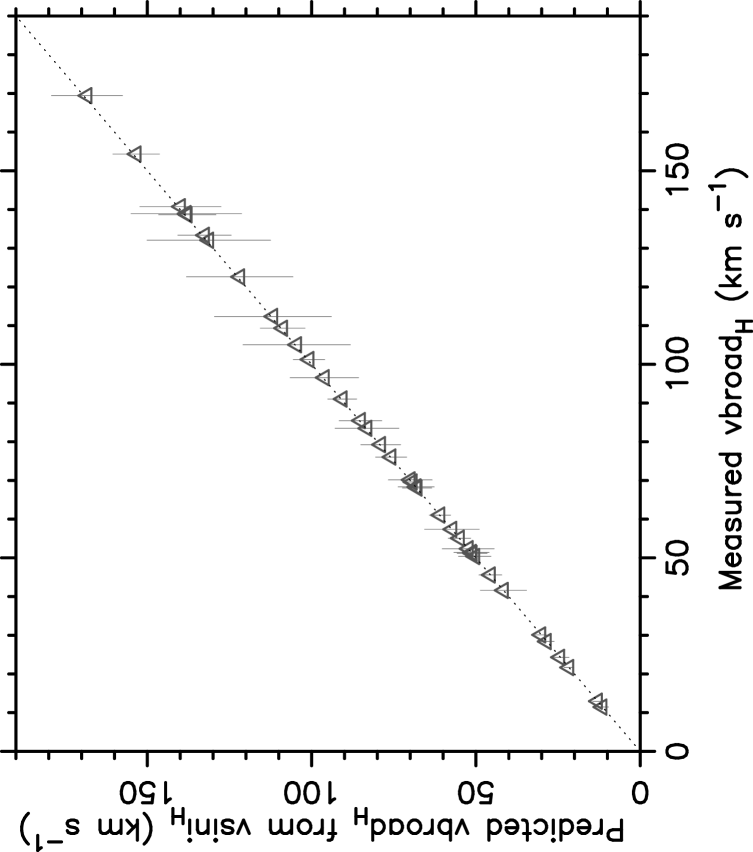
In response to the second question, we find the dominant g-mode frequency to be a significant predictor of the high-resolution spectroscopic line broadening, alongside the temperature and gravity of the star. This offers the opportunity to predict the line broadening for all the Gaia Dor stars without a Gaia measurement of the line broadening if these three covariates are available, as is the case for the majority of the Gaia DR3 Dor stars. Of course it should be born in mind that some predictors exhibit mild to strong correlation, given their astrophysical meaning. In the particular application of the bona fide Dor stars, the strongest correlation among the predictors is the one between and , namely -0.70. The correlation between and is 0.40, while correlates equally with and with with a moderate value of 0.32. All other correlations are much smaller. Hence, the regression coefficients in a model with multiple predictors should be interpreted as the effect of change by one unit in a predictor, while all others remain constant, in this case for the three surviving predictors , , and . A graphical perspective on the predictions for vbroadH from vbroadG, vsiniH, and the three covariates is shown in Fig. 8, using Eqns. (9)–(10).
5.4 Results for the Gaia DR3 Dor pulsators
Armed with the knowledge that vbroadG and vbroadH are equal for the 37 bona fide Dor stars to within their measurement uncertainties from high-resolution and Gaia RVS spectra, and with the predictive model for these quantities given in Table 2, we now look at the sample of 11 636 Gaia DR3 Dor stars. For all of those, full information is available on , , , , and , deduced in one homogeneous way from Gaia DR3 following Paper I. For 100 of these stars, both vbroadG (as of now again simplified to vbroad) and vsini-esphs are recorded. These are the so-called completers of the Gaia DR3 Dor stars. For 1775 Dor stars there is a measurement on vbroad but not on vsini-esphs and for 384 vsini-esphs information is available but vbroad is missing. For the remaining 9577 stars both of these line broadening quantities are missing.
| Effect | Par. | Estimate (s.e.) | -value | 95% conf. int. |
|---|---|---|---|---|
| Intercept | 5(3) | [12;2] | ||
| Slope | 0.90(0.05) | 0.0001 | [0.81;0.99] | |
| Res. var. | 0(4) | 0.98 | [7;7] |
When considering the 100 completers only, we again conclude that vbroad and vsini-esphs are identical within the bounds specified by the measurement errors, given that the slope parameter is roughly equal to unity and the residual variance is not different from zero (see Table 3). Figure 7 already showed that the two variables vbroad and vsini-esphs are similar for the Dor stars with both estimates, while graphically revealing the different meaning of their uncertainty regions. The grey dashed line in that figure represents the regression model in Table 3.
For the full Gaia DR3 Dor data set, the relationship between vbroad and vsini-esphs can also be assessed using all stars after performing multiple imputation. For this application we drew ten imputations using information on vbroad, vsini-esphs, their standard errors, and the covariates , , , , and . Given that less than 1% of stars have complete information, the relationship found from multiple imputation is relatively different from the one found for the 100 completers. This is not surprising given the relatively large uncertainties of the two broadening parameters and the fact that they are rather weakly correlated with other information in the dataset. Moreover, the very large fraction of incomplete information destabilizes the inference from multiple imputation. These issues taken together suggest that the results of multiple imputation are too unstable to provide trustworthy results. For these reasons, further analysis will be based on completers only for each of the regression applications discussed below.
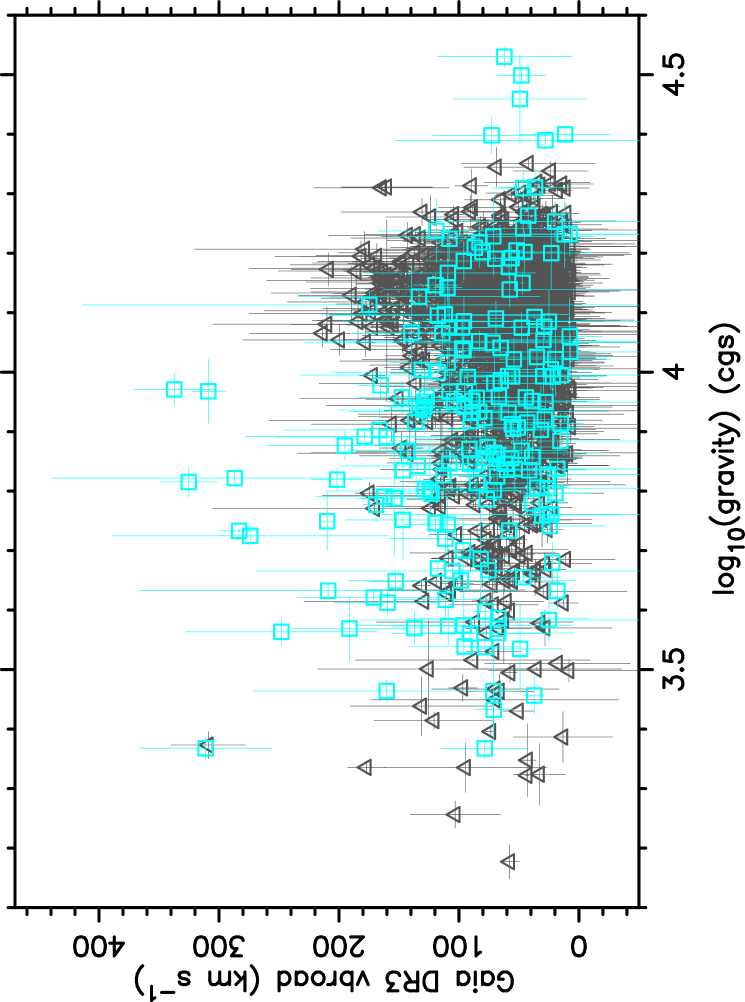
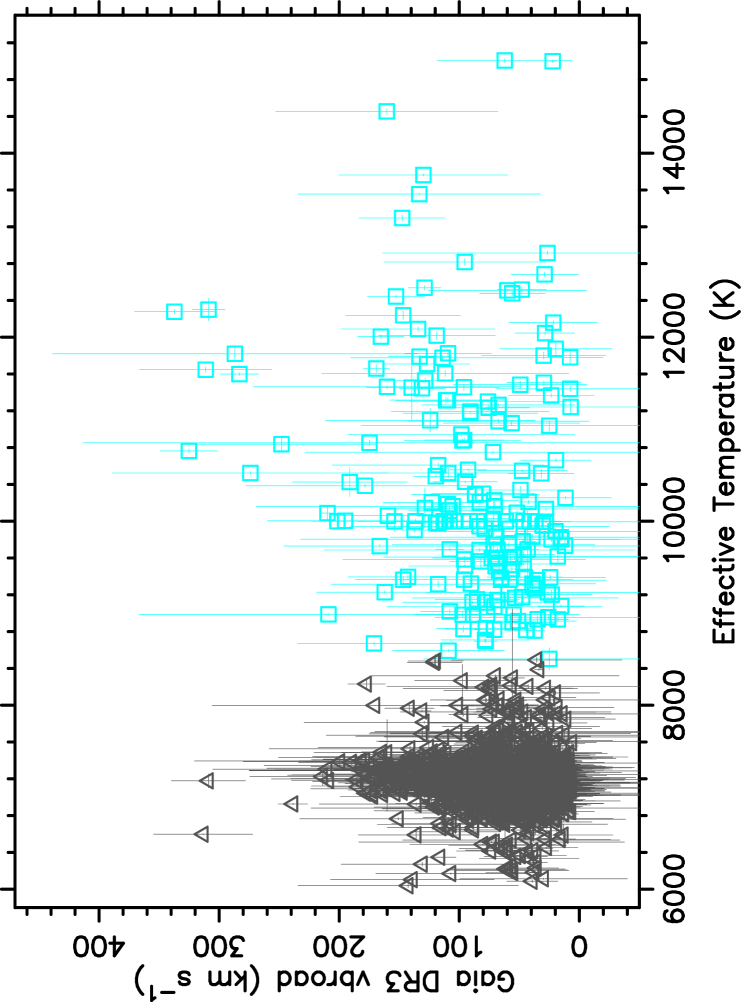
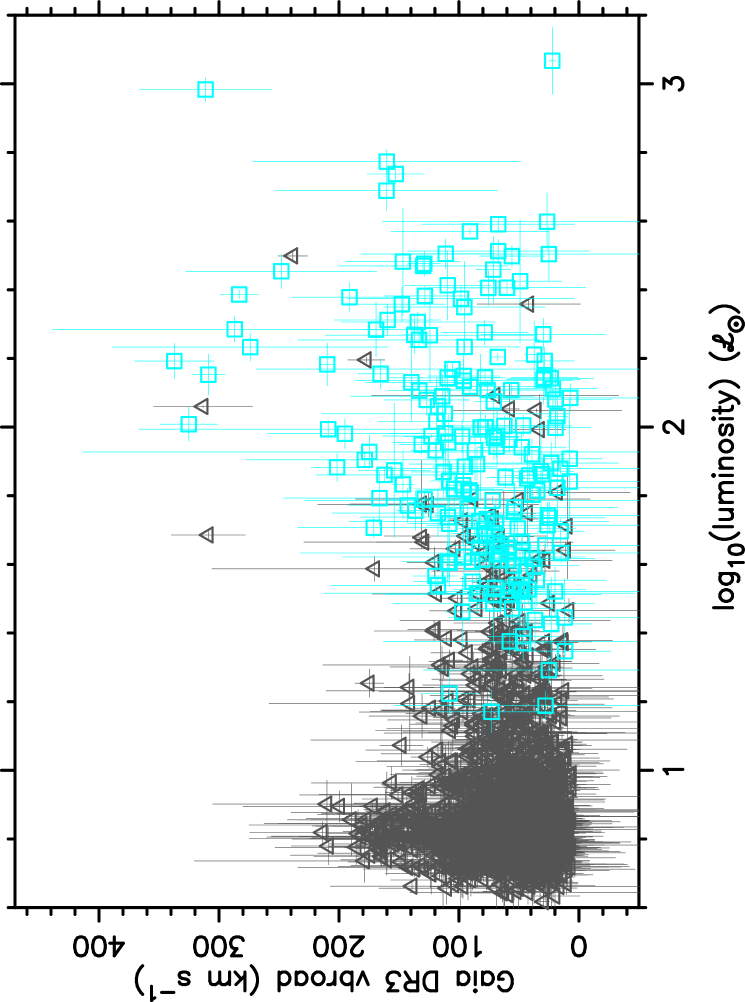
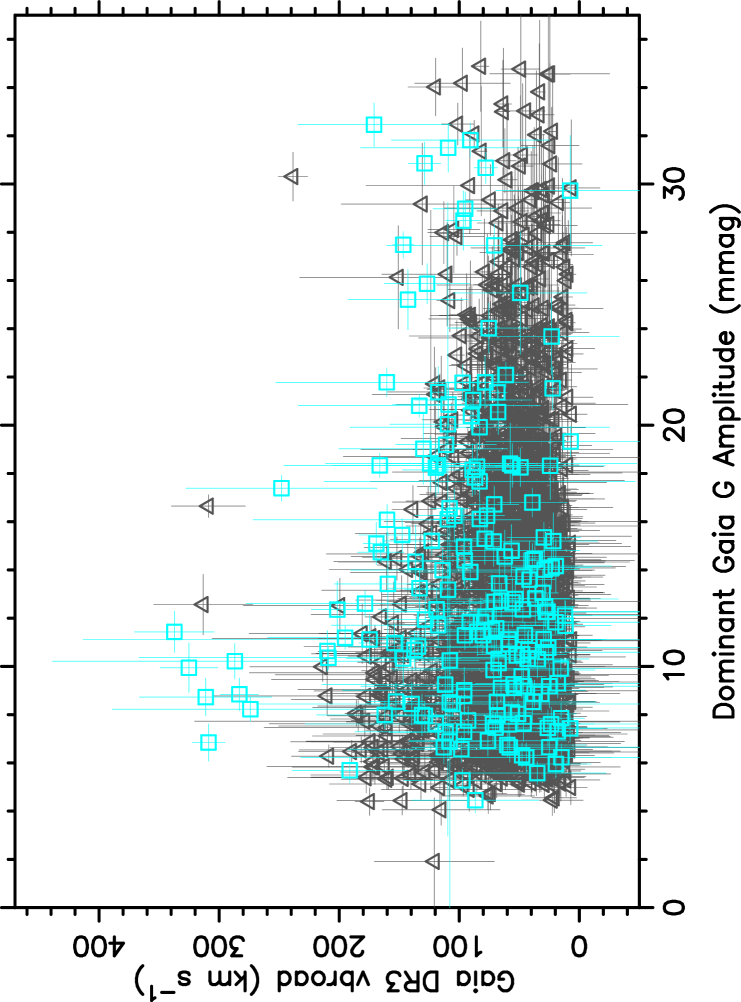
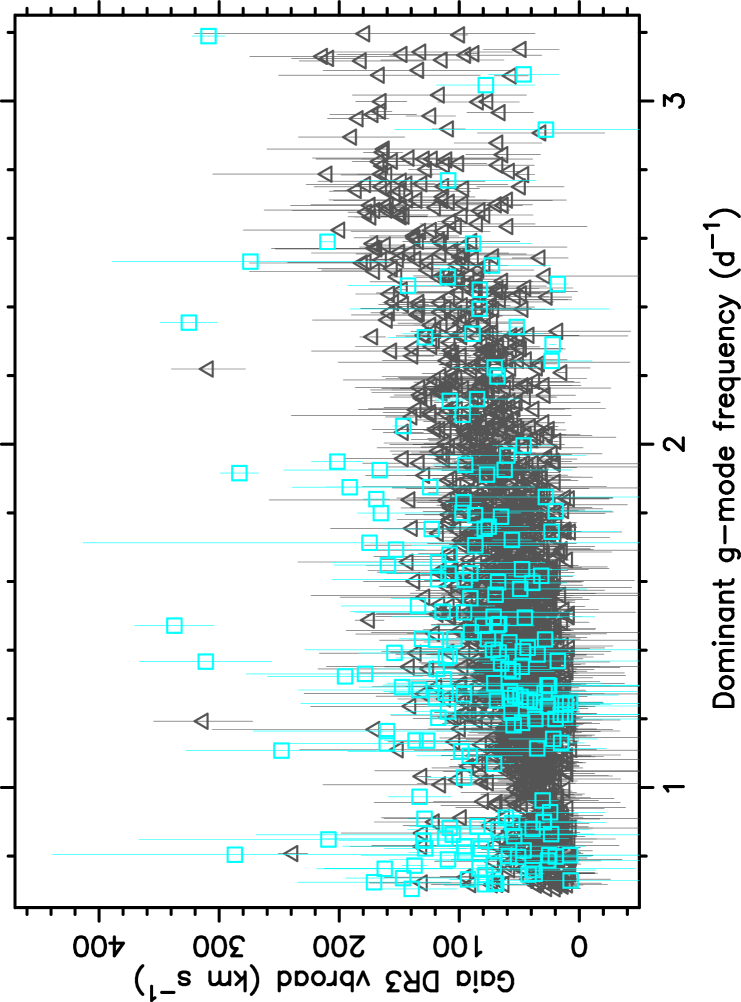
We now turn to the relationship between vbroad and the predictor variables, applying backward selection to the errors-in-variables model for the 1775 Dor stars having this quantity and the covariates , , ), , and (whose regression coefficients we denote as , respectively). It turns out that all these covariates are significant except the amplitude of the dominant frequency, which has a value of 0.0662 and is thus borderline significant. This is why we present the regression models with and without this covariate in Table 4. Both these models explain 42% of the variance in the measurements of vbroad. It can be seen in Table 4 that keeping in the model does not alter the regression coefficients of the other four covariates. We show the measurements of vbroad as a function of each of the covariates in Fig. 9.
| Effect | Par. | Estimate (s.e) | -value | 95% conf. int. |
|---|---|---|---|---|
| With | ||||
| Intercept | 478(262) | [993;36] | ||
| 238(87) | 0.0065 | [67;409] | ||
| 100(19) | 0.0001 | [138;63] | ||
| ) | 45(15) | 0.0022 | [74;16] | |
| 44(1) | 0.0001 | [41;46] | ||
| 192(104) | 0.0662 | [397;13] | ||
| Res. var. | 397(20) | 0.0001 | [358;437] | |
| Without | ||||
| Intercept | 478(260) | [988;32] | ||
| 237(87) | 0.0062 | [68;407] | ||
| 100(19) | 0.0001 | [138;63] | ||
| ) | 45(15) | 0.0023 | [73;16] | |
| 44(1) | 0.0001 | [41;47] | ||
| Res. var. | 395(20) | 0.0001 | [356;435] | |
As discussed in Sect. 5.1, vsini-esphs is based on the averaged BP/RP (and averaged RVS spectrum when available) and therefore has smaller uncertainty than vbroad whose uncertainty interval represents the time-dependent line broadening covered by at least six snapshot spectra. By construction, vsini-esphs is expected to be a better representative of the time-independent surface rotation velocity of the star than vbroad. Indeed, the latter quantity approximates the overall time-dependent spectral line broadening due to various phenomena acting together because it was computed as the median value from individual transits taken at different epochs and treated as such by the MTA.
To test if vsini-esphs and vbroad indeed capture different astrophysical information, we repeat the same backward model selection for vsini-esphs, considering the same covariates for the 384 Dor stars having a measurement of vsini-esphs. This leads to the successive removal of , , and as being insignificant. The coefficients of the resulting regression model are listed in Table 5, while the plots of the measurements of vsini-esphs as a function of each of the covariates are included in Appendix A (Fig. 10, to be compared with Fig. 9). We find that vsini-esphs does not depend on the effective temperature and the luminosity, while the surface gravity and dominant frequency remain significant covariates. These two covariates offer the same dependence for vsini-esphs as for vbroad, that is lower (a more evolved star) and higher give larger line broadening. As far as is concerned, this is well understood in terms of an asteroseismic interpretation and in agreement with the findings based on the HERMES spectroscopy by Van Reeth et al. (2015) for the bona fide Dor stars. Indeed, a higher dominant g-mode frequency in the inertial frame of an observer corresponds to a faster rotating star (Van Reeth et al., 2015, 2016; Pápics et al., 2017, for galleries of Kepler light curves and frequency spectra as a function of rotation frequency). Hence, higher asteroseismic is a signature of faster stellar rotation and thus of larger line broadening, irrespective of whether one considers vsini-esphs or vbroad.
While the resulting regression model for vsini-esphs of 384 class members explains only 5% of the variance in that quantity, it is 42% for vbroad of the 1775 stars having this quantity. Thus the time-independent projected rotational velocity represented by vsini-esphs of the Dor stars is independent of their effective temperature and luminosity, while inversely proportional to (but only weakly dependent on) their gravity. On the other hand, the time-dependent quantity vbroad does connect to the effective temperature of the Dor stars, such that the hotter the star, the larger vbroad. Our astrophysical interpretation of these findings connects well to the excitation mechanisms and to the level of line broadening found for Dor stars in the literature. Indeed, since the Kepler data allowed for detailed asteroseismic modelling, we know that the dominant modes of the bona fide g-mode pulsators are dipole prograde modes and that these stars occupy a narrow range in mass, namely M⊙, while they cover the entire main sequence (Mombarg et al., 2019, 2021). This pulsation class thus has stars with quite a broad range of and radii (cf. Fig. 4). The variability in and revealed among the class members is thus mainly a signature of evolutionary status.
The regression models for vbroad and vsini-esphs reveal more evolved stars to have larger spectral line broadening, while maximal time-dependent line broadening occurs for between 6500 and 7500 K (cf. the grey triangles in the upper left panel of Fig. 9). This is precisely the temperature range where Grassitelli et al. (2015a) found a maximal effect of turbulent pressure in the stellar envelope of evolved A- and F-type dwarfs, offering an additional mechanism to excite high-order eigenmodes in such objects, aside from the classical mechanism being active in the hotter Dor stars and flux blocking at the bottom of the convective envelope causing such g modes in the cool class members (Guzik et al., 2000; Dupret et al., 2005; Xiong et al., 2016). In addition, Tkachenko et al. (2020) already showed that ignoring the turbulent pressure in stellar atmosphere models affects estimation of microturbulent broadening and results in an overestimation of the effective temperature at a few % level. Moreover, the authors found this effect to get worse as the star evolves, that is for decreasing . We thus conclude to have found observational evidence from Gaia DR3 vbroad measurements that time-dependent macroturbulent spectral line broadening in these stars is connected with their excited g modes and/or surface gravity, in addition to surface rotation. The amplitude limitation from Gaia DR3 and the comparative distributions of the dominant amplitudes and frequencies between the Gaia DR3 and bona fide Dor pulsators (cf. left panels of Figs 5 and 6) suggest that the detected dominant frequencies are due to large-scale (i.e., low-degree) gravito-inertial modes. The interplay of the dominant g mode with the rotation of the star, along with variability in and due to poor treatment of turbulent pressure in the line-forming region, explain the overall spectral line broadening estimates from Gaia DR3.
We point out that the regression model for vbroad in Table 4 explains 42% of the measured variance in the spectral line broadening, while it was 58% for the bona fide pulsators. Both these results are readily understood given that we are dealing with multiperiodic g-mode pulsators. Indeed, Dor pulsators have tens of high-order low-degree g modes active simultaneously, whichever of the three excitation mechanisms is dominant (Van Reeth et al., 2015). The line broadening captures the collective effect of all these modes together (Aerts et al., 2009). Yet, the frequencies of the excited g modes in addition to the dominant one were not included in the regression model, because the Gaia light curves currently do not provide sufficient data to unravel the multiperiodic oscillations active in these stars. While the frequencies and amplitudes of the second strongest variability signal were determined in Paper I, it was found that quite a number of those frequencies cannot be distinguished from frequencies above 3 d-1 that may result from instrumental effects. That is why we did not use these secondary frequencies from DR3. It is to be anticipated that improved regression models explaining a higher fraction of the variance in the spectral line broadening will become possible from DR4 and particularly DR5, because the longer time base and doubling of the number of epochs in the Gaia photometry will allow to unravel several additional g-mode frequencies, particularly when combined with additional light curves dedicated to asteroseismology as illustrated from combined Hipparcos and TESS or ground-based data (cf. Waelkens et al., 1998; De Cat et al., 2007; Cuypers et al., 2009). Yet, Gaia’s sampling is too sparse to deliver all the modes active in these multiperiodic g-mode pulsators, while they do contribute to the overall broadening of the spectral lines (cf. Mathias et al., 1994, for the theoretical expression of the spectral line width due to multiperiodic non-radial oscillations). The fraction of the variance explained by regression models relying on the fundamental parameters and the significant frequencies in Gaia light curves will therefore always be limited, even for the bona fide class members. In this sense, the 42% reached for the model in Table 4 is high.
| Effect | Par. | Estimate (s.e.) | -value | 95% conf. int. |
|---|---|---|---|---|
| Intercept | 198(56) | [88;308] | ||
| 37(15) | 0.0161 | [66;7] | ||
| 17(6) | 0.0047 | [5;28] | ||
| Res. var. | 599(152) | 0.0002 | [296;901] |
5.5 Results for the Gaia DR3 SPB pulsators
We now repeat the same analyses for the 3426 new Gaia DR3 SPB stars. Among these, both vbroad and vsini-esphs are recorded for 156 stars. For 34 of them there is a measurement on vbroad but not on vsini-esphs, while for 948 vsini-esphs is available but vbroad is missing. For the remaining 2288 SPB stars both of these are missing. In line with the arguments provided in Section 5.4, attention is restricted to an analysis of the completers to test relationships for vsini-esphs and vbroad.
| Effect | Par. | Estimate (s.e.) | -value | 95% conf. int. |
|---|---|---|---|---|
| Intercept | -11(5) | [20;2] | ||
| Slope | 1.06(0.05) | 0.0001 | [0.97;1.15] | |
| Res. var. | 25(30) | 0.41 | [35;84] |
The results of the test whether or not the two measures for the spectral line broadening are equal are given in Table 6 and shown graphically in Fig. 7 (cyan symbols). Just like for the Gaia DR3 Dor sample, we again have a relationship that is consistent with the hypothesis that vbroad and vsini-esphs are identical, keeping in mind the errors for vsini-esphs and the standard deviation for vbroad.
Next, the relationship between vbroad and the candidate predictors is examined relying on the 190 SPB stars having these data, once again applying backward selection to the errors-in-variables model. All covariates are again significant. The regression model in Table 7 explains 21% of the variance in vbroad. Backward selection applied to vsini-esphs for the 1104 SPB stars with this quantity reveals and to be significant predictors, with a regression model explaining 8% of the variance. For the regression coefficient of , we assign the same astrophysical interpretation as before that higher corresponds to faster surface rotation following the SPB studies by Pápics et al. (2017); Pedersen et al. (2021); Pedersen (2022a).
As for the role of the effective temperature in vbroad and vsini-esphs, Pápics et al. (2017) already found evidence that hotter SPB stars are more massive and tend to rotate faster. The dependence revealed is thus in first instance a dependence on stellar mass rather than stellar evolution as we found for the Dor stars. This result is as expected, given that SPB stars cover a factor 3 in mass, from 3 M⊙ to 9 M⊙. Pedersen et al. (2021) placed the observed properties of the 26 bona fide Kepler SPB stars included here and those studied from the ground by De Cat & Aerts (2002) into the context of stellar evolution theory. This showed large diversity of and in terms of the spectroscopic and , as well as from Gaia DR2. This diversity was interpreted as due to the range in mass and rotation rate, the latter covering from almost zero to almost critical rotation for the Kepler sample (Aerts et al., 2021; Pedersen, 2022a). Despite the limited predictive power of regression model in Table 7, it reveals that larger line broadening occurs for hotter and/or more evolved SPB stars with higher dominant g-mode frequencies (cf. Fig. 9). This highlights that hotter younger stars have faster rotation, shifting their g modes further into the gravito-inertial regime of the frequency spectrum than those of slower rotators (see Aerts et al., 2019, for a discussion of the various frequency regimes of waves connected to the dominant restoring forces).
| Effect | Par. | Estimate (s.e.) | -value | 95% conf. int. |
|---|---|---|---|---|
| Intercept | 2764(643) | [4033;1495] | ||
| 963(219) | 0.0001 | [532;1395] | ||
| 213(51) | 0.0001 | [312;113] | ||
| 109(42) | 0.0105 | [192;26] | ||
| 34(8) | 0.0001 | [19;50] | ||
| 1492(715) | 0.0384 | [2903;81] | ||
| Res. var. | 1909(300) | 0.0001 | [1317;2501] |
| Effect | Par. | Estimate (s.e.) | -value | 95% conf. int. |
|---|---|---|---|---|
| Intercept | 573(319) | [1204;58] | ||
| 157(80) | 0.0496 | [0;315] | ||
| 20(6) | 0.0016 | [8;32] | ||
| Res. var. | 745(154) | 0.0001 | [442;1049] |
The luminosity, , now also has a significant contribution as predictor for vbroad with a value of 0.0105. The model reveals that less luminous SPB stars have higher line broadening but its regression coefficient is not very accurate. Moreover, the sample of SPB stars with a measurement of vbroad is an order of magnitude smaller than for the Dor stars and is skewed towards low-mass class members, limiting this interpretation to only a small part of the SPB instability region. This is graphically illustrated in Fig. 9, where trends reveal that more evolved and more luminous SPB stars have higher vbroad but are not well enough represented in membership to have an equally important effect on the regression model than the cool class members. Moreover, the luminosity panel in Fig. 9 reveals more of a quadratic than linear trend for the SPB stars. As already highlighted above and unlike for the Dor stars, the luminosity of SPB pulsators is mostly determined by their mass rather than by their evolutionary stage as for the Dor stars. This, along with the relatively large scatter for and for the effective temperature, as well as the lower fraction of the variance explained by the linear regression model for vbroad, makes the distillation of a simple astrophysical interpretation for vbroad more difficult for SPB stars. This conclusion is by itself fully in line with the diversity in pulsational behaviour occurring in the Kepler sample of bona fide SPB pulsators (Pedersen et al., 2021; Pedersen, 2022b).
Finally, we stress that time-dependent macroturbulent spectral line broadening due to the g modes of SPB pulsators has already been found in several of the brightest class members (Aerts et al., 2014b), with values in agreement with those we find here for the new faint Gaia DR3 class members. Moreover, the density of modes excited by the mechanism peaks in the lower part of the instability strip, near 13 000 K (Pápics et al., 2017). These pulsators have a mass regime where the interpretation of turbulent pressure exciting extra high-order g modes in addition to the classical mechanism does not hold (Grassitelli et al., 2015b). Macroturbulence in these pulsators has already been established as a time-independent downgraded quantity representing their dominant tangential pulsational velocity by Aerts et al. (2009) and Aerts et al. (2014a).
6 Discussion and conclusions
Thanks to the homogeneous treatment of its multitude of observations and its large scale survey capacity, the Gaia mission has its role to play for gravito-inertial asteroseismology. First of all, its photometric light curves allow to discover thousands of new g-mode pulsators belonging to the classes of the F-type Dor stars or SPB-type stars. Secondly, its broadening parameter vbroad contains astrophysical information on stellar oscillations having mmag-level observed amplitudes. We found those results after reassigning a fraction of 22% of the Dor candidates as SPB pulsators according to their effective temperature being above 8500 K, a property not taken into account in the variability classifications used in Paper I.
We find the two samples of new Gaia DR3 g-mode pulsators to have similar fundamental parameters than those of bona fide class members, although the Gaia SPB pulsators only cover the cooler and less massive class members. We studied the astrophysical properties of the new Dor and SPB pulsators from regression models built upon the principle of errors-in-variables, with their fundamental parameters and dominant oscillation properties as predictors of the overall spectral line broadening. The Gaia DR3 quantity vsini-esphs offers a good estimate of the overall time-independent spectral line broadening, reflecting that the surface rotation of the stars in our samples is the dominant line broadening mechanism. All regression models revealed the dominant g-mode frequency to be a significant predictor of the Gaia DR3 vbroad parameter and its standard deviation, which together represent the overall time-dependent spectral line broadening.
We explicitly checked via re-analyses of all regression models that none of the astrophysical interpretations change if we use the effective temperature of 9500 K as treshold for the reclassifications among the Dor and SPB candidates. Such a treshold temperature follows from instability computations by Szewczuk & Daszyńska-Daszkiewicz (2017) for the cool border of galactic rotating SPB stars instead of the adopted 8500 K based on the hot border for the Dor instability strip by Xiong et al. (2016). We find from the upper left panel of Fig. 9 that Gaia DR3 shows 9500 K to be a less natural and more abrupt treshold temperature between the two classes than the adopted 8500 K. Nevertheless, using 9500 K still gives compliance of class populations with the IMF and almost all the coefficients obtained for the regression models remain within the uncertainty ranges listed in the tables we provided here using 8500 K as treshold.
Despite the limiting resolution of the RVS spectroscopy, the line broadening of rotating g-mode pulsators offered by Gaia is in full agreement with results of well-known class members observed with high-precision space photometry and high-resolution spectroscopy. In particular, we find the dominant g-mode frequency to be a significant predictor of the overall line broadening. This supports earlier findings that macroturbulence is merely a simplified time-independent approximation for the true velocity fields at the stellar surface that cause line-profile variability for g-mode pulsators (Aerts et al., 2014b). We conclude that the combined effect of surface rotation and tangential velocities resulting from multiperiodic g modes can be estimated from vbroad for the case of main-sequence stars of intermediate mass. The regression models for vbroad are fully in line with various excitation predictions for g modes in Dor and SPB pulsators.
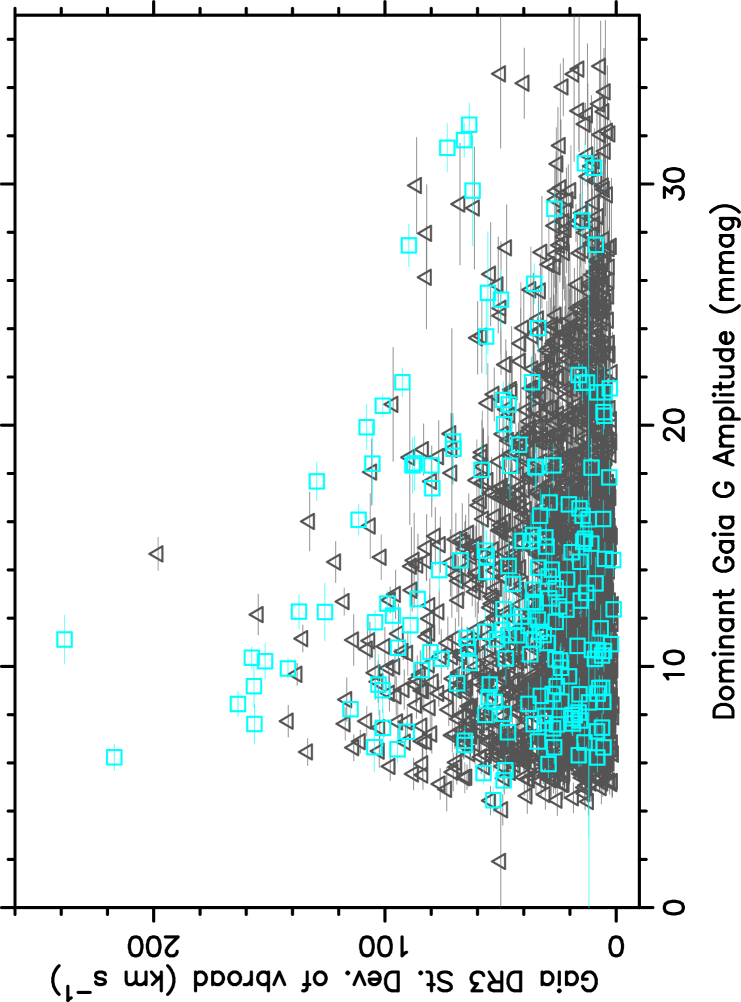
Given that the regression models based on the fundamental parameters and on the dominant pulsation mode presented in Sect. 5 explain part of the variability of vbroad, it is sensible to also consider the standard deviation of vbroad as measured quantity and to check if its variance can be predicted by any of the covariates. Indeed, aside from being caused by noise, it may partially represent the time-dependence of the line broadening. From our regression analyses (presented in Appendix B) we conclude that the noise contribution to the standard deviation of vbroad is dominant over intrinsic line-profile variability for the Dor pulsators. For the SPB stars, the standard deviation of vbroad does relate to their surface rotation, effective temperature, and g-mode frequency at the level of 20% variance reduction for the regression model based on these three covariates.
Finally, we conclude that our analyses of new Gaia DR3 g-mode pulsators bring the qualitative results on vbroad by Frémat et al. (2022) in full agreement with our quantitative assessments on macroturbulence in g-mode pulsators, as already suggested by the simulation study in Aerts et al. (2009).
Acknowledgements.
The research leading to these results has received funding from the KU Leuven Research Council (grant C16/18/005: PARADISE). CA and JDR acknowledge support from the BELgian federal Science Policy Office (BELSPO) through a PRODEX grant for the ESA space mission Gaia. CA acknowleges financial support from the Research Foundation Flanders under grant K802922N (Sabbatical leave). CA and GM are grateful for the kind hospitality offered by the staff of the Center for Computational Astrophysics at the Flatiron Institute of the Simons Foundation in New York City during their work visit in the fall of 2022. The authors thank the referee for the suggestion to investigate the sensitivity of the results to the temperature treshold used to reclassify the g-mode pulsators. They also acknowledge Dominic Bowman and Andrew Tkachenko for valuable comments which helped to improve the manuscript.References
- Aerts (2021) Aerts, C. 2021, Reviews of Modern Physics, 93, 015001
- Aerts et al. (2021) Aerts, C., Augustson, K., Mathis, S., et al. 2021, A&A, 656, A121
- Aerts et al. (2010) Aerts, C., Christensen-Dalsgaard, J., & Kurtz, D. W. 2010, Asteroseismology, Springer-Verlag Heidelberg
- Aerts et al. (2004) Aerts, C., Cuypers, J., De Cat, P., et al. 2004, A&A, 415, 1079
- Aerts & De Cat (2003) Aerts, C. & De Cat, P. 2003, Space Sci. Rev., 105, 453
- Aerts et al. (1999) Aerts, C., De Cat, P., Peeters, E., et al. 1999, A&A, 343, 872
- Aerts et al. (1992) Aerts, C., De Pauw, M., & Waelkens, C. 1992, A&A, 266, 294
- Aerts et al. (2019) Aerts, C., Mathis, S., & Rogers, T. M. 2019, ARA&A, 57, 35
- Aerts et al. (2014a) Aerts, C., Molenberghs, G., Kenward, M. G., & Neiner, C. 2014a, ApJ, 781, 88
- Aerts et al. (2018) Aerts, C., Molenberghs, G., Michielsen, M., et al. 2018, ApJS, 237, 15
- Aerts et al. (2009) Aerts, C., Puls, J., Godart, M., & Dupret, M. A. 2009, A&A, 508, 409
- Aerts & Rogers (2015) Aerts, C. & Rogers, T. M. 2015, ApJ, 806, L33
- Aerts et al. (2014b) Aerts, C., Simón-Díaz, S., Groot, P. J., & Degroote, P. 2014b, A&A, 569, A118
- Antoci et al. (2019) Antoci, V., Cunha, M. S., Bowman, D. M., et al. 2019, MNRAS, 490, 4040
- Bailer-Jones et al. (2018) Bailer-Jones, C. A. L., Rybizki, J., Fouesneau, M., Mantelet, G., & Andrae, R. 2018, AJ, 156, 58
- Balona (1986) Balona, L. A. 1986, MNRAS, 219, 111
- Balona & Ozuyar (2020) Balona, L. A. & Ozuyar, D. 2020, MNRAS, 493, 5871
- Baluev (2008) Baluev, R. V. 2008, MNRAS, 385, 1279
- Borucki et al. (2010) Borucki, W. J., Koch, D., Basri, G., et al. 2010, Science, 327, 977
- Bowman et al. (2019) Bowman, D. M., Aerts, C., Johnston, C., et al. 2019, A&A, 621, A135
- Bowman et al. (2020) Bowman, D. M., Burssens, S., Simón-Díaz, S., et al. 2020, A&A, 640, A36
- Briquet & Aerts (2003) Briquet, M. & Aerts, C. 2003, A&A, 398, 687
- Briquet et al. (2003) Briquet, M., Aerts, C., Mathias, P., Scuflaire, R., & Noels, A. 2003, A&A, 401, 281
- Burssens et al. (2020) Burssens, S., Simón-Díaz, S., Bowman, D. M., et al. 2020, A&A, 639, A81
- Claveria et al. (2019) Claveria, R. M., Mendez, R. A., Silva, J. F., & Orchard, M. E. 2019, PASP, 131, 084502
- Clementini et al. (2022) Clementini, G., Ripepi, V., Garofalo, A., et al. 2022, A&A, in press, arXiv:2206.06278
- Creevey et al. (2022) Creevey, O. L., Sordo, R., Pailler, F., et al. 2022, A&A, in press, arXiv:2206.05864
- Cuypers et al. (2009) Cuypers, J., Aerts, C., De Cat, P., et al. 2009, A&A, 499, 967
- Daszyńska-Daszkiewicz et al. (2017) Daszyńska-Daszkiewicz, J., Pamyatnykh, A. A., Walczak, P., et al. 2017, MNRAS, 466, 2284
- De Cat & Aerts (2002) De Cat, P. & Aerts, C. 2002, A&A, 393, 965
- De Cat et al. (2000) De Cat, P., Aerts, C., De Ridder, J., et al. 2000, A&A, 355, 1015
- De Cat et al. (2007) De Cat, P., Briquet, M., Aerts, C., et al. 2007, A&A, 463, 243
- De Cat et al. (2005) De Cat, P., Briquet, M., Daszyńska-Daszkiewicz, J., et al. 2005, A&A, 432, 1013
- De Cat et al. (2006) De Cat, P., Eyer, L., Cuypers, J., et al. 2006, A&A, 449, 281
- De Pauw et al. (1993) De Pauw, M., Aerts, C., & Waelkens, C. 1993, A&A, 280, 493
- De Ridder et al. (2016) De Ridder, J., Molenberghs, G., Eyer, L., & Aerts, C. 2016, A&A, 595, L3
- Dupret et al. (2005) Dupret, M. A., Grigahcène, A., Garrido, R., Gabriel, M., & Scuflaire, R. 2005, A&A, 435, 927
- Edelmann et al. (2019) Edelmann, P. V. F., Ratnasingam, R. P., Pedersen, M. G., et al. 2019, ApJ, 876, 4
- Eyer et al. (2022) Eyer, L., Audard, M., Holl, B., et al. 2022, A&A, in press, arXiv:2206.06416
- Eyer & Mowlavi (2008) Eyer, L. & Mowlavi, N. 2008, in Journal of Physics Conference Series, Vol. 118, Journal of Physics Conference Series, 012010
- Frémat et al. (2022) Frémat, Y., Royer, F., Marchal, O., & Blomme, R. e. a. 2022, A&A, in press, arXiv:2206.10986
- Gaia Collaboration et al. (2016a) Gaia Collaboration, Brown, A. G. A., Vallenari, A., Prusti, T., & de Bruijne, J. H. J. e. a. 2016a, A&A, 595, A2
- Gaia Collaboration et al. (2021) Gaia Collaboration, Brown, A. G. A., Vallenari, A., & Prusti, T. e. a. 2021, A&A, 649, A1
- Gaia Collaboration et al. (2022a) Gaia Collaboration, De Ridder, J., Ripepi, V., & Aerts, C. a. 2022a, A&A, in press (Paper I), arXiv:2206.06075
- Gaia Collaboration et al. (2019) Gaia Collaboration, Eyer, L., Rimoldini, L., & Audard, M. e. a. 2019, A&A, 623, A110
- Gaia Collaboration et al. (2016b) Gaia Collaboration, Prusti, T., de Bruijne, J. H. J., Brown, A. G. A., & Vallenari, A. e. a. 2016b, A&A, 595, A1
- Gaia Collaboration et al. (2022b) Gaia Collaboration, Vallenari, A., Brown, A. G. A., Prusti, T., & de Bruijne, J. H. J. e. a. 2022b, A&A, in press, arXiv:2208.00211
- Gebruers et al. (2021) Gebruers, S., Straumit, I., Tkachenko, A., et al. 2021, A&A, in press, arXiv:2104.04521
- Gilliland et al. (2010) Gilliland, R. L., Brown, T. M., Christensen-Dalsgaard, J., et al. 2010, PASP, 122, 131
- Grassitelli et al. (2015a) Grassitelli, L., Fossati, L., Langer, N., et al. 2015a, A&A, 584, L2
- Grassitelli et al. (2015b) Grassitelli, L., Fossati, L., Simón-Diáz, S., et al. 2015b, ApJ, 808, L31
- Guzik et al. (2000) Guzik, J. A., Kaye, A. B., Bradley, P. A., Cox, A. N., & Neuforge, C. 2000, ApJ, 542, L57
- Handler (1999) Handler, G. 1999, MNRAS, 309, L19
- Holl et al. (2018) Holl, B., Audard, M., Nienartowicz, K., Jevardat de Fombelle, G., & Marchal, O. e. a. 2018, A&A, 618, A30
- Horst et al. (2020) Horst, L., Edelmann, P. V. F., Andrássy, R., et al. 2020, A&A, 641, A18
- Katz et al. (2022) Katz, D., Sartoretti, P., Guerrier, A., et al. 2022, arXiv e-prints, arXiv:2206.05902
- Kaye et al. (1999) Kaye, A. B., Handler, G., Krisciunas, K., Poretti, E., & Zerbi, F. M. 1999, PASP, 111, 840
- Keen et al. (2015) Keen, M. A., Bedding, T. R., Murphy, S. J., et al. 2015, MNRAS, 454, 1792
- Kurtz et al. (2014) Kurtz, D. W., Saio, H., Takata, M., et al. 2014, MNRAS, 444, 102
- Lebzelter et al. (2022) Lebzelter, T., Mowlavi, N., Lecoeur-Taibi, I., et al. 2022, A&A, in press, arXiv:2206.05745
- Li et al. (2019) Li, G., Bedding, T. R., Murphy, S. J., et al. 2019, MNRAS, 482, 1757
- Li et al. (2020) Li, G., Van Reeth, T., Bedding, T. R., et al. 2020, MNRAS, 491, 3586
- Marton et al. (2022) Marton, G., Ábrahám, P., Rimoldini, L., et al. 2022, A&A, in press, arXiv:2206.05796
- Mathias et al. (2001) Mathias, P., Aerts, C., Briquet, M., et al. 2001, A&A, 379, 905
- Mathias et al. (1994) Mathias, P., Aerts, C., De Pauw, M., Gillet, D., & Waelkens, C. 1994, A&A, 283, 813
- Mathias et al. (2004) Mathias, P., Le Contel, J. M., Chapellier, E., et al. 2004, A&A, 417, 189
- Molenberghs & Kenward (2007) Molenberghs, G. & Kenward, M. 2007, Missing Data in Clinical Studies, New York: John Wiley
- Mombarg et al. (2021) Mombarg, J. S. G., Van Reeth, T., & Aerts, C. 2021, A&A, 650, A58
- Mombarg et al. (2019) Mombarg, J. S. G., Van Reeth, T., Pedersen, M. G., et al. 2019, MNRAS, 485, 3248
- Moravveji (2016) Moravveji, E. 2016, MNRAS, 455, L67
- Moravveji et al. (2016) Moravveji, E., Townsend, R. H. D., Aerts, C., & Mathis, S. 2016, ApJ, 823, 130
- Murphy et al. (2016) Murphy, S. J., Fossati, L., Bedding, T. R., et al. 2016, MNRAS, 459, 1201
- Pápics et al. (2017) Pápics, P. I., Tkachenko, A., Van Reeth, T., et al. 2017, A&A, 598, A74
- Pedersen (2022a) Pedersen, M. G. 2022a, ApJ, in press, arXiv:2208.14497
- Pedersen (2022b) Pedersen, M. G. 2022b, ApJ, 930, 94
- Pedersen et al. (2021) Pedersen, M. G., Aerts, C., Pápics, P. I., et al. 2021, Nature Astronomy, 5, 715
- Pedersen et al. (2019) Pedersen, M. G., Chowdhury, S., Johnston, C., et al. 2019, ApJ, 872, L9
- Raskin et al. (2011) Raskin, G., van Winckel, H., Hensberge, H., et al. 2011, A&A, 526, A69
- Rimoldini et al. (2022) Rimoldini, L., Holl, B., Gavras, P., et al. 2022, A&A, in press, arXiv:2211.17238
- Ripepi et al. (2022) Ripepi, V., Clementini, G., Molinaro, R., et al. 2022, A&A, in press, arXiv:2206.06212
- Rogers et al. (2013) Rogers, T. M., Lin, D. N. C., McElwaine, J. N., & Lau, H. H. B. 2013, ApJ, 772, 21
- Saio et al. (2018) Saio, H., Kurtz, D. W., Murphy, S. J., Antoci, V. L., & Lee, U. 2018, MNRAS, 474, 2774
- Saio et al. (2015) Saio, H., Kurtz, D. W., Takata, M., et al. 2015, MNRAS, 447, 3264
- Salpeter (1955) Salpeter, E. E. 1955, ApJ, 121, 161
- Sartoretti et al. (2022) Sartoretti, P., Blomme, R., David, M., & Seabroke, G. 2022, Gaia DR3 documentation Chapter 6: Spectroscopy, Gaia DR3 documentation, European Space Agency; Gaia Data Processing and Analysis Consortium.
- SAS Institute Inc. (2014) SAS Institute Inc. 2014, SAS OnlineDoc 9.4, Cary, NC: SAS Institute Inc.
- Sekaran et al. (2021) Sekaran, S., Tkachenko, A., Johnston, C., & Aerts, C. 2021, A&A, 648, A91
- Serebriakova et al. (2023) Serebriakova, N., Tkachenko, A., Gebruers, S., et al. 2023, A&A, submitted
- Simón-Díaz et al. (2017) Simón-Díaz, S., Godart, M., Castro, N., et al. 2017, A&A, 597, A22
- Simón-Díaz & Herrero (2014) Simón-Díaz, S. & Herrero, A. 2014, A&A, 562, A135
- Simón-Díaz et al. (2010) Simón-Díaz, S., Herrero, A., Uytterhoeven, K., et al. 2010, ApJ, 720, L174
- Szewczuk & Daszyńska-Daszkiewicz (2017) Szewczuk, W. & Daszyńska-Daszkiewicz, J. 2017, MNRAS, 469, 13
- Tkachenko et al. (2013) Tkachenko, A., Aerts, C., Yakushechkin, A., et al. 2013, A&A, 556, A52
- Tkachenko et al. (2020) Tkachenko, A., Pavlovski, K., Johnston, C., et al. 2020, A&A, 637, A60
- Triana et al. (2015) Triana, S. A., Moravveji, E., Pápics, P. I., et al. 2015, ApJ, 810, 16
- Uytterhoeven et al. (2011) Uytterhoeven, K., Moya, A., Grigahcène, A., et al. 2011, A&A, 534, A125
- Van Reeth et al. (2018) Van Reeth, T., Mombarg, J. S. G., Mathis, S., et al. 2018, A&A, 618, A24
- Van Reeth et al. (2016) Van Reeth, T., Tkachenko, A., & Aerts, C. 2016, A&A, 593, A120
- Van Reeth et al. (2015) Van Reeth, T., Tkachenko, A., Aerts, C., et al. 2015, ApJS, 218, 27
- Waelkens (1991) Waelkens, C. 1991, A&A, 246, 453
- Waelkens et al. (1998) Waelkens, C., Aerts, C., Kestens, E., Grenon, M., & Eyer, L. 1998, A&A, 330, 215
- Xiong et al. (2016) Xiong, D. R., Deng, L., Zhang, C., & Wang, K. 2016, MNRAS, 457, 3163
- Zwintz et al. (2017) Zwintz, K., Van Reeth, T., Tkachenko, A., et al. 2017, A&A, 608, A103
Appendix A Plots of the predictors for vsini-esphs
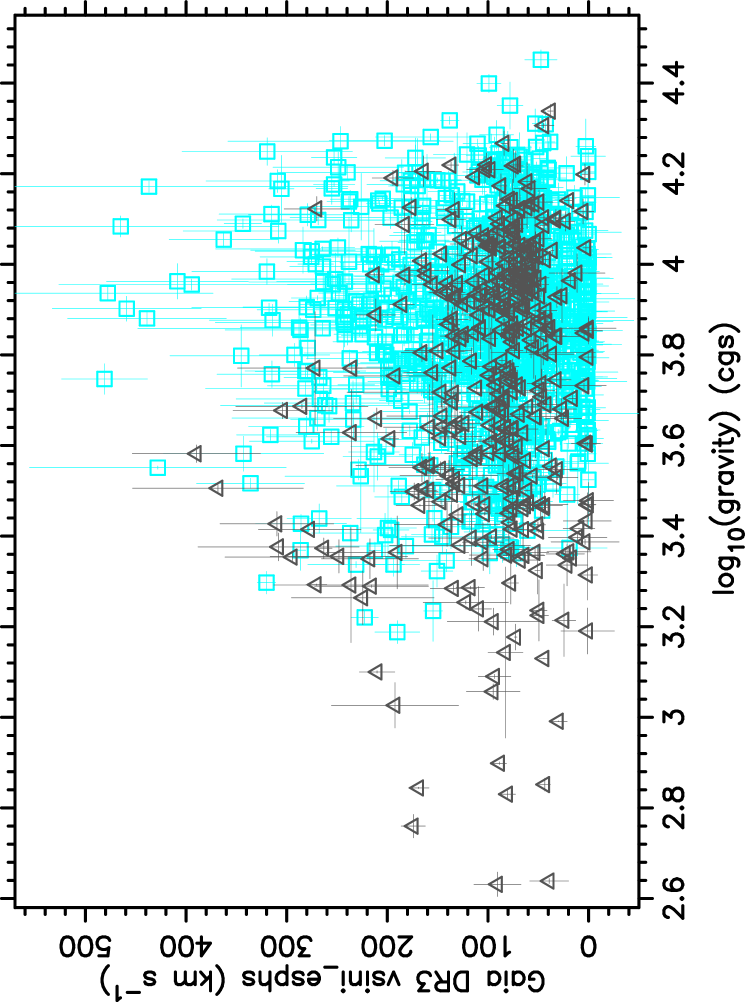
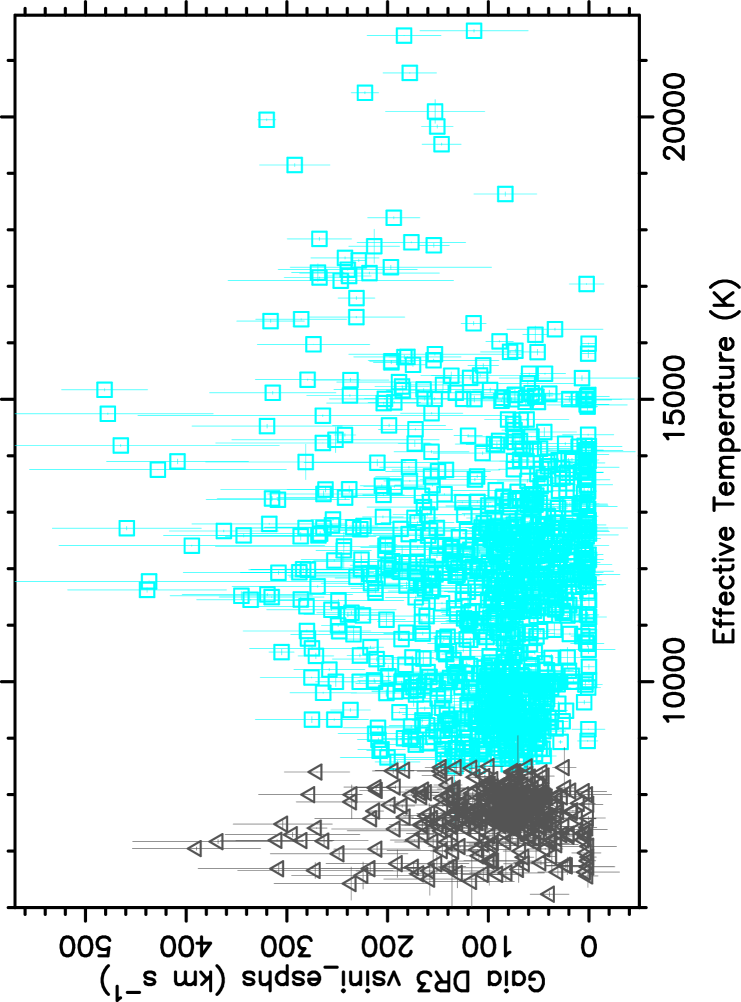
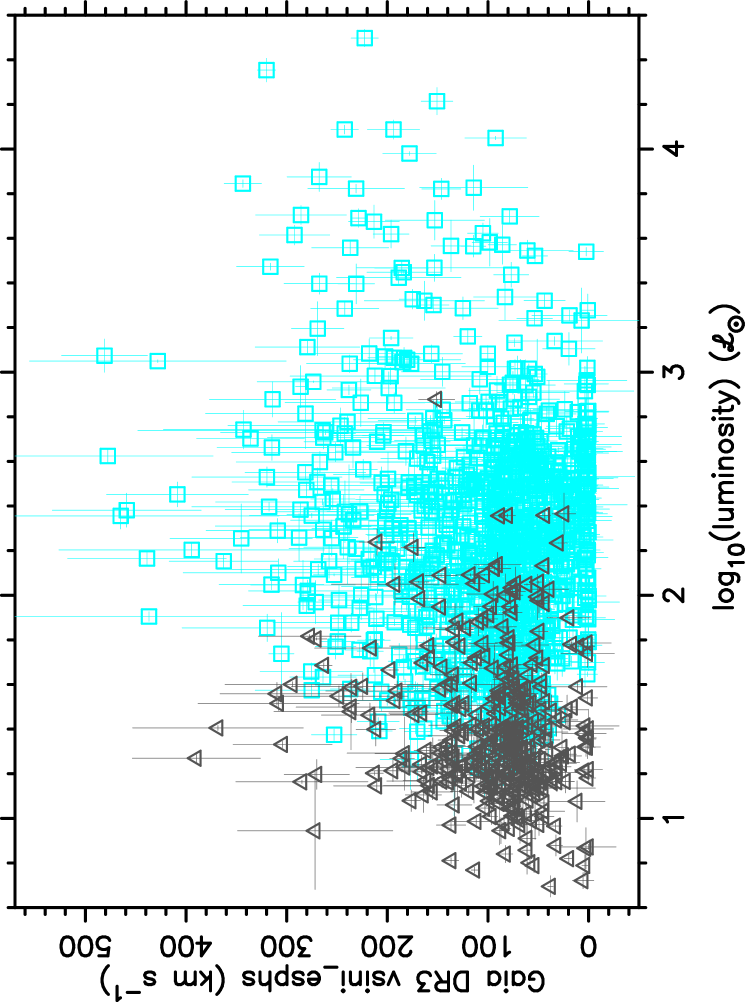
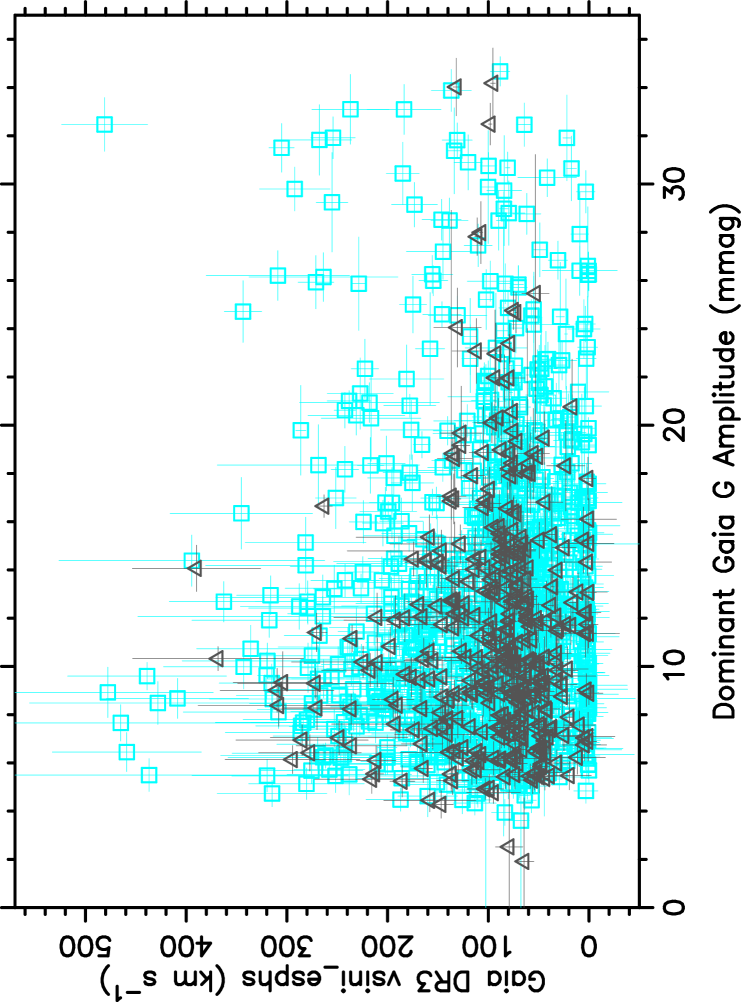
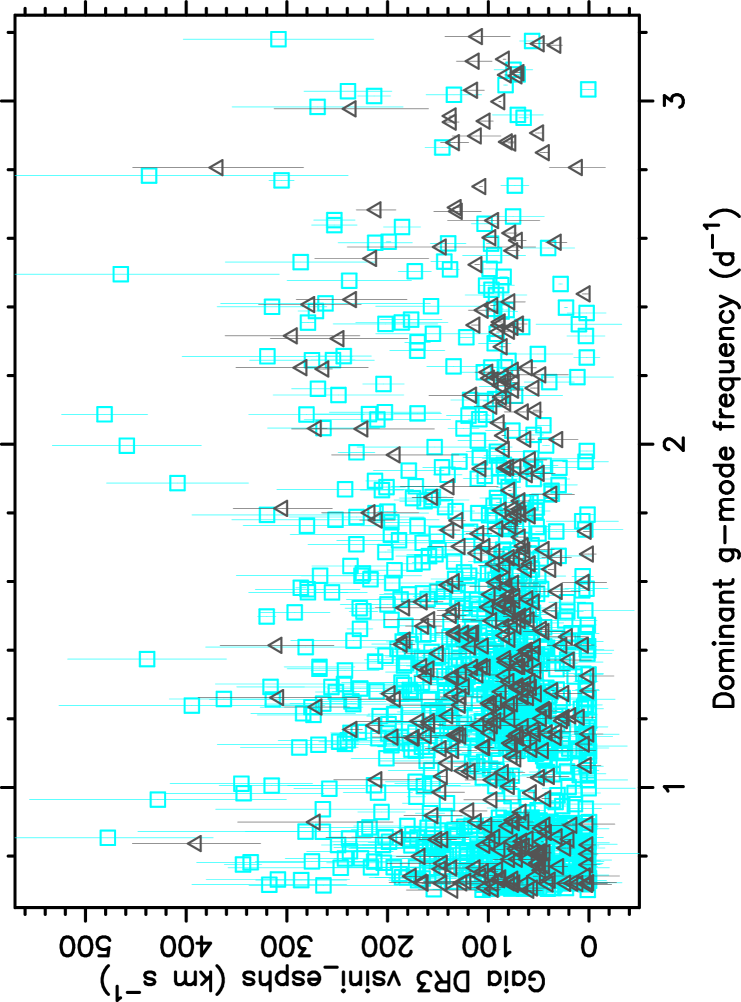
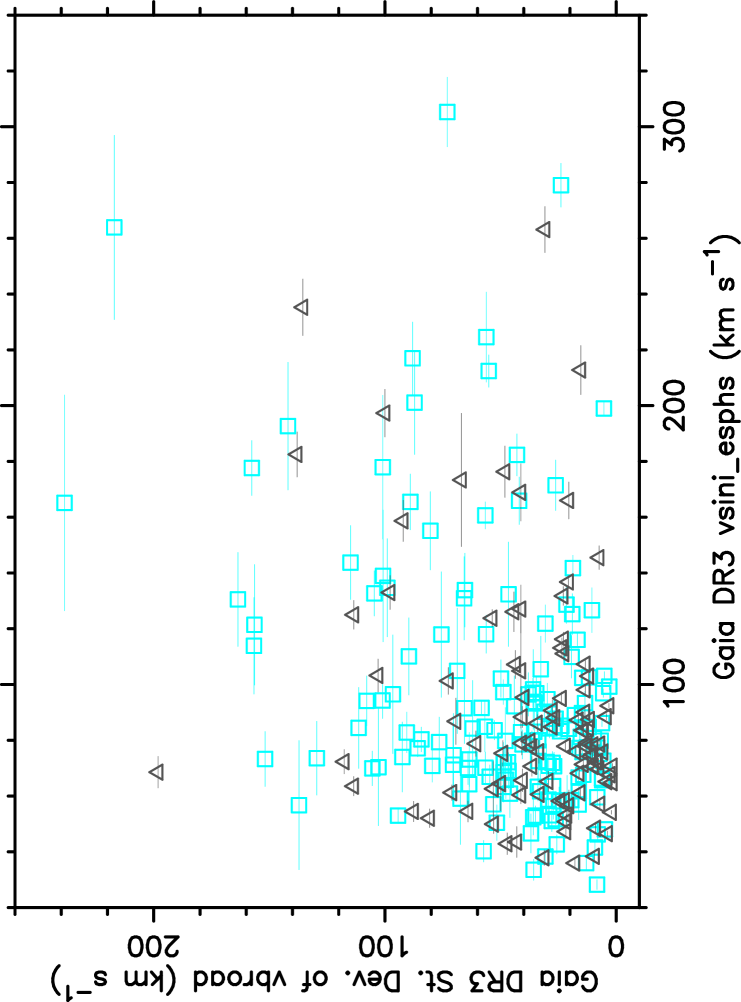
Appendix B Regression models for the standard deviation of vbroad
The quantity vbroad can be considered a simplified estimate of the time-dependent second moment of a line profile (Aerts et al. 1992; De Pauw et al. 1993; Mathias et al. 1994; Briquet & Aerts 2003). It is therefore meaningful to investigate if the standard deviation of vbroad contains information on the time-dependent line-profile variability of the Gaia DR3 g-mode pulsators.
In order to compute backward selection regression models for this quantity, we now add vsini-esphs as sixth covariate (with as notation for its regression coefficient). In line with Simón-Díaz & Herrero (2014) and Aerts et al. (2014b), Serebriakova et al. (2023) have found from simulations that the projected rotational velocity should first be derived from high-resolution spectra before any meaningful derivation of left-over additional time-dependent spectral line broadening caused by tangential velocity fields can be done. This is in agreement with the methodology used by Aerts et al. (2014b) to assess the quality of estimates for time-dependent macroturbulent broadening from the line’s moment variations in well-known B-type pulsators.
| Effect | Par. | Estimate (s.e.) | -value | 95% conf. int. |
|---|---|---|---|---|
| With vsini-esphs — | ||||
| Intercept | 459(146) | [750;169] | ||
| 93(29) | 0.0019 | [35;151] | ||
| 85(27) | 0.0019 | [32;138] | ||
| vsini-esphs | 0.26(0.08) | 0.0018 | [0.10;0.42] | |
| Res. var. | 1122(166) | 0.0001 | [793;1452] | |
| Without vsini-esphs — | ||||
| Intercept | 517(135) | [781;253] | ||
| 136(35) | 0.0001 | [66;205] | ||
| 11(3) | 0.0001 | [6;16] | ||
| 8(1) | 0.0001 | [6;10] | ||
| 200(88) | 0.0234 | [374;27] | ||
| Res. var. | 497(17) | 0.0001 | [464;529] | |
| Effect | Par. | Estimate (s.e.) | -value | 95% conf. int. |
|---|---|---|---|---|
| With vsini-esphs — | ||||
| Intercept | 515(246) | [1001;30] | ||
| 138(61) | 0.0256 | [17;258] | ||
| 17(6) | 0.0031 | [28;6] | ||
| vsini-esphs | 0.39(0.06) | 0.0001 | [0.26;0.52] | |
| Res. var. | 1324(156) | 0.0001 | [1016;1631] | |
| Without vsini-esphs — | ||||
| Intercept | 515(237) | [382;48] | ||
| 140(59) | 0.0185 | [24;256] | ||
| Res. var. | 1641(169) | 0.0001 | [1308;1974] | |
Table 9 displays the regression models for the standard deviation of vbroad for the sample of 1775 Gaia DR3 Dor stars. We perform the backward selection twice, once with the covariate vsini-esphs and once without it. For the model including it as a potential predictor, we remove the insignificant contributions of the variables , , and (in that order). Not suprisingly, vsini-esphs is a significant predictor for the standard deviation of vbroad, along with the gravity and luminosity of the star. For the regression model without vsini-esphs, only is removed and the predictive power decreases from 9% to 6% of the original variance.
The combined results in Tables 3, 4, and 9 reveal that rotational broadening of Dor stars dominates the measurement of vbroad, while the evolutionary status (by means of the gravity and/or effective temperature) lies at the basis of the significant predictors of vbroad. Regression models for the standard deviation have low predictive power and are thus harder to interpret, in line with the caveats due to the systematic uncertainties connected with the treatments of microturbulent broadening, , and highlighted by Tkachenko et al. (2020).
As for the SPB pulsators, Table 10 displays the regression models for the standard deviation of vbroad from backward selection for the 190 SPB stars with such measurements. For the model with the covariate vsini-esphs included as a potential predictor, the order of variables to be removed was , , and . The model explains 20% of the variance in the standard deviation of vbroad and has vsini-esphs, , and as significant predictors. For the model without vsini-esphs as a potential predictor, all covariates aside from were removed as insignificant and the predictive power disappears. Thus, we find that the standard deviation of the vbroad measurements of SPB stars is affected by their surface rotation and is connected to their effective temperature and dominant g-mode frequency.
The regression models for the standard deviation of vbroad have low (SPB stars) to almost no (Dor stars) predictive power. This is not surprising as this standard deviation is, at best, just one single value capturing the complicated overall time-dependent broadening determined from only a few scans across Gaia’s field of view. Our findings suggest that the noise contribution to the standard deviation of vbroad dominates over the one due to the astrophysical parameters for the Dor stars.