Target Centric De Novo Design of Drug Candidate Molecules with Graph Transformer-based Generative Deep Adversarial Networks
Abstract
Discovering novel drug candidate molecules is one of the most fundamental and critical steps in drug development. Generative deep learning models, which create synthetic data given a probability distribution, have been developed with the purpose of picking completely new samples from a partially known space. Generative models offer high potential for designing de novo molecules; however, in order for them to be useful in real-life drug development pipelines, these models should be able to design target-specific molecules, which is the next step in this field. In this study, we propose a novel generative system, DrugGEN, for the de novo design of drug candidate molecules that interact with selected target proteins. The proposed system represents compounds and protein structures as graphs and processes them via serially connected two generative adversarial networks comprising graph transformers. DrugGEN is implemented with five independent models, each with a unique sample generation routine. The system is trained using a large dataset of compounds from ChEMBL and target-specific bioactive molecules, to design effective and specific inhibitory molecules against the AKT1 protein, which has critical importance for developing treatments against various types of cancer. On fundamental benchmarks, DrugGEN models have either competitive or better performance against other methods. To assess the target-specific generation performance, we conducted further in silico analysis with molecular docking and deep learning-based bioactivity prediction. Results indicate that de novo molecules have high potential for interacting with the AKT1 protein structure in the level of its native ligand. DrugGEN can be used to design completely novel and effective target-specific drug candidate molecules for any druggable protein, given target features and a dataset of experimental bioactivities. Code base, datasets, results and trained models of DrugGEN are available at https://github.com/HUBioDataLab/DrugGEN.
1 Introduction
The development of a new drug is a long-term and costly process. It entails the identification of bioactive compounds against predefined biomolecular targets as one of its initial and most important steps. With the advancements in high-throughput screening technology, simultaneous screening of tens of thousands of compounds is quite achievable. However, it is still not possible to analyze the entirety of the chemical and biomolecular spaces due to their huge sizes [1], which usually prevents the discovery of the best candidate molecules. The majority of the identified “non-ideal” drug candidates fail in later stages of the development process, such as clinical trials, due to high toxicity or low efficacy, which is the primary reason for the low success rates lately observed in drug development [2].
The structural diversity of small-molecule drugs discovered so far is relatively low. Consequently, they can only target biomolecules within a limited structural framework [3]. This is also partly valid for bioactive molecule datasets presented in open-access repositories such as ChEMBL [4] and PubChem [5]. Thus, there is a need for truly novel, i.e. structurally diverse, small molecule drug candidates to target understudied proteins in the human proteome, including their clinically significant variants [6]. Within the enormous theoretical space of possible small molecules, the size of which is estimated to be around , molecules that can effectively and specifically target each druggable biomolecule may exist [7]. The main challenge here is identifying the correct molecular structures within this unexplored space. For this, an approach called "de novo drug design" is used, the purpose of which is to design new candidate molecules without using a starting structural template, especially to target biomolecules that could not be effectively targeted by the currently available structures [8].
To address problems associated with conventional drug design, such as long development durations, high costs, and a high number of unknown variables regarding the efficacy and safety of the designed compounds, AI-driven methods, e.g., deep generative modeling, are starting to penetrate the field of drug design. One of the first generative modeling architectures to be used in de novo molecule design was variational autoencoders (VAE) [9]. In a VAE-based molecule generation method developed by Gomez-Bombarelli et al., the encoding network transforms the discrete SMILES expressions of molecules into real-valued continuous vectors, while the decoder reconstructs SMILES from this continuous space. The predictive network added to the system guides the decoder by predicting properties such as drug-likeness and synthetic accessibility of the representations in the latent space [10]. Another generative modeling architecture called Generative Adversarial Networks - GAN [11], which was originally developed for image analysis, has been employed to design de novo molecules. GANs are trained via a battle between generator and discriminator networks in a zero-sum-game, where each agent tries to beat the other one by performing better at each move. The model called MolGAN uses a multilayer perceptron-based generator and graph convolutional discriminator to handle the molecule generation process [12]. This method was one of the first studies to implement GANs for de novo drug design. With the aim of rendering the generation process more efficient, a following study set the training objective as predicting the masked node and edge labels on molecular graphs, which enhanced the generation of novel molecules [13].
Deep generative models have also been used to design molecules with desired properties. This has mostly been achieved by conditioning the model training and/or the prediction procedure(s). Most of the models developed so far have utilized condition vectors as a tool for property injection into the generative process. In many cases, this was done to condition the generated molecules to have drug-like properties. VAEs [14, 15, 16], GANs [17, 12, 18] and sequence based (language) models [19, 20, 21, 22] have been used for molecule generation tasks, in this regard. Reinforcement learning (RL) has also been used for this purpose, with reward-penalty functions guiding models towards desired molecular characteristics in the respective latent space. [20, 23, 24]. This approach results in optimized molecule production; however, obtaining drug-like de novo molecules is not sufficient to yield desired activities against biomolecular targets. One of the fundamental objectives in drug design is to come up with small molecules that will selectively interact with the desired target. Although there are a few recent studies that present prototype models [25, 26, 27, 28, 29, 30, 31, 32], AI-driven target-specific drug design is a highly novel and under-studied field with a great potential to contribute to rational drug design. Incorporating protein features into the process of molecule generation is the most sensible way of designing targeted molecules, which is the approach adopted in conventional structure-based drug design. However, achieving this task in AI-driven de novo design is difficult, mainly due to the extremely high complexity of the interactions between small molecules and target proteins.
In this study, we propose DrugGEN, a new de novo drug design system, an end-to-end framework, that generates target-specific small molecules using GANs, transformers [33] and graph representation learning [34]. DrugGEN is composed of two serially connected GANs, in which graph transformer encoder and decoder modules learn the representation of both small molecule ligands and target proteins, and generate novel structures for the given target, in the format of molecular graphs. The first GAN module of DrugGEN (GAN1) aims to learn the distributions of fundamental properties (e.g., physicochemical and topological properties) of real molecules from the given data to generate new drug-like small molecules that are valid and stable. The generator network of the second GAN (GAN2-generator) takes the de novo molecules generated by GAN1 and processes them together with protein feature graphs. The output of GAN2-generator are compared with the known (real) bioactive ligands (inhibitors) of the selected target protein in GAN2-discriminator, to learn the structural distribution of those real inhibitors. This approach is essential for transforming de novo generated molecules into ligands that interact with the selected target. Different variations of the DrugGEN model were constructed and evaluated, in terms of both the generation efficiency and the properties of the output molecules. With the aim of evaluating DrugGEN in a use-case, we generated de novo inhibitors for the AKT1 protein, which is critically important to develop effective treatments against certain types of cancer [35].
2 Methods
2.1 Data
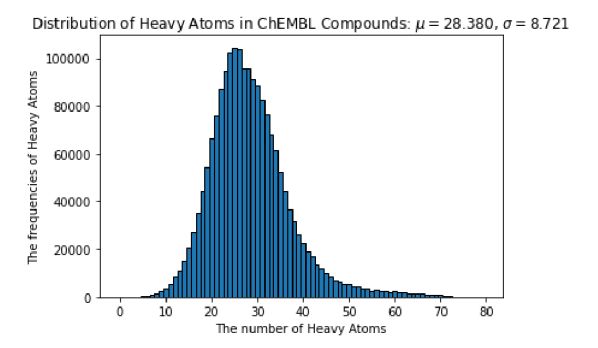
To train our deep generative models, three different types of data (i.e., compounds, proteins, and bioactivities) were retrieved from different data sources. The compound dataset, which includes atomic, physicochemical, and structural properties of drug and drug candidate molecules, was used as the input of our models (for both the GAN1 and GAN2 modules) as our “real” samples. The compound dataset we utilized in this study was retrieved from ChEMBL [4], which is a chemistry database containing curated high-quality data regarding drug-like small molecules and their experimentally measured activities on biological targets. We employed ChEMBL v29 which is composed of a total of 1,914,648 small molecules. The heavy atom distribution histogram of the ChEMBL dataset is given in Figure S1, which is used to determine the threshold for the maximum number of heavy atoms in the compounds in our model. Based on the median value and standard deviation of this distribution, we created the ChEMBL compound dataset composed of 1,588,865 small molecules with a maximum number of 45 heavy atoms.
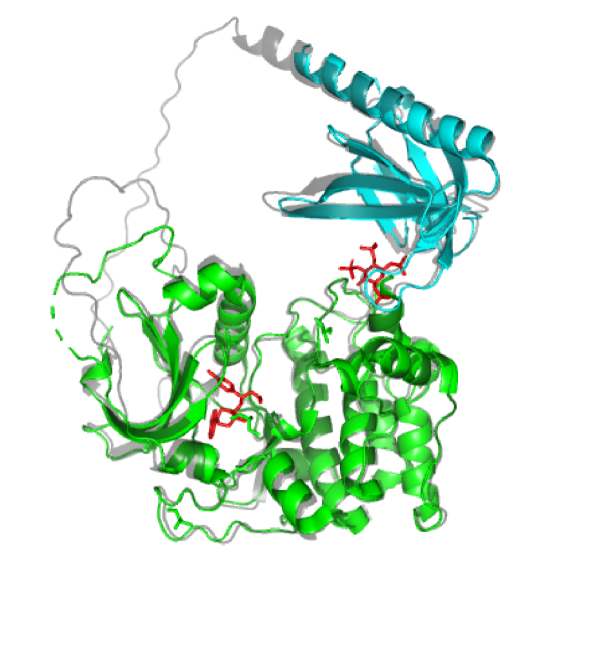
We utilized biological assemblies [36] obtained from the Protein Data Bank (PDB) [37] as our protein dataset. There are 57,925 biological assembly models in PDB, in total. Here, we only obtained the models that belong to our target protein, namely RAC-alpha serine/threonine-protein kinase (gene name: AKT1), a member of the non-specific serine/threonine protein kinase class (EC number: 2.7.11.1). The human protein kinase AKT mainly has two domains, which are kinase and pleckstrin homology (PH) (Figure S2) [38]. We constructed the AKT1 protein feature vector (see section 2.2) using the kinase domain structure (PDB id: “4GV1” [39]) since the main ligand binding region lies within this domain.
The third and final data type to be used in DrugGEN system training is experimental bioactivities, which is based on quantitative measurements of physical interactions between drug-like compounds and their target proteins. The bioactivity data was retrieved from the ChEMBL database. We applied various filters for standardization, such as target type: “single protein”, assay type: “binding assay”, standard type: “=” and pChEMBL value: “not null” (i.e., curated activity data points). Then, bioactivity data belonging to the AKT1 target protein were selected from the filtered bioactivity dataset. The finalized dataset contains ligand interactions of the human AKT1 (CHEMBL4282) protein with a pChEMBL value equal to or greater than 6 (i.e., IC50 <= 1 µM) as well as SMILES notations of these ligands. This activity dataset was extended by including drug molecules from the DrugBank database [40] that are known to interact with human AKT1 protein. With the filtering of molecules with sizes exceeding 45 heavy atoms, a total of 1,600 bioactivity data points, which also means 1,600 small molecule ligands, were obtained for the training of AKT1-specific generative models.
2.2 Featurization
DrugGEN utilizes graph representations of input molecules, each composed of two parts; an annotation matrix (contains information about the atom types) and an adjacency matrix (contains information about the presence of atomic bonds/interactions and their types). The annotation and adjacency matrices of the compounds were created using the RDKit [41] library based on the SMILES notations of the molecules. The annotation matrix of the compounds in the ChEMBL dataset is a matrix with the size 45*13, based on 12 types of atoms (atom types: C, O, N, F, K, S, B, P, Br, Ca, Cl, As) and one for the null (i.e., no atoms) case. The number of rows of the matrix: 45, defines the maximum length (the number of heavy atoms) of the molecule to be generated, while the number of columns: 13, defines the atom types. The extra (13th) column was included for the cases where no atoms are to be included in that position in the molecule (i.e., the “null” atom). The adjacency matrix is a 45*45*5 dimensional matrix that displays whether there are covalent bonds between the atoms of the molecule (0th: no bond, 1st: single, 2nd: double, 3rd: triple, and 4th: aromatic).
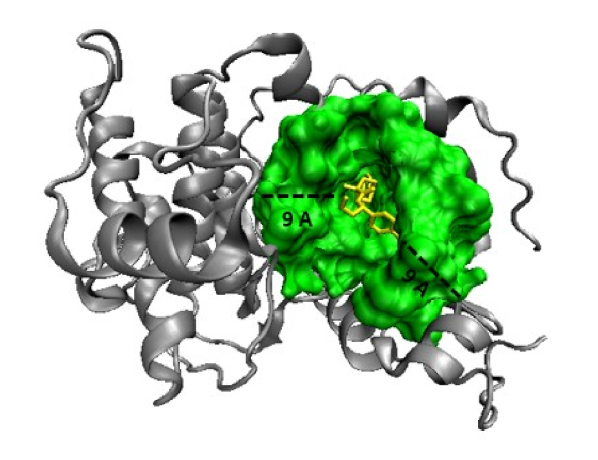
Since proteins are much larger in size and more complex compared to small molecules, presenting the structural information of a whole protein to the generative model would significantly increase the computational complexity and add noise to the system, which in turn would make it difficult to train an accurate model. In order to overcome this problem, we generated protein features by solely using functionally important regions of proteins, the binding sites/regions. To construct the binding sites of proteins, we employed the coordinates (on the 3-D plane) of protein-ligand complexes, obtained from PDB. In DrugGEN, target proteins are defined at the atomic level, with the aim of constructing their features at the same level as compounds. The atom types are standardized by converting the data from the PDB file format to the PDBQT file format, which contains reduced atom types. Also, hydrogen atoms have been added to proteins to mimic their active forms in nature. For these operations, protein and ligand processing scripts within the AutoDockTools4 [42] were used. To determine which atoms of the protein are to be included in the binding site feature vector, a cut-off distance between protein and ligand atoms was determined, using Euclidean distances. This value was selected as 9 Angstroms (A), based on the literature [43]. Thus, the atoms of a protein within a maximum distance of 9 A from all ligand atoms were recorded as its binding site. Figure S3 displays the constructed binding region of the AKT1 protein kinase domain structure.
In protein adjacency matrices, both covalent bonds and non-covalent interactions between atoms are included, with the aim of expressing the structure in a precise manner. The PDBeChem web service (https://www.ebi.ac.uk/pdbe-srv/pdbechem/) was used to define the covalent bonds between atoms in the binding site. The Python library Interfacea (https://github.com/JoaoRodrigues/interfacea/tree/master) was used to define the types of non-covalent interactions, both between atoms in the same residue and between inter-residue atoms. As a result, a 450*8-sized protein annotation matrix containing a total of 450 atoms belonging to 7 types (i.e., C: aliphatic carbon, N: non H-bonding nitrogen, OA: acceptor 2 H-bonds oxygen, A: aromatic carbon, SA: acceptor 2 H-bonds sulphur, NA: acceptor 1 H-bond Nitrogen, HD: donor 1 H-bond hydrogen) and 1 additional type to account for the absence of atoms (the null case), was constructed for AKT1. Within the adjacency matrix, there are 4 types of covalent bonds and 6 types of non-covalent bonds (i.e., covalent: single, double, triple, and aromatic; non-covalent: ionic, hydrogen bond, cation-pi, hydrophobic, pi-stacking, and t-stacking). Again, an extra dimension is used for the “no bond” case. The finalized adjacency matrix has the size of 450*450*11.
2.3 Architecture of DrugGEN
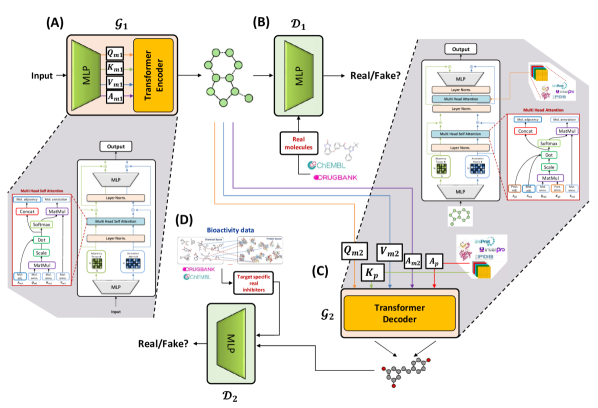
The DrugGEN model is built on Generative Adversarial Network (GAN) [11] architecture and took inspiration from the StackGAN [44] model to create a two-fold system. DrugGEN has 5 model variations each with its unique sample generation routine, below we define the default DrugGEN model (called DrugGEN-Prot) and its construction mechanism. Other model variations are defined in detail at Section 2.6. Figure 1 shows the overall workflow of the DrugGEN system. At the first stage (GAN1), given an input , generator (a graph transformer encoder) creates annotation and adjacency matrices of a supposed molecule (Figure 1A). These matrices are then fed to the discriminator network together with the real small molecules, to assign them to the groups of “real” and “fake” (Figure 1B).
At the second stage (GAN2), annotation and adjacency matrices of de novo molecules generated by are given to the second generator, (which is a graph transformer decoder) as (i.e., , and vectors in Figure 1C). In addition to , target proteins’ annotation and adjacency matrices are also given to the model ( and vectors, respectively, in Figure 1C). As a result, the finalized de novo generated molecule is the output of the function . takes the real inhibitor molecules that are experimentally shown to inhibit the selected target protein, together with the output of (Figure 1D) as its input and distinguishes them from each other. The details of each module are provided below.
GAN1 Generator:
The generator module employs the transformer encoder architecture [33] and operates on graphs-based data [45]. For this both the annotation and adjacency matrices are required to be processed in the same module. The annotation matrix contains the information regarding types and number of atoms in the molecule. The adjacency matrix represents the bonds between the atoms in the molecule, i.e., the edges in the graph. A molecular graph is considered as: ; given that is the set of nodes and is the set of edges representing connection between nodes. Each node can be indexed as with = 1, …, n. A connection between two nodes is defined as = 0, …, n. Each node and edge label is described in Section 2.2. We define the adjacency matrix as = 0,…,4 (according to the type of edge -bond- between the respective vertices -atoms-, or lack thereof). We define the annotation matrix as = 0,…,12 (according to the type of vertices -atoms-, or lack thereof). We used a maximum length of 45 heavy atoms in our molecules which necessitates our molecular graph size to be 45*13. Details regarding the dimensions and the context of annotation and adjacency matrices are given in Section 2.2.
The input (composed of real molecules, i.e., the ChEMBL dataset) is fed through individual MLPs for annotation and adjacency matrices, both of which consists of four layers (i.e., input: 16, 2 hidden: 64 each, and output: 128 dimensions). In summary, MLPs are utilized to create embedings of annotation and adjacency matrices with (default: 128) dimensions. Afterward, the input is fed to the transformer encoder module, that has a depth of 8 encoder layers with 8 multi-head attention heads for each. Here, firstly, input is processed in layer normalization and then sent to the self attention mechanism. In the classic transformer architecture, , and variables are the representations of the same input sequence. Attention is calculated by the scaled dot product of and , after that, the attention is multiplied by to form the final product [33]. In the graph transformer setting, , and are the variables representing the annotation matrix of the molecule. However, here, attention weights are calculated as the multiplication of the adjacency matrix () of the molecules with the scaled dot product of and . Then, attention weights are multiplied with to create the final representation of the annotation matrix. The new representation of the adjacency matrix is the concatenated version of the attention weights as described in the study by Dviwedi et al. (2020) and Vignac et al. (2022)[45, 46]. For our default model, output dimension size of the transformer is 128 for both the annotation and adjacency. The calculation of the attention mechanism is formulated below:
| (1) |
In this equation , , and denote the annotation matrix of the molecules while denotes their adjacency matrix. is the dimension of the transformer encoder module and it is used to scale the attention weights.
The reason for multiplying attention with the adjacency matrix is to ensure the contribution of adjacency to attention weights. After the final products are created in the attention mechanism, both the annotation and adjacency matrices are forwarded to layer normalization. Normalized matrices are summed with the initial matrices (the ones before forwarding to the attention mechanism), to create a residual connection. Finally, these matrices are fed to separate feedforward layers, which concludes the processing of the annotation and adjacency matrices.
GAN2 Generator:
The second generative network modifies molecules that were previously generated by GAN1, with the aim of generating binders for the given target protein. module utilizes the transformer decoder architecture [33]. The transformer decoder module has a depth of 8 decoder layers and uses 8 multi-head attention heads for each. For our default model, both the input and output dimension sizes of the transformer decoder are 128. DrugGEN’s graph transformer decoder network, , takes both , which is data generated by , and the protein features as input (Figure 1C). Protein self attention is calculated in the transformer decoder module as described in equation 1 for molecules. Interactions between molecules and proteins are processed inside the multi-head attention module of the transformer decoder. Here, molecules and protein features are multiplied via taking their scaled dot product, and thus, new molecular matrices are created. The attention is calculated as shown in the formula below:
| (2) |
In this equation, and denote the annotation matrix of the molecules, while denotes the annotation matrix of the protein. Superscript T denotes the transpose function. and correspond to the representation of protein and molecule adjacency matrices, respectively. is the dimension of the transformer decoder module used to scale attention weights. Apart from the attention mechanism, further processing of the molecular matrices follows the same workflow as the transformer encoder in . The output molecules of this module are the final products of DrugGEN and are forwarded to .
GAN1 and GAN2 Discriminators:
The purpose of the discriminator in GANs is to compare the synthetic (or fake) data, , generated by the generator with the real data, , and classify its input samples as fake or real. Both of the discriminators in DrugGEN (Figure 1B and 1D) are constructed using MLP, and they take their input as flat, one dimensional vectors. These vectors are created by concatenating the flattened versions of the annotation and adjacency matrices. GAN1 and GAN2 discriminators do not share parameters; however, they have the same modularity and size. The sizes of the layers in both MLP discriminators are 256, 128, 64, 32, 16, 1, respectively, from input to output. The last layer ends with a single neuron and a activation function to map each sample to a value between [-1,1]. A theoretically perfect discriminator should map a real molecule to 1 and a generated molecule to -1.
2.4 Loss function
DrugGEN utilizes the WGAN loss in model training [47]. Since DrugGEN is composed of two GANs, losses of these two networks are combined with each other. We reformulated the WGAN loss for end-to-end training of a two-stage GAN system, and the formula below is obtained:
| (3) |
where denotes real molecules that has been used in the first discriminator of DrugGEN, obtained from ChEMBL, DrugBank; denotes the real molecules, which interact with the selected target proteins, used in the second discriminator of DrugGEN; denotes the input distribution, the input of the first generator of DrugGEN; denotes the annotation matrix and denotes the adjacency matrix of the protein; denotes real data distribution and generated data distribution. It has been shown in the literature that using gradient penalty (GP) improves the performance of WGAN [48]. Due to this, we utilized GP, and its loss is formulated as:
| (4) |
where denotes a penalty coefficient; denotes data coming from: (i) (GAN1’s real data), (ii) (GAN2’s real data), and (iii) generated samples. refers to sampling uniformly along straight lines between pairs of points from the data distribution and generator distribution [48]. Also, denotes the aggregation of and as + . By combining Eqn. 3 and Eqn. 4, we obtained our finalized loss function as:
| (5) |
2.5 The Training Scheme and Hyperparameters
DrugGEN was trained with the ChEMBL compounds dataset (used as the real molecules input of the model). The ChEMBL dataset was split into train and test partitions randomly with 90% to 10% ratio. Training procedure has been carried out via two alternative routes, in different runs. In the first route, the model training is started with a "warm-up" session with only the GAN1, which is continued for several epochs, and then, the GAN2 training is activated. Here, DrugGEN training starts with and continues with . After that, the model trains and consecutively. The second route trains GAN1 and GAN2 together from scratch, in which training starts with and and continues with and . The default DrugGEN model uses a learning rate of 0.00001 for , , , and . The batch size of the model was 128 and the model was run for 50 epochs in total (according to our observation, loss values did not significantly change after 50 epochs). The Adam optimizer was utilized as the optimizer of the model with beta1: 0.9 and beta2: 0.999. Training the models reported below took approximately 2 days to finish (each one) using 10 Intel Gold CPUs and a single NVIDIA A5000 GPU. of DrugGEN consisted of 37 million parameters, while consisted of 640 million parameters. Both discriminators, on the other hand, had 2.7 million parameters for the default model.
2.6 Model Variations
With the aim of generating target-based drug-candidate de novo molecules using the DrugGEN system, we implemented numerous different models with slight variations in terms of the architectural design and the input data. All the models presented below were tested with respect to their generational performance.
DrugGEN-Prot (the default model) is the one shown in Figure 1 and explained in sections 2.3 and 2.4. It incorporates protein features to the transformer decoder module of GAN2 (together with the de novo molecules generated by GAN1) to direct the target centric molecule design. The model employs end-to-end training and computes a single finalized loss by combining the losses of both discriminators.
DrugGEN-CrossLoss is composed of only one GAN (i.e., GAN1 of the default model), and is implemented with the aim of shifting the distribution of the input data to the distribution of real inhibitors of the selected target within a simpler system. In this model, GAN1 discriminator compares the de novo generated molecules with the real inhibitors of the given target protein.
DrugGEN-Ligand is composed of two GANs, similar to DrugGEN-Prot (and utilizes the same training routine and hyperparameters); however, it incorporates AKT1 inhibitor molecule features as the input of the GAN2-generator’s transformer decoder instead of the protein features. The objective of the transformer decoder module of this model is to generate molecules that are structurally similar to AKT1 inhibitors.
DrugGEN-RL utilizes the same general architecture as DrugGEN-Ligand, and constructed with the aim of designing structurally diverse de novo molecules by avoiding the use molecular scaffolds that are already presented in the training set. DrugGEN-RL is inspired from the paradigm of reinforcement learning (RL). Here, the objective of the RL module is to decrease the Tanimoto scaffold similarity (using Bemis-Murcko [49]) between generated and training set molecules (i.e., ChEMBL molecules for GAN1, and real AKT1 inhibitors for GAN2) by defining the similarity between them as an additional (penalty) term in the loss function.
DrugGEN-NoTarget is our base model, which is composed of only one GAN (i.e., GAN1 of the default model). This model only focuses on learning the chemical properties of real molecules from the ChEMBL training dataset, as a result, there is no target-specific generation. DrugGEN-NoTarget uses the same hyperparameters as the default model.
2.7 Performance Metrics
The performance of the models was evaluated using several molecular generation metrics presented in the MOSES benchmark platform [50], including validity, uniqueness, internal diversity (IntDiv), and novelty, to assess the efficiency of the generative capabilities of the models. Validity is calculated as the percent of the data that can be parsed by the SMILES conversion function of the RDKit [41] Python package. Uniqueness is the metric that checks the dissimilarity of each molecule against other molecules in the same batch. IntDiv is the measurement of the mean dissimilarity (based on Tanimoto similarity on MorganFingerprints) between a molecule and other molecules in the same batch. Novelty is the ratio of the generated molecules that are not presented in the real (training) dataset to all generated molecules. Higher values of validity, uniqueness, IntDiv and novelty indicate better performance. Quantitative estimate of drug-likeness (QED), partition coefficient (logP), synthetic accessibility (SA), similarity to nearest neighbor (SNN), and MOSES filters measure the fitness of the generated molecules to be considered as drug candidates. Calculation details of these metrics can be found in Polykovskiy et al. (2020) and Landrum (2013) [50, 41].
2.8 Molecule Filtering and Selection Procedure
With the aim of identifying the best novel candidates for targeting the AKT1 protein, de novo molecules generated by DrugGEN models are filtered according to the following operations: 1) based on the Tanimoto similarity (calculated on Morgan fingerprints) against both the ChEMBL dataset molecules and real AKT1 inhibitors. Molecules that have Tanimoto similarity higher than 70% to the training sets are eliminated; 2) using Lipinski’s [51] and Veber’s rules [52], and 3) applying the PAINS (pan-assay INterference compoundS) [53] filter, which identifies and eliminates false positive molecules in biological screening assays such as redox cyclers, toxoflavins, polyhydroxylated natural phytochemicals, and etc.
The molecules that remain after the filtering operations were analyzed via molecular docking. For the docking study, the crystal structure of AKT1 (PDB code “4GV1” [39]) was prepared by Protein Preparation Wizard [54] program in Schrödinger Suite 2021 [55] with the OPLS2005 force field. Missing hydrogen atoms were added, and water molecules were removed. The physical condition of pH was set as 7.4 ± 1.0 for atom typing. The binding site of AKT1 was defined as ALA-177, LYS-179, LYS-182, ALA-212, GLU-228, ALA-230, GLU-234, GLU-278, THR-291, ASP-292, by detection with PLIP 2.5.4 [56] and cross checked with the binding data published in the literature [39]. These findings were integrated and used for grid generation. Glide software [57] was used to find the best binding poses for each ligand. Van der Waals radius scaling factor was set to 1.0 and partial charge cut-off value was set to 0.25. The docking calculations were made in Standard Precision Mode (GlideScore SP). Results were visualized with PyMOL [58].
In parallel to docking analysis, our filtered de novo molecules have also been subject to deep learning-based drug-target interaction prediction against the AKT1 protein using our previously developed system entitled DEEPScreen. DEEPScreen employs readily available 2-D image-based structural Kakule representations (300-by-300 pixels) of compounds as input and processes them via deep convolutional neural networks which classify them as active or inactive against the target of interest [59] For this, we first trained an AKT1 target model using experimental bioactivity data of this protein in ChEMBLv30 as our training dataset, which was composed of 1338 active and 1666 inactive molecules (activity threshold was pChEMBL value: 7). We randomly split the compound dataset into train, validation and test folds (80%, 10% and 10% of the data, respectively). We optimized hyper-parameters with respect to the scoring metrics on the validation fold and measured the overall performances of the model on the independent hold-out test fold. The test performance of the model was found to be precision: 0.91, recall: 0.92, F1-score: 0.92, MCC: 0.85, which was considered satisfactory. Afterwards, the 2-D structural images of the de novo molecules were generated using the same parameters and run on the trained AKT1 model in prediction mode. Details regarding the DEEPScreen system and its training can be obtained from [59].
3 Results and Discussion
The DrugGEN model is a two-fold generative adversarial network that utilizes transformer architecture to design target-specific molecules. The performance of DrugGEN in designing de novo molecules was assessed using well-known benchmarking metrics. Additionally, target-specific properties of the generated molecules were evaluated through further in silico experiments, such as molecular docking and deep learning-based drug-target interaction prediction. We finally explored de novo molecules in comparison to real molecules via t-SNE based embedding and visualization in 2-D.
Hepatocellular carcinoma (HCC) is the most prevalent form of liver cancer, accounting for 75-80% of cases. Also, it is the third leading cause of cancer-related deaths, with nearly 830,000 deaths worldwide [60]. The PI3K/AKT/mTOR pathway is one of the most important signaling pathways related to HCC. It regulates the various fundamental cellular processes, such as survival, cell growth, and metabolism. Systemic treatment became the only option for advanced-stage HCC patients when the first FDA-approved multikinase inhibitor (MKI), Sorafenib, prolonged the survival of patients for 2-3 months. Due to the high toxicity and lower response rate of these treatment options, combinatorial treatment strategies involving antiangiogenic agents and ICIs (such as atezolizumab + bevacizumab) showed improved patient survival over Sorafenib [61]. Unfortunately, available drugs are unable to effectively improve the overall HCC survival rate. Recent studies have uncovered several proteins that may serve as potential targets for the treatment of liver cancer [62]. After evaluating potential kinases known to have a role in the development of HCC on the KinMap platform [63] and considering the availability of in vitro studies and kinase activity assays, we identified AKT kinases (RAC-alpha/beta/gamma serine/threonine-protein kinases) as promising targets for the treatment of HCC. Therefore, AKT1 targeting is selected as the use-case of DrugGEN.
3.1 Performance Evaluation of DrugGEN Models
In this analysis, DrugGEN models (see section 2.6) were compared with each other and with other models from the literature, over various benchmarking metrics. For this, we generated approximately 10,000 de novo molecules from each of the fully trained DrugGEN models (50,000 in total) and subjected these molecules to MOSES benchmarking [50]. In Table 1, we report the generative performance over validity, uniqueness, novelty, internal diversity (where higher values are better) and FCD (lower is better) metrics. According to Table 1, DrugGEN displayed competitive results on the ChEMBL dataset against both baseline models (i.e., ORGAN and NAT GraphVAE), and more recent methods such as MolGPT, MGM, RELATION and MCMG (methods were selected based on the availability of models trained on the ChEMBL dataset, for fair comparison). Overall, all DrugGEN models have a high efficiency on molecule generation tasks. The validity score of DrugGEN-Prot was low compared to other DrugGEN models and compared methods. We believe this is due to the high complexity of this model. Unlike DrugGEN-Prot, remaining DrugGEN models do not utilize protein features (instead, transformer decoder input is either real AKT inhibitors or ChEMBL molecules), which decreases the overall complexity and facilitates the learning process. On the other hand, DrugGEN-Prot has the highest uniqueness score among all DrugGEN models, which is also similar to the best methods included in this analysis. DrugGEN models do not suffer from low novelty, opposite to ORGAN, MolGPT, and MGM. ORGAN relies on GANs composed of RNN (as generator) and CNN (as discriminator), to generate conditioned molecules [64]. DrugGEN utilizes graph transformers, a novel architecture, inside GANs which in return yields a higher novelty and validity scores. Models like MolGPT and MGM also utilize the transformer architecture. However, the usage of transformers in generative modeling may result in lower novelty scores subject to overfitting to training data [65]. It is probable that DrugGEN does not suffer greatly from overfitting due to relying on probabilistic discrimination instead of cross entropy loss. The IntDiv metric indicates the diversity of structures among generated samples. The DrugGEN-Prot model outperforms every other model that IntDiv reported, indicating the ability to learn different molecular structures from the training dataset and yield a diverse structural distribution during the generation process. The FCD score measures the proximity of the distribution of generated molecules’ physicochemical characteristics to the distribution of the training dataset [13]. We measured the FCD scores of our models against real AKT1 inhibitors (not to the ChEMBL dataset). The only method that can be directly compared to DrugGEN over this metric is RELATION, since it also generates target-specific molecules. DrugGEN-Ligand and DrugGEN-RL have the lowest two FCD scores, indicating that these models capture the physicochemical properties of real AKT1 inhibitors better than others.
| Models | Val. | Uniq. | Nov. | IntDiv | FCD |
|---|---|---|---|---|---|
| MCMG | - | 0.105 | 0.889 | 0.622 | - |
| RELATION | 0.854 | 1.0 | 1.0 | 0.773 | 13.3 |
| MGM | 0.849 | 1.0 | 0.722 | - | 0.845 |
| MolGPT | 0.994 | 1.0 | 0.797 | 0.857 | 0.067 |
| ORGAN | 0.379 | 0.841 | 0.687 | - | - |
| NAT GraphVAE | 0.830 | 0.944 | 1.0 | - | 0.016 |
| DrugGEN-Prot | 0.484 | 0.939 | 0.992 | 0.887 | 16.65 |
| DrugGEN-CrossLoss | 0.820 | 0.790 | 1.0 | 0.878 | 18.38 |
| DrugGEN-Ligand | 0.859 | 0.881 | 0.981 | 0.877 | 5.382 |
| DrugGEN-RL | 0.867 | 0.873 | 1.0 | 0.830 | 6.068 |
| DrugGEN-NoTarget | 0.820 | 0.857 | 1.0 | 0.885 | 17.27 |
In Table 2, we report the Wassertein distance values (measured between generated molecules and real AKT1 inhibitors) based on QED, SA, and logP metrics (where lower values are better) [50], together with the percentage of molecules that can pass the MOSES filters (where higher values are better) for DrugGEN models. QED values in Table 2 show that molecules generated by all DrugGEN models have highly similar drug-like properties to real AKT1 inhibitors, many of which are actual drug candidates. The DrugGEN-Ligand and DrugGEN-RL models generate molecules with logP values and SA scores close to AKT1 inhibitors. It is possible that incorporating protein features to the process (in DrugGEN-Prot) makes it challenging to design synthetically accessible molecules since this operation tries to shift the distribution of generated molecules to the features of the given target protein, instead of the known inhibitors of that protein. MOSES filters eliminate the structures that do not have drug-like patterns via a multi-level filtering operation[50]. DrugGEN models (except DrugGEN-Prot and DrugGEN-NoTarget) perform well in this metric.
3.2 Target-centric Assessment of Generated Molecules
Based on the results in both Table 1 and 2, it is possible to state that DrugGEN models (especially DrugGEN-Prot) generate highly diverse and novel molecules that are significantly different from known inhibitors of the selected target, which can be interpreted as a highly positive outcome if these molecules really interact with the target of interest. However, it is not possible to evaluate properties related to target activity using the abovementioned metrics. To evaluate this, we carried out further computational analysis, in which we first filtered the same 50,000 de novo generated molecules that were subjected to benchmarking analysis (according to the protocol explained in Section 2.8). After applying Lipinski, Veber and PAINS filters (to ensure drug-like properties), 43,000 of them remained in our dataset. Distributions of physicochemical properties of both de novo generated molecules and real AKT1 inhibitors are given in Figure S5. Afterwards, a molecular docking analysis was performed (see Section 2.8) on these filtered de novo molecules, using AKT1 crystal structure (PDB id: “4GV1” [39]) as template. Figure 2A displays box plots of docking scores (i.e., binding free energies - G) obtained from docking (with respect to scores of 100 molecules from each DrugGEN model with the best binding properties), where a lower binding free energy value indicates a higher activity. It is observed from Figure 2A that all five models were able to generate molecules with high potential, surpassing the score of the native ligand in the crystal complex structure “4GV1” [39] (shown as the horizontal red dashed line). The molecules generated from DrugGEN-CrossLoss and DrugGEN-Prot have lower binding free energies against the AKT1 protein.
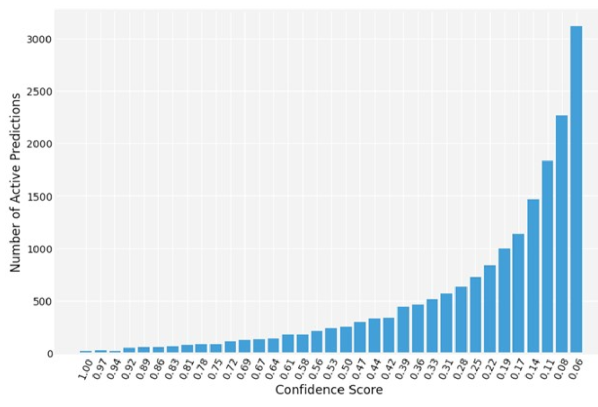
We also carried out a deep learning-based drug-target interaction (DTI) prediction analysis using the DEEPScreen system [59] against the AKT1 protein (see Section 2.8) on the same de novo molecule dataset as the one used in docking. DEEPScreen is utterly independent of DrugGEN models to ensure there is no bias in this analysis. Out of 43,000 molecules obtained from all DrugGEN models, DEEPScreen predicted 18,000 of them as active against AKT1, and 301 of them received high confidence scores (0.83 or higher, where min:0 and max:1, the full confidence score histogram is given in Figure S4). These results indicate DrugGEN can generate target-specific molecules with high potential, which is in accordance with the results of the docking analysis.
| Models | QED | logP | SA | Filters |
|---|---|---|---|---|
| DrugGEN-Prot | 0.044 | 0.554 | 1.048 | 51.6% |
| DrugGEN-CrossLoss | 0.096 | 0.481 | 0.354 | 83.6% |
| DrugGEN-Ligand | 0.034 | 0.170 | 0.070 | 90.6% |
| DrugGEN-RL | 0.030 | 0.218 | 0.280 | 91.7% |
| DrugGEN-NoTarget | 0.094 | 0.520 | 0.476 | 78.3% |
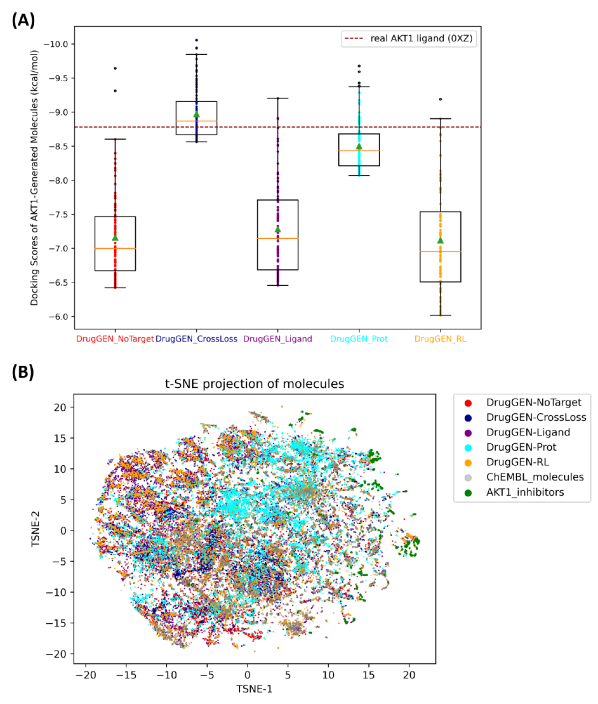
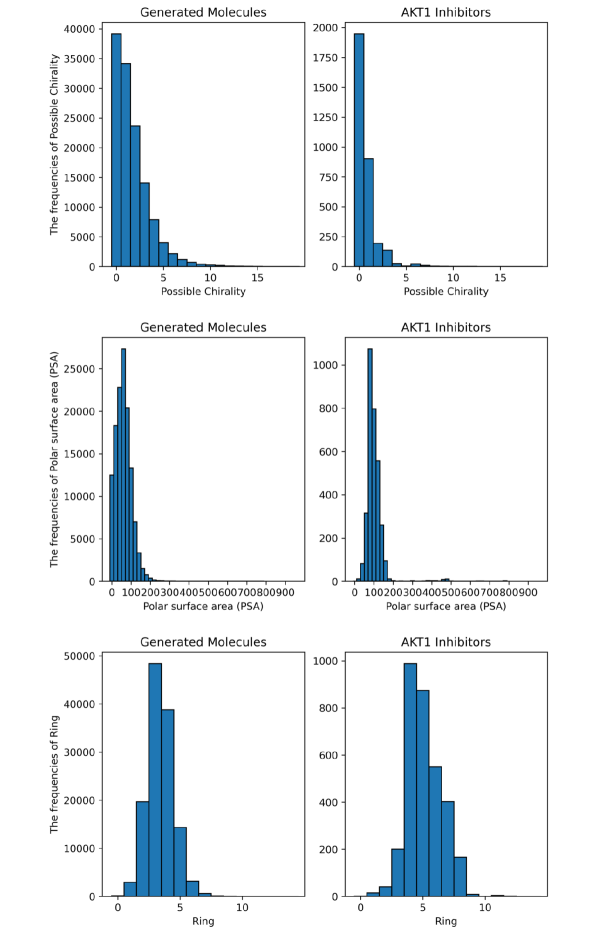
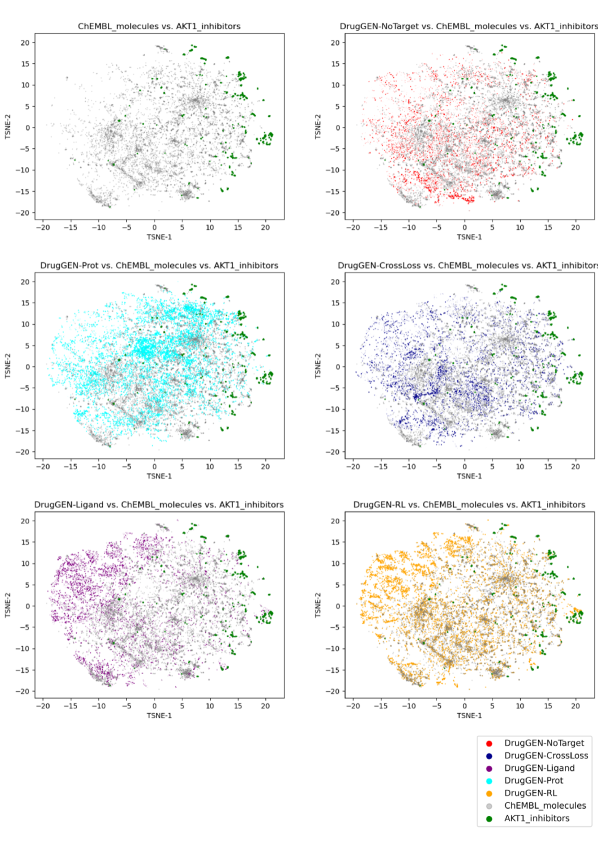
To further explore the de novo molecules, we carried out a t-SNE embedding [68] (of randomly selected 10,000 ChEMBL training molecules, 1,600 real AKT1 inhibitors, and the same 50,000 de novo DrugGEN molecules as in the previous analyses, 10,000 from each model) and visualization on 2-D, as shown in Figure 2B (the t-SNE parameters were, perplexity=50 and number of iterations=500). Individual visualizations for each DrugGEN model within the same overall t-SNE embedding is also given in Figure S6. In both figures, each dot corresponds to a molecule, colors indicate their source, and the Euclidean distances indicate structural similarities based on Tanimoto applied on molecular fingerprints (i.e., ECFP [69]). Randomly selected ChEMBL molecules spread around the embedding space due to their high structural diversity. On the other hand, it is possible to observe distinct clusters formed by models such as DrugGEN-Prot, which are within the space of real drug-like (ChEMBL) molecules, but still away from individual clusters formed by ChEMBL molecules. De novo molecules of DrugGEN-NoTarget and real AKT1 inhibitors are mostly far away from each, which is an expected result since the generation process is not target specific for this model. Similarly, molecules of DrugGEN-Ligand and DrugGEN-RL models are also far away from real AKT1 inhibitors, which is also indicated by low average docking performance of these two models (Figure 2A). Interestingly, these models managed to capture the physicochemical distribution of real AKT1 inhibitors (Table 2) but generated structurally dissimilar molecules. Actually, structural dissimilarity was the main aim behind the DrugGEN-RL model, as a result, this model can be considered successful in this regard.
As an overall evaluation, DrugGEN-CrossLoss and DrugGEN-Prot can be considered as the most successful models in terms of target-specific generation, where the former model generated molecules with better docking scores thanks to utilizing real AKT1 inhibitors in the transformer decoder module (which conditions the generation process towards the physical and chemical features of known inhibitors), the latter model generated highly diverse molecules with topological complementarity to AKT1 binding pocket thanks to utilizing target protein features (instead of its known inhibitors). Protein binding pocket graphs were significantly larger compared to molecular graphs, which increased the complexity of the model, and thus, the learning process. On top of that, we only used the AKT1 protein during the training of DrugGEN-Prot, which probably limited the generalization capability of the model. These two are probably the main reasons behind obtaining relatively lower generation scores for DrugGEN-Prot (Table 1).
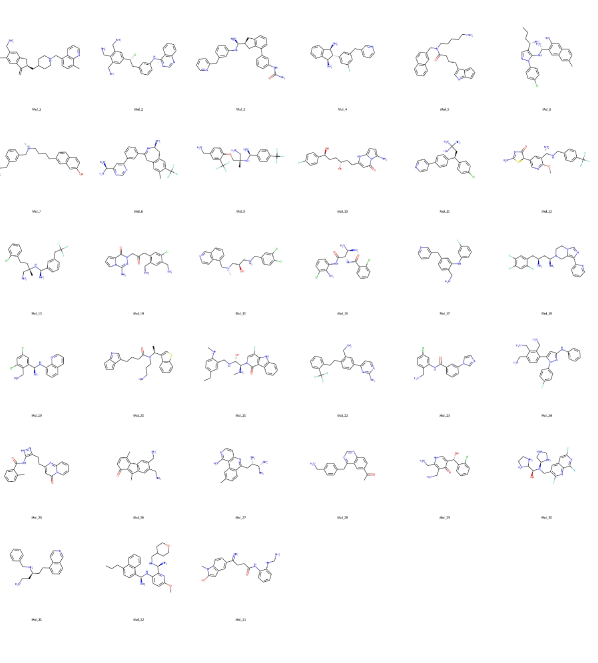
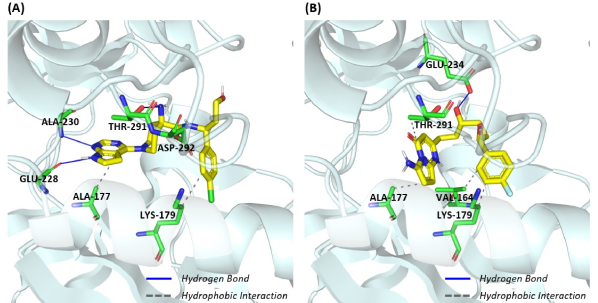
Finally, we manually selected the 33 most promising generated molecules (from our drug-like de novo molecules dataset with satisfactory docking scores) via expert curation, and presented them as our best candidates to target AKT1 (Figure 3). We checked the structural similarity of these molecules to database records and found that they are completely novel at the threshold of at least 60% Tanimoto similarity (compared to all molecules in the ChEMBL database). We showcase one molecule among the 33 (shown as Mol_10 in Figure 3), which can be denoted as a Pyrrolo[1,2-a]pyrimidin-4(1H)-one derivative. Figure 4 displays the reference crystal complex structure of AKT1 with its native ligand 0XZ (PDB id: “4GV1” [39]), for which the binding free energy was measured as -8,781 kcal/mol using the exact same docking protocol (Figure 4A), together with the best docking pose of Mol_10 with the binding free energy -9.686 kcal/mol (Figure 4B). The reference co-crystal complex structure “AKT1 - 0XZ” (Figure 4A) and the complex model obtained from the docking of the selected de novo molecule “AKT1 - Mol_10” (Figure 4B) share the same 3 binding residues. Two of these residues , ALA-177 and LYS-179, have hydrophobic interactions with both of the ligands. Hydrophobic interactions are more prominent in the AKT1 - Mol_10 complex, whereas in the crystal structure hydrogen bonds are evident. This may contribute to the difference in binding affinities.
4 Conclusion
In this study, we developed the DrugGEN system to automatically design target-specific drug candidate molecules. Main idea behind the DrugGEN was to combine GANs and the graph transformer architecture to create a system that can design inhibitor candidates given the target protein. DrugGEN can be seen as an umbrella-system that contains several models implemented to investigate the target-centric generation capabilities. DrugGEN models perform similar to SOTA models (or better in some cases) in performance metrics, which points out to its high generation efficiency and capacity. In terms of physicochemical metrics such as QED, SA, and logP, we showed that DrugGEN models can generate de novo molecules with similar molecular characteristics to real inhibitors of the AKT1 protein. Further computational analyses were done to assess the target-specific characteristics of de novo molecules, the results of which indicated their high potential in AKT1 targeting. With the intention of presenting a tool that the community can utilize, as well as for reproducibility-related purposes, we openly shared the code base, datasets, all results and trained models of DrugGEN in our repository at https://github.com/HUBioDataLab/DrugGEN.
As a next step, we plan to train DrugGEN models with; (i) a larger target-centric dataset including additional proteins and/or their real inhibitors, and (ii) increased number of parameters to optimize (i.e., larger models) to provide room for improvement; both of which would yield a more successful learning in terms of molecular structural properties corresponding to given target characteristics. In further studies, selected de novo molecules will be subjected to chemical synthesis and subsequent in vitro cell-based experiments to validate AKT1 targeting and observe phenotypic effects on HCC cell-lines. We also plan to improve the molecular generation process by incorporating high-level functional properties of real drugs and drug candidate molecules (along with their structural features, which are already utilized in the current version) in the context of heterogeneous biomedical knowledge graphs [70], to the model training procedure. This architecture is intended to facilitate the understanding of the relationship between the structural and functional properties of small molecules and thereby enhance the design process.
Acknowledgments
This project was supported by TUBITAK-BIDEB 2247-A National Leader Researchers Program under project number 120C123.
Author information & contributions
AU: Atabey Ünlü (atabeyunlu36@gmail.com),
EC: Elif Çevrim (candaselif@gmail.com),
AS: Ahmet Sarıgün (ahmet.sarigun@metu.edu.tr),
HC: Hayriye Çelikbilek (hayriye.celikbilek@gmail.com),
HAG: Heval Ataş Güvenilir (hevalatas@gmail.com),
AK: Altay Koyaş (altay.koyas@metu.edu.tr),
DCK: Deniz Cansen Kahraman (cansen@metu.edu.tr),
AO: Abdurrahman Olğaç (aolgac@gazi.edu.tr),
AR: Ahmet Rifaioğlu (ahmet.rifaioglu@uni-heidelberg.de),
TD: Tunca Doğan (tuncadogan@gmail.com).
TD conceptualized the study and designed the general methodology. EC and HAG prepared the datasets and handled the protein featurization process. AS, AU, ASR and TD determined the technical details of the fundamental model architecture. AU and AS prepared the original codebase, also designed and implemented initial models. AU designed, implemented, trained, tuned and evaluated numerous model variants and constructed the finalized DrugGEN models. DCK and AK selected the protein target by reviewing the literature. HC further evaluated the de novo generated molecules in the context of drug-target interaction prediction (via DEEPScreen). EC and AO conducted the molecular filtering operations and physics based (docking) experiments. AU, EC, AO, and TD evaluated and discussed findings. EC, AU, AS and TD visualized the results and prepared the figures in the manuscript. AU, EC, AS, HC, HAG, and TD wrote the manuscript. AU, EC, AS, and TD prepared the repository. TD, ASR and AO supervised the overall study. All authors approved the manuscript.
References
- [1] Ahmet Sureyya Rifaioglu, Heval Atas, Maria Jesus Martin, Rengul Cetin-Atalay, Volkan Atalay, and Tunca Doğan. Recent applications of deep learning and machine intelligence on in silico drug discovery: methods, tools and databases. Briefings in bioinformatics, 20(5):1878–1912, 2019.
- [2] Steven M Paul, Daniel S Mytelka, Christopher T Dunwiddie, Charles C Persinger, Bernard H Munos, Stacy R Lindborg, and Aaron L Schacht. How to improve r&d productivity: the pharmaceutical industry’s grand challenge. Nature reviews Drug discovery, 9(3):203–214, 2010.
- [3] Govinda Bhisetti and Cheng Fang. Artificial intelligence–enabled de novo design of novel compounds that are synthesizable. Artificial Intelligence in Drug Design, pages 409–419, 2022.
- [4] David Mendez, Anna Gaulton, A Patrícia Bento, Jon Chambers, Marleen De Veij, Eloy Félix, María Paula Magariños, Juan F Mosquera, Prudence Mutowo, Michał Nowotka, et al. Chembl: towards direct deposition of bioassay data. Nucleic acids research, 47(D1):D930–D940, 2019.
- [5] Sunghwan Kim, Jie Chen, Tiejun Cheng, Asta Gindulyte, Jia He, Siqian He, Qingliang Li, Benjamin A Shoemaker, Paul A Thiessen, Bo Yu, et al. Pubchem 2023 update. Nucleic Acids Research, 51(D1):D1373–D1380, 2023.
- [6] Daniel C Elton, Zois Boukouvalas, Mark D Fuge, and Peter W Chung. Deep learning for molecular design—a review of the state of the art. Molecular Systems Design & Engineering, 4(4):828–849, 2019.
- [7] Lauren L Grant and Clarissa S Sit. De novo molecular drug design benchmarking. RSC Medicinal Chemistry, 12(8):1273–1280, 2021.
- [8] Varnavas D Mouchlis, Antreas Afantitis, Angela Serra, Michele Fratello, Anastasios G Papadiamantis, Vassilis Aidinis, Iseult Lynch, Dario Greco, and Georgia Melagraki. Advances in de novo drug design: From conventional to machine learning methods. International journal of molecular sciences, 22(4):1676, 2021.
- [9] Diederik P Kingma and Max Welling. Auto-encoding variational bayes. arXiv preprint arXiv:1312.6114, 2013.
- [10] Rafael Gómez-Bombarelli, Jennifer N Wei, David Duvenaud, José Miguel Hernández-Lobato, Benjamín Sánchez-Lengeling, Dennis Sheberla, Jorge Aguilera-Iparraguirre, Timothy D Hirzel, Ryan P Adams, and Alán Aspuru-Guzik. Automatic chemical design using a data-driven continuous representation of molecules. ACS central science, 4(2):268–276, 2018.
- [11] Ian Goodfellow, Jean Pouget-Abadie, Mehdi Mirza, Bing Xu, David Warde-Farley, Sherjil Ozair, Aaron Courville, and Yoshua Bengio. Generative adversarial networks. Communications of the ACM, 63(11):139–144, 2020.
- [12] Nicola De Cao and Thomas Kipf. Molgan: An implicit generative model for small molecular graphs. arXiv preprint arXiv:1805.11973, 2018.
- [13] Omar Mahmood, Elman Mansimov, Richard Bonneau, and Kyunghyun Cho. Masked graph modeling for molecule generation. Nature communications, 12(1):1–12, 2021.
- [14] Joshua Mitton, Hans M Senn, Klaas Wynne, and Roderick Murray-Smith. A graph vae and graph transformer approach to generating molecular graphs. arXiv preprint arXiv:2104.04345, 2021.
- [15] Ryan J Richards and Austen M Groener. Conditional vae for de novo molecular generation. arXiv preprint arXiv:2205.01592, 2022.
- [16] Kohei Nemoto and Hiromasa Kaneko. De novo direct inverse qspr/qsar: Chemical variational autoencoder and gaussian mixture regression models. Journal of Chemical Information and Modeling, 2023.
- [17] Artur Kadurin, Sergey Nikolenko, Kuzma Khrabrov, Alex Aliper, and Alex Zhavoronkov. drugan: an advanced generative adversarial autoencoder model for de novo generation of new molecules with desired molecular properties in silico. Molecular pharmaceutics, 14(9):3098–3104, 2017.
- [18] Xuezhi Xie, Pedro A Valiente, and Philip M Kim. Helixgan a deep learning methodology for conditional de novo design of -helix structures. Bioinformatics, 2023.
- [19] Josep Arús-Pous, Simon Viet Johansson, Oleksii Prykhodko, Esben Jannik Bjerrum, Christian Tyrchan, Jean-Louis Reymond, Hongming Chen, and Ola Engkvist. Randomized smiles strings improve the quality of molecular generative models. Journal of cheminformatics, 11(1):1–13, 2019.
- [20] Thomas Blaschke, Josep Arús-Pous, Hongming Chen, Christian Margreitter, Christian Tyrchan, Ola Engkvist, Kostas Papadopoulos, and Atanas Patronov. Reinvent 2.0: an ai tool for de novo drug design. Journal of chemical information and modeling, 60(12):5918–5922, 2020.
- [21] Xun Wang, Changnan Gao, Peifu Han, Xue Li, Wenqi Chen, Alfonso Rodríguez Patón, Shuang Wang, and Pan Zheng. Petrans: De novo drug design with protein-specific encoding based on transfer learning. International Journal of Molecular Sciences, 24(2):1146, 2023.
- [22] Viraj Bagal, Rishal Aggarwal, PK Vinod, and U Deva Priyakumar. Molgpt: Molecular generation using a transformer-decoder model. Journal of Chemical Information and Modeling, 62(9):2064–2076, 2021.
- [23] Maryam Abbasi, Beatriz P Santos, Tiago C Pereira, Raul Sofia, Nelson RC Monteiro, Carlos JV Simões, Rui MM Brito, Bernardete Ribeiro, José L Oliveira, and Joel P Arrais. Designing optimized drug candidates with generative adversarial network. Journal of cheminformatics, 14(1):40, 2022.
- [24] Quentin Perron, Olivier Mirguet, Hamza Tajmouati, Adam Skiredj, Anne Rojas, Arnaud Gohier, Pierre Ducrot, Marie-Pierre Bourguignon, Patricia Sansilvestri-Morel, Nicolas Do Huu, et al. Deep generative models for ligand-based de novo design applied to multi-parametric optimization. Journal of Computational Chemistry, 43(10):692–703, 2022.
- [25] Meng Liu, Youzhi Luo, Kanji Uchino, Koji Maruhashi, and Shuiwang Ji. Generating 3d molecules for target protein binding. arXiv preprint arXiv:2204.09410, 2022.
- [26] Mingyang Wang, Chang-Yu Hsieh, Jike Wang, Dong Wang, Gaoqi Weng, Chao Shen, Xiaojun Yao, Zhitong Bing, Honglin Li, Dongsheng Cao, et al. Relation: A deep generative model for structure-based de novo drug design. Journal of Medicinal Chemistry, 65(13):9478–9492, 2022.
- [27] Niklas WA Gebauer, Michael Gastegger, Stefaan SP Hessmann, Klaus-Robert Müller, and Kristof T Schütt. Inverse design of 3d molecular structures with conditional generative neural networks. Nature communications, 13(1):1–11, 2022.
- [28] Wentao Shi, Manali Singha, Gopal Srivastava, Limeng Pu, J Ramanujam, and Michal Brylinski. Pocket2drug: An encoder-decoder deep neural network for the target-based drug design. Frontiers in Pharmacology, 13:837715–837715, 2022.
- [29] Gökçe Uludoğan, Elif Ozkirimli, Kutlu O Ulgen, Nilgün Karalı, and Arzucan Özgür. Exploiting pretrained biochemical language models for targeted drug design. Bioinformatics, 38(Supplement_2):ii155–ii161, 2022.
- [30] Eyal Rozenberg and Daniel Freedman. Semi-equivariant continuous normalizing flows for target-aware molecule generation. arXiv preprint arXiv:2211.04754, 2022.
- [31] Yueshan Li, Liting Zhang, Yifei Wang, Jun Zou, Ruicheng Yang, Xinling Luo, Chengyong Wu, Wei Yang, Chenyu Tian, Haixing Xu, et al. Generative deep learning enables the discovery of a potent and selective ripk1 inhibitor. Nature Communications, 13(1):1–18, 2022.
- [32] Yunjiang Zhang, Shuyuan Li, Miaojuan Xing, Qing Yuan, Hong He, and Shaorui Sun. Universal approach to de novo drug design for target proteins using deep reinforcement learning. ACS Omega, 2023.
- [33] Ashish Vaswani, Noam Shazeer, Niki Parmar, Jakob Uszkoreit, Llion Jones, Aidan N Gomez, Łukasz Kaiser, and Illia Polosukhin. Attention is all you need. Advances in neural information processing systems, 30, 2017.
- [34] Thomas N Kipf and Max Welling. Semi-supervised classification with graph convolutional networks. arXiv preprint arXiv:1609.02907, 2016.
- [35] Mariam Mroweh, Gaël Roth, Thomas Decaens, Patrice N Marche, Hervé Lerat, and Zuzana Macek Jílková. Targeting akt in hepatocellular carcinoma and its tumor microenvironment. International Journal of Molecular Sciences, 22(4):1794, 2021.
- [36] Evgeny Krissinel and Kim Henrick. Inference of macromolecular assemblies from crystalline state. Journal of molecular biology, 372(3):774–797, 2007.
- [37] Stephen K Burley, Helen M Berman, Charmi Bhikadiya, Chunxiao Bi, Li Chen, Luigi Di Costanzo, Cole Christie, Ken Dalenberg, Jose M Duarte, Shuchismita Dutta, et al. Rcsb protein data bank: biological macromolecular structures enabling research and education in fundamental biology, biomedicine, biotechnology and energy. Nucleic acids research, 47(D1):D464–D474, 2019.
- [38] Keyong Du and Philip N Tsichlis. Regulation of the akt kinase by interacting proteins. Oncogene, 24(50):7401–7409, 2005.
- [39] Matt Addie, Peter Ballard, David Buttar, Claire Crafter, Gordon Currie, Barry R Davies, Judit Debreczeni, Hannah Dry, Philippa Dudley, Ryan Greenwood, et al. Discovery of 4-amino-n-[(1 s)-1-(4-chlorophenyl)-3-hydroxypropyl]-1-(7 h-pyrrolo [2, 3-d] pyrimidin-4-yl) piperidine-4-carboxamide (azd5363), an orally bioavailable, potent inhibitor of akt kinases. Journal of medicinal chemistry, 56(5):2059–2073, 2013.
- [40] David S Wishart, Yannick D Feunang, An C Guo, Elvis J Lo, Ana Marcu, Jason R Grant, Tanvir Sajed, Daniel Johnson, Carin Li, Zinat Sayeeda, et al. Drugbank 5.0: a major update to the drugbank database for 2018. Nucleic acids research, 46(D1):D1074–D1082, 2018.
- [41] Greg Landrum. Rdkit documentation. Release, 1(1-79):4, 2013.
- [42] Garrett M Morris, Ruth Huey, William Lindstrom, Michel F Sanner, Richard K Belew, David S Goodsell, and Arthur J Olson. Autodock4 and autodocktools4: Automated docking with selective receptor flexibility. Journal of computational chemistry, 30(16):2785–2791, 2009.
- [43] Stefano Piana, Kresten Lindorff-Larsen, Robert M Dirks, John K Salmon, Ron O Dror, and David E Shaw. Evaluating the effects of cutoffs and treatment of long-range electrostatics in protein folding simulations. PLoS One, 7(6):e39918, 2012.
- [44] Han Zhang, Tao Xu, Hongsheng Li, Shaoting Zhang, Xiaogang Wang, Xiaolei Huang, and Dimitris N Metaxas. Stackgan: Text to photo-realistic image synthesis with stacked generative adversarial networks. In Proceedings of the IEEE international conference on computer vision, pages 5907–5915, 2017.
- [45] Vijay Prakash Dwivedi and Xavier Bresson. A generalization of transformer networks to graphs. arXiv preprint arXiv:2012.09699, 2020.
- [46] Clement Vignac, Igor Krawczuk, Antoine Siraudin, Bohan Wang, Volkan Cevher, and Pascal Frossard. Digress: Discrete denoising diffusion for graph generation. arXiv preprint arXiv:2209.14734, 2022.
- [47] Martin Arjovsky, Soumith Chintala, and Léon Bottou. Wasserstein generative adversarial networks. In International conference on machine learning, pages 214–223. PMLR, 2017.
- [48] Ishaan Gulrajani, Faruk Ahmed, Martin Arjovsky, Vincent Dumoulin, and Aaron C Courville. Improved training of wasserstein gans. Advances in neural information processing systems, 30, 2017.
- [49] Guy W Bemis and Mark A Murcko. Properties of known drugs. 2. side chains. Journal of medicinal chemistry, 42(25):5095–5099, 1999.
- [50] Daniil Polykovskiy, Alexander Zhebrak, Benjamin Sanchez-Lengeling, Sergey Golovanov, Oktai Tatanov, Stanislav Belyaev, Rauf Kurbanov, Aleksey Artamonov, Vladimir Aladinskiy, Mark Veselov, et al. Molecular sets (moses): a benchmarking platform for molecular generation models. Frontiers in pharmacology, 11:565644, 2020.
- [51] Christopher A Lipinski, Franco Lombardo, Beryl W Dominy, and Paul J Feeney. Experimental and computational approaches to estimate solubility and permeability in drug discovery and development settings. Advanced drug delivery reviews, 64:4–17, 2012.
- [52] Daniel F Veber, Stephen R Johnson, Hung-Yuan Cheng, Brian R Smith, Keith W Ward, and Kenneth D Kopple. Molecular properties that influence the oral bioavailability of drug candidates. Journal of medicinal chemistry, 45(12):2615–2623, 2002.
- [53] Jonathan B Baell and Georgina A Holloway. New substructure filters for removal of pan assay interference compounds (pains) from screening libraries and for their exclusion in bioassays. Journal of medicinal chemistry, 53(7):2719–2740, 2010.
- [54] G Madhavi Sastry, Matvey Adzhigirey, Tyler Day, Ramakrishna Annabhimoju, and Woody Sherman. Protein and ligand preparation: parameters, protocols, and influence on virtual screening enrichments. Journal of computer-aided molecular design, 27(3):221–234, 2013.
- [55] Schrödinger, LLC. Schrödinger release 2022-3: Maestro. 2021.
- [56] Melissa F Adasme, Katja L Linnemann, Sarah Naomi Bolz, Florian Kaiser, Sebastian Salentin, V Joachim Haupt, and Michael Schroeder. Plip 2021: expanding the scope of the protein–ligand interaction profiler to dna and rna. Nucleic acids research, 49(W1):W530–W534, 2021.
- [57] Richard A Friesner, Robert B Murphy, Matthew P Repasky, Leah L Frye, Jeremy R Greenwood, Thomas A Halgren, Paul C Sanschagrin, and Daniel T Mainz. Extra precision glide: Docking and scoring incorporating a model of hydrophobic enclosure for protein- ligand complexes. Journal of medicinal chemistry, 49(21):6177–6196, 2006.
- [58] Schrödinger, LLC. The PyMOL molecular graphics system, version 2.4.1. November 2020.
- [59] Ahmet Sureyya Rifaioglu, Esra Nalbat, Volkan Atalay, Maria Jesus Martin, Rengul Cetin-Atalay, and Tunca Doğan. Deepscreen: high performance drug–target interaction prediction with convolutional neural networks using 2-d structural compound representations. Chemical science, 11(9):2531–2557, 2020.
- [60] Hyuna Sung, Jacques Ferlay, Rebecca L Siegel, Mathieu Laversanne, Isabelle Soerjomataram, Ahmedin Jemal, and Freddie Bray. Global cancer statistics 2020: Globocan estimates of incidence and mortality worldwide for 36 cancers in 185 countries. CA: a cancer journal for clinicians, 71(3):209–249, 2021.
- [61] Huajun Zhang, Wuyang Zhang, Longying Jiang, and Yongheng Chen. Recent advances in systemic therapy for hepatocellular carcinoma. Biomarker Research, 10(1):1–21, 2022.
- [62] Xiangyuan Luo, Mengdie Cao, Fan Gao, and Xingxing He. Ythdf1 promotes hepatocellular carcinoma progression via activating pi3k/akt/mtor signaling pathway and inducing epithelial-mesenchymal transition. Experimental hematology & oncology, 10(1):1–14, 2021.
- [63] Sameh Eid, Samo Turk, Andrea Volkamer, Friedrich Rippmann, and Simone Fulle. Kinmap: a web-based tool for interactive navigation through human kinome data. BMC bioinformatics, 18:1–6, 2017.
- [64] Gabriel Lima Guimaraes, Benjamin Sanchez-Lengeling, Carlos Outeiral, Pedro Luis Cunha Farias, and Alán Aspuru-Guzik. Objective-reinforced generative adversarial networks (organ) for sequence generation models. arXiv preprint arXiv:1705.10843, 2017.
- [65] Simiao Zuo, Xiaodong Liu, Jian Jiao, Young Jin Kim, Hany Hassan, Ruofei Zhang, Tuo Zhao, and Jianfeng Gao. Taming sparsely activated transformer with stochastic experts. arXiv preprint arXiv:2110.04260, 2021.
- [66] Jike Wang, Chang-Yu Hsieh, Mingyang Wang, Xiaorui Wang, Zhenxing Wu, Dejun Jiang, Benben Liao, Xujun Zhang, Bo Yang, Qiaojun He, et al. Multi-constraint molecular generation based on conditional transformer, knowledge distillation and reinforcement learning. Nature Machine Intelligence, 3(10):914–922, 2021.
- [67] Youngchun Kwon, Jiho Yoo, Youn-Suk Choi, Won-Joon Son, Dongseon Lee, and Seokho Kang. Efficient learning of non-autoregressive graph variational autoencoders for molecular graph generation. Journal of Cheminformatics, 11(1):1–10, 2019.
- [68] Laurens Van der Maaten and Geoffrey Hinton. Visualizing data using t-sne. Journal of machine learning research, 9(11), 2008.
- [69] David Rogers and Mathew Hahn. Extended-connectivity fingerprints. Journal of chemical information and modeling, 50(5):742–754, 2010.
- [70] Tunca Doğan, Heval Atas, Vishal Joshi, Ahmet Atakan, Ahmet Sureyya Rifaioglu, Esra Nalbat, Andrew Nightingale, Rabie Saidi, Vladimir Volynkin, Hermann Zellner, et al. Crossbar: comprehensive resource of biomedical relations with knowledge graph representations. Nucleic acids research, 49(16):e96–e96, 2021.
Supplementary Figures
![[Uncaptioned image]](/html/2302.07868/assets/x9.png)
![[Uncaptioned image]](/html/2302.07868/assets/x10.png)