A Case Study on Designing Evaluations of ML Explanations with Simulated User Studies
Abstract
When conducting user studies to ascertain the usefulness of model explanations in aiding human decision-making, it is important to use real-world use cases, data, and users. However, this process can be resource-intensive, allowing only a limited number of explanation methods to be evaluated. Simulated user evaluations (SimEvals), which use machine learning models as a proxy for human users, have been proposed as an intermediate step to select promising explanation methods. In this work, we conduct the first SimEvals on a real-world use case to evaluate whether explanations can better support ML-assisted decision-making in e-commerce fraud detection. We study whether SimEvals can corroborate findings from a user study conducted in this fraud detection context. In particular, we find that SimEvals suggest that all considered explainers are equally performant, and none beat a baseline without explanations – this matches the conclusions of the user study. Such correspondences between our results and the original user study provide initial evidence in favor of using SimEvals before running user studies. We also explore the use of SimEvals as a cheap proxy to explore an alternative user study set-up. We hope that this work motivates further study of when and how SimEvals should be used to aid in the design of real-world evaluations.
1 Introduction
The field of interpretable machine learning has proposed a large and diverse number of techniques to explain model behavior. However, it is difficult to anticipate exactly which explanations may help humans with a particular use case (Chen et al., 2022b; Davis et al., 2020). There have been calls for more human-centered approaches Wortman Vaughan & Wallach (2021); Liao & Varshney (2021) to investigate how humans benefit from explanations in specific use cases, particularly through user studies (Doshi-Velez & Kim, 2017). Ideally, these user studies would utilize real users, tasks, and data to maximize the applicability of the study’s findings (Amarasinghe et al., 2020). Since real-world user studies can be resource-intensive to conduct and thus typically only evaluate a limited number of explanation methods (or explainers), simulated user evaluations (SimEvals) have been proposed as a way to identify candidate explanation methods for user studies using machine learning models (Chen et al., 2022a). While the original work by Chen et al. (2022a) performed a cursory evaluation of SimEvals, it is unclear whether this approach would generalize to real-world use cases of explanations.
In this work, we focus on a real-world decision support use case where professional fraud analysts review e-commerce transactions to determine whether a transaction is fraudulent. We conduct the first SimEvals on a real-world task and data and compare the results to the findings from a user study with real-world users conducted by Amarasinghe et al. (2022) as shown in Figure 1. We instantiate SimEvals to study whether any of these explanations contained predictive information about whether a transaction was fraudulent and find no statistical difference in SimEval performance between the three explanation methods and a baseline SimEval without explanations. The results of this SimEval trial closely match the findings of Amarasinghe et al. (2022). Our results suggest that SimEvals could have helped to select better candidate explainers in the original user study, reducing its cost and improving its chance of locating a successful explainer. They also provide evidence that SimEval performance is associated with human performance across different explainers.
We also explore the use of SimEvals to cheaply identify an alternative study design beyond the canonical set-up where analysts are provided both the transaction and the explanation as shown in Figure 3. Our preliminary findings suggest that a subset of the explainers considered in the original study can be used as a human-centric dimensionality reduction technique (i.e., there is not statistically less signal in only presenting the explanation on its own) to reduce the time cost of processing a full transaction. To get an initial signal on the validity of this proposed design, we conduct short interviews with multiple fraud analysts and evaluate whether the information the analysts typically look for in a full transaction is present in the explanations used in the alternative study design.
In summary, this work explores two ways to utilize SimEvals in a real-world context. We believe that our comparative investigation of real and simulated user studies will serve as an example of using SimEvals more effectively.
2 Can SimEvals corroborate findings from real-world user study?
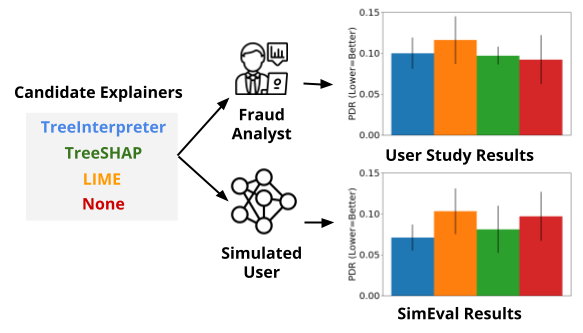
While initial results from prior work suggest that SimEvals can be used to identify promising explanations for user studies, there has been limited evaluation of its utility in real-world contexts. We conduct such an evaluation to see whether SimEvals confirm user study findings in a fraud detection use case. We first summarize the findings from the original study by Amarasinghe et al. (2022) in this use case and then discuss how to instantiate and train a SimEval for each explanation method in the study. Figure 1 summarizes the findings of this section.
2.1 Prior findings from real-world user study
The user study by Amarasinghe et al. (2022) investigated the real-world application of detecting financial fraud.111Note that this use case was studied by both Amarasinghe et al. (2022) and an earlier study by Jesus et al. (2021). We chose to compare our SimEvals with findings from the more recent user study because it improved the experimental design in multiple ways to be more representative of the real-world use case. In the fraud detection use case, a machine learning model is trained to estimate which is the probability that a given transaction was actually fraud given a piece of transaction data . The user study introduced an explanation of the model for a given transaction to the fraud analysts, hypothesizing that this additional information could improve decision outcomes and speed. Specifically, each is a sparse vector which contains feature importance for the top-6 highest magnitude importance features for a given transaction and model and 0 otherwise. To decide whether was fraudulent, analysts were given the transaction (which had 112 features), the explanation , and the model score . In addition, there were two baseline arms in which the analysts were given only or to predict fraud.
Analysts in the study were shown 500 transactions for each of three different explainers (LIME (Ribeiro et al., 2016), TreeSHAP (Lundberg & Lee, 2017), TreeInterpreter (Saabas, 2015)) and for each baseline arm. Amarasinghe et al. (2022) proposed a metric called Percent Dollar Regret (PDR) to better reflect operational goals. PDR measures the amount of revenue lost due to incorrect decisions relative to what would be realized if all the reviewed transactions were perfectly classified:
| (1) |
The more detailed equation is found in Amarasinghe et al. (2022). Given this set-up, the main findings of the experiment were: (1) No explanation improved analyst performance in terms of PDR over the baseline of showing analysts the model score only; (2) There was no statistical difference in analyst performance between the three explanation methods. In this work, we evaluate SimEvals for both claims to determine whether there was predictive information in any of the explanations that did not translate to improved analyst performance.
2.2 Setting up SimEvals to reflect user study
SimEvals are ML models trained to predict the ground truth label (e.g., whether a transaction is fraud) given the same information that would be presented in a user study. Specifically, the information in the user study can be represented by the tuple , where the explainer was either TreeInterpreter, LIME, TreeSHAP, or in the baseline case, no explanation and the predicted probability of fraud by . Each SimEval model corresponds to one candidate explanation method. Validation set PDR is used to evaluate SimEvals. As noted in Chen et al. (2022a), SimEvals do not aim to replicate a user’s decision-making process and their results should be interpreted as measures of the predictive power of their given explanations.
Each SimEval was trained and evaluated on total transactions, which were split into train and validation transactions. The transactions in each split were chosen to match the ones shown to the analysts in the original user study to reduce the impact of the validation set choice on final conclusions. Note that this means the validation split is not the same across different explainers because different transactions were shown to the analysts across different arms of the experiment to avoid showing repeated transactions, as shown in Figure 2. However, we verified that the different training and validation splits followed roughly the same distribution. To select a family of SimEval models, we ran a hyperparameter grid search over the parameters in Table 5. We found that the best validation performance was achieved using a Random Forest model with a minimum of 5 samples per leaf node. We use this as the base model family for SimEvals in the remaining experiments.
2.3 Checking for parroting
One unique challenge of decision support use cases like the fraud detection one we consider is the similarity of information provided to users (e.g., the , the model prediction for ) and the output that the analysts aimed to predict. An effective degenerate strategy emerges for the corresponding SimEval model to simply apply a threshold to . A SimEval model which parrots in this manner will disregard the explainers entirely. When we compare the Original Model results with SimEvals in Table 1, we find that all explanations improved in PDR when explainers were included, suggesting that the SimEvals could not have utilized only when making predictions.
| Original Model | SimEvals | Analyst | |
|---|---|---|---|
| TreeInterpreter | 0.102 (0.075, 0.121) | 0.071 (0.054, 0.087) | 0.100 (0.081, 0.119) |
| LIME | 0.164 (0.099, 0.226) | 0.103 (0.061, 0.131) | 0.116 (0.087, 0.145) |
| TreeSHAP | 0.109 (0.078, 0.142) | 0.081 (0.052, 0.105) | 0.097 (0.078, 0.116) |
| Model Score | 0.133 (0.082, 0.172) | 0.097 (0.047, 0.127) | 0.092 (0.068, 0.112) |
2.4 Comparing SimEvals to user study findings
To evaluate whether SimEvals can corroborate user study findings, we test whether or not the inclusion of explanations generated by any explainer yields higher SimEval PDR as compared to a baseline SimEval trained without explanations. We present both the aggregate SimEval PDR scores across the validation set for each explainer, which is equivalent to the metric from the user study, as well as a transaction-based analysis where we compare SimEval predictions on individual instances with analyst predictions. A high correspondence on individual transactions would suggest that SimEvals make decisions in a way that is similar to the analysts.
Comparison of aggregate performance. In Table 1, we compared SimEvals to the aggregate analyst performance as found in Amarasinghe et al. (2022). The SimEval results show that the overlap in the actual information provided to the analysts across explanations are roughly the same (noting the error bars in the SimEvals column), which supports the general finding from Amarasinghe et al. (2022) that all explainers lead to comparable performance as the baseline (noting the error bars in the Analyst column). Additionally, while not statistically significant, we do observe that both TreeInterpreter and TreeSHAP allowed both SimEvals and analysts to achieve lower PDR compared to LIME.222Our reproduced analyst PDR for only the model score case differed slightly from the result found in Amarasinghe et al. (2022) (0.092 vs. 0.089). This could be due to different choices in the exclusion of “warm-up” samples or a discrepancy in data preprocessing. We suspect that this difference only appeared in the model score case because this data was stored in a separate database than in the other experimental arms.
Comparison on individual transactions. We performed an analysis on the association between analyst and SimEval predictions on individual transactions. Table 2 shows the ROC AUC when using SimEval output as an estimate of the probability that an analyst predicted a given transaction to be fraud. This analysis yielded results which were significantly above 0.5, indicating some association. However, this association was not significantly stronger than when using predictions from the fraud model () as an estimate for analyst predictions directly, implying SimEvals are may not be as informative at the individual transaction level.
| Original Model | SimEvals | |
|---|---|---|
| TreeInterpreter | 0.734 | 0.727 |
| LIME | 0.695 | 0.675 |
| TreeSHAP | 0.703 | 0.731 |
2.5 Discussion & Limitations
Since SimEvals corroborate findings from the user study, we believe the original study could have benefited from running SimEvals to potentially select better explanation methods before conducting a full user study. However, we emphasize that it is not a replacement for running actual user studies. The aggregate analysis only provides an estimate of which explainers have the highest performance with no guarantee of how large the difference will actually be in a user study. In particular, we might expect more divergence between human and SimEval behavior for a few potential reasons: outside domain knowledge is especially important and the analysts lack the time to carefully examine each piece of information as a model would. This divergence is reflected in the modest association between human and SimEval predictions shown in Table 2. Although SimEvals are intended to find predictive information in explanations, it is possible that our choice of base model family or learning procedure may fail to extract this information. We also note that only the aggregate analysis is possible to conduct before running a user study, whereas the transaction-level comparison is only possible after a user study has already been run.
3 Using SimEvals to guide new hypotheses
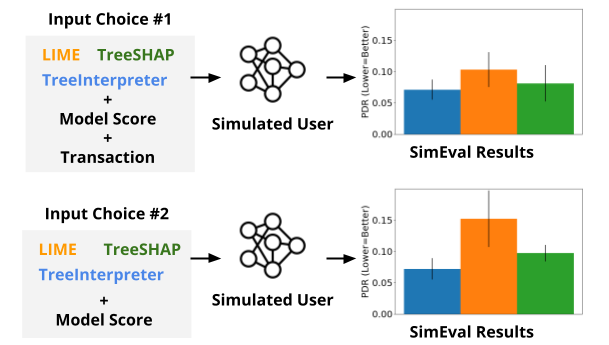
Once SimEvals are set up for a use case, it is easy to vary the parameters of the set-up, which include the choice of inputs. In particular, we explore whether SimEvals would perform as well when was excluded from the input (i.e., we train SimEvals models in the same way as described in Section 2.2 using as the inputs). Since is trained on , we hypothesized that it may be redundant to include . When comparing the canonical SimEval models with ones that exclude , we find that two of the three explainers (TreeInterpreter and TreeSHAP) had only a small performance boost while LIME’s performance gap was statistically significant as shown in Table 3. This finding suggests providing analysts only for TreeInterpreter and TreeSHAP explainers could reduce the time an analyst spends on each transaction with minimal loss in information content. We summarize this line of analysis in Figure 3. Recall that the visualization of each explanation only shows the top 6 features out of 112.
| SimEvals excluding | SimEvals | |
|---|---|---|
| TreeInterpreter | 0.072 (0.049, 0.089) | 0.071 (0.054, 0.087) |
| LIME | 0.152 (0.124, 0.197) | 0.103 (0.061, 0.131) |
| TreeSHAP | 0.097 (0.076, 0.120) | 0.081 (0.052, 0.105) |
To evaluate whether a set-up in which analysts are only shown may be justified, we perform some initial verification with the analysts. In particular, we investigate whether the features used in across different transactions have reasonable alignment with features that analysts think are important because it may be unnatural for the analysts to see only explanations consisting of features which they would not typically use.
3.1 Identifying which features are important to the analysts
To obtain analyst’s perceived feature importances, we conducted brief interviews with analysts from the original user study by Amarasinghe et al. (2022). In the interview, we asked analysts to fill out a spreadsheet, where they were asked to rank the importance of each feature in a transaction. They were asked to do this with the context which contained a row for each feature in a transaction. There was also a column for each potential “transaction reason", where each reason could be considered as a fraudulent or a legitimate concept (e.g., a suspicious address is a justification for fraud). For each “transaction reason”, analysts were asked to rank the importance of each feature on a scale of 0-4, where 0 corresponded to the feature being unimportant and 4 corresponded to the feature being most important. To compute a feature alignment, we average over all of the analyst scores. For each analyst indexed by , we refer to their provided importances as which maps a transaction and the th feature of an explanation to a value ranging from 0 to 4. If a transaction had multiple reasons labeled to it, we would select the reason that gave it the maximum score. We use the following formula to compute the average feature alignment (AVG FA) for a given explainer :
| (2) |
where in our setting, the number of features in an explanation , which is the number of non-zero features in the sparse explanation, and the number of analysts . An explainer with a higher AVG FA value means that it uses features that align more with analyst priors.
3.2 Feature Alignment Results
| Fraudulent Concepts | Legitimate Concepts | |
|---|---|---|
| TreeInterpreter | 2.21 (2.09, 2.37) | 1.28 (1.26, 1.29) |
| LIME | 2.05 (1.95, 2.15) | 1.22 (1.21, 1.23) |
| TreeSHAP | 2.15 (2.02, 2.32) | 1.22 (1.20, 1.23) |
As shown in Table 4, we find that particularly for Fraudulent Concepts, there is higher feature alignment, AVG FA, for both TreeInterpreter and TreeSHAP compared to LIME. This aligns with Table 3 where we found that TreeInterpreter and TreeSHAP outperformed LIME for SimEvals excluding . One potential reason for why LIME has higher PDR and lower AVG FA is because the same feature appears more often in the LIME explanation compared to the two other explainers (as shown in Table 7). Given the explanations are sparsely populated, an explanation which consistently ranks one feature as being important would likely be less useful in distinguishing fraudulent from legitimate transactions. These trends do not hold for Legitimate Concepts. Interviews with analysts revealed that explainers’ AVG FA scores for legitimate transactions were significantly lower across the board because all features could be considered to be similarly important when the transaction is legitimate. The fact that analysts consider all features somewhat important for legitimate transactions might mean that any drastic dimensionality reduction may be unnatural. However, it is possible that analysts can adapt to this set-up over time. These results provide mixed evidence for the use of explainers as a dimensionality reduction technique, though a user study would be necessary to evaluate its benefits and drawbacks.
4 Conclusion
We conduct the first comparison of SimEvals against existing user study findings for the real-world use case of decision support for fraud detection. We find that SimEvals results generally agreed with findings from the user study by Amarasinghe et al. (2022), which is that there was no statistical difference in predictiveness of fraud between the three explanation methods considered, despite limited statistical power due to sample size. This finding suggests that SimEvals could have been used to identify better choices of explainers for the use case and provides additional evidence in favor of using SimEvals before running expensive user studies. Furthermore, we use SimEvals to evaluate new hypotheses and find promising evidence in favor of using explanations as a dimensionality reduction technique. We hope this work serves as a guideline to illustrate the potential uses of SimEvals in real-world contexts both as a way to both verify whether candidate explanation methods are predictive of a use case as well as to explore experimental design set-ups.
References
- Amarasinghe et al. (2020) Kasun Amarasinghe, Kit Rodolfa, Hemank Lamba, and Rayid Ghani. Explainable machine learning for public policy: Use cases, gaps, and research directions. arXiv preprint arXiv:2010.14374, 2020.
- Amarasinghe et al. (2022) Kasun Amarasinghe, Kit T Rodolfa, Sérgio Jesus, Valerie Chen, Vladimir Balayan, Pedro Saleiro, Pedro Bizarro, Ameet Talwalkar, and Rayid Ghani. On the importance of application-grounded experimental design for evaluating explainable ml methods. arXiv preprint arXiv:2206.13503, 2022.
- Chen et al. (2022a) Valerie Chen, Nari Johnson, Nicholay Topin, Gregory Plumb, and Ameet Talwalkar. Use-case-grounded simulations for explanation evaluation. arXiv preprint arXiv:2206.02256; NeurIPS, 2022a.
- Chen et al. (2022b) Valerie Chen, Jeffrey Li, Joon Sik Kim, Gregory Plumb, and Ameet Talwalkar. Interpretable machine learning: Moving from mythos to diagnostics. Queue, 19(6):28–56, 2022b.
- Davis et al. (2020) Brittany Davis, Maria Glenski, William Sealy, and Dustin Arendt. Measure utility, gain trust: practical advice for xai researchers. In 2020 IEEE Workshop on TRust and EXpertise in Visual Analytics (TREX), pp. 1–8. IEEE, 2020.
- Doshi-Velez & Kim (2017) Finale Doshi-Velez and Been Kim. Towards a rigorous science of interpretable machine learning. arXiv preprint arXiv:1702.08608, 2017.
- Jesus et al. (2021) Sérgio Jesus, Catarina Belém, Vladimir Balayan, João Bento, Pedro Saleiro, Pedro Bizarro, and João Gama. How can i choose an explainer? an application-grounded evaluation of post-hoc explanations. In Proceedings of the 2021 ACM Conference on Fairness, Accountability, and Transparency, FAccT ’21, pp. 805–815, New York, NY, USA, 2021. Association for Computing Machinery. ISBN 9781450383097. doi: 10.1145/3442188.3445941. URL https://doi.org/10.1145/3442188.3445941.
- Liao & Varshney (2021) Q Vera Liao and Kush R Varshney. Human-centered explainable ai (xai): From algorithms to user experiences. arXiv preprint arXiv:2110.10790, 2021.
- Lundberg & Lee (2017) Scott M Lundberg and Su-In Lee. A unified approach to interpreting model predictions. In Proceedings of the 31st international conference on neural information processing systems, pp. 4768–4777, 2017.
- Ribeiro et al. (2016) Marco Tulio Ribeiro, Sameer Singh, and Carlos Guestrin. " why should i trust you?" explaining the predictions of any classifier. In Proceedings of the 22nd ACM SIGKDD international conference on knowledge discovery and data mining, pp. 1135–1144, 2016.
- Saabas (2015) Ando Saabas. Interpreting random forests, Aug 2015. URL http://blog.datadive.net/interpreting-random-forests/.
- Wortman Vaughan & Wallach (2021) Jennifer Wortman Vaughan and Hanna Wallach. A human-centered agenda for intelligible machine learning. In Marcello Pelillo and Teresa Scantamburlo (eds.), Machines We Trust: Perspectives on Dependable AI. MIT Press, 2021.
Appendix A Additional Figures
| Hyperparameter | Possible Values |
|---|---|
| Model Family | Random Forest / Decision Tree |
| Minimum Samples at Leaf | 5 / 10 / 15 / 20 / 25 / 30 |
| Analyst Decision | approved | declined | suspicious |
|---|---|---|---|
| Simulated User Prediction | |||
| False | 0.0650, N=354 | 0.1111, N=045 | 0.0000, N=007 |
| True | 0.3962, N=053 | 0.6562, N=032 | 0.5714, N=007 |
| Analyst Decision | approved | declined | suspicious |
|---|---|---|---|
| Simulated User Decision | |||
| False | 0.0729, N=384 | 0.1471, N=034 | 0.2857, N=007 |
| True | 0.4286, N=042 | 0.6296, N=027 | 0.6667, N=006 |
| Analyst Decision | approved | declined | suspicious |
|---|---|---|---|
| Simulated User Decision | |||
| False | 0.0877, N=365 | 0.0750, N=040 | 0.2222, N=009 |
| True | 0.3000, N=050 | 0.6897, N=029 | 0.4286, N=007 |
| Variance | Number of Unique Features (out of 112) | |
|---|---|---|
| TreeInterpreter | 0.006 | 104 |
| LIME | 0.030 | 31 |
| TreeSHAP | 0.015 | 89 |