Spatially resolved dust properties and quasar-galaxy decomposition of \textcolorblacka HyLIRG at \textcolorblack
Abstract
We report spatially resolved dust properties of the quasar host galaxy BRI 1335-0417 at redshift constrained by the ALMA observations. The dust temperature map, derived from a greybody fit to rest-frame 90 and 161 m continuum images, shows a steep increase towards the centre, reaching K \textcolorblackand a flat median profile at the outer regions of 38 K. Image decomposition analysis reveals the presence of a point source in both dust continuum images \textcolorblackspatially coincident with the highest temperature peak and the optical quasar position, which we attribute to warm dust heated by an active galactic nucleus (AGN). We show that a model including this warm component along with cooler dust heated by star formation describes the global SED better than a single component model, with dust temperatures of 87.1 K (warm component) and 52.6 K (cold component). The star formation rate (SFR) estimated from the cold dust component is yr-1, a factor of three smaller than previous estimates due to a large AGN contribution (%). The unresolved warm dust component also explains the steep temperature gradient, as the temperature profile derived after the point source subtraction is flat. The point source subtraction also reduces the estimated central SFR surface density by over a factor of three. With this correction, spatially resolved measurements of and the surface gas mass density form a roughly linear sequence in the Kennicutt-Schmidt diagram with a constant gas depletion time of 50-200 Myr. \textcolorblackThe demonstrated AGN-host galaxy decomposition reveals the importance of spatially resolved data for accurate measurements of quasar host galaxy properties, including dust temperature, star-formation rates, and size.
keywords:
quasars: individual — galaxies: starburst — galaxies: ISM — galaxies: disc — galaxies: spiral — galaxies: bulges1 Introduction
Star formation activity in the Universe peaked at redshift marking a critical stage of galaxy formation (Shapley, 2011; Madau & Dickinson, 2014), during which more massive galaxies are thought to form their stellar mass earlier (Renzini, 2006). Hyper-luminous infrared galaxies (HyLIRGs, defined as galaxies with ) are among the most extreme galaxies found during this epoch, and are thought to host star formation rates (SFR) of over . Such objects are suggested to form a majority of stellar mass in the most massive elliptical galaxies in the local Universe over 100 Myr (Narayanan et al., 2015). This extraordinary phase of star formation and subsequent quenching largely decides the fate of early forming massives galaxies and their central black holes \textcolorblack(BH). In this context, it represents the most important life event of massive galaxy formation. However, we do not yet understand the detailed driving mechanism of this extreme phase of star formation.
One possibility is the gas-rich major merger paradigm, which suggests dynamic evolution of the system with rapid gas infall towards the centre driven by collisions or external gravitational torques of merging galaxies (Sanders & Mirabel, 1996). The rapid radial inflow then triggers a nuclear starburst and feeds gas onto the central black hole activating an active galactic nucleus (AGN). The initially dust-obscured AGN removes gas and dust within Myr after the peak SFR (Hopkins, 2012; Davies et al., 2007), at which point the AGN becomes visible as an optical quasar (Hopkins et al., 2008a, b). The powerful winds driven by the AGN and the burst of star formation eventually eject the remaining galactic gas and prevent subsequent accretion, leading to the rapid cessation of star formation (Silk & Rees, 1998; Somerville & Davé, 2015). An alternative to gas-rich major mergers suggested by recent studies is that continuous rapid accretion of gas and satellite galaxies from the large gas reservoir of the cosmic web makes an important contribution to fueling starbursts and the growing black holes (Umehata et al., 2019; Mitsuhashi et al., 2021; McAlpine et al., 2019). Large gas fractions produced by rapid accretion cause the galactic disk to become gravitationally unstable and form non-axisymmetric substructures (such as clumps, a bar, or spiral arms; Hodge et al. 2019), which provide gravitational torques to transfer angular momentum and induce a further inflow of gas (violent disk instability; Dekel & Burkert, 2014; Inoue et al., 2016).
In either scenario, the formation of the central black hole and the buildup of stellar mass in the surrounding galaxy are co-regulated, with AGN and star formation feedback acting together to produce the observed tight correlation between central black hole masses and host galaxy properties such as central velocity dispersion and bulge stellar luminosity (e.g., Magorrian et al., 1998; Ferrarese & Merritt, 2000; Gebhardt et al., 2000). This remarkably tight correlation may encapsulate a fossil record of their co-evolution (Kormendy & Ho, 2013). Early, rapidly evolving galaxies at redshift are presumably on their way to establishing this BH-host relationship (Izumi et al., 2019; Pensabene et al., 2020). Studying them, therefore, provides an important probe of the interconnection of AGN and the surrounding star formation.
Our understanding of such starburst galaxies111\textcolorblackStarburst galaxies are commonly referred to galaxies which exhibit the star formation rate three or four times above the tight star formation rate - stellar mass relation which majority of starforming galaxies form (e.g., Elbaz et al., 2011; Rodighiero et al., 2011; Schreiber et al., 2015). is primarily based on their star formation rate. This quantity has been derived by assuming the measured far-infrared (FIR; ) emission is mainly due to the cold dust component heated by young massive stars with negligible contribution from the warm dust component heated by AGN (which typically dominates at rest-frame mid-infrared, MIR, ; Mullaney et al. 2011; Hönig & Kishimoto 2017; Stalevski et al. 2016). FIR photometric data are \textcolorblackusually fitted with greybody functions to constrain the dust mass \textcolorblack, temperature \textcolorblack, \textcolorblackand the power-law slope at a longer wavelength (opacity index ), which together determine the functional shape. The total infrared (TIR) luminosity is then derived by integrating the function over the wavelength range of 8 to 1000 , and the star formation rate is derived using an to SFR calibration (Kennicutt, 1998). If there are photometric data points available over rest-frame MIR to FIR, the standard procedure is to decompose the SED into warm and cold dust components by multi-component SED fitting and to estimate the SFR after removing the contribution from the warm dust presumably heated by AGN (e.g., Farrah et al., 2003; Kirkpatrick et al., 2012; Leipski et al., 2014; Kokorev et al., 2021).
However, uncertainty regarding the potential contribution of AGN heating to has hindered the understanding the exact nature of high-redshift starburst galaxies. There is growing observational evidence that the AGN contribution to is not negligible in all galaxies, but instead increases with total galactic luminosity (Alonso-Herrero et al., 2012; Nardini et al., 2010; Yuan et al., 2010; Stanley et al., 2017). Therefore, particularly for the brightest population of HyLIRGs, the nature of the heating source for the thermal dust radiating at FIR wavelengths remains an open question (McKinney et al., 2021; Di Mascia et al., 2023) — does the AGN dominate only for the central region? or does it heat the entire galaxy? (Symeonidis & Page, 2021). To date, most attempts to separate these components have relied on spatially unresolved data, for which estimates of the AGN contribution depend on assumptions (e.g., spectral templates) made during SED modelling. Solving the problem requires a thorough investigation of spatially resolved dust properties (e.g., temperature, mass, and optical depth) and spatial separation of the star formation-dominated host galaxy from the AGN-dominated central region. The need for spatially-resolved studies is underscored by the case of the heavily obscured nearby galaxy Arp 220, for which a significant fraction of (33%) originates from a compact region with a dust temperature of K and a radius of 15 pc, suggesting a significant AGN contribution to (Scoville et al., 2017).
Spatially resolved measurements such as those for Arp 220 are \textcolorblackhowever challenging at high redshift. Deriving the temperature distribution as a function of position requires multiple continuum band images near the greybody peak. The most commonly-used instruments for studying the thermal dust properties in the previous decade were the Herschel \textcolorblackSpace Observatory (Herschel) photometers PACS (from 70 to 160 microns) and SPIRE (from 250 to 500 microns), which provided a spatial resolution (FWHM = 36 arcsec) sufficient only to resolve nearby galaxies (Galametz et al., 2012). Recently, however, the Atacama Large Millimeter/submillimeter Array (ALMA) has started to provide frequency coverage near the peak of the greybody function for galaxies) with enough angular resolution to permit spatially-resolved analysis. While spatially resolved pixel-by-pixel temperature maps for such high redshift galaxies are now attainable in principle, they have not been achieved so far in practice\textcolorblack. This is mainly because high angular resolution observations with a sufficient signal-to-noise ratio in at least two frequency bands222\textcolorblackStrictly speaking, only two bands are not sufficient to constrain the three physical parameters of the greybody function, , temperature , and opacity index . However, tight constraints can be obtained by assuming the typical opacity index or choosing two bands near the peak of the spectrum which are sensitive to the dust temperature and insensitive to the . are demanding even with ALMA for relatively faint high-redshift galaxies\textcolorblack. A few exceptions exist where authors have constrained the temperature gradient within individual galaxies: Shao et al. (2022) derive 1D radial profiles of the dust temperature, mass, and optical depth for a quasar host galaxy at redshift \textcolorblackusing azimuthally averaged profiles at two FIR continuum bands\textcolorblack, while Akins et al. (2022) derive a pixel-by-pixel temperature map, which shows evidence for a temperature gradient, in a strongly lensed star-forming galaxy at redshift .
In this paper, we deriv\textcolorblacke spatially-resolved temperature maps for BRI1335-0417, a quasar host galaxy at a redshift of \textcolorblack(Guilloteau et al., 1997), 1.4 Gyr after the Big Bang. This galaxy is one of the brightest unlensed submillimeter sources known at (Jones et al., 2016), and is classified as a HyLIRG with an extraordinary infrared luminosity of (Carilli et al., 2002). It was originally identified as an optical QSO by optical imaging and spectroscopy from the Automatic Plate Measuring survey (Irwin et al., 1991; Storrie-Lombardi et al., 1996). The optical QSO position is RA deg, Dec deg (ICRS) (Gaia Collaboration et al., 2016, 2021). The galaxy hosts a black hole with a mass suggested to be , shining at of its Eddington luminosity (Shields et al., 2006). The star formation rate of the galaxy was estimated to be \textcolorblack yr-1 from modelling of the spatially-unresolved spectral energy distribution (SED) with thermal dust and synchrotron emission components (Wagg et al., 2014), a rate high enough to deplete its total molecular gas reservoir of yr-1 \textcolorblackestimated by CO(2-1) line observation (Jones et al., 2016) in only 20 Myr.
Although such short depletion times are commonly attributed to gas-rich major mergers, the morphology and kinematics of the galaxy appear to be inconsistent with this scenario. Spatially resolved [C ii] and dust continuum observations ( 1.3 kpc resolution) show clear evidence for a rotating disk and spiral morphology (Tsukui & Iguchi, 2021) with a further analysis of the gas motion indicating the presence of a compact mass structure in the centre of the galaxy. Indeed, BRI 1335-0417 is the highest-redshift galaxy thus far to show a spiral morphology. The spiral structure is visible in [C ii] line and dust emission, indicating \textcolorblackongoing star formation. BRI 1335-0417 is not the only extremely luminous high redshift galaxy to show a surprisingly quiet and well-ordered morphology. Contrary to earlier views that cold disks and spirals only begin to appear at (Elmegreen & Elmegreen, 2014), ALMA and JWST observations now suggest a surprisingly earlier epoch of galaxy settling at , with cold gas disks found at (ALMA; Neeleman et al., 2020; Rizzo et al., 2020, 2021; Lelli et al., 2021; Tsukui & Iguchi, 2021), stellar spiral structure detected in passive galaxies at (JWST; Fudamoto et al., 2022), and grand design barred spirals already in place at 2 (JWST; Guo et al., 2022).
This contradiction between the ultra-short depletion time and the morphology of BRI 1335-0417 suggests that it is worth revisiting the high SFR previously estimated from an unresolved SED by using the spatially-resolved data to which we now have access. Doing so may provide insight not just on this particular source, but more broadly on the driving mechanism of high- starburst\textcolorblacks, early build-up of black holes and stellar bulges, and evolutionary links from the cold gas disks at to stellar spirals at . With this motivation in mind, this paper aims to (1) derive a resolved dust temperature map and clarify the heating source of the dust, (2) separate the warm dust heated by AGN and cold dust associated with the host galaxy and (3) study the star formation rate distribution under the effects of the central quasar in BRI 1335-0417. We present new Band 9 \textcolorblack() and Band 4 \textcolorblack() ALMA observations in addition to the earlier Band 7 \textcolorblack() data presented in (Tsukui & Iguchi 2021; PI=González López, Jorge). Multiple continuum images provide a number of resolution elements over the galaxy, making it possible to investigate the spatially resolved physical properties of dust (such as temperature and optical depth.) The paper is organized as follows. In Section 2, we describe the observation\textcolorblacks and the data reduction. In Section 3, we present the results of dust SED modelling applied to each pixel of the spatially resolved continuum images. In Section 4, we describe our image decomposition method (point source and host galaxy) followed by the panchromatic SED modelling of BRI 1335-0417 with the help of the decomposition results. In Section 5, we present the discussion of the result. In Section 6, we summarize and conclude the paper.
Throughout the paper, we adopt a flat lambda cold dark matter (CDM) cosmology with a present-day Hubble constant km s-1 Mpc-1, and a density parameter of pressureless matter , providing an angular size distance Mpc and a luminosity distance Mpc at the redshift of 4.4074.
2 Observations and Data reduction
black
2.1 ALMA imaging
ALMA Band 4, Band 7, and Band 9 observations of BRI 1335-0417 were carried out as part of the programs #2017.1.00394.S, and #2018.1.01103.S (PI=González López, Jorge). These observations targeted emission lines, including CO(7-6) (Band 4) and [C ii] (Band 7), along with underlying continuum emission at observing wavelength 2080 in Band 4, 869 in Band 7, and 484 in Band 9, corresponding to rest-frame 385 , 161 , 90 , respectively. We performed standard calibration and data reduction using the Common Astronomy Software Application (casa; CASA Team et al. 2022) pipeline333We used the same casa version as used in the quality assurance at the ALMA Observatory, which is 5.1.1-5 for Band 7, and 5.4.0-70 for Band 4 and Band 9 data. The flux and bandpass were calibrated using the quasars J1337-1257 for Band 4 and Band 7, and J1256-0547 for Band 9 data. The phase was calibrated using the quasars J1332-0509 for Band 4 and J1336-0829 for Band 7 and Band 9. We identified line-free channels using the hif_findcont task in casa and additionally removed channels affected by atmospheric absorption. We estimated the flux density of the underlying continuum emission by fitting a linear function to the identified line-free channels and subtracted it from the data cube in the visibility plane. We then imaged the line-free channels to produce continuum images and the continuum-subtracted data to produce emission line cubes. The visibility data were weighted using a Briggs weighting scheme with a robust parameter of 1.0 for the CO(7-6) line data cube to improve the sensitivity and 0.5 for others, which provides a good compromise of spatial resolution and sensitivity (Briggs, 1995). The resulting images and cube information such as angular resolution and point source sensitivity are summarized in Table 1. The emission line flux maps are made by summing the velocity channels from to 400km s-1. The mean velocity and the velocity dispersion of the emission line are extracted by fitting a single Gaussian to the spectrum at each pixel. We only use pixels where the signal is detected more than 4 over at least 4 channels.
In this paper, the same phase centre and pixel size are used to image the visibility data so that all data products have the same pixel coordinates, with absolute positional accuracy of 10 to 20 mas.444ALMA Technical Handbook https://almascience.nrao.edu/documents-and-tools/cycle9/alma-technical-handbook Before deriving the physical parameters using two or more images (e.g., dust SED modelling), we convolved images to have the same spatial resolution with the smallest common beam size, using common_beam in the spectral-cube package. We similarly convolve all other data products to the same resolution, so that physical parameters derived (e.g., velocity dispersions derived from emission line cubes) are resolution-matched. The matched resolution of the [Cii] cube, rest-frame 161 , and 90 continuum images is 0.21"0.18" at P.A.=114 deg (beam area of 1.92 kpc2, and effective radius of 0.78kpc). \textcolorblackAnalysis and visualisation of data in this paper are done at this resolution except for the radial profile analysis carried out in Section 3.5, which includes the poorer resolution CO(7-6) data. For the comparison with CO(7-6) all data are convolved to the common resolution of 0.24"0.18" at P.A.=94 deg (beam area of 2.3 kpc2 and effective radius of 0.85kpc). \textcolorblackThe effects of the beam on our spatially resolved SED analysis are also discussed in Section 3.7.
| Data | Rms noise | Synthesized beam | Subtended area per beam | Rms noise in SFR |
|---|---|---|---|---|
| (Jy beam-1) | maj(")/min(")/P.A.(deg) | kpc2 beam-1 | yr-1 kpc-2 | |
| (Band 4) | 6.58 | 0.21/0.14/85 | 1.52 | 11.8 |
| (Band 7) | 25.9 | 0.19/0.16/75 | 1.56 | 7.5 |
| (Band 9) | 186 | 0.21/0.16/-53 | 1.69 | 5.4 |
| 389 | 0.19/0.16/82 | 1.59 | - | |
| CO(7-6) | 101 | 0.23/0.16/84 | 1.93 | - |
2.2 \textcolorblackHST imaging
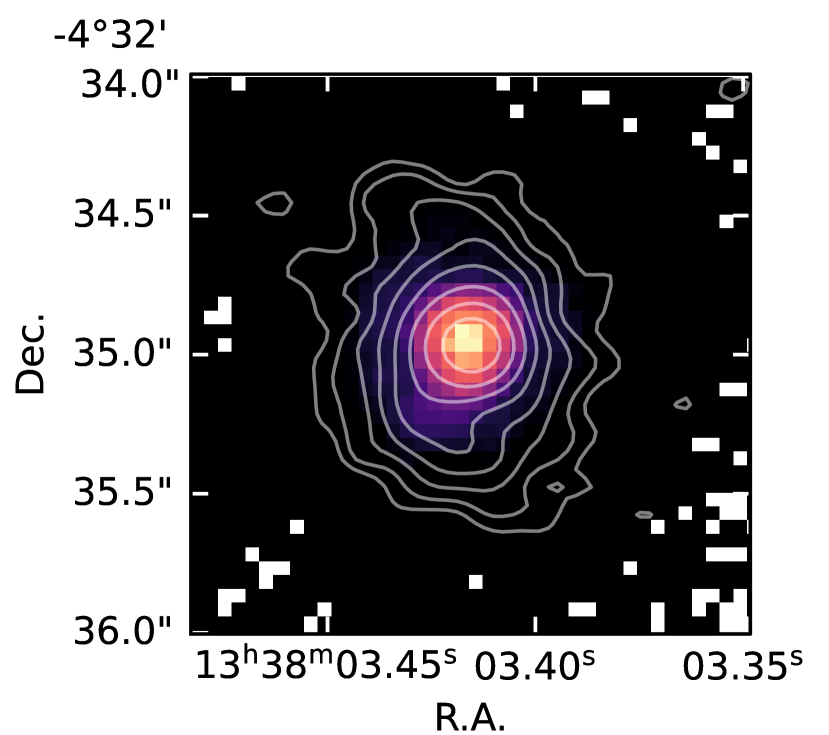
blackWe retrieved the STIS/50CCD image of BRI 1335-0417 from the Hubble Space Telescope (HST) archive. The data were taken as a part of program GO-8572 (PI=L. Storrie-Lombardi) in January 2001, consisting of the four dither exposures with each integration time of 645s. The detector has broad sensitivity from 2000 to 10300Å. Therefore, we only use the data for visualization purposes to assist the interpretation of the other optical photometric data of the galaxy shown in Table A.1. We processed the fully calibrated sub-exposure images from the HST archive applying the geometrical distortion and world coordinate system (WCS) corrections, and then drizzling onto the final pixel grid with the pixel size of 0.05". The target acquisition is based on the Guide Star Catalog GSC 1.0, which is expected to have a pointing accuracy of 1-2" in worst cases. We calibrate the pointing offset of the image by translation to match the image peak of the BRI 1335-0417 to the corresponding Gaia coordinate. We identify the BRI 1335-0417 in the image using three Gaia sources available in the field of view, including BRI 1335-0417. The calibrated offset length of 0.8" is within the expected pointing accuracy. Figure 1 shows the 50CCD image overlaid with the contours of the ALMA Band 7 continuum image. The optical image is consistent with the point source emission from the AGN (see Fig. A.1 for a comparison of the radial distribution of the emission and the point spread function). In contrast, the ALMA Band 7 image clearly resolves the extended host galaxy.
3 Spatially resolved dust properties
3.1 The resolved FIR continuum and [C ii] emission
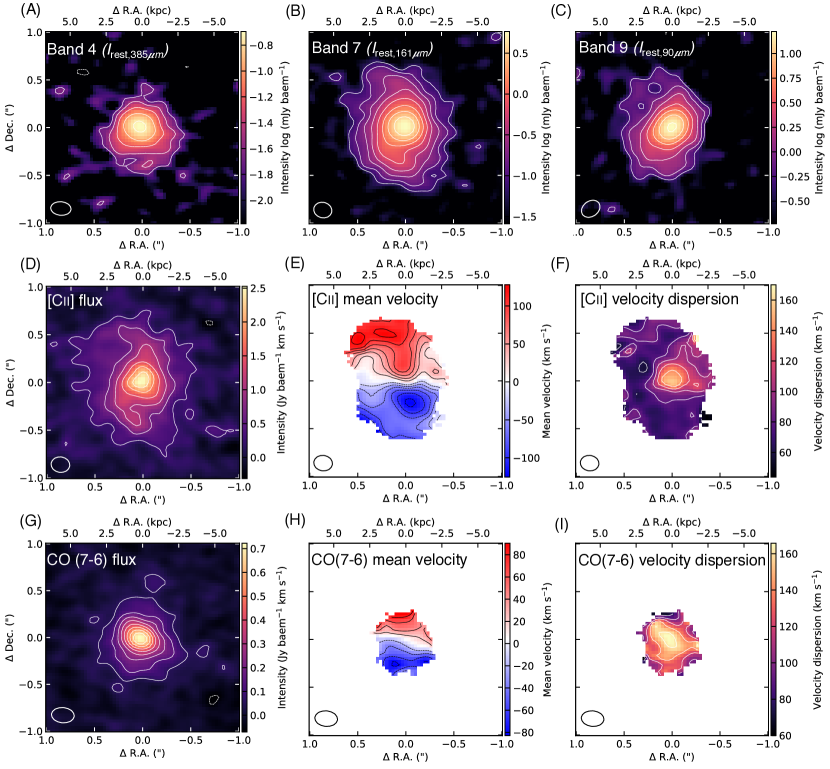
In Figure 2, we show continuum images of rest-frame 385 , 161 , 90 , which we denote , , , respectively in the paper, together with the total flux and mean velocity and velocity dispersion derived from the [C ii] and CO(7-6) line data. In all images of this paper, the RA and Dec offsets are given relative to the position RA deg and Dec deg, which coincides with the peak of the continuum images and the quasar position within the positional accuracy of ALMA. The continuum emission is more centrally concentrated than the [C ii] line emission, as the 385 , 161 , 90 continuum images and their contours are shown in log scale while the [C ii] image is shown in linear scale (We also show linear-scaled continuum images below, in Section 4). This difference is commonly seen in other spatially resolved observations of quasar host galaxies (e.g., Walter et al., 2022; Shao et al., 2022). As presented in Tsukui & Iguchi (2021), both and [C ii] images show Z-shaped spiral structures. The image also has a disk-like morphology with a major axis similar to that in , but a fainter spiral arm feature. The \textcolorblackis less sensitive to SFR which leads to lower S/N, so the emission is not detected in the outer part of the galaxy. The mean [C ii] velocity map is qualitatively consistent with the moment 1 map (intensity-weighted velocity of the spectral line) presented in Tsukui & Iguchi (2021), but provides more accurate measurements than the moment 1 map, which can easily be affected by noise in the emission-free channels. The [C ii] velocity dispersion map shows a triangle-shaped velocity-enhanced region extending from the centre to the North-West direction. Such an asymmetric structure cannot be explained by the velocity gradient of a regularly rotating motion, suggesting that the origin may not be gravitational.
3.2 Dust SED modelling
To derive dust properties from our observed spatially resolved FIR fluxes, we use a greybody function to describe the flux. For a uniform region of dust with an equilibrium temperature at redshift , solving the equation of radiative transfer yields a predicted CMB-subtracted flux within the ALMA beam (Walter et al., 2022)
| (1) |
where is the solid angle of the ALMA synthesized beam in steradians, is the Planck function, is the dust temperature, and K is the CMB temperature at \textcolorblacka given redshift\textcolorblack, \textcolorblackin our case. is optical depth, which is related to the dust mass by , where is the physical area subtended by the beam, is the dust opacity index, and cm2 g-1 is the dust opacity at a reference frequency GHz (Draine & Li, 2007). Note that while the observed flux depends on the actual dust temperature at the redshift of the source, , for convenience we compute and report the intrinsic dust temperature corrected for the CMB heating, , which is the temperature the dust would have at redshift zero, where CMB heating is much smaller. \textcolorblackAs described in da Cunha et al. (2013), these two temperatures are related \textcolorblackas,
| (2) |
3.3 Global SED of the galaxy
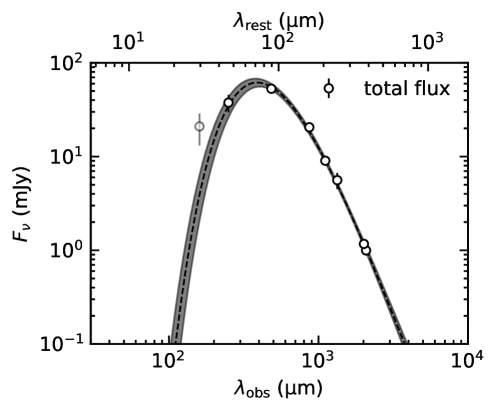
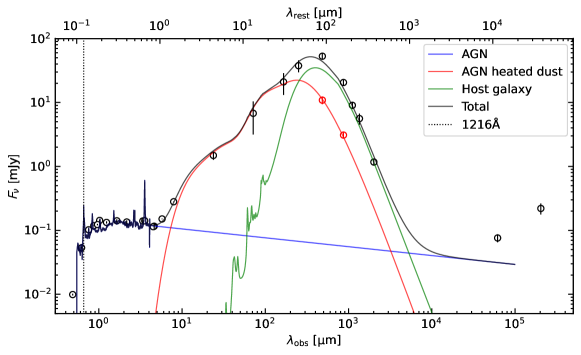
In Fig. 3 we show the total (spatially integrated over the galaxy) SED of BRI 1335-0417 with our new flux measurements at rest-frame 385 , 161 , 90 . We measured the integrated \textcolorblackflux densities by summing over the 2"2" region shown in Fig.2. The available data points are listed in Table A.1. We excluded available photometric measurements from the Herschel SPIRE 350 and 500 bands because BRI 1335-0417 is not sufficiently separated from a nearby bright source at Herschel’s angular resolution (see each photometric image in Fig. A.2). To constrain the global dust properties of the galaxy, we fit the SED with a single greybody in the optically thin limit (, large ). In this limit, Eq. 1 becomes,
| (3) |
In the fitting, we treat , , and as free parameters. We find that a single greybody fit cannot reproduce the flux observed in the Herschel 160 band (rest-frame 36 ), where warm dust is expected to dominate. Therefore, we repeat the fit with the 160 band flux excluded; doing so yields a total dust mass of , a dust temperature K and an emissivity index , which describes the power law slope of the greybody function in the Rayleigh-Jeans tail ( at ). The derived emissivity index and the computed total FIR luminosity are consistent with the previously derived values for this galaxy, (Wagg et al., 2014) and (Carilli et al., 2002). The gas-to-dust mass ratio is found to be 54.2 if we adopt a \textcolorblacktotal gas mass derived by Jones et al. 2016 from CO (2-1) using the standard conversion factor for SMGs M⊙ pc-2/ (K km s-1) \textcolorblack(Bolatto et al., 2013) and a ratio of for SMGs (Carilli & Walter, 2013).
blackThe flux density excess, which cannot be captured by a single greybody function in from rest-frame to , has previously been attributed to the presence of higher temperature components particularly in nuclear regions (Casey et al., 2014). Different prescriptions have been employed in the literature to reproduce the excess flux, including the sum of two greybody functions with different dust temperatures (Dunne & Eales, 2001; Farrah et al., 2003) or a greybody function with the Wien part replaced by the power law function (Casey et al., 2012). In the former method, the warmer component has been commonly attributed to the AGN-heated dust (Farrah et al., 2003; Kirkpatrick et al., 2012; Leipski et al., 2014; Kokorev et al., 2021), an interpretation we will explore in detail with the spatially resolved data in this study. The latter approach of adding a power law component is somewhat phenomenological, but has the advantage that it introduces only a single additional free parameter – an advantage that is not negligible when the set of measurements available to fit the data is very small, as it is here.
3.4 Intrinsic dust properties derived from the spatially resolved dust SED
Spatially resolved images at different frequency bands allow us to derive the intrinsic dust properties at each individual pixel. The galaxy is spatially resolved with 14, 32, and 20 resolution elements detected at significance in the rest-frame 385 (Band 4), 161 (Band 7), and 90 (Band 9) continuum images, respectively. The rest-frame 161 and 90 bands are close to the peak of the greybody, and their ratio is therefore sensitive to the dust temperature. The spatially resolved rest-frame 385 may help to constrain the emissivity index or the SED slope at a longer wavelength. However, the rest-frame 385 data has the worst sensitivity in terms of the minimal detectable SFR (see Table 1), and the detected emission area is smaller than in the other bands. Therefore, we choose to use the best estimate of obtained with the global SED modelling as a fiducial value in this paper, and not to include the rest-frame 385 band for spatially resolved SED modelling. With flux densities measured in two bands and the fiducial dust emissivity , we can fully constrain the two remaining free parameters and in equations 1 and 2. We propagate the uncertainty on the spectral index, , to the derived dust properties via Monte Carlo.
Figures 4 (A-C) show the best-fit dust temperature, the optical depth of the dust at rest-frame (or the dust surface density ), and the integrated dust luminosity density maps of the galaxy, respectively. We derive our 1 confidence intervals on the fit parameters ( and ) by Monte Carlo resampling: we repeat the fit 300 times using fluxes randomly drawn from a Gaussian distribution centred on the best fit measured value with a dispersion equal to the 1 observational uncertainty, and a spectral index drawn from a Gaussian centred at with a dispersion of . We report the width of the central 68% of these 300 trials as our uncertainties on and . We only show and use pixels where the 68% confidence interval for the dust temperature is smaller than 10K. Figures 4 (D-F) show how the measured flux densities at rest-frame (black dot-dashed line) and (black dashed line) band constrain dust physical parameters and at fixed , for three example regions: (D; left) the region with the lowest temperature, (E; middle) the central region that has the highest temperature, and (F; right) the region with the 2nd highest temperature. The intersection of the two black lines corresponds to the most likely solution of and and the resampled distributions are shown in grey points. The dust temperature and surface density are correlated but still constrained around the intersection of the isoflux lines of the two bands.
The temperature map reveals a central high-temperature region surrounded by a low-temperature region. The highest temperature peak coincides with the peak position of both dust continuum emission images and . The dust temperature of the central pixel is well constrained to be K, which is higher than typical dust temperatures of quasar host galaxies (47K; Beelen et al., 2006), indicating that the central high-temperature peak is likely due to the dust heated by the AGN. The temperature map also shows several high-temperature regions in the outer part of the galaxy. The surface density or optical depth maps show that the central region is moderately optically thick at rest-frame m and optically thick at rest-frame m (). The surface density map shows the southern spiral structure, which corresponds to the relatively low temperature 40K region in the temperature map.
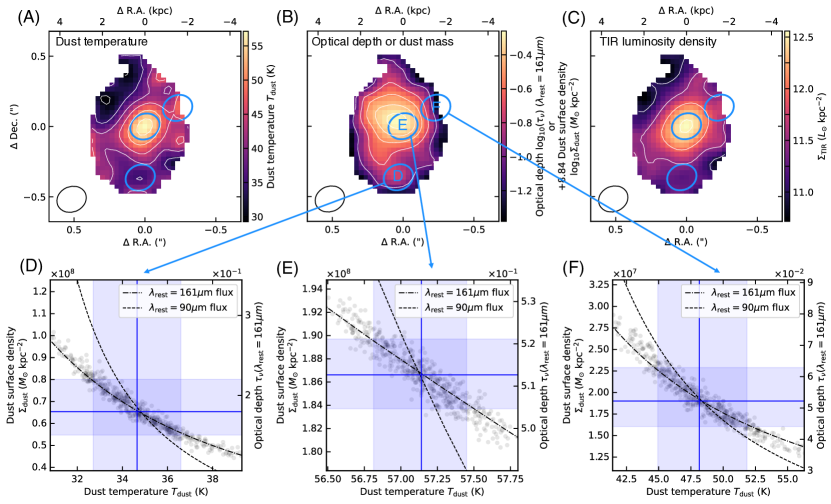
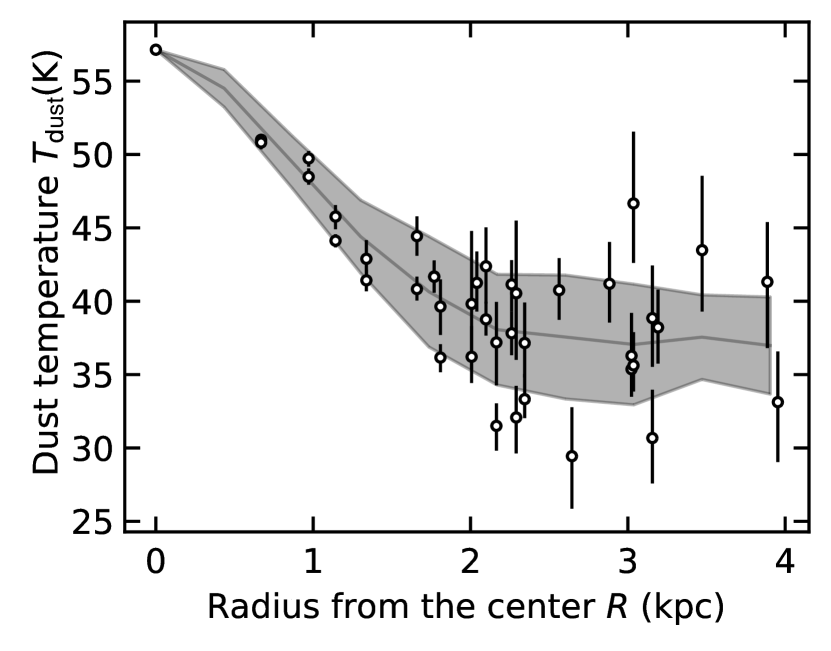
Figure 5 shows the radial distribution of the temperature, computed from data points extracted from the image (Fig. 4A). We calculate the de-projected radius using the thin disk geometry proposed in Tsukui & Iguchi (2021) (Position angle 7.6 deg, inclination 37.3 deg), derived from dynamical modelling of [C ii] emission kinematics with prior constraints from the axial ratio of the continuum image and the kinematic position angle of [C ii] emission. The derived dust temperature steeply decreases as a function of the galactic radius from the centre to 2.5 kpc. At the outer disk ( kpc), both high- and low-temperature regions can be seen, and the temperature difference is statistically significant, corresponding to the clumpy high-temperature regions seen in the map. At a larger radius, the temperature profile becomes flat with a median temperature of 38K and a large spread of values from 30 to 45 K, roughly consistent with the typical dust temperature of the high redshift starburst galaxies (Magnelli et al., 2012) at . The presence of the high-temperature regions at a larger radius may be common in other quasar host galaxies and is consistent with the observational signature of J0305-3150 at , which shows an increase in the surface brightness ratio with radius (Li et al., 2022), for which the authors suggested two possibilities: radial increase of the temperature or decrease of the opacity. We discuss the possible origin of the outer-disk high-temperature regions in Sec. 3.6.
black
3.5 Comparison of the derived dust mass profile and other gas mass tracer profiles
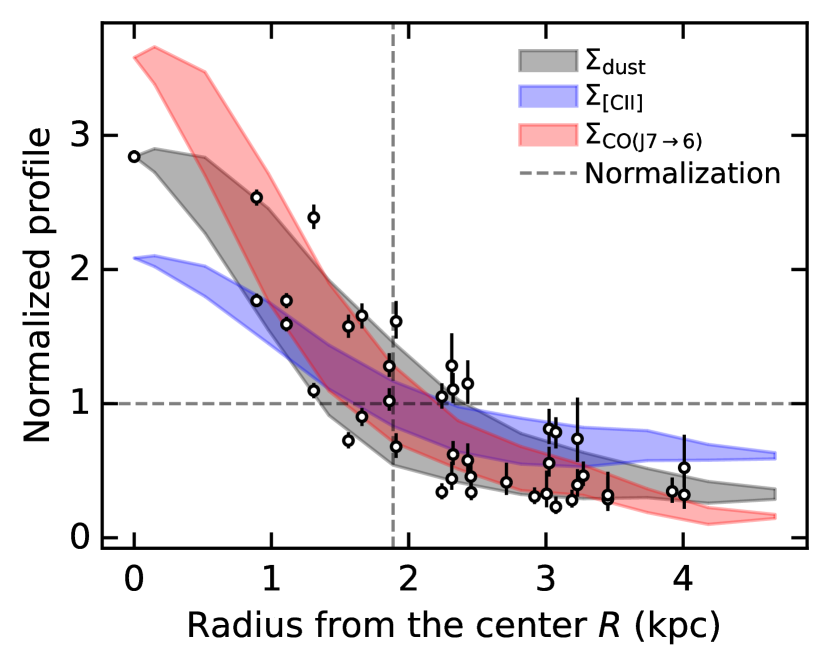
Figure 6 shows surface gas mass densities derived by three possible gas mass tracers: emission lines of [C ii] and CO(7-6), and the SED-derived dust mass. For the two former methods, we assume a constant emissivity per unit mass, while for the latter we assume a constant dust-to-gas ratio, and we normalize the profiles derived from each method to be equal at kpc. Both the dust-derived and CO-derived gas mass profiles are steeper than that estimated from the [C ii] line. Based on global measurements of galaxies, Zanella et al. (2018) proposed the [C ii] luminosity as a molecular gas mass tracer with a mass-to-light ratio . However, our result suggests that the gas mass profiles estimated from [C ii] do not agree with either CO- or dust-based profiles under the assumption of a spatially constant mass-to-light ratio for [C ii]. Possible explanations for [C ii] showing a flatter profile than CO and dust are (1) [C ii] can be emitted from various gas phases including warm ionized gas and diffuse CO-dark gas, which are likely to extend to regions beyond those that can be traced by CO emission (Pineda et al., 2013), (2) in the central region the C+ abundance decreases because the high surface density shields gas from UV photons, leading most carbon to transition to CO (Narayanan & Krumholz, 2017), and (3) the effect of infrared background radiation as proposed by Walter et al. (2022).
The CO-derived gas mass profile shows a steeper profile than the dust-derived one, especially in the central 1kpc. The excess in the centre may be due to the radially different excitation conditions, where the quasar radiation dominates in the central region and intense star formation dominates in the outer part of the galaxy (Carilli & Walter, 2013). In addition to the excitation conditions, some of the same mechanisms that flatten the [C ii] profile may steepen the CO one: (1) the dust may trace not only molecular gas but also generally more extended atomic gas (Orellana et al., 2017); (2) in the central region the CO abundance may be enhanced by increased shielding against dissociating UV photons (Narayanan & Krumholz, 2017). However, in contrast to [C ii], the infrared background radiation effect proposed by Walter et al. (2022) is not significant for CO(7-6) because the dust continuum optical depth at the CO(7-6) frequency is .
In addition to the normalized profiles shown in Fig. 6, we can also examine the absolute surface densities. If we derive the molecular gas mass profile using M⊙ pc-2/ (K km s-1) and as we did for our total molecular mass estimate, we automatically obtain the same estimate of the total molecular gas mass as Jones et al. (2016), . To match the CO-estimated and dust-estimated gas masses at 2kpc would require a gas-to-dust ratio 44 24, with a relatively large error bar due to the large dispersion of the derived dust mass. This gas-to-dust mass ratio is consistent within the uncertainties with that derived from the whole-galaxy SED fit (see Fig. 3). Further exploration of gas emissivities per unit mass in various tracers is beyond the scope of this work, but this spatially resolved analysis \textcolorblackmay highlight that assumptions of a constant emissivity break down when appli\textcolorblacked to spatially-resolved data. (See Appendix C of Herrera-Camus et al. 2021 for further discussion of [C ii] emissivity per unit mass in the optically thin limit and negligible background emission).
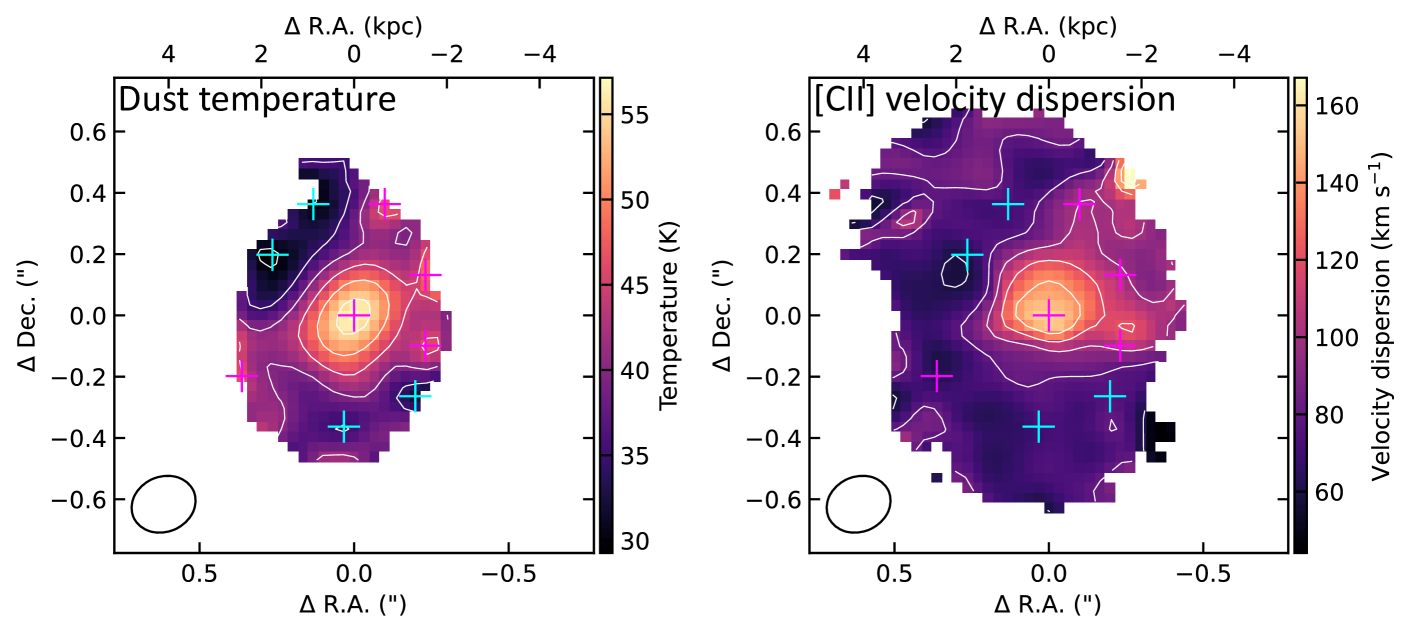
3.6 The correlation of the temperature map and velocity dispersion map
In Fig. 7 we compare the dust temperature and velocity dispersion maps overlaid with low and high-temperature peaks. We see that high-temperature peaks coincide with regions of enhanced velocity dispersion extending from the centre to the north-west direction, while low-temperature peaks coincide with low velocity dispersion regions along the disk major axis. Such anisotropic distributions preferentially aligned with the disk minor axis may indicate that an outflow from the central region heats up the dust and enhances the velocity dispersion. In a nearby luminous infrared galaxy, NGC6240, Saito et al. (2018) find a similar bipolar distribution for the high velocity dispersion CO emission, which coincides with the spatial distribution of H, near-IR, and X-ray emission. To examine the potential bulk gas motion due to the outflow which deviates from the mean line of sight motion in BRI 1335-0417, we fit the [C ii] spectrum at each position of the high-temperature peaks. The spectra can be fitted with only a single Gaussian component and do not require any additional components given the current noise level of the data.
Another possible origin of the correlated enhancement of the temperature and gas velocity dispersion is energy injection by intense star formation. Using \textcolorblackadaptive optics assisted Keck observations, Oliva-Altamirano et al. (2018) suggested a spatial correlation between the peaks of the Pa velocity dispersion and SFR for a relatively low redshift galaxy sample ( to 0.2). If this scenario is correct, we expect high velocity dispersion, high-temperature regions to show high gas densities in order to host and sustain the intense star formation; these regions might include giant star-forming clumps or interacting satellites. Neither the derived dust mass surface density (see Fig. 4B) nor the observed [C ii] and CO(7-6) maps (see Fig. 2) show such a distinct dense region, though they may show a broader triangle shape. However, Tadaki et al. (2018) identified 200pc-scale clumpy structures in a highly star-forming submillimeter galaxy at redshift , both in the CO line and dust continuum. Whether similar small-scale clumpy structures occupy the temperature-enhanced regions in our target cannot be addressed with the current data due to sensitivity and resolution limits. To further constrain this scenario, higher-resolution data capable of tracing denser gas are required.
black
3.7 Systematic error of the spatially resolved measurements
We confirm that the absolute flux uncertainty does not change the overall temperature distribution. Considering the worst possible case, when the true Band 7 flux and Band 9 flux are 10% higher and lower than the observed values, respectively, the temperature would be underestimated by 2.7K in the median. In the \textcolorblackinverse scenario where the true Band 7 flux and Band 9 flux are 10% lower and higher than the observed values, the temperature would be overestimated by 2.0K in the median. Therefore, the systematic error due to the absolute flux uncertainty is estimated to be +2.7K/K. The flux normalization errors only induce a pixel-to-pixel variation of 0.67 K and 0.49 K, respectively.
blackWe used the fiducial value derived from the integrated SED modelling, which is close to the recently measured values for the high redshift galaxies: median for ALESS well-constrained sub-samples (da Cunha et al., 2021) and for 47 starburst galaxies (Birkin et al., 2021, reported as a private communication in da Cunha et al. 2021) both derived in the spatially integrated manner.
blackHowever, the value can spatially vary over the galaxy, as shown in the nearby galaxies (Galametz et al., 2012; Smith et al., 2012). We investigate the effect on the derived dust temperature and mass profiles if the value changes across the galaxy from 1 to 2.5. Adopting a small of 1 increases the overall temperature by 20 K, while a large of 2.5 decreases the overall temperature by 2.5 K. This means a radially decreasing from 2.5 to 1.0 can erase the temperature gradient of 20 K seen in Fig. 5. However, the scenario is unlikely because it contradicts the generally observed anti-correlation of the temperature and in nearby galaxies (warmer/colder dust has lower/higher : e.g. Galametz et al., 2012; Smith et al., 2012). The expected radial increase in would increase rather than decrease the temperature gradient. The variation of also would not significantly change the mass profile. The induced changes in the dust mass profile are at most 40%, which is smaller than the uncertainty of dust mass due to the dust opacity coefficient (at least a factor of 2, see, e.g. Clark et al., 2019).
As a final remark on the analysis in this section, note that the measured flux of an individual pixel represents the integrated value weighted by the beam, so the derived temperature and optical depth need to be considered as the luminosity weighted spatially averaged solutions over the region subtended by the beam (\textcolorblack1.92 kpc2). \textcolorblackIt is expected that such spatial smoothing by the beam acts to flatten any intrinsic distribution.
As we will see in the next Section, there is a central unresolved component and an extended component in the dust continuum images, and the central unresolved component coincides with the high-temperature peak position. If the central unresolved component is due to the warm dust heated by the AGN, the derived high temperature is just due to the result of forcibly fitting two dust components with different temperatures with a single greybody function. This contamination is potentially significant out to the beam FWHM in radius. Similarly, we may overestimate the SFR in this area if we naively convert from our derived spatially resolved TIR luminosity to SFR, ignoring the possibility that the warm dust can contaminate our measurement. Therefore, it is important to decompose the image into the unresolved and the extended component and remove the effect of the unresolved component to correctly estimate the SFR distribution in the galaxy. We do exactly this in the next section.
4 AGN-host galaxy decomposition
4.1 Image decomposition of Band 7 and Band 9 continuum images
In the previous section, we \textcolorblackdemonstrated that the dust temperature shows a steep increase up to 57K, which is much higher than the typical dust temperature assumed for quasar hosts (47K; Beelen et al., 2006) and is presumably due to the heated dust by the central AGN. The observed dust continuum images (Fig.2) show a strongly peaked structure in the centre as well as a disky structure with spiral- and bar-like features in the outer part, suggesting the presence of a distinct central unresolved component and a resolved extended component. The former is likely to be associated with the warm dust heated by the central AGN and the latter with the cold dust heated by star formation in the host galaxy.
For these reasons, we decompose the continuum image into an unresolved AGN component and an extended host galaxy component using the observed [C ii] moment0 map as a template tracing the dust distribution heated by the star formation in the galaxy. This approach has several advantages: (1) there is only one parameter (total flux), (2) the [C ii] emission captures disk substructures like arms and a bar that are also seen in the dust continuum map, and that are not easily representable by an analytic model, and (3) there is independent evidence that [C ii] is a good overall neutral gas tracer (e.g., Herrera-Camus et al., 2018a, b); we expect this gas to form stars at a rate roughly proportional to the density (Krumholz et al., 2011), and there is good evidence that [C ii] directly correlates with star formation (De Looze et al., 2011). [C ii] in this galaxy also has rotating disk kinematics and a nearly exponential profile typical of disks (Sersic index ) (Tsukui & Iguchi, 2021). Given these considerations, our decomposition model includes the following components: (1) a component proportional to the point spread function \textcolorblack(PSF) of the observation to reproduce the unresolved emission, (2) a component with the same spatial distribution as the observed [C ii] intensity map representing a disky, star-forming component that exhibits spiral and bar-like structure, , and (3) a circular Gaussian component, convolved by the \textcolorblackPSF of the observation, , which we include in case the central compact region includes emission that is extended rather than truly point-like (e.g., a nuclear starburst), and thus is partially resolved by the ALMA beam. The model with these three components is described as
| (4) | ||||
where the model has only 6 parameters: the central coordinates of the PSF and Gaussian components (), the intrinsic size of the Gaussian (standard deviation), and the total flux of each component , , and . We create the spatial template for the disk component from the [C ii] moment map as follows: first, we convolve the [C ii] cube to the same resolution as the observed continuum image we are fitting, and then we make a [C ii] moment map by the masked moment method (Dame 2011; convolution with a kernel of 2 times the beam size and 2 times the spectral channel width, then masking with a threshold set to the rms of the original cube) to reduce the bias introduced by the presence of noise in the [C ii] moment map. This bias pushes the best-fit model toward lower values because larger values amplify the noise present in the [C ii] moment map, giving an additional penalty in ; convolution and masking suppress this noise in the spatial template and therefore suppress the bias.
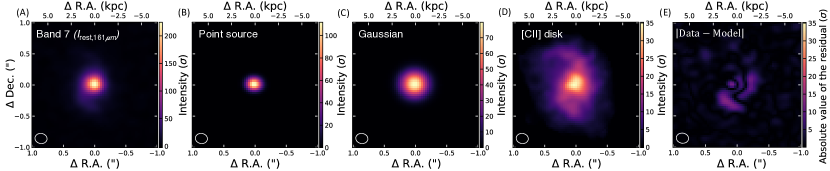
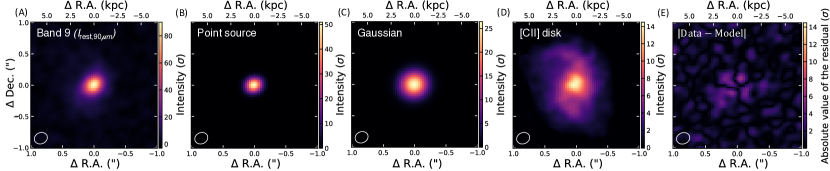
We fit to the observed Band 7 and Band 9 continuum images with simple minimization. For both the Band 7 image and the Band 9 image , evaluation of the Bayesian information criterion (BIC) indicates that this three-component fit is preferred over any alternatives omitting one of the components. Full details are provided in Appendix [see Fig. A.3 and Fig. A.4 for BIC and chi-square values, see Fig. A.5 and Fig. A.6 for fitting residuals]. Figures 8 and 9 show the original image (A: \textcolorblacksee Fig. 2 for the same images in log scale), the best-fit PSF model (B), the Gaussian model (C) and the [C ii] model (D), the best-fit residual (E) for Band 7 and Band 9 continuum images, respectively.
In Table 2, we show the best-fit parameters we derive. \textcolorblackThe uncertainties on these parameters are computed by Monte Carlo resampling with noise which has realistic spatial correlations. Our procedure to make this estimate is to: (1) measure the autocorrelation function (ACF) of the noise map in the primary beam uncorrected Band 7 and Band 9 continuum images, (2) randomly generate noise maps with the same correlation properties characterized by the noise ACF using the ESSENCE package (Tsukui et al., 2022; Tsukui et al., 2023), (3) repeat the fitting procedure 300 times with different random realizations of the noise. We then take the 68% confidence interval on the resulting distribution of parameters as our confidence interval in Table 2.
Our fits pass several consistency checks. First, the measured total flux from the observed images and the model total flux agree within the statistical uncertainty for both images. Second, the centre position of the point source and Gaussian components coincides with the location of the optical quasar position and the highest peak in the continuum images and temperature map within the uncertainties. Third, the sizes of the additional Gaussian components that we derive independently by fitting the two continuum images are consistent within the uncertainty. We speculate that this component is likely needed to compensate for the central decrease in the [Cii]/FIR mentioned in Section 3. We do see some correlated residuals in the residual map of (Fig. 8), which shows a positive residual at the location of the southern arm but not the northern arm. This indicates that dust continuum emission is enhanced relative to [C ii] emission in the southern arm but not in the northern arm. The residual of also shows a positive residual in a similar position, but without a clear spiral structure (Fig. 9). This result may be interpreted as the two arms having different ISM properties (opacity, temperature, metallicity, etc.). However, despite this feature, our simple model with only 6 parameters describes well the overall morphology of the continuum emission without any other significant structures in the residual.
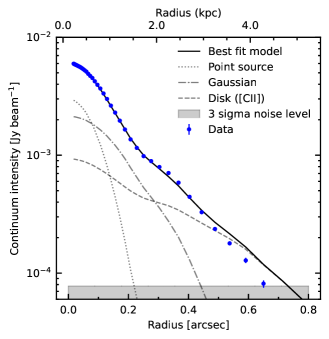
Figure 10 shows the surface brightness profile of the Band 7 and Band 9 continuum images and their best-fit decomposed components. The contribution of the point sources to the integrated flux over the image is small, 15% and 21% in rest-frame and rest-frame , respectively (Table 2). However, the point source dominates the flux in the central pixel (flux in the central resolution element, or beam area), contributing 49.8% and 56.7% in and , respectively. The best-fit model profile is slightly higher than the dust continuum profile at the outskirts of the galaxy ( 0.6 arcsec, Fig. 10 (left)). This indicates the [C ii] model component is more extended than the FIR emission, even after the central compact point source and the compact Gaussian component are removed. This is consistent with the presence of extended [C ii] halo structures extending farther than the underlying FIR emission (out to 10kpc) in other star-forming galaxies at a similar redshift (e.g., Fujimoto et al. 2019, 2020; however for a contrary view see Novak et al. 2020, who find no evidence for halo structures in quasar host galaxies at z6 using stacking analysis). The relatively short (1h) Band 7 observation relying on the brightness of the source is not sensitive enough to probe the faint structure out to 10 kpc in BRI 1335-0417. Note that in what follows, we use only the point source fluxes and the measured total fluxes from the images, not the fluxes of the individual Gaussian or [C ii] disk components , or the total model fluxes . Therefore, the slight model-data offset in the surface brightness profile at the outer part of the galaxy does not affect our subsequent results.
| Parameters | Band 7 () | Band 9 () |
|---|---|---|
| x offset of the centre (R.A), (mas) | 19.6 | 9.6 |
| y offset of the centre (Dec.), (mas) | 13.6 | 1.3 |
| Point source flux, (mJy) | 3.09 | 10.87 |
| Gaussian flux (mJy) | 7.4 | 16.83 |
| [Cii] template flux (mJy) | 10.26 | 27.62 |
| Gaussian size (pc) | 787 | 777 |
| Model total flux (mJy) | 20.760.36 | 55.322.69 |
| Derived parameters | ||
| Measured total flux (mJy) | 20.540.27 | 52.922.13 |
4.2 SED fitting using the image decomposition result
In the previous section, we found that an unresolved component is required to reproduce the dust continuum images, and we decompose the images into a sum of this component and the rest of the galaxy. In this subsection, we model the SEDs of the unresolved component (AGN-heated dust), with flux , and the rest of the galaxy, with flux (cold\textcolorblacker dust heated by the star formation in the disk). We use the fluxes of the \textcolorblackpoint-like components and to constrain the AGN-heated warm dust contribution to the FIR part of SED, along with total flux measurements at various wavelength bands listed in Table A.1. Note that we do not use the fluxes of the rest of the galaxy as independent data points, since they are already constrained implicitly by the total flux measurements and point source flux measurements . We consider several possible approaches to fitting the resolved and unresolved components described below.
4.2.1 \textcolorblackTwo greybody components SED modelling
We first model the FIR part of the SED with two greybody functions in the optically thin limit (Eq. 1, ), one for the AGN-heated dust and the other for the cold dust heated by star formation. Although detailed AGN dust torus models exist to describe the warm dust component heated by AGN (Hönig & Kishimoto, 2017; Stalevski et al., 2016), the spatial extent and geometry of tori are highly uncertain for high redshift quasars. This motivates us to consider a simpler model where we fit the AGN-dust component with a greybody spectrum in the optically thin limit but with a free dust emissivity index . This model has 6 free parameters (, , for each component). \textcolorblackThe sum of the two greybody functions (AGN-heated dust and colder dust heated by star formation) is fitted to the spatially integrated fluxes (from rest-frame 36 to 472 bands in Table A.1), and the AGN heated dust greybody is fitted to point fluxes, and (Table 2). The fitting is done simultaneously to constrain both the AGN-heated dust component and the colder dust component.
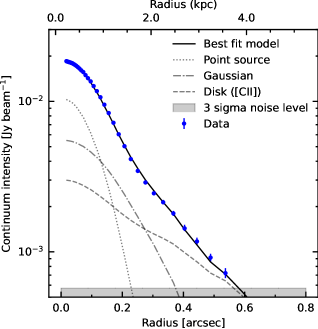
We compute the distribution of their posteriors for a uniform prior distribution using the emcee package (Foreman-Mackey et al., 2013). Figure 11 shows the SED decomposed into the AGN-heated dust component and the host galaxy. Figure A.7 shows the posterior distribution of the model parameters, indicating that all model parameters are well-constrained. From this fit, we find that the SFR of the host galaxy is 1.5 yr-1 based on the FIR luminosity of the cold dust component, which is more than 3 times smaller than the previous estimate \textcolorblack yr-1 (Wagg et al., 2014). This is due to the high AGN contribution, 63%, to the FIR luminosity, which is neglected in the previous study. The AGN-heated dust component has a temperature K, which is consistent with the high temperature reported for the centre of high redshift quasars found in earlier high-resolution observations (200 pc; Walter et al. 2022; Shao et al. 2022). However, from this fit, we also find that the temperature of the cold dust component is K, which is lower than the temperature K with a median value of K at the outer part of the galaxy (Fig. 5). This is expected due to the optically thin assumption we adopted in the SED modelling, which yields systematically lower temperatures than fits that allow the dust to have finite optical depth (Cortzen et al., 2020).
Improving this aspect of our fit motivates our second fitting method, wherein we modify our model by introducing an additional free parameter for the dust optical depth at , which we denote , for the cold dust component. We fit the model again with the same procedure for the above optically thin case, but with a prior constraint that the cold dust temperature cannot exceed the warm dust temperature. Figure A.8 shows the posterior distribution of the model parameters, which are summarized in Table 3.555Note that, since the posterior distribution for remains significantly above zero all the way down to , for this parameter report only a best-fit value and an upper limit (84th percentile of the posterior distribution), not a lower limit. Including a finite optical depth increases our best-fitting cold dust temperature to K. This confirms that relaxing the optically thin assumption provides a dust temperature consistent with the spatially resolved result, while at the same time not significantly changing the overall functional shape of two greybody functions or the parameters derived from them such as the SFR and the AGN luminosity. The updated SED fit is shown in Fig. A.9. The derived range of optical depth from 0 to 0.0146 is much smaller than the spatially resolved result with the median value of 0.1556. The optical depth derived by the spatially integrated SED assuming single temperature may have much less physical meaning than the optical depth derived in the spatially resolved image (Fig. 4B) because the galaxy shows a significant variation of non-linear parameters such as temperature and optical depth over the galaxy. This may illustrate that the optical depth measurement becomes inaccurate if the dust temperature and opacity structure are smaller than the integration aperture.
From this fit we also obtain dust emissivity indices and for the warm and cold components, respectively. Our finding of a shallow index for the warm component and a steeper index for the cool component is consistent with the large range of suggested by the observations and models of infrared to sub-millimeter dust emission and laboratory experiments (e.g., laboratory experiments: Mennella et al. 1998; Agladze et al. 1996, models; Pollack et al. 1994, observations: Galametz et al. 2012; Dupac et al. 2003). In agreement with our results, these studies suggest that anti-correlates with the dust temperature ; for small grains, primarily radiating in MIR bands, and for large grains, which can \textcolorblackachieve lower equilibrium temperature and thus radiate their energy in FIR bands (da Cunha et al., 2008).
4.2.2 \textcolorblackStardust panchromatic SED modelling
Our third fitting approach is to model the panchromatic SED from the rest UV to FIR bands using the more realistic galaxy SED fitting code stardust (Kokorev et al., 2021), which assumes three components; a QSO template dominating in the rest-frame UV to optical bands (Shen, 2016), an AGN-heated dust component (Mullaney et al., 2011) dominating in the rest-frame MIR bands, and a cold dust component of the host galaxy dominating in the FIR bands (Draine & Li, 2007). \textcolorblackThe original stardust code fits the combination of the above three templates to the spatially integrated photometric data points given as input. In addition to the spatially integrated data, we modified the code to accept the point source fluxes as independent constraints to be fitted with the AGN-heated dust component. Using the modified code, we simultaneously fit (1) the sum of three templates to the spatially integrated data and (2) the AGN-heated dust component to point source fluxes, and 666The modified stardust code will be available at the GitHub repository https://github.com/takafumi291, upon publication. Figure 12 shows the best-fit SED decomposed into the QSO component (AGN-heated dust) and the host galaxy component (cold dust associated with the star-forming host galaxy). The SFR and AGN contribution to we derive from this fit are consistent with those we obtain from the two-component greybody fit (Table 3). Our stardust calculation also finds that a QSO template without dust extinction () fits the data better than a template including extinction, which may indicate that the QSO has already cleared dust at least from the line of sight between us and the central accretion disk. We also consider a fit from stardust using a stellar spectrum template instead of a quasar template for the UV-to-optical part of SED, but this results in a value that is larger by 536, with \textcolorblack16 degrees of freedom. This difference in is highly significant and strongly favours the quasar template. \textcolorblackThis result is also supported by the HST optical image (Fig. 1) consistent with the point spread function. Moreover, the stellar template fit produces an estimated stellar mass of , which easily exceeds the dynamical mass. This confirms that the UV to optical part of the SED is dominated by AGN emission, supporting our interpretation that the compact dust component identified at the position of the highest temperature peak is predominantly heated by AGN.
For completeness, we also perform stardust SED fitting without using the image decomposition results, and , to constrain the AGN-heated dust contribution to the FIR SED. In this case, stardust provides a best-fit model with a \textcolorblackAGN subtracted SFR of 5260, much higher than that derived when including the spatially-resolved constraints; moreover, the value of this fit (, DOF=18) is no worse than that derived including the spatially resolved data. We show the fit in Fig.A.10, and visual inspection confirms that the fit to the global SED is no worse than the one shown in Fig. 12 derived using the spatially decomposed constraints. This demonstrates that spatially resolved information at rest-frame to band is required to constrain and remove the AGN-heated dust component in order to estimate SFR accurately; it is not possible to make this correction with unresolved photometric data alone.
| Parameters | unit | Two greybodies | Two greybodies | Stardust | |
| cold dust opacity assumption | thin | thick | thin | ||
| (warm dust) | () | ||||
| (warm dust) | (K) | ||||
| (warm dust) | |||||
| (cold dust) | () | ||||
| (cold dust) | (K) | ||||
| (cold dust) | |||||
| 0.0072 () | |||||
| Derived parameters | |||||
| Total | () | ||||
| AGN | () | ||||
| Host galaxy | |||||
| SFR | ( yr-1) | ||||
| AGN fraction in | |||||
| (DOF) | 0.98 (4) | 0.66 (3) | 284.19 (2\textcolorblack0) |
4.2.3 \textcolorblackConclusion of the SED fitting results
The most important conclusion from the discussion above is that all three methods of SED modelling that include the spatially-resolved constraints provide consistent estimates of the AGN contribution to , and therefore for the host galaxy SFR \textcolorblack(Table 3). As final values for the remainder of this paper, we adopt the best-fit model parameters derived from the two greybodies fit with a free optical thickness for the cold component (fourth column of Table 3); this is a conservative choice since it includes the widest range of possible model uncertainties. Our fiducial estimates are therefore , , and K, for the warm and cold components, respectively. The former is consistent with expectations for small dust primarily radiating in the MIR (da Cunha et al., 2008), while the latter is consistent with the typical temperatures and dust opacity indices of high-redshift starburst galaxies (Magnelli et al., 2012), bolstering our interpretation of these two components as primarily AGN-heated and primarily star formation-heated.
4.3 AGN-subtracted dust properties
Armed with our successful decomposition of the emission into a point-like AGN component and an extended star formation component, we are now also in a position to construct a map of the spatially-resolved dust properties in the galaxy with the AGN contamination removed. To this end, we start from the rest-frame and continuum images, and in each pixel, we subtract our best-fitting model estimate of the contribution from the point-like AGN-heated dust. We then repeat the fitting procedure presented in Section 3 on the point source-subtracted images. This procedure yields a map of properties for the cold dust component alone, rather than the unknown admixture of cold and hot components we obtain in Section 3. Figures 13 (A-C) show the temperature map, dust optical depth, and surface density of the SFR, respectively, derived in this manner. We again use Monte Carlo simulations to propagate the uncertainties, including not only the noise in the image and the uncertainty in the fiducial dust emissivity index as in Section 3, but also our uncertainties on the properties of the point source component (see Table 2).
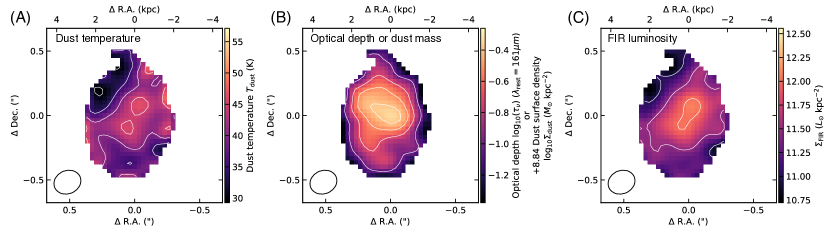
Figure 14 shows the one-dimensional dust temperature profile of the cold dust and the star formation density estimated after the warm dust component is removed. The temperature still shows a slight increase toward the centre, but does not show the steep temperature gradient seen in the results without the subtraction. The flat dust temperature indicates that the steep gradient in Fig. 5 is entirely due to the warm dust heated by the AGN, suggested by the compact nature and the two-component dust SED fitting (Figs. 11 and 12), providing further confidence for the successful subtraction of the warm dust component heated by the central AGN.
Figure 15 shows a comparison of the SFR surface density estimated from the FIR luminosity derived with and without removing the warm dust component heated by AGN (Figs. 4C and 13C). is derived by assuming the Chabrier (2003) initial mass function, where is measured for the cold dust component after subtracting the unresolved warm dust component from the images (Fig.13C). We see that if one does not remove the component, the central SFR surface density can be overestimated by over a factor of 3 at currently-available resolutions, and that the point source AGN-heated dust contaminates the derived dust physical properties out to 1 synthesized beam FWHM in radius ( 1.3 kpc). In future higher-resolution observations, the contaminated region would presumably be smaller, but the contribution of the AGN-heated warm dust would be correspondingly larger in the central resolution elements, leading to an even larger overestimation of the central SFR surface density.
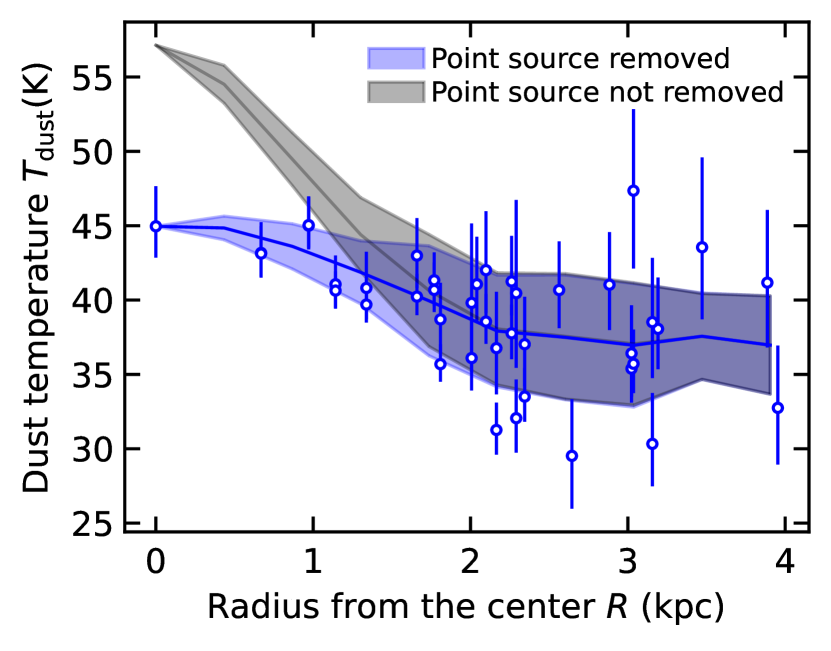
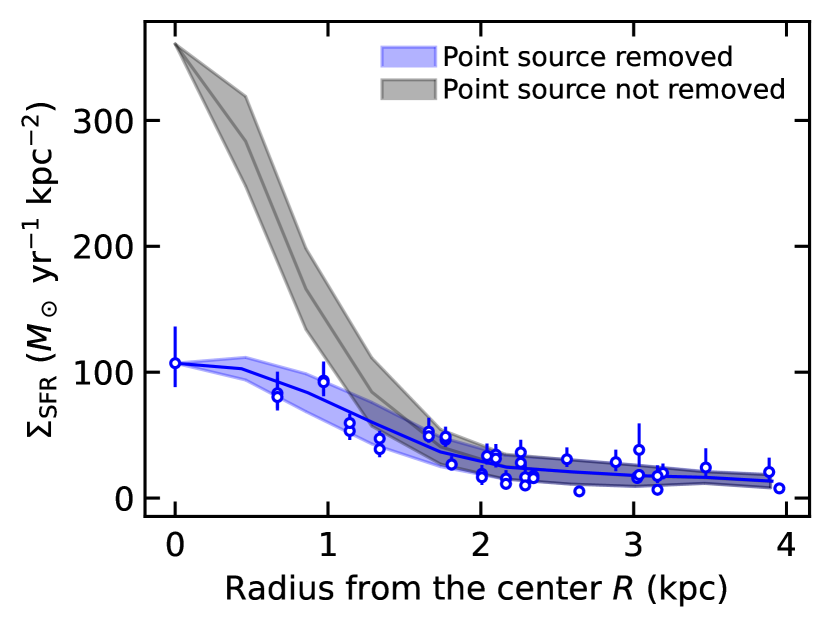
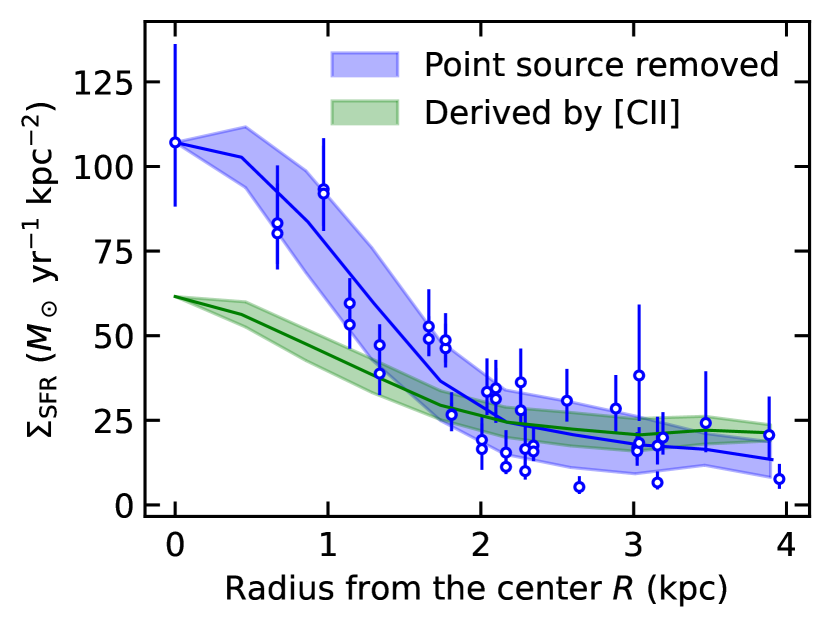
Figure 16 compares the SFR surface density estimated from the point source-subtracted FIR luminosity with that estimated from the [C ii] luminosity using the calibration of De Looze et al. (2011). As expected from the central decrease in [C ii]/, the [C ii] luminosity under-predicts the SFR surface density in the central region. In the outer parts of the galaxy, the predicted SFR density from the [C ii] line luminosity agrees well with that derived from . As a consistency check, we also compute the total SFR from the resolved map by integrating over it, using SFRs derived from [C ii] in pixels where dust-based estimates are unavailable because the 68% confident interval on is K (white regions in the image). The resulting integrated SFR is yr-1, consistent with the SED modelling result yr-1.
5 Discussion
The decomposition of BRI 1335-0417’s emission into AGN- and star formation-powered components has implications both for the interpretation of the source itself and future studies of similar systems. We explore these in turn.
5.1 Implications for the dynamics and history of BRI 1335-0417
Our analysis allows us to draw a number of conclusions about the structure formation of BRI 1335-0417. First, our results suggest that the galaxy has an extended disk and a compact bulge both actively forming stars. Part of the evidence is dynamical: Tsukui & Iguchi (2021) conclude based on [C ii] kinematics that a compact mass kpc in size resides in the centre of the galaxy. Our work here adds morphological evidence on top of this: both the and images require a compact Gaussian component with an effective radius of kpc (calculated as FWHM from the sizes obtained in Table 2) in addition to a nearly exponential [C ii] disk template. The most natural explanation for the combined dynamical and morphological evidence is the presence of a compact, massive nuclear region that is actively star-forming. However, the fact that the rest-frame UV to optical part of the SED is best fit by a QSO template without dust extinction also suggests that the AGN of BRI 1335-0417 has cleared dust along our line of sight to the central accretion disk (e.g., Fujimoto et al., 2022), so gas is actively being ejected, and the central region may be in the last throes of star formation. Thus we conclude that BRI 1335-0417 may be in the transition from a QSO phase to being a passive bulge-dominated galaxy (Hopkins et al., 2008a, b). With the compact star formation and the extended disk star formation, the galaxy may evolve into the passive bulged-disk system (Fudamoto et al., 2022) unless the galaxy is affected by external perturbation such as mergers.
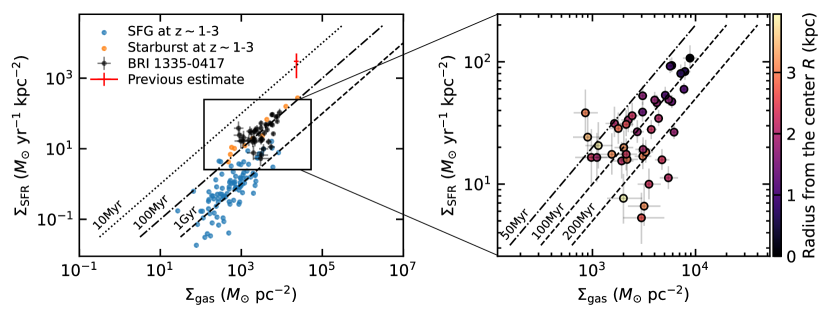
Our results also explain the organized disk rotation in the galaxy. In Figure 17, we show pixel-by-pixel measurements of vs. (i.e., the Kennicutt-Schmidt diagram) for BRI 1335-0417. The gas mass is derived by converting the spatially resolved dust mass surface density in Fig. 4B to a total mass surface density assuming the same gas-to-dust ratio of estimated in Sec. 3. We find that most pixels are located in the starburst regime characterized by gas depletion times of 50-200 Myr (Genzel et al., 2010), much less than the Gyr values typically found for main sequence star-forming galaxies at redshift of 1-3 (Tacconi et al., 2013). If the starburst is triggered by a gas-rich major merger, which violently disturbs the gas kinematics, it may take at least one orbital period for the gas to settle into organized disk rotation. The 50-200 Myr depletion time is comparable to the Myr orbital period at the disk effective radius derived from [C ii] kinematics (Tsukui & Iguchi, 2021). This explains why the galaxy has had time to settle into relaxed, disk-like kinematics, at least in the centre where the orbital period is shortest; the outer disk, where the orbital time is longer, is also rotating, but shows significant morphological disturbance (Tsukui & Iguchi, 2021), consistent with a system age near the upper end of the depletion time range.
It is worth noting that our estimated gas depletion times are much larger than the previous estimates by Jones et al. (2016), who not only found a much higher SFR due to AGN contribution, but also adopted a size of 1.8 kpc2 for the area of the star-forming disk based on the 44 GHz continuum, much smaller than the size revealed in our spatially resolved maps. Both factors contribute to an underestimate of the depletion time. Using this underestimate leads to the conclusion that the system must be less than one dynamical time old, which is hard to reconcile with the kinematics as noted in Sec. 1. Our increased depletion time resolves this discrepancy.
Finally, we note that Fig. 17 also shows that the central region of the galaxy has shorter gas depletion time on average than the disk (outer) part of the galaxy, while the outer part has a larger scatter in depletion time. The large scatter reflects the high/low-temperature regions aligned with the minor/major axis (Fig. 7), and suggests that the SFR in part of the outer disk may be locally enhanced by cold gas/satellite accretion from a preferential direction, or by the AGN wind to the perpendicular direction to the disk as discussed in Sec. 3.6. This combined with the shorter depletion time in the centre suggests that the galaxy may quench star formation inside out to form a bulge-disk system (van Dokkum et al., 2015; Tacchella et al., 2015) due to the combination of the removal of the gas by the AGN wind, earlier consumption of the gas in the centre, and/or gas supply from ongoing gas/satellite accretion supporting the star formation in the disk.
5.2 Implications for future studies of high-redshift starbursts and QSO hosts
In BRI 1335-0417, the warm dust component heated by AGN contributes only a small fraction of the total observed flux, 15% and 21% at m and m, respectively. However, ignoring this component leads to a factor of three overestimate of the total SFR (see Fig. 3 and Fig. 11), because the warm dust component has high temperature, , and thus contributes a substantially larger fraction of the inferred total TIR luminosity (). The warm dust component also contributes a significant fraction of the flux within the central resolution element, leading to a factor of overestimate of the local SFR density (see Fig. 15), and contaminates the SFR density estimate out to roughly the FWHM of the beam in radius. Thus the point source subtraction is crucial for accurate estimates of both the total SFR and its spatial distribution, even when the AGN contribution to the observed bands is relatively small.
Nor does higher resolution remove this need. In a higher-resolution observation, the region contaminated by the AGN is smaller, but the AGN contribution is correspondingly greater because the relative fraction of the extended cold dust component becomes smaller in the central beam. As an extreme example of this, Walter et al. (2022) reported 200 pc resolution observation towards the quasar J234833.34–305410.0 at redshift 6.9 and estimated the dust temperature of the central resolution element (radius of 110pc) to be 132K, and the star formation rate density to be yr-1kpc-2 with the assumption that the AGN is negligible. The effective radius of the resolution element 110 pc is much smaller than our study ( pc). As the authors discussed, the compact emission from the AGN-heated dust may dominate in the central resolution element. Our findings here strongly support that conjecture.
In this paper, we decompose the AGN and star formation contributions using ALMA observations of the FIR part of SED, where the ratio of AGN to galactic luminosity is less extreme than at rest-frame UV to optical, where the black hole accretion disk greatly outshines the host galaxy (Marshall et al., 2020). Recently Ding et al. (2022) demonstrated that James Web Space Telescope (JWST) data in rest-frame optical also enable the decomposition of the surface brightness distribution into the point source AGN component and extended host galaxy stellar component. The separation of AGN-host galaxies with JWST, coupled with decomposition in the FIR and SED modelling such as that we have demonstrated here, will provide measurements of the already-formed stellar masses in addition to the SFR. These complementary measurements will provide the information crucial to understanding how the galaxy-BH relation is set in the early universe.
6 Conclusion and summary
We present 1kpc ALMA imaging of the dust continuum, [C ii] emission, and CO(7-6) emission of a quasar host galaxy, BRI1335-0417. Due to the unique brightness of the galaxy, the observations provide a number of resolution elements across the galaxy, allowing us to study the spatially resolved ISM properties of the host galaxy, and to disentangle the light coming from the unresolved, AGN-powered region from that produced by star formation in the surrounding galaxy. Our main findings and their implications are the following.
-
•
Using the spatially resolved continuum images and , but without first separating the AGN and galaxy components, we constrain the shape of the greybody for individual pixels and derive the dust temperature, optical thickness, and dust mass surface density. The central resolution element is found to be optically thick at and at . The temperature shows a steep radial gradient towards the centre, reaching K, which is higher than the typical temperatures of 47K and 40K for quasar host galaxies \textcolorblack(Beelen et al., 2006) and star-forming galaxies \textcolorblack(Magnelli et al., 2012), respectively.
-
•
The pixel-by-pixel temperature distribution image shows that high-temperature peaks are preferentially aligned with the disk minor axis. The anisotropic distribution coincides with the high velocity dispersion region of [C ii], both of which show a conical shape aligned with the disk minor axis. With current data, we cannot conclude whether the feature is due to the AGN wind heating the dust (Saito et al., 2018) or to the presence of a star-forming region driven by anisotropic cold gas supply from gas/satellite accretion (Dekel et al., 2009).
-
•
Image decomposition analysis reveals the presence of a point source in the two dust continuum images and , whose positions coincide with the highest temperature, the peak of the dust continuum image, and the optical quasar position. The point source contribution to the total flux is small, 15% and 21% for and , respectively. However, in the central resolution element, the contribution is much larger, 49.8% and 56.7% for the respective images to the flux.
-
•
We model the FIR SED assuming that the point-source flux comes from a warm dust component heated by the AGN, and the remainder comes from cold dust component heated by the star-forming host galaxy. The decomposed fluxes constrain the AGN-heated warm dust contribution to the FIR part of the SED, which is usually assumed to be dominated by the cold dust heated by star formation. We estimate temperatures of K and K for the warm and cold components, respectively. We estimate the SFR from the FIR luminosity of the cold component, finding a SFR of yr-1. This is a factor of three less than the previously estimated value yr-1 due to the high AGN fraction in the FIR luminosity %.
-
•
The SED fit suggests that there are two dust components with different temperatures in the central resolution element in the images. The central temperature of K we obtain without decomposing the AGN and star formation components should be interpreted as the luminosity-averaged solution within the beam, which results from fitting these two dust components with a single greybody function. After removing the point source (warm dust component) component from the images, we remeasure the dust properties for the star formation-heated cold dust component only. This fit shows a nearly flat temperature profile with a slight increase toward the centre, suggesting that the steep temperature gradient found in the one-component fit is entirely due to the unresolved warm dust component. The single-component fit overestimates the central SFR density by a factor of \textcolorblack4 as a result.
-
•
Our estimates of star formation surface density after AGN subtraction and gas surface density for individual pixels show a roughly linear sequence with a gas depletion time of 50-200Myr. This places the galaxy in the starburst regime, clearly separated from main-sequence galaxies at with gas depletion times of 1 Gyr, but makes it a typical starburst rather than an extreme outlier.
Through this study, we demonstrate a method to constrain the SED shape of an unresolved warm dust component heated by AGN and an extended cold dust component in the host galaxy by combining spatially resolved information in two images and with integrated UV to FIR SED analysis. This method provides the total spatially resolved SFR, with contamination from warm dust heated by the AGN removed allowing us to study how quasar activity affects stellar mass build-up. Our method and recently demonstrated AGN-host galaxy decomposition with JWST (Ding et al., 2022) provide complementary measurements crucial to understanding how the galaxy-BH relation is set in the early universe.
Acknowledgements
TT is grateful for the helpful discussions with Satoru Iguchi, Takuya Hashimoto, Kentaro Nagamine, and Yuichi Matsuda. This research was supported by the Australian Research Council Centre of Excellence for All Sky Astrophysics in 3 Dimensions (ASTRO 3D), through project number CE170100013. MRK acknowledges support from the Australian Research Council through Laureate Fellowship FL220100020. Data analysis was carried out on the Multi-wavelength Data Analysis System operated by the Astronomy Data Center (ADC), National Astronomical Observatory of Japan. This paper makes use of the following ALMA data: ADS/JAO.ALMA#2017.1.00394.S, and #2018.1.01103.S. ALMA is a partnership of ESO (representing its member states), NSF (USA) and NINS (Japan), together with NRC (Canada), NSC and ASIAA (Taiwan) and KASI (Republic of Korea), in cooperation with the Republic of Chile. The Joint ALMA Observatory is operated by ESO, AUI/NRAO and NAOJ. \textcolorblackThis research is based on observations made with the NASA/ESA Hubble Space Telescope obtained from the Space Telescope Science Institute, which is operated by the Association of Universities for Research in Astronomy, Inc., under NASA contract NAS 5–26555. These observations are associated with program(s) GO 8572. This work has made use of data from the European Space Agency (ESA) mission Gaia (https://www.cosmos.esa.int/gaia), processed by the Gaia Data Processing and Analysis Consortium (DPAC, https://www.cosmos.esa.int/web/gaia/dpac/consortium). Funding for the DPAC has been provided by national institutions, in particular the institutions participating in the Gaia Multilateral Agreement. This research has made use of the NASA/IPAC Infrared Science Archive, which is funded by the National Aeronautics and Space Administration and operated by the California Institute of Technology. This paper makes use of the Herschel, which is an ESA space observatory with science instruments provided by European-led Principal Investigator consortia and with important participation from NASA. \textcolorblackThis work is based in part on archival data obtained with the Spitzer Space Telescope, which was operated by the Jet Propulsion Laboratory, California Institute of Technology under a contract with NASA. Support for this work was provided by an award issued by JPL/Caltech. This research has made use of the NASA/IPAC Extragalactic Database (NED) which is operated by the Jet Propulsion Laboratory, California Institute of Technology, under contract with the National Aeronautics and Space Administration.
Data Availability
The ALMA data we use in this work \textcolorblackare publicly available in https://almascience.nrao.edu/aq/. \textcolorblackThe HST data we use in this work can be obtained in https://mast.stsci.edu/portal/Mashup/Clients/Mast/Portal.html. \textcolorblackThe photometric data from Spitzer and Herschel we use in this work are publicly available at doi: 10.26131/IRSA3 and Marton et al. (2017), respectively.
References
- Agladze et al. (1996) Agladze N. I., Sievers A. J., Jones S. A., Burlitch J. M., Beckwith S. V. W., 1996, The Astrophysical journal, 462, 1026
- Akins et al. (2022) Akins H. B., et al., 2022, ApJ, 934, 64
- Alonso-Herrero et al. (2012) Alonso-Herrero A., Pereira-Santaella M., Rieke G. H., Rigopoulou D., 2012, The Astrophysical journal, 744, 2
- Beelen et al. (2006) Beelen A., Cox P., Benford D. J., Dowell C. D., Kovács A., Bertoldi F., Omont A., Carilli C. L., 2006, The Astrophysical journal, 642, 694
- Birkin et al. (2021) Birkin J. E., et al., 2021, Monthly notices of the Royal Astronomical Society, 501, 3926
- Bolatto et al. (2013) Bolatto A. D., Wolfire M., Leroy A. K., 2013, Annual review of astronomy and astrophysics, 51, 207
- Briggs (1995) Briggs D. S., 1995, Bulletin of the American Astronomical Society, 27, 1444
- CASA Team et al. (2022) CASA Team et al., 2022, Publications of the Astronomical Society of the Pacific, 134, 114501
- Carilli & Walter (2013) Carilli C. L., Walter F., 2013, Annual review of astronomy and astrophysics, 51, 105
- Carilli et al. (1999) Carilli C. L., Menten K. M., Yun M. S., 1999, The Astrophysical Journal, 521, L25
- Carilli et al. (2002) Carilli C. L., et al., 2002, The Astronomical journal, 123, 1838
- Casey et al. (2012) Casey C. M., et al., 2012, ApJ, 761, 140
- Casey et al. (2014) Casey C. M., Narayanan D., Cooray A., 2014, Physics reports, 541, 45
- Chabrier (2003) Chabrier G., 2003, Publications of the Astronomical Society of the Pacific, 115, 763
- Chambers et al. (2016) Chambers K. C., et al., 2016, arXiv e-prints, p. arXiv:1612.05560
- Clark et al. (2019) Clark C. J. R., et al., 2019, Monthly notices of the Royal Astronomical Society, 489, 5256
- Cortzen et al. (2020) Cortzen I., et al., 2020, å, 634, L14
- Dame (2011) Dame T. M., 2011, arXiv:1101.1499 [astro-ph]
- Davies et al. (2007) Davies R. I., Müller Sánchez F., Genzel R., Tacconi L. J., Hicks E. K. S., Friedrich S., Sternberg A., 2007, ApJ, 671, 1388
- De Looze et al. (2011) De Looze I., Baes M., Bendo G. J., Cortese L., Fritz J., 2011, Monthly notices of the Royal Astronomical Society, 416, 2712
- Dekel & Burkert (2014) Dekel A., Burkert A., 2014, Monthly notices of the Royal Astronomical Society, 438, 1870
- Dekel et al. (2009) Dekel A., et al., 2009, Nature, 457, 451
- Di Mascia et al. (2023) Di Mascia F., Carniani S., Gallerani S., Vito F., Pallottini A., Ferrara A., Valentini M., 2023, MNRAS, 518, 3667
- Ding et al. (2022) Ding X., Silverman J. D., Onoue M., 2022, The Astrophysical journal, 939, L28
- Draine & Li (2007) Draine B. T., Li A., 2007, The Astrophysical Journal, 657, 810
- Dunne & Eales (2001) Dunne L., Eales S. A., 2001, Monthly notices of the Royal Astronomical Society, 327, 697
- Dupac et al. (2003) Dupac X., et al., 2003, A&A, 404, L11
- Elbaz et al. (2011) Elbaz D., et al., 2011, A&A, 533, A119
- Elmegreen & Elmegreen (2014) Elmegreen D. M., Elmegreen B. G., 2014, The Astrophysical journal, 781, 1
- Farrah et al. (2003) Farrah D., Afonso J., Efstathiou A., Rowan-Robinson M., Fox M., Clements D., 2003, Monthly notices of the Royal Astronomical Society, 343, 585
- Ferrarese & Merritt (2000) Ferrarese L., Merritt D., 2000, Astrophysical Journal Letters, 539, L9
- Foreman-Mackey et al. (2013) Foreman-Mackey D., Hogg D. W., Lang D., Goodman J., 2013, Publications of the Astronomical Society of the Pacific, 125, 306
- Fudamoto et al. (2022) Fudamoto Y., Inoue A. K., Sugahara Y., 2022, The Astrophysical Journal Letters, 938, L24
- Fujimoto et al. (2019) Fujimoto S., et al., 2019, The Astrophysical journal, 887, 107
- Fujimoto et al. (2020) Fujimoto S., et al., 2020, The Astrophysical journal, 900, 1
- Fujimoto et al. (2022) Fujimoto S., et al., 2022, Nature, 604, 261
- Gaia Collaboration et al. (2016) Gaia Collaboration et al., 2016, A&A, 595, A1
- Gaia Collaboration et al. (2021) Gaia Collaboration et al., 2021, A&A, 649, A1
- Galametz et al. (2012) Galametz M., et al., 2012, Monthly notices of the Royal Astronomical Society, 425, 763
- Gebhardt et al. (2000) Gebhardt K., et al., 2000, The Astrophysical journal, 539, L13
- Genzel et al. (2010) Genzel R., et al., 2010, Monthly notices of the Royal Astronomical Society, 407, 2091
- Guilloteau et al. (1997) Guilloteau S., Omont A., McMahon R. G., Cox P., Petitjean P., 1997, Astronomy and astrophysics, 328, L1
- Guo et al. (2022) Guo Y., et al., 2022, arXiv e-prints, p. arXiv:2210.08658
- Herrera-Camus et al. (2018a) Herrera-Camus R., et al., 2018a, The Astrophysical journal, 861, 94
- Herrera-Camus et al. (2018b) Herrera-Camus R., et al., 2018b, The Astrophysical journal, 861, 95
- Herrera-Camus et al. (2021) Herrera-Camus R., et al., 2021, A&A, 649, A31
- Hodge et al. (2019) Hodge J. A., Smail I., Walter F., Cunha E., Swinbank A. M., Rybak M., Venemans B., 2019, The Astrophysical journal, 876, 130
- Hönig & Kishimoto (2017) Hönig S. F., Kishimoto M., 2017, The Astrophysical journal, 838, L20
- Hopkins (2012) Hopkins P. F., 2012, Monthly notices of the Royal Astronomical Society, 420, L8
- Hopkins et al. (2008a) Hopkins P. F., Hernquist L., Cox T. J., Kereš D., 2008a, The Astrophysical journal. Supplement series, 175, 356
- Hopkins et al. (2008b) Hopkins P. F., Cox T. J., Kereš D., Hernquist L., 2008b, The Astrophysical journal. Supplement series, 175, 390
- Inoue et al. (2016) Inoue S., Dekel A., Mandelker N., Ceverino D., Bournaud F., Primack J., 2016, Monthly notices of the Royal Astronomical Society, 456, 2052
- Irwin et al. (1991) Irwin M., McMahon R. G., Hazard C., 1991, in Crampton D., ed., Astronomical Society of the Pacific Conference Series Vol. 21, The Space Distribution of Quasars. pp 117–126
- Izumi et al. (2019) Izumi T., et al., 2019, Publications of the Astronomical Society of Japan, 71, 111
- Jones et al. (2016) Jones G. C., et al., 2016, The Astrophysical journal, 830, 1
- Kennicutt (1998) Kennicutt Jr R. C., 1998, The Astrophysical journal, 498, 541
- Kirkpatrick et al. (2012) Kirkpatrick A., et al., 2012, The Astrophysical Journal, 759, 139
- Kokorev et al. (2021) Kokorev V. I., et al., 2021, The Astrophysical journal, 921, 40
- Kormendy & Ho (2013) Kormendy J., Ho L. C., 2013, Annual review of astronomy and astrophysics, 51, 511
- Krumholz et al. (2011) Krumholz M. R., Dekel A., McKee C. F., 2011, The Astrophysical Journal, 745, 69
- Larry Bradley et al. (2019) Larry Bradley et al., 2019, astropy/photutils: v0.7.2, https://zenodo.org/record/3568287#.XpvfPFP7Sd0
- Lasker et al. (2021) Lasker B., et al., 2021, VizieR Online Data Catalog, p. I/353
- Leipski et al. (2014) Leipski C., et al., 2014, The Astrophysical Journal, 785, 154
- Lelli et al. (2021) Lelli F., Di Teodoro E. M., Fraternali F., Man A. W. S., Zhang Z.-Y., De Breuck C., Davis T. A., Maiolino R., 2021, Science, 371, 713
- Li et al. (2022) Li J., Venemans B. P., Walter F., Decarli R., Wang R., Cai Z., 2022, The Astrophysical journal, 930, 27
- Lu et al. (2018) Lu N., et al., 2018, The Astrophysical journal, 864, 38
- Madau & Dickinson (2014) Madau P., Dickinson M., 2014, Annual review of astronomy and astrophysics, 52, 415
- Magdis et al. (2017) Magdis G. E., et al., 2017, A&A, 603, A93
- Magnelli et al. (2012) Magnelli B., et al., 2012, Astronomy & astrophysics. Supplement series, 539, A155
- Magorrian et al. (1998) Magorrian J., et al., 1998, The Astronomical journal, 115, 2285
- Marshall et al. (2020) Marshall M. A., et al., 2020, The Astrophysical Journal, 900, 21
- Marton et al. (2017) Marton G., et al., 2017, arXiv e-prints, p. arXiv:1705.05693
- McAlpine et al. (2019) McAlpine S., et al., 2019, Monthly notices of the Royal Astronomical Society, 488, 2440
- McKinney et al. (2021) McKinney J., Hayward C. C., Rosenthal L. J., Martínez-Galarza J. R., Pope A., Sajina A., Smith H. A., 2021, The Astrophysical Journal, 921, 55
- Medallon et al. (2023) Medallon S., Welty D., et al. 2023, STIS Instrument Handbook Version 22.0, (Baltimore: STScI), https://hst-docs.stsci.edu/stisihb, %****␣mnras_template.bbl␣Line␣400␣****https://hst-docs.stsci.edu/stisihb
- Mennella et al. (1998) Mennella V., Brucato J. R., Colangeli L., Palumbo P., Rotundi A., Bussoletti E., 1998, The Astrophysical Journal, 496, 1058
- Mitsuhashi et al. (2021) Mitsuhashi I., et al., 2021, The Astrophysical journal, 907, 122
- Mullaney et al. (2011) Mullaney J. R., Alexander D. M., Goulding A. D., Hickox R. C., 2011, Monthly notices of the Royal Astronomical Society, 414, 1082
- Narayanan & Krumholz (2017) Narayanan D., Krumholz M. R., 2017, Monthly notices of the Royal Astronomical Society, 467, 50
- Narayanan et al. (2015) Narayanan D., et al., 2015, Nature, 525, 496
- Nardini et al. (2010) Nardini E., Risaliti G., Watabe Y., Salvati M., Sani E., 2010, Monthly notices of the Royal Astronomical Society, 405, 2505
- Neeleman et al. (2020) Neeleman M., Prochaska J. X., Kanekar N., Rafelski M., 2020, Nature, 581, 269
- Novak et al. (2020) Novak M., et al., 2020, The Astrophysical journal, 904, 131
- Oliva-Altamirano et al. (2018) Oliva-Altamirano P., Fisher D. B., Glazebrook K., Wisnioski E., Bekiaris G., Bassett R., Obreschkow D., Abraham R., 2018, Monthly notices of the Royal Astronomical Society, 474, 522
- Orellana et al. (2017) Orellana G., et al., 2017, A&A, 602, A68
- Pensabene et al. (2020) Pensabene A., Carniani S., Perna M., Cresci G., Decarli R., Maiolino R., Marconi A., 2020, Astronomy & astrophysics. Supplement series, 637, A84
- Pineda et al. (2013) Pineda J. L., Langer W. D., Velusamy T., Goldsmith P. F., 2013, Astronomy and astrophysics, 554, A103
- Pollack et al. (1994) Pollack J. B., Hollenbach D., Beckwith S., Simonelli D. P., Roush T., Fong W., 1994, The Astrophysical journal, 421, 615
- Renzini (2006) Renzini A., 2006, Annual review of astronomy and astrophysics, 44, 141
- Rizzo et al. (2020) Rizzo F., Vegetti S., Powell D., Fraternali F., McKean J. P., Stacey H. R., White S. D. M., 2020, Nature, 584, 201
- Rizzo et al. (2021) Rizzo F., Vegetti S., Fraternali F., Stacey H. R., Powell D., 2021, Monthly notices of the Royal Astronomical Society, 507, 3952
- Rodighiero et al. (2011) Rodighiero G., et al., 2011, The Astrophysical journal, 739, L40
- Saito et al. (2018) Saito T., et al., 2018, MNRAS, 475, L52
- Sanders & Mirabel (1996) Sanders D. B., Mirabel I. F., 1996, Annual review of astronomy and astrophysics, 34, 749
- Schreiber et al. (2015) Schreiber C., et al., 2015, å, 575, A74
- Scoville et al. (2017) Scoville N., et al., 2017, The Astrophysical journal, 836, 66
- Shao et al. (2022) Shao Y., et al., 2022, A&A, 668, A121
- Shapley (2011) Shapley A. E., 2011, Annual review of astronomy and astrophysics, 49, 525
- Shen (2016) Shen Y., 2016, ApJ, 817, 55
- Shields et al. (2006) Shields G. A., Menezes K. L., Massart C. A., Vanden Bout P., 2006, The Astrophysical journal, 641, 683
- Silk & Rees (1998) Silk J., Rees M. J., 1998, A&A, 331, L1
- Smith et al. (2012) Smith M. W. L., et al., 2012, ApJ, 756, 40
- Somerville & Davé (2015) Somerville R. S., Davé R., 2015, Annual review of astronomy and astrophysics, 53, 51
- Stalevski et al. (2016) Stalevski M., Ricci C., Ueda Y., Lira P., Fritz J., Baes M., 2016, Monthly notices of the Royal Astronomical Society, 458, 2288
- Stanley et al. (2017) Stanley F., et al., 2017, MNRAS, 472, 2221
- Storrie-Lombardi et al. (1996) Storrie-Lombardi L. J., McMahon R. G., Irwin M. J., Hazard C., 1996, The Astrophysical journal, 468, 121
- Symeonidis & Page (2021) Symeonidis M., Page M. J., 2021, Monthly notices of the Royal Astronomical Society, 503, 3992
- Tacchella et al. (2015) Tacchella S., et al., 2015, The Astrophysical journal, 802, 101
- Tacconi et al. (2013) Tacconi L. J., et al., 2013, The Astrophysical Journal, 768, 74
- Tadaki et al. (2018) Tadaki K., et al., 2018, Nature, 560, 613
- Tsukui & Iguchi (2021) Tsukui T., Iguchi S., 2021, Science, 372, 1201
- Tsukui et al. (2022) Tsukui T., Iguchi S., Mitsuhashi I., Tadaki K., eds, 2022, Proper evaluation of spatially correlated noise in interferometric images Millimeter, Submillimeter, and Far-Infrared Detectors and Instrumentation for Astronomy XI, doi:10.1117/12.2629721. , https://ui.adsabs.harvard.edu/abs/2022SPIE12190E..1CT
- Tsukui et al. (2023) Tsukui T., Iguchi S., Mitsuhashi I., Tadaki K., 2023, Journal of Astronomical Telescopes, Instruments, and Systems, 9, 018001
- Umehata et al. (2019) Umehata H., et al., 2019, Science, 366, 97
- Wagg et al. (2014) Wagg J., et al., 2014, The Astrophysical journal, 783, 71
- Walter et al. (2022) Walter F., et al., 2022, ApJ, 927, 21
- Yuan et al. (2010) Yuan T.-T., Kewley L. J., Sanders D. B., 2010, The Astrophysical journal, 709, 884
- Zanella et al. (2018) Zanella A., et al., 2018, Monthly notices of the Royal Astronomical Society, 481, 1976
- da Cunha et al. (2008) da Cunha E., Charlot S., Elbaz D., 2008, Monthly notices of the Royal Astronomical Society, 388, 1595
- da Cunha et al. (2013) da Cunha E., et al., 2013, The Astrophysical Journal, 766, 13
- da Cunha et al. (2021) da Cunha E., et al., 2021, ApJ, 919, 30
- van Dokkum et al. (2015) van Dokkum P. G., et al., 2015, The Astrophysical journal, 813, 23
Appendix A Supplemental figures
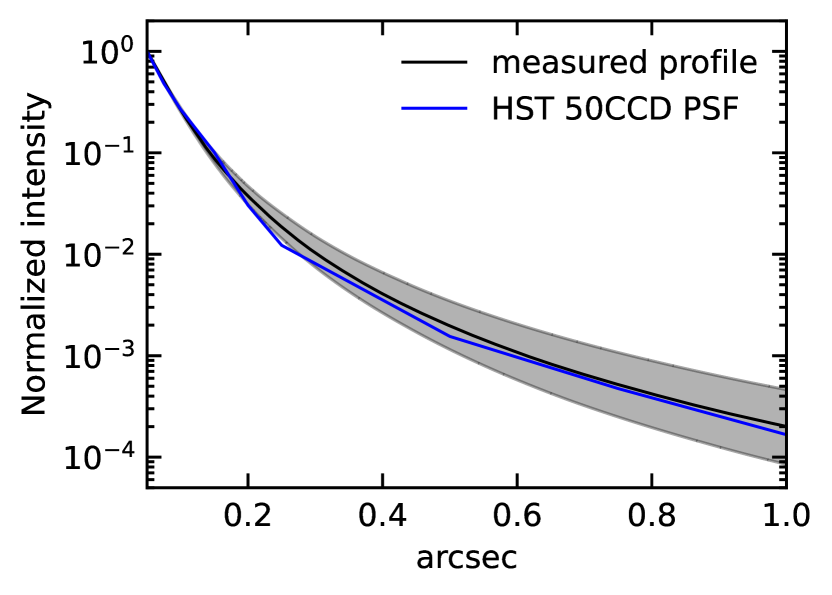
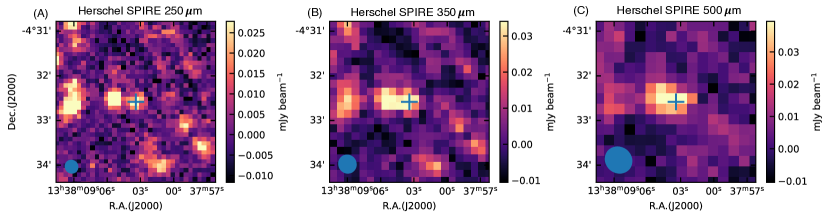
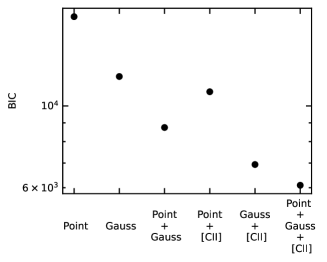
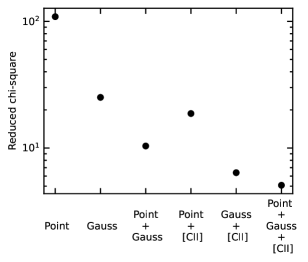
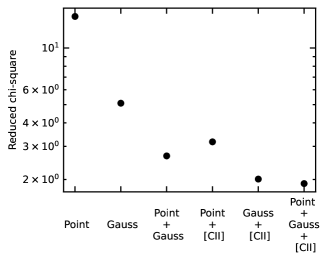
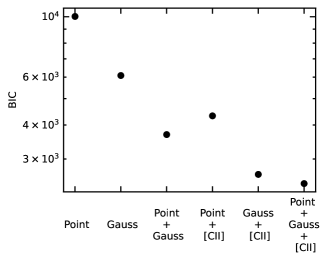
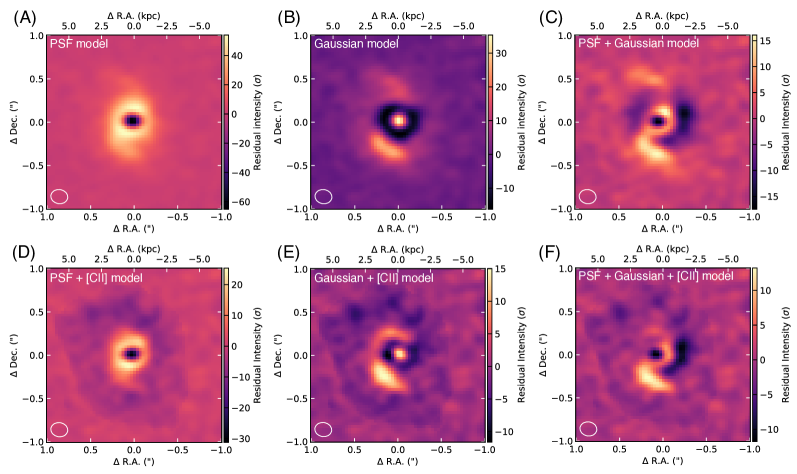
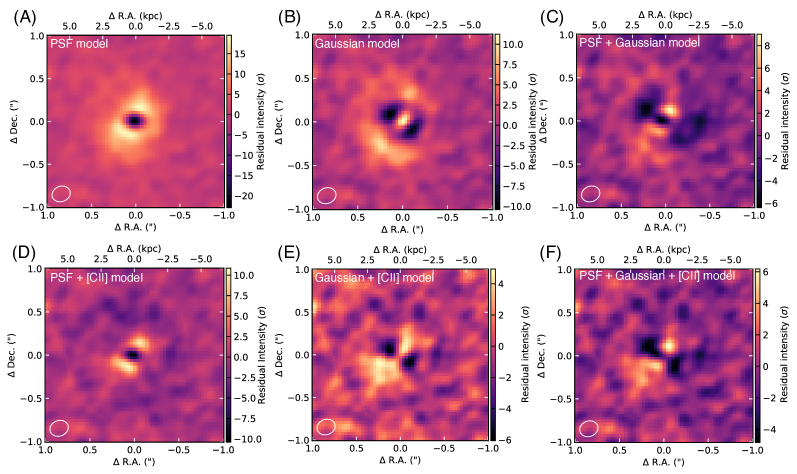
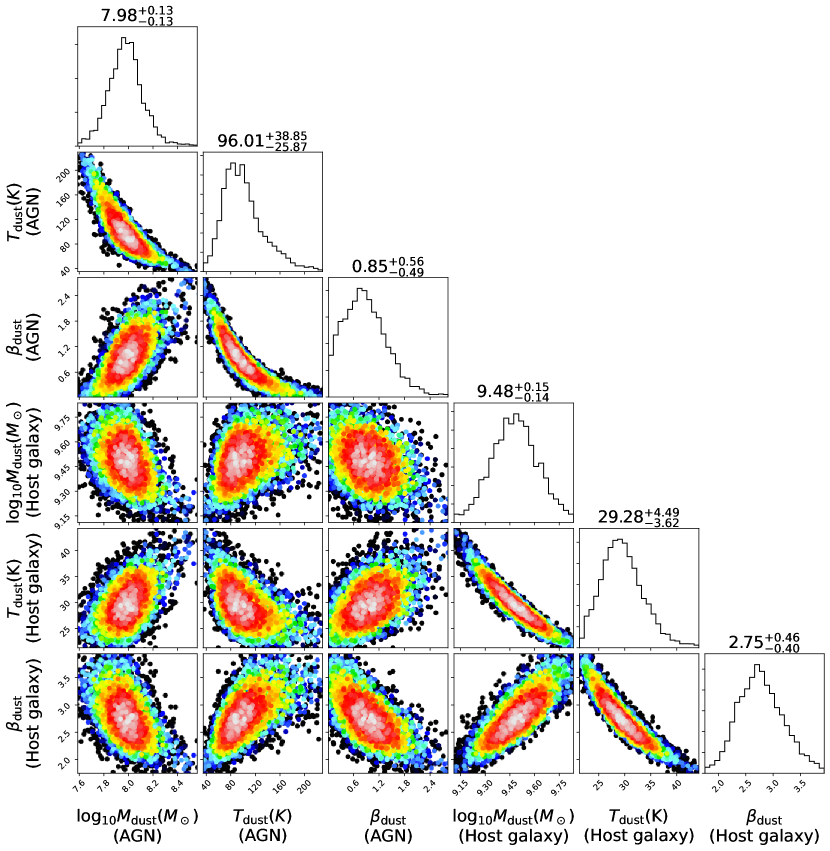
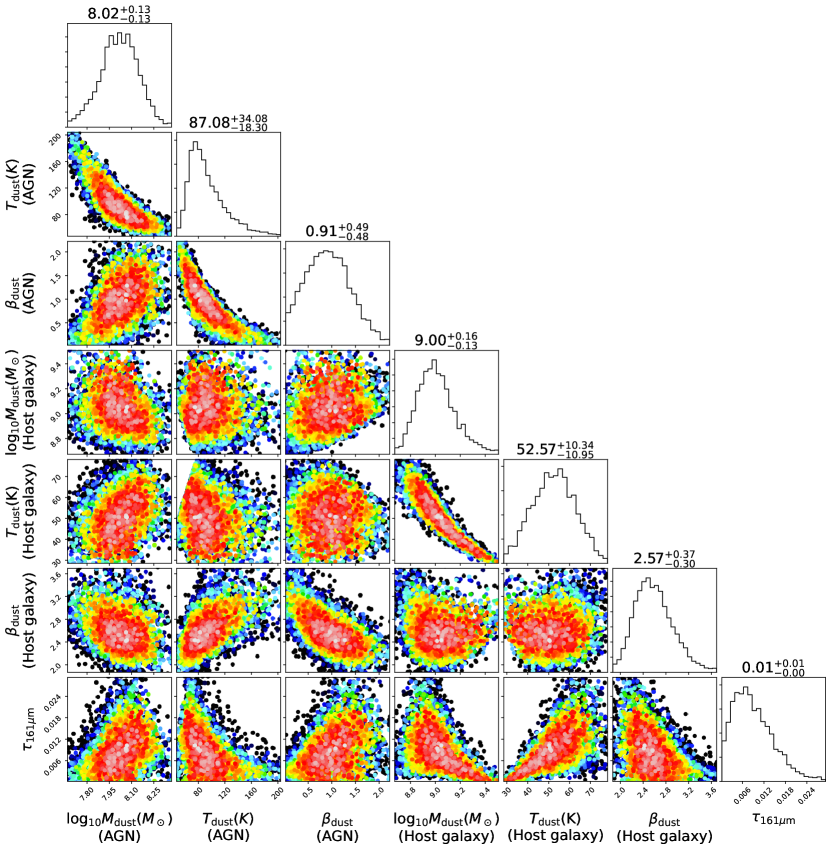
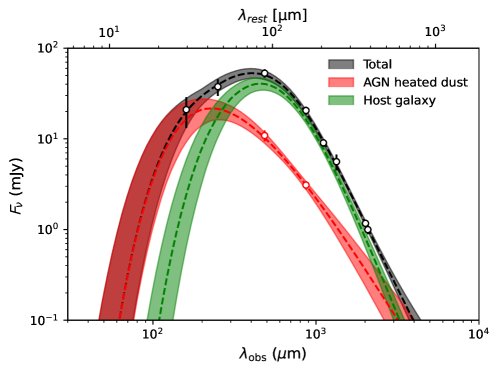
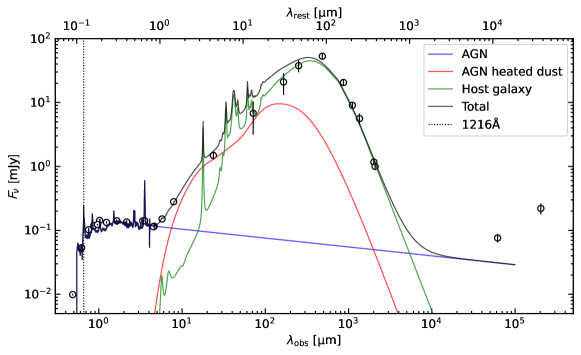
| Instrument | Wavelength (micron) | Flux(mJy) | Flux uncertainty (mJy) | Sources |
|---|---|---|---|---|
| Pan-STARRS1-g | 0.477 | 0.0099 | 3.100e-04 | (Chambers et al., 2016) |
| Pan-STARRS1-r | 0.612 | 0.053 | 1.300e-03 | (Chambers et al., 2016) |
| Pan-STARRS1-i | 0.747 | 0.102 | 1.000e-03 | (Chambers et al., 2016) |
| Pan-STARRS1-z | 0.865 | 0.118 | 1.000e-03 | (Chambers et al., 2016) |
| Pan-STARRS1-y | 0.960 | 0.123 | 3.000e-03 | (Chambers et al., 2016) |
| VISTA-Y | 1.018 | 0.143 | 4.000e-03 | (Lasker et al., 2021) |
| 2MASSJ | 1.239 | 0.133 | 5.000e-03 | (Lasker et al., 2021) |
| 2MASSH | 1.649 | 0.141 | 8.000e-03 | (Lasker et al., 2021) |
| 2MASSKs | 2.163 | 0.135 | 8.000e-03 | (Lasker et al., 2021) |
| WISE W1 | 3.350 | 0.140 | 7.000e-03 | (Lasker et al., 2021) |
| Spitzer IRAC3.6 | 3.600 | 0.141 | 3.759e-04 | SEIP |
| Spitzer IRAC4.5 | 4.500 | 0.114 | 4.042e-04 | SEIP |
| WISE W2 | 4.600 | 0.116 | 0.011 | (Lasker et al., 2021) |
| Spitzer IRAC5.8 | 5.800 | 0.151 | 1.487e-03 | SEIP |
| Spitzer IRAC8.0 | 8.000 | 0.280 | 2.782e-03 | SEIP |
| Spitzer MIPS24 | 24.00 | 1.484 | 0.215 | SEIP |
| HERSCHEL PACS 70 | 70 | 6.768 | 3.606 | HPPSC |
| HERSCHEL PACS 160 | 160 | 20.976 | 7.838 | HPPSC |
| HERSCHEL SPIRE 250 | 250 | 37.6 | 7.900 | HPPSC |
| ALMA | 484 | 52.9 | 5.7 | Our work |
| ALMA | 869 | 20.5 | 2.1 | Our work |
| ALMA | 1110 | 9.0 | 0.9 | \textcolorblack(Lu et al., 2018) |
| IRAM interferometer | 1350 | 5.6 | 1.1 | \textcolorblack(Guilloteau et al., 1997) |
| ALMA | 2012 | 1.17 | 0.12 | \textcolorblack(Lu et al., 2018) |
| ALMA | 2080 | 1.00 | 0.10 | Our work |
| VLA | 61685 | 0.076 | 0.011 | \textcolorblack(Carilli et al., 1999) |
| VLA | 203940 | 0.220 | 0.043 | \textcolorblack(Carilli et al., 1999) |