Molecular-Level Understanding of the Ro-vibrational Spectra of N2O in Gaseous, Supercritical and Liquid SF6 and Xe
University of Basel]Department of Chemistry, University of Basel, Klingelbergstrasse 80 , CH-4056 Basel, Switzerland University of Basel]Department of Chemistry, University of Basel, Klingelbergstrasse 80 , CH-4056 Basel, Switzerland \altaffiliationDepartment of Chemistry, Indian Institute of Technology Hyderabad, Sangareddy, Telangana 502285, India Boston University] Department of Chemistry and the Photonics Center, Boston University, 8 St Mary’s St, MA 02215, Boston Boston University] Department of Chemistry and the Photonics Center, Boston University, 8 St Mary’s St, MA 02215, Boston University of Basel]Department of Chemistry, University of Basel, Klingelbergstrasse 80 , CH-4056 Basel, Switzerland \altaffiliationDepartment of Chemistry, Brown University, Providence, RI 02912, USA
1 Abstract
The transition between the gas-, supercritical-, and liquid-phase behaviour is a fascinating topic which still lacks molecular-level understanding. Recent ultrafast two-dimensional infrared spectroscopy experiments suggested that the vibrational spectroscopy of N2O embedded in xenon and SF6 as solvents provides an avenue to characterize the transitions between different phases as the concentration (or density) of the solvent increases. The present work demonstrates that classical molecular dynamics simulations together with accurate interaction potentials allows to (semi-)quantitatively describe the transition in rotational vibrational infrared spectra from the P-/R-branch lineshape for the stretch vibrations of N2O at low solvent densities to the Q-branch-like lineshapes at high densities. The results are interpreted within the classical theory of rigid-body rotation in more/less constraining environments at high/low solvent densities or based on phenomenological models for the orientational relaxation of rotational motion. It is concluded that classical MD simulations provide a powerful approach to characterize and interpret the ultrafast motion of solutes in low to high density solvents at a molecular level.
2 Introduction
Solvent-solute interactions and the coupled dynamics between solute
molecules embedded in a solvent are central for understanding
processes ranging from rotational and vibrational energy relaxation to
chemical reactivity in solution.1, 2
Vibrational spectroscopy is a particularly suitable technique to
follow the structural dynamics of ”hot” solutes in their electronic
ground state interacting with a solvent environment. Experimentally,
1d- and 2d-infrared spectroscopies provide measures of the strength
and time scale of solvent-solute interactions that couple to the
resonant rovibrational excitation.3 These effects can
also be probed directly by molecular dynamics (MD)
simulations.4 The comparison of computations and
experiments is a sensitive test for the quality of the intermolecular
interaction potentials and provide a molecular-level understanding of
energy transfer mechanisms. Furthermore, the entire structural
dynamics at molecular-level detail is contained in the time dependent
motion of all solution species involved from the MD trajectories and
available for further analysis.
The understanding of solute equilibration in solvents including high
density gases and supercritical fluids (SCFs) is also important from a
more practical perspective. For example, controlling the outcome of
combustion reactions which are often performed in the supercritical
regime requires knowledge of energy transfer rates and mechanisms in
high temperature and pressure solutions.5, 6
For reactions, it has been recognized that characterizing and
eventually tuning the physico-chemical properties of the solvent can
be as important as determining the best catalyst.6
Hence, gaining molecular-level insight into the properties of
solute-solvent dynamics is central not only for understanding
fundamental solution interactions but also for industrial processes
where solvents such as ionic, supercritical, or eutectic liquids are
employed. On the other hand, the possibility to specifically
manipulate dynamical properties in solvent system have been already
successfully exploited in a wide range of
applications.7, 8
Linear and nonlinear optical and in particular infrared (IR)
spectroscopy is a powerful means to characterize the structural and
dynamical properties of condensed-phase systems. As an example, recent
spectroscopic experiments in the Terahertz and infrared region
combined with MD simulations provided an atomistically resolved
picture of the structural properties of an eutectic
mixture.9 More broadly speaking, the structural and
dynamical properties of solutions can and have been studied at a
molecular level using two-dimensional IR (2DIR) spectroscopy through
vibrational energy
transfer.10, 11, 12, 13, 14, 15, 16, 17, 18
The energy transfer rate for exchange of vibrational energy is
expected to follow a 6th-power, distance dependent
law,17 similar to NOESY in NMR
spectroscopy,19, 20 or Förster energy transfer
between electronic chromophores.21 As an example, the
presence of cross-peaks in a 2D spectrum has been directly related to
the formation of aggregated structures.11
However, interpretation and more in-depth understanding of the solvent
structure requires additional information that can be obtained for
example from MD simulations.
Recent 2DIR experiments on gas and supercritical phase solutions have
shown how rotational energy returns to equilibrium following
rovibrational excitation.22, 23, 24
The dynamics of N2O as the spectroscopic probe surrounded by xenon
atoms and SF6 molecules has provided valuable information about
density-dependent change in the solvent structure and energy transfer
dynamics as the fluid approaches and passes through the near-critical
point density region. The 1D and 2D spectra of the N2O asymmetric
stretch in Xe and SF6 exhibit a significant dependence on
solvent density.23 At low density, corresponding to
SF6 and Xe in the gas phase, the FTIR (1D) band shape of the
asymmetric stretch vibration is that of gas-phase N2O with clearly
resolved P- and R-band structure whereas at high solvent density of
the liquid Xe or SF6 solvent only a Q-branch-like absorption
feature peaked at the pure vibrational transition frequency was
observed. Because the solvent density can be changed in a
continuous fashion between gas and liquid densities, along a
near-critical isotherm it is also possible to probe
the intermediate, super-critical regime of the solvent. 2DIR spectral
shapes as a function of waiting time and solvent density exhibit
perfectly anti-correlated features that report on the scrambling
or rotational energy relaxation
rates.22, 23, 24
Given the molecular-level detail provided by quantitative MD
simulations, the present work focuses on changes in the IR
spectroscopy of N2O embedded in SF6 and xenon and their
interpretation at a structural level. For this, an accurate
kernel-based representation of high-level electronic structure
calculations for the spectroscopic reporter (N2O) is combined with
state-of-the art treatment of electrostatic interactions employing the
minimally distributed charge model (MDCM)
25, 26, 27 which captures
multipolar interactions. Extensive MD simulations for densities
corresponding to those used in the recent 1D and 2D experiments were
carried out.
The current work is structured as follows. First, the Methods are
presented. Next, the quality of the interaction potentials is
discussed. Then, the density-dependent FTIR spectra are compared with
experiments, the vibrational frequency fluctuation correlation
functions are characterized and the organization of the solvent is
analyzed for xenon and SF6 as the solvents. Finally, the findings
are discussed in a broader context.
3 Methods
3.1 Potential Energy Surfaces
The intramolecular potential energy surface (PES) of N2O in its
electronic ground state (1A′) is provided by a machine-learned
representation using the reproducing kernel Hilbert space (RKHS)
method.28, 29 Reference energies at the
CCSD(T)-F12/aug-cc-pVQZ level of theory were determined on a grid of
Jacobi coordinates with the N-N separation, the
distance between the center of mass of the diatom and the oxygen atom,
and the angle between the two distance vectors. The grid in
contained 15 points between 1.6 a0 and 3.1 a0, 15 points
between 1.8 a0 and 4.75 a0 for , and a 10-point
Gauss-Legendre quadrature between and for
. All calculations were carried out using the MOLPRO
package.30
The total energy is represented by a 3D kernel as
| (1) |
and the total PES is represented as . For more details the reader is referred to the literature.28 Reciprocal power decay kernels
| (2) |
were used for the radial dimensions ( and ). Here, and
are the larger and smaller values of and ,
respectively. For large separations such kernels approach zero
according to (here ) which gives the
correct long-range behavior for neutral atom-diatom type
interactions. For the angular coordinate a Taylor spline kernel
is used
where and and are
again the larger and smaller values of and , defined similarly
to and .
Intramolecular and intermolecular force field parameters for SF6
are those from the work of Samios et al..31
Intermolecular interactions are based on Lennard-Jones potentials only
and the parameters are optimized such that MD simulations of pure
SF6 reproduce the experimentally observed state points for
liquid and gas SF6, as well as the states of liquid–vapor
coexistence below and supercritical fluid above the critical
temperature , respectively. For xenon the parametrization for a
Lennard-Jones potential from Aziz et al. was used that
reproduces dilute gas macroscopic properties such as virial
coefficient, viscosity and thermal conductivity over a wide
temperature range but not specifically supercritical fluid
properties.32 As discussed further below, the critical
concentration for xenon as determined from simulations (see Figure
S1) was found to be 5.19 M compared with the
experimentally reported value33, 34 of
8.45 M and variations for the critical temperature for xenon
compared with experiments can also be anticipated. In comparison, the
critical concentration of M for SF6 from the present work
(see below) matches the experimental value of
M33, 34 and is close to 5.12 M
(obtained from the reported critical density of 0.74 g/ml) from the
parametrization study.31
Electrostatic interactions are computed based on a minimally
distributed charge model that correctly describes higher-order
multipole moments of a
molecule.25, 26, 27 For
parametrization, a reference electrostatic potential (ESP) of N2O
in the linear equilibrium conformation is computed at the
CCSD/aug-cc-pVTZ level using the Gaussian program
package.35 The optimized MDCM fit reproduces the ESP
with a RMSE of kcal/mol. For SF6 in its octahedral
equilibrium conformation the ESP is computed at the MP2/aug-cc-pVTZ
level of theory using the Gaussian program and the RMSE of the fitted
ESP from MDCM is kcal/mol. Recently,27
non-iterative polarization was also included in MDCM, and this is also
used here for N2O, SF6 and Xe. The polarizability of linear
N2O computed at the CCSD/aug-cc-pVTZ level is Å3 (with
each atom contributing Å3 per atom), compared with
Å3 from experiment.36 For Xe at the
CCSD/aug-cc-pVTZ the computed value of Å3 compares with
Å3 from experiment.36 For SF6, the
experimentally measured polarizability of Å3 was used and
evenly distributed over the fluorine atoms ( Å3 per F
atom).37
The atomic van-der-Waals (vdW) parameters () of N2O were individually optimized by
least-squares fitting using
the trust region reflective algorithm38 to best
describe the nonbonded interactions with Xe and SF6 from comparing
with energies from CCSD/aug-cc-pVTZ calculations for a number of
N2O–Xe and N2O–SF6 heterodimer structures. Lorenz-Berthelot
combination rules of atomic vdW parameters between atom types
(solute) and (solvent) ( at an atom-atom distance of ) were used
throughout. For the reference electronic structure calculations the
grid was defined by center of mass distances between N2O and the
solvent with range Å, and angles with step size of between the N2O bond
axis and the N2O-solvent center of mass direction. Solute–solvent
dimer structures with interaction energies lower than 5 kcal/mol
above the dimer minimum structure were considered which led to 102
conformations for N2O–Xe whereas for N2O–SF6 there were 203
structures. Reference interaction energies for fitting the vdW
parameters were determined as follows. The total energy of the
N2O–solvent (Xe or SF6) pair with the largest separation was
considered to be the zero of energy and energies for all other dimer
structures were referred to this reference. Interaction energies for
the equilibrium pair structure were found with kcal/mol for
N2O–Xe and kcal/mol for N2O–SF6. Correcting for
the basis set superposition error (BSSE) through counterpoise
correction (CPC)39 reduces the interaction energies by up to
to kcal/mol and kcal/mol,
respectively. The alternative “chemical Hamiltonian
approach”40 was found to yield similar
results41 as the CPC which, however, is not
recommended for correlated wave function methods such as
CCSD.42, 43 In addition, the corrections
due to BSSE are of a similar magnitude as the error in fitting the
van der Waals parameters. Therefore, it was decided to not correct
the interaction energies for BSSE. Then, the vdW parameters for
each atom of N2O were optimized to match the interaction energy
predicted by CHARMM with the reference interaction energies from
electronic structure calculations for the respective dimer
conformations. The optimized vdW parameters are given in Table
S2.
3.2 Molecular Dynamics Simulations
Molecular dynamics simulations were performed with the CHARMM program
package.44 Each system (N2O in Xe and N2O
in SF6 at given temperature and solvent concentration) was
initially heated and equilibrated for ps each, followed by
10 ns production simulations in the ensemble using a time step
of 1 fs for the leapfrog integration scheme. The N2O/Xe systems
were simulated at a temperature of 291.2 K and for N2O/SF6 the
temperature was 321.9 K which both are slightly above the
experimental critical temperatures for condensation of xenon and
SF6, respectively ( K,
K).23, 33, 34
A Langevin thermostat (coupling ps-1) was used to maintain
the temperature constant but was applied only to the solvent (Xe and
SF6) atoms. Positions and velocities of snapshots of the
simulations were stored every fs for analysis. As intermolecular
vibrational energy transfer is slow,24 the structure
of N2O was optimized and new velocities from a Boltzmann
distribution at the simulation temperature were assigned to N2O
after the heating step. This ensures that the kinetic energies along
the asymmetric, symmetric and bending modes match the thermal energy
with respect to the target simulation temperature.
The different simulation systems were prepared according to the
conditions used in the
experiments.22, 23, 24 Table
S1 summarizes the concentration (N2O) of N2O,
molar volumes and critical density ratio . The experimentally determined critical densities are
g/ml for xenon and g/ml for SF6
from which critical concentrations of M and M for
xenon and SF6 are obtained,
respectively.33, 34 In all setups, the
simulation box contains one N2O molecule and 600 Xe atoms or 343
SF6 molecules which corresponds to similar simulation box volumes
for similar relative density ratios of the two solvents. In the
original parametrization study a simulation box containing 343 SF6
molecules was used to fit temperature-pressure
properties.31
In the MD simulations for N2O in SF6, electrostatic and
polarization interactions were only computed between the N2O solute
and SF6 solvent. Electrostatic and polarization contributions to
the SF6 solvent-solvent interactions were neglected. Such a
procedure ensures that the pure (liquid, gas) properties of the
solvent are unaltered. All force field parameters are listed in Table
S2 in the supplementary information.
3.3 Analysis
The line shape of the IR spectra for N2O in different solvent densities are obtained via the Fourier transform of the dipole-dipole correlation function from the dipole sequence of the single N2O molecule
| (3) |
A quantum correction factor was applied to the results of the Fourier
transform.45 This procedure yields lineshapes but
not absolute intensities. For direct comparison, individual spectra
are thus multiplied with a suitable scaling factor to bring
intensities of all spectra on comparable scales.
The response of the solute on the solvent structure and dynamics was
evaluated by determining the frequencies of the quenched normal modes
(QNM) of N2O for frames every 5 fs of the simulation. For QNM a
steepest descent geometry optimization for N2O within a frozen
solvent conformation for either 100 steps or until a gradient root
mean square of kcal/mol/Å was reached was carried
out. The mass weighted Hessian matrix of N2O
solute in the solvent with regard to the solute atom displacements
in Cartesian coordinates was determined and diagonalized to obtain
time series of all 9 normal modes including the effect of
solvent.46, 47 Instantaneous normal mode
(INM) analyses were also applied on the solute by diagonalizing its
mass weighted Hessian matrix without prior geometry optimization on
N2O to obtain insights on the impact of the solvent structure on
the translational and rotational modes of the N2O
solute.46
The normalized vibrational frequency-frequency correlation
function (FFCF) / was computed for the time
series of the asymmetric stretch frequency gathered
from the QNM analyses. The amplitude , lifetimes and
offset of a bi-exponential function were
optimized to fit the normalized FFCF for ps.
Radial distribution functions for solvent-solvent and solvent-solute pairs were determined from the average number of molecules of type B within the shell in the range of around molecules of type A.
| (4) |
Here, is the local density of compound B around compound A within a range that is half the simulation box edge length and the shell width was Å. The average coordination number of compounds B within range around compound A can be obtained from according to
| (5) |
4 Results
4.1 Validation of the Interaction Potentials
First, the quality of the intramolecular PES for N2O is discussed,
followed by a description of the van der Waals parameters for the
N2O solute fit to the ab initio reference calculations.
The RKHS model provides a full-dimensional, intramolecular PES for
N2O which was originally developed for investigating the N+NO
collision reaction dynamics.29 The Pearson coefficient
of the RKHS representation and the full set of reference values
is and the root mean squared error (RMSE) between RKHS and
reference energies up to 20 kcal/mol above the equilibrium structure
(78 reference energies) is kcal/mol. To establish the
spectroscopic quality of the PES, the evaluation by the discrete
variable representation (DVR) method using the DVR3D48
package yields a fundamental asymmetric stretch frequency of N2O of
cm-1 compared with 2224 cm-1 from experiments in
the gas phase.49, 50, 51 The
bending and symmetric stretch frequencies obtained from the DVR3D
calculations are 598 cm-1 and 1291 cm-1, respectively, and
the overtone of the bending mode lies at 1184
cm-1. Experimentally, the bending and symmetric stretch are found
at 589 cm-1 and 1285 cm-1, respectively, while the
overtone of the bending frequency is at 1168
cm-1.49, 50, 51
Using MDCMs for the electrostatics of N2O in the two solvent
environments (Xe and SF6) requires a readjustment of the solute vdW
parameters. To keep the solvent-solvent interaction unchanged, only
the vdW parameters of N2O were optimized with respect to
interaction energies from reference electronic structure
calculations.
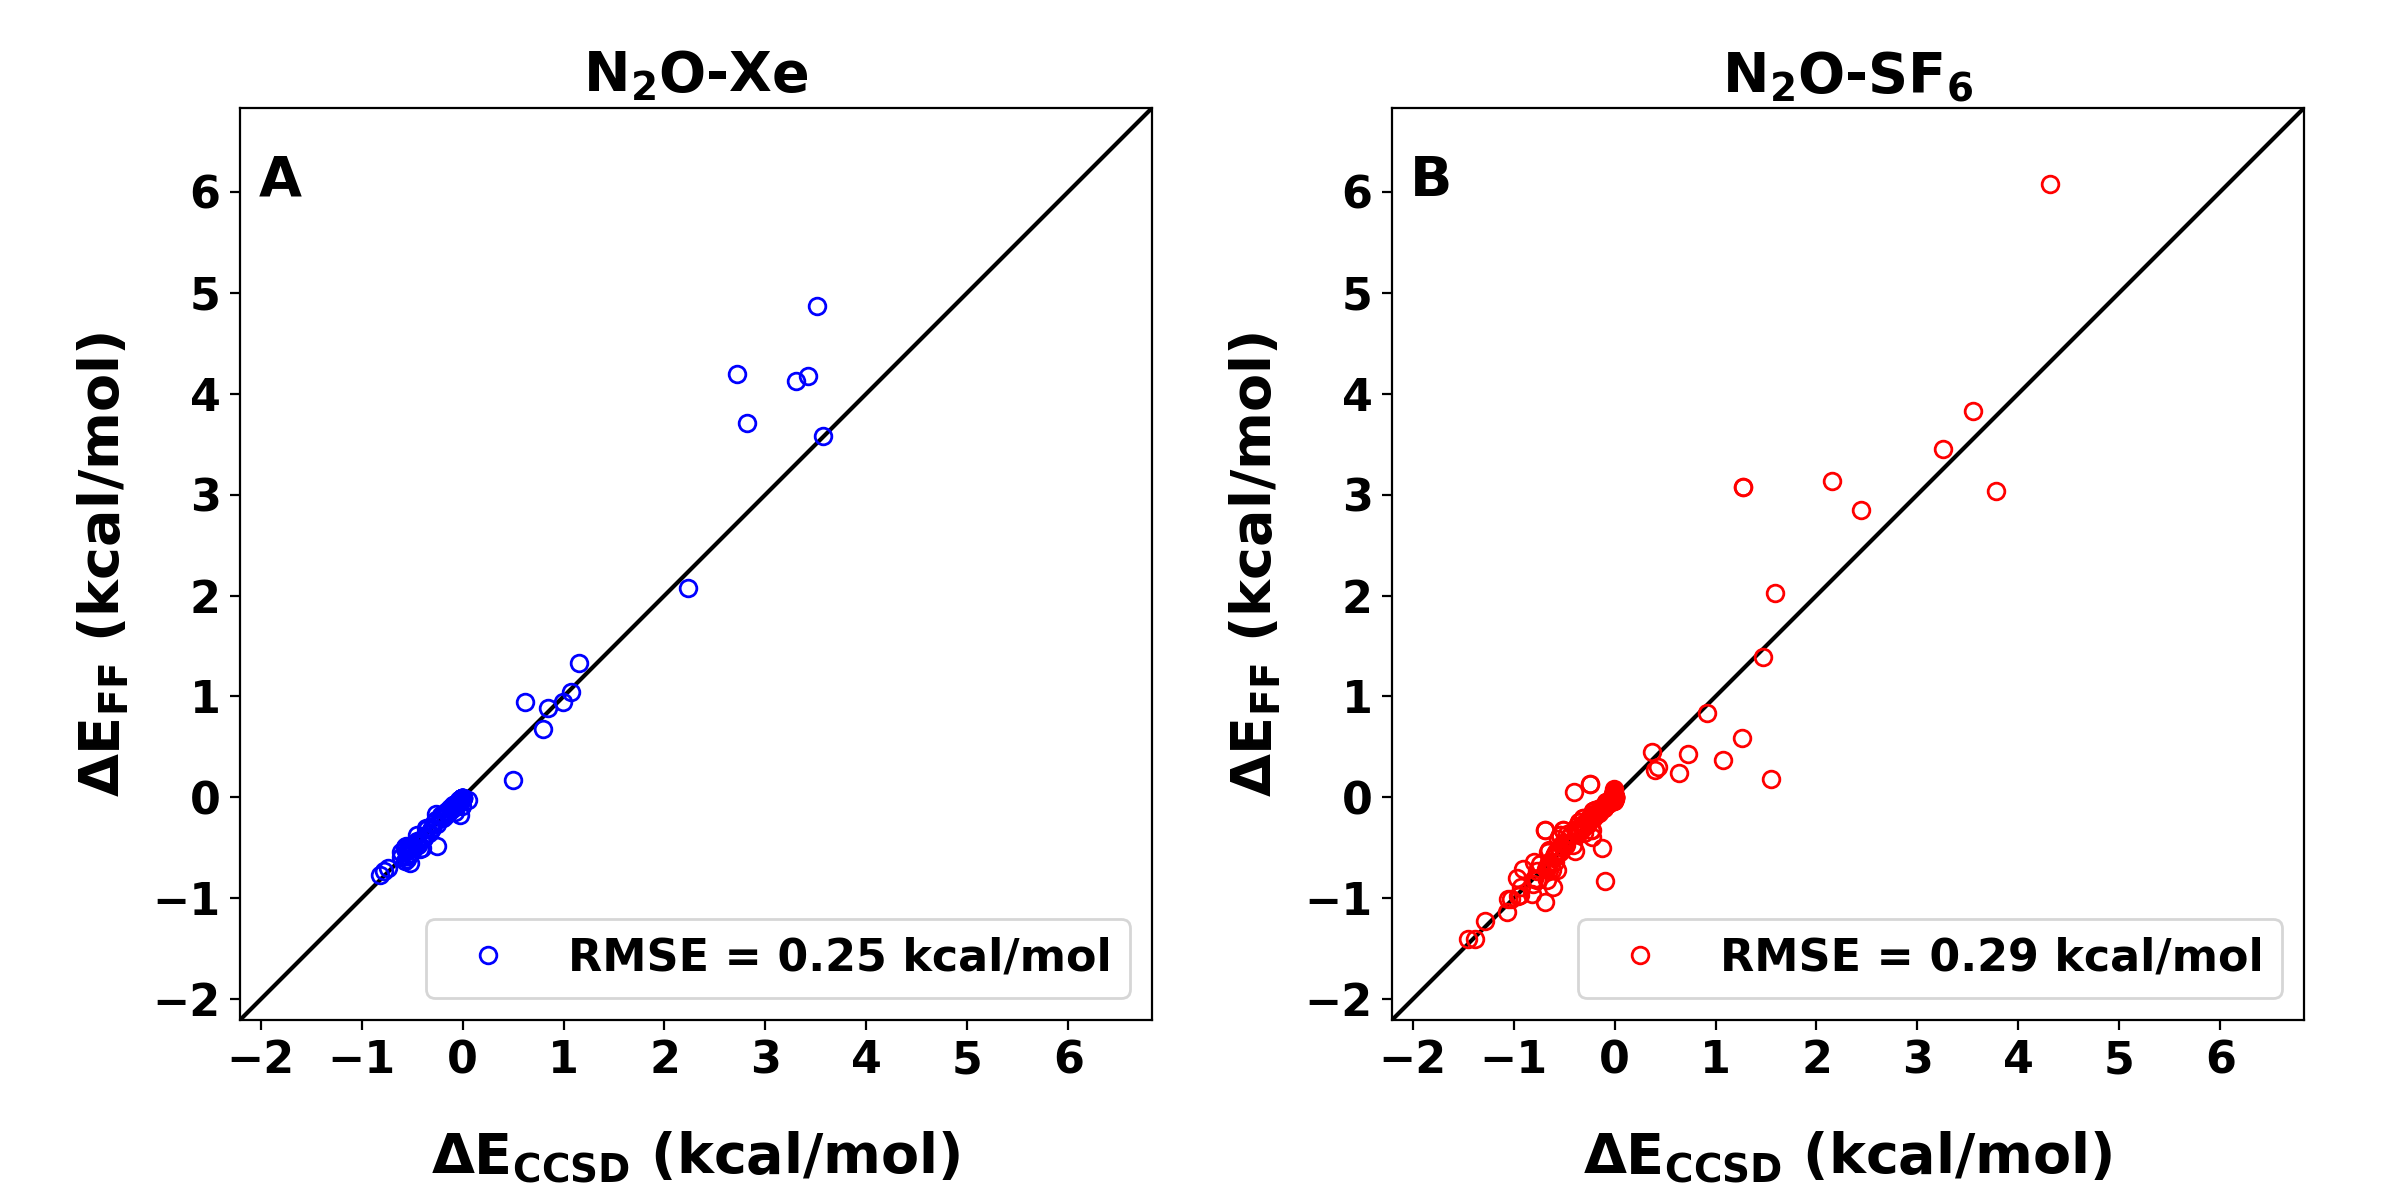
Figure 1 reports the correlation between reference and
model interaction energies with optimized vdW parameters for N2O
for the N2O–Xe (panel A) and N2O–SF6 (panel B) complexes.
The reference interaction energies are the
differences between the respective total ab initio energy of
the pair and the energies of the solute and
solvent fragment in a fixed minimum energy
conformation. The force field energies include electrostatic and
polarization contributions, and the Lennard-Jones potential between
the solute and solvent at the same conformation as in the reference
data set. The energies sample attractive (negative energy) and
repulsive (positive energy) ranges of the N2O–solvent energies and
the comparison is restricted to energies within 5 kcal/mol of the
separated molecules which is the zero of energy. For N2O–Xe, the
RMSE is kcal/mol and for N2O–SF6 it is
kcal/mol. The most stable structure is stabilized by
kcal/mol ( kcal/mol from the fitted energy function)
for N2O–SF6, and kcal/mol ( kcal/mol) for
N2O–Xe.
The critical concentration at which transition to a supercritical
fluid occurs is another relevant property for the present
work. Earlier work showed that this transition can be correlated with
a pronounced increase in the local solvent reorganization lifetime
.52, 53 The quantity
is the integral over the local-density autocorrelation function
and
characterizes the time required for the local environment around a
reference particle, e.g. the solute N2O in the present case, to
change substantially. Hence, can also be considered a
local-density reorganization time.53
Figures S1 and S2 report the local solvent
reorganization lifetimes for pure xenon and SF6,
respectively, from MD simulations. The solvent environments are
defined by cutoff radii which correspond approximately to the first
and second minima of the solvent-solvent RDF, see Figure
S4. For SF6 the force field was
parameterized31 to reproduce the experimentally
measured critical density with corresponding concentration
M at the critical
temperature.33, 34 The present simulations
yield a peak for at M, in close
agreement with the experimental critical concentration at the critical
temperature and the concentration with the local peak in in
Figure 4D. For xenon, however, the parametrization of the
PES32 did not include phase transition properties to the
supercritical regime. Figure S1 shows that the maximum in
occurs at M. This compares with a
critical concentration of 8.45 M at from
experiment.33, 34
4.2 Infrared Spectroscopy
The computed IR spectra for the N2O asymmetric
stretch in xenon and SF6 solution as a function of solvent density
for near critical isotherms allows comparison between experimental and
simulation results. The present work focuses mainly on the change of
the IR line shape at different solvent concentrations especially the
P-, Q-, and R-branch structure, see Figures 2 and
3. The P- and R-branches are the IR spectral features at
lower and higher wavenumber from the pure vibrational transition
frequency for the excitation of mode . The ,
, and band shapes arise due to
conservation of angular momentum during a vibrational excitation upon
photon absorption.49 The Q-branch is the absorption
band feature at the transition frequency. In addition to the
asymmetric stretch ( cm-1, symmetry
A1/), the symmetric stretch
( cm-1, A1/) and the bending
vibration ( cm-1,
E1/) fundamentals from MD simulations are reported
and analyzed as a function of solvent density.
From a quantum mechanical perspective, the rotational structure of an
IR-active vibrational mode for a linear molecule (such as N2O) in
the gas phase leads to P- and R-branches. Selection rules dictate the
change of the rotational and vibrational quantum states, and
, satisfying and for
vibrational modes of A1/ symmetry, and for vibrational modes of E1/ symmetry,
respectively. For N2O, the asymmetric and
symmetric stretch are vibrational modes with parallel
vibrational transition dipole moment to the bond axis and of
A1/ representation, and the bending mode
with perpendicular vibrational transition dipole
moment of E1/ representation. These rotational
selection rules are only strictly valid in the absence of
perturbations (exact free rotor) and break down with increasing
deviation from a free rotor model which, for example, can be due to
embedding the rotor into a solvent of different density which is a
means to tune the strength of the perturbation. As a consequence of
the perturbation a Q-branch-like spectral feature emerges for parallel
bands and becomes dominant with a band maximum at the wavenumber of
the corresponding pure vibrational transition energy at sufficiently
high solvent density.
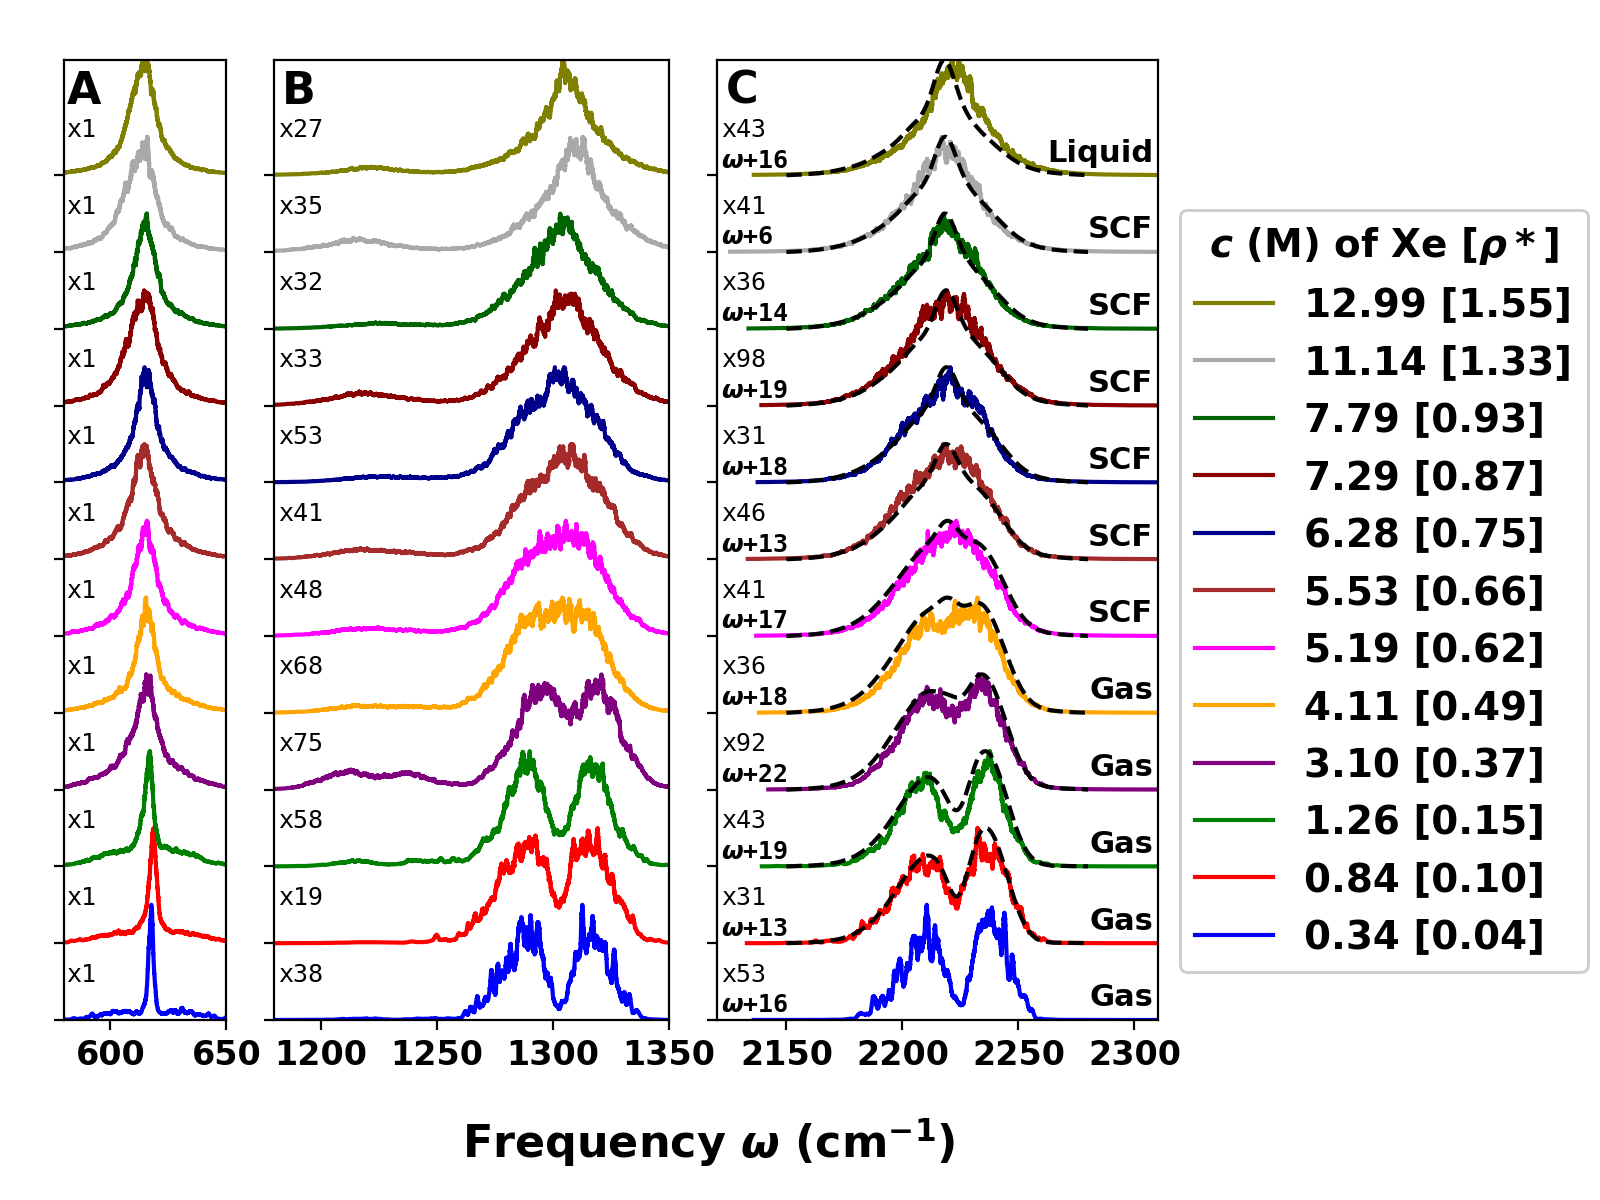
For N2O in xenon the IR band structure of in
Figure 2C ranges from resolved P- and R-branch in gaseous
xenon up to a single near-Lorentzian-shaped band in liquid xenon in
these classical MD simulations. From the simulations, at xenon
concentrations higher than M, or relative density of , the xenon solvent is a supercritical fluid. In
the simulated absorption spectra at this density and above the
P- and R-band structure is not resolved and a
centrally peaked band at the pure vibrational frequency dominates the
band shape. The black dashed lines in Figure 2C are the
experimentally determined spectra at the given solvent
concentration.24, 23, 22
The agreement between experimental and computed N2O in Xe
absorption band shapes is good and captures the dramatic gas
phase-to-condensed phase lineshape change as a function of solvent
density. However, the frequency position of the band
needs to be blue-shifted by a small frequency shift to
achieve the best overlap with the experimental IR line shape. The
density dependent shifts are indicated in the panel and range from
to cm-1 with no discernible trend. The shift
originates from different effects, including insufficient sampling of
the amount and distribution of internal energy within the N2O
solutes vibrational degrees of freedom, remaining small inaccuracies
in the intermolecular interactions, neglecting many-body
contributions, and slightly underestimating the anharmonicity in the
PES along the relevant coordinates.
Figure 2B shows the corresponding band shape for
of N2O in Xe around 1305 cm-1 in comparison
to experimentally measured 1291 cm-1 for N2O in the gas
phase. Similar to , it also displays resolved P- and
R-branches at low solvent concentrations and changes into a
Q-branch-like dominated structure in supercritical and liquid xenon.
The IR band of the N2O bending mode appears
at around cm-1 shown in Figure 2A, compared
with 589 cm-1 from experiment in the gas
phase.49 At low solvent concentrations the band
structure of from the MD simulations is a sharp
Q-branch with weaker P- and R-branch side bands consistent with the
quantum mechanical selection rules. The intensity of these bands are
no longer evident relative to the central bending feature at higher
solvent concentration. The first overtone of the
vibration is also detected between to cm-1 in
Figure 2B but with low intensity. The computed bending
overtone exhibits the same P- and R-branches at low
density and the change to a single peaked band at high solvent
concentration as observed for the and
band structures, see Figures S5 and
S6, in agreement with experimental
results.54
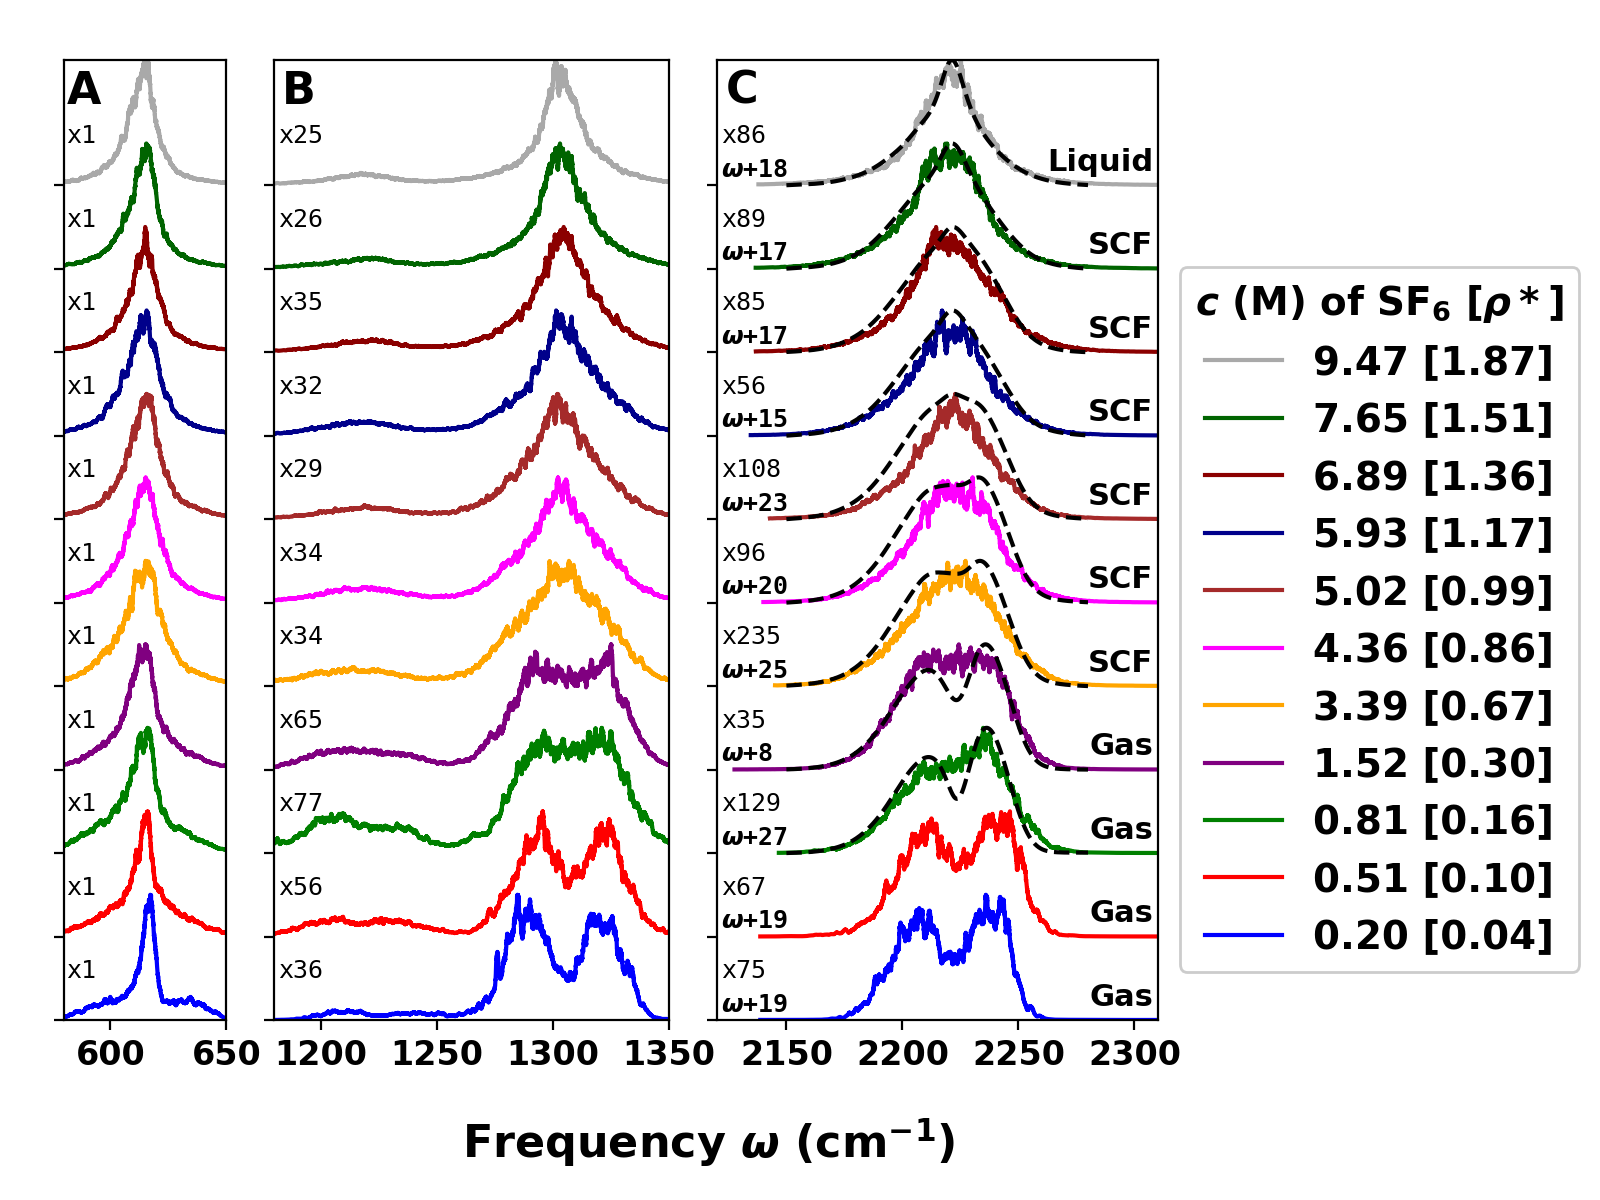
The IR band structure of of N2O in SF6 is
shown in Figure 3C. At the lowest solvent
concentrations M and M ()
the simulated distinct P- and R-branch structure is evident but
gradually disappears for M () for
corresponding experimental state points. As the solvent concentration
of SF6 increases the band shape changes into a single peaked band
in agreement with the experimental IR spectra for
M and M (). The
computed IR spectra for M () do not exhibit the double peak structure or
are narrower compared to the experimental absorption spectra. The
frequency position of the band is also adjusted by a
small frequency blue shift within the range of to
cm-1 to maximize the overlap with the experimental IR line
shape.
The line shapes for the and
vibrational modes are shown in Figures 3A and B as a
function of SF6 concentrations. The mode changes
from P-/R-branches at low solvent concentrations into a single
featured structure in supercritical and liquid SF6. The calculated
IR band of around cm-1 exhibits a
sharp Q-branch with resolvable weak P- and R-branch satellites only at
low SF6 concentration. The first overtone of the perpendicularly
polarized mode is again detected between
to cm-1 with low intensity and a band shape as observed
for the parallel polarized fundamental and
band structures.
4.3 Vibrational Frequency-Frequency Correlation Function
The vibrational frequency fluctuation correlation function (FFCF)
which probes the coupling of the solute vibrational modes to the
solvent environment can be determined from 2DIR experiments. Of
particular interest are the time scales of the lifetimes and
amplitudes with which the FFCF decays which are shown in Figure
S7. In the condensed phase, the FFCF is also related to
the change of the center-line slope at different 2DIR waiting
times.3
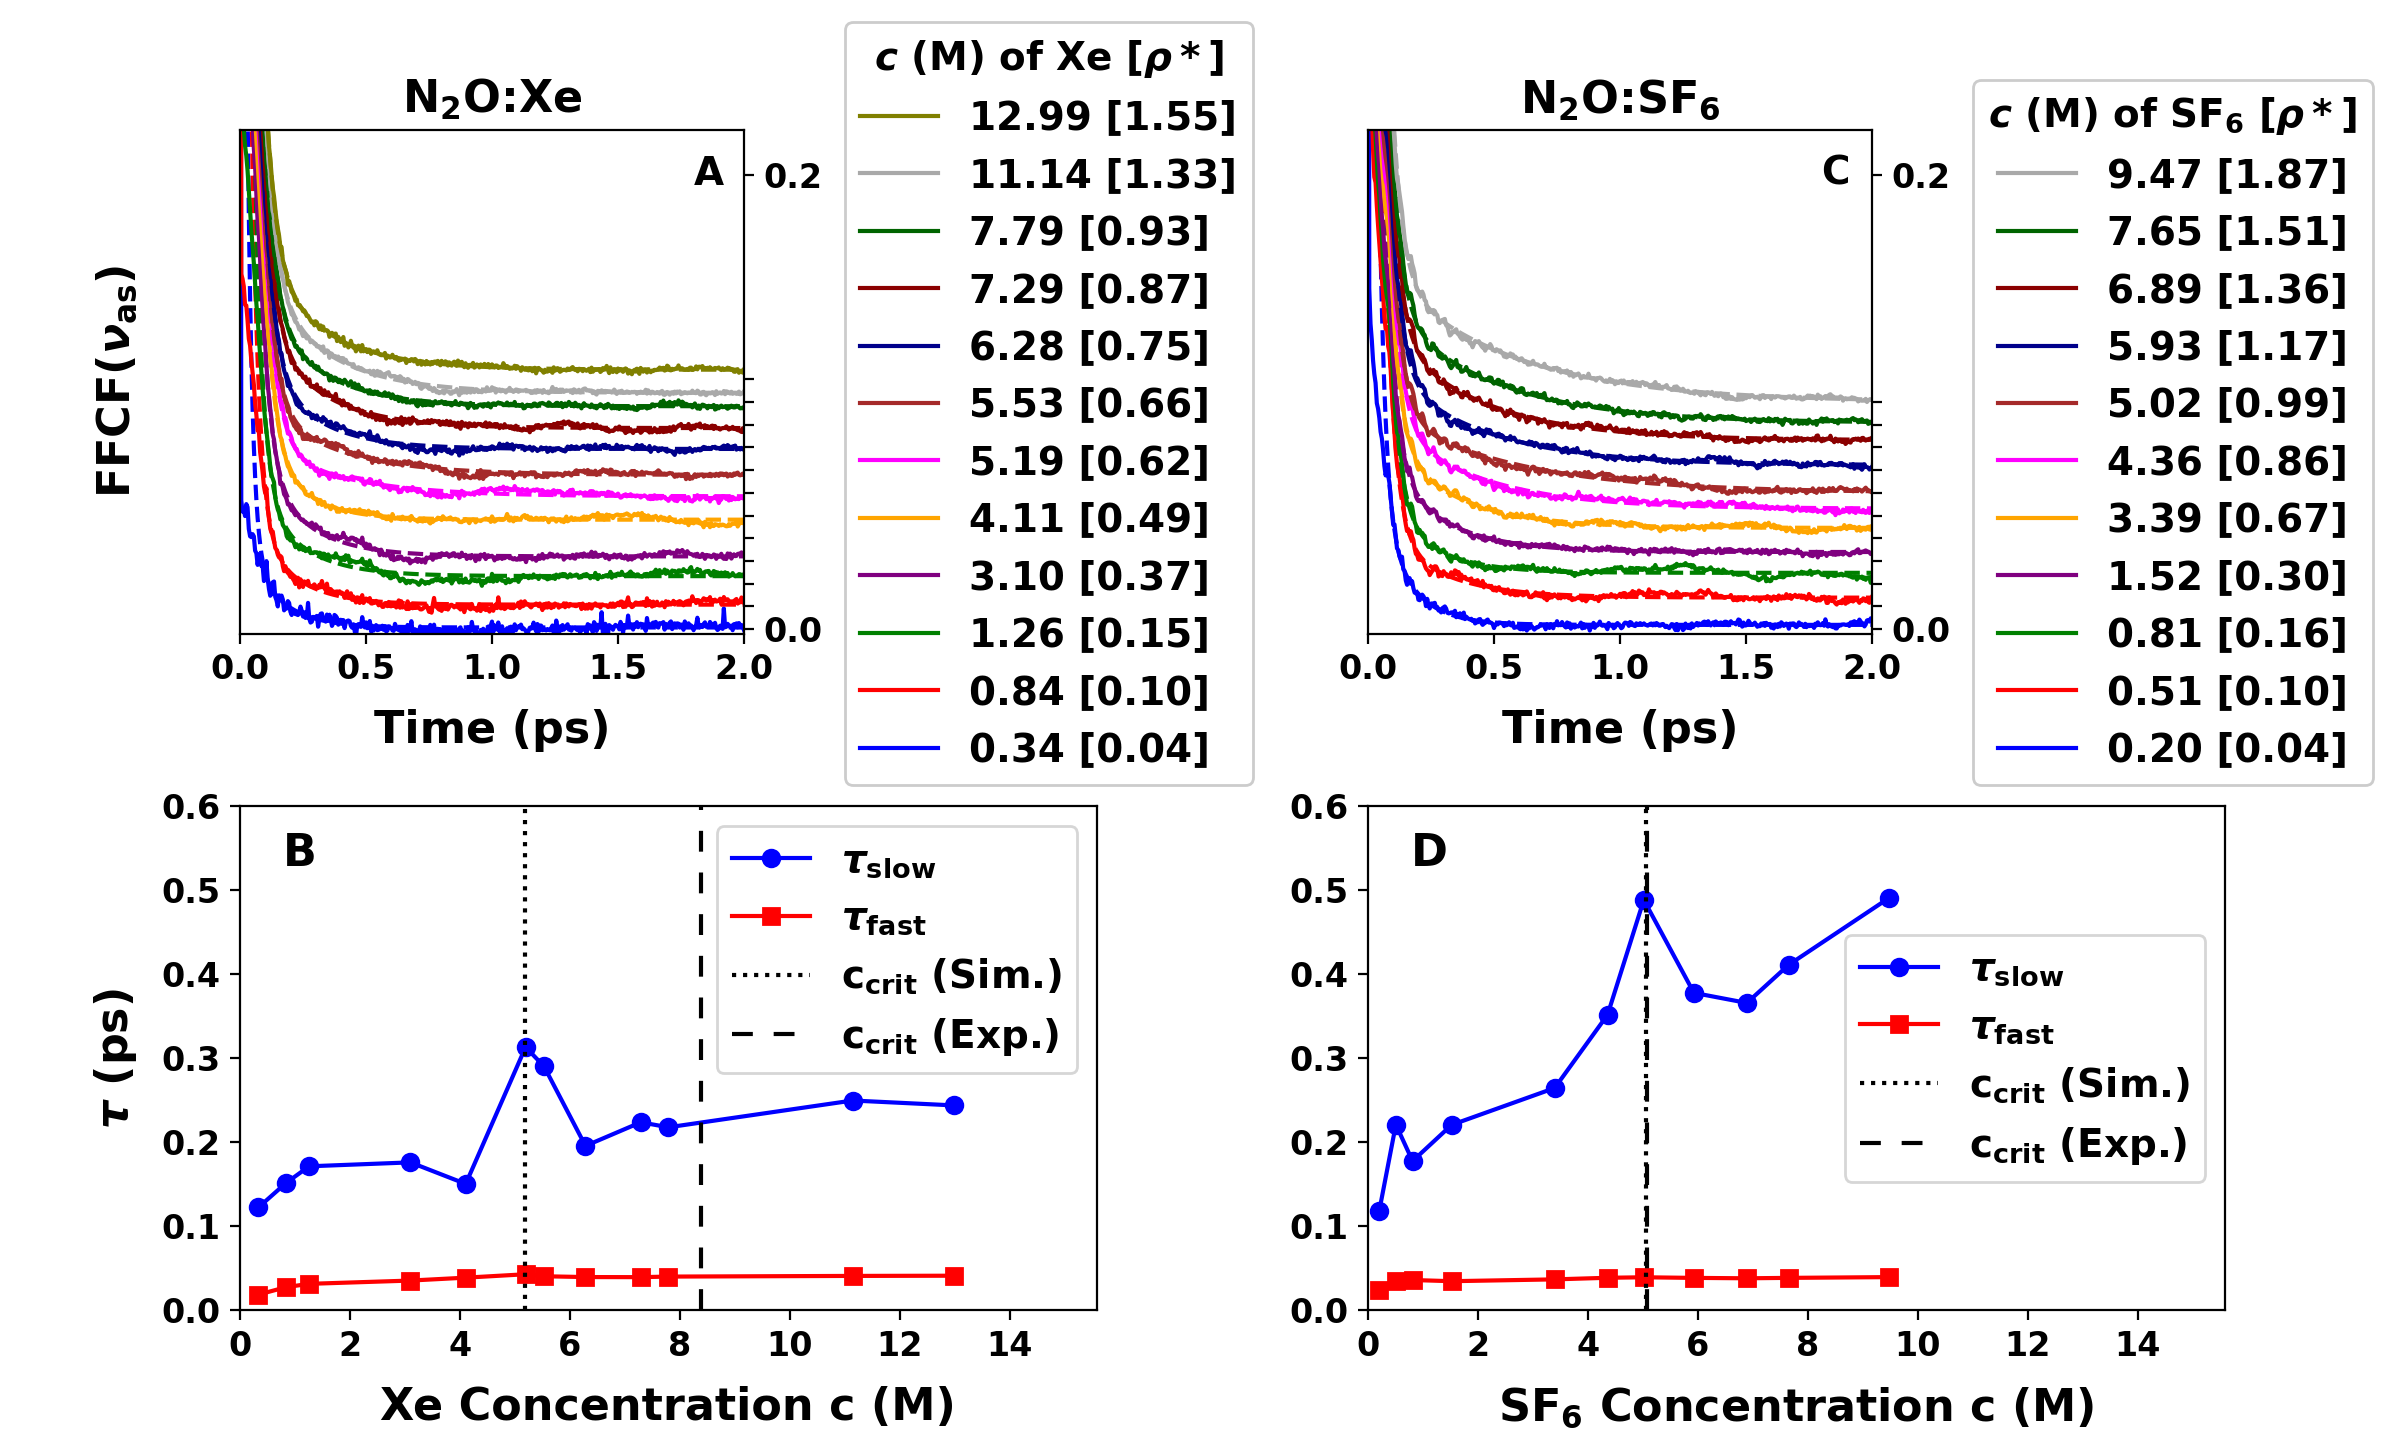
Figures 4A and C report the FFCFs for the asymmetric stretch
mode of N2O in xenon and SF6 from
QNM.1, 55 The fit of the FFCFs using a
bi-exponential decay yields two times: a rapid inertial component
( ps) and a longer spectral diffusion time scale
( ps). It is not possible to directly
compare the computed vibrational FFCFs from INM with the
experimentally measured 2DIR spectra as they are overwhelmingly
dominated by the contribution of rotational energy relaxation
dynamics.22, 23, 24 Nevertheless,
these time scales can be compared with measured and computed time
scales for CN- ( ps
and ps) and for N ( ps and ps) in
H2O.56, 57, 58, 55 Here,
”n.a.” refers to time scales that were not determined or available
from the experiments but clearly appeared in the analysis of the
simulations. A similar behaviour of the vibrational FFCF as the one
found in the present work - a first rapid relaxation time on the 0.05
to 0.1 ps time scale, followed by a slower time scale of 0.5 to
1.0 ps - was reported in an earlier MD simulation study for liquid
HCl.59
It is important to note that experimentally decay times on the several
10 fs time scale are difficult to determine with confidence from
vibrational FFCFs. Therefore only those longer than that are
considered in the following. It is noted that for both ions (CN-
and N) in water, mentioned above, the longer decay times are 1 ps
or longer compared with ps for N2O in SF6. This is
consistent with the fact that ion–water interactions are considerably
stronger than N2O–SF6 interactions. Furthermore, the N2O–Xe
interaction is weakest among all those considered here which leads to
the rather short value for this system, even relative to
SF6. Given that for the present system the intermolecular
interactions are weak and the decay times are rapid it is anticipated
that only for N2O in SF6 would be amenable to 2DIR
experiments.
Figures 4B and D show the dependence of the short ()
and long () time scales as a function of the xenon and SF6
solvent concentration, respectively. In both solvents, the longer
lifetime slows down with increasing concentration and a peak in the
lifetime at M in Xe and M in SF6 is observed. The
pronounced increase in is likely to be related to approaching
the critical point as the local peak in at a SF6 solvent
concentration of 5.02 M matches the critical concentration for pure
SF6. Similarly, for N2O in Xe the peak at M is
consistent with a lengthening of the timescale in this
solution at the critical concentration for pure xenon which was
obtained from the local solvent reorganization lifetimes
, see Figure S1. Thus, both solvents exhibit
critical slowing (lengthening of ) at the critical
concentration of the respective pure solvent.
It is also noted that the slope for for N2O in SF6
is considerably steeper than for Xe as the solvent. This is most
likely also due to the increased solvent-solute interaction strength
between N2O and SF6 compared with Xe. The results for
indicate that interesting dynamical effects, such as critical slowing,
can be expected to develop around the critical point of the
solvent. It is worthwhile to note that at the critical concentration
M for the transition to a SCF the spectroscopy
of the asymmetric stretch changes from P-/R-branches to Q-branch-like
(Figure 2) and the decay time from the FFCF of the
asymmetric stretch (see Figure 4B) features a pronounced
maximum. The fact that for xenon the critical density from the
simulations is underestimated (5.19 M vs. 8.45 M from experiments) but
the concentration-dependence of the spectroscopy agrees with
experiment suggests that orientational relaxation and inhomogeneous
effects play the dominant role for the density dependence of the
dipole correlation function.
Direct comparison of the vibrational FFCFs from INM with the
prior experimental FFCFs is not meaningful at present because of the
overwhelming contribution to the reported FFCF is due to rotational
energy relaxation dynamics. 2DIR spectral features corresponding to
the vibrational FFCF overlap the rotational energy relaxation but
may be accessible in future experimental studies that employ higher
spectral resolution detection than in
Refs.22, 23, 24 Furthermore,
unlike typical 2DIR spectra of condensed phase systems, the
available experimental FFCFs report only on the quasi-free rotor
members of the ensemble contrary to the computed vibrational
FFCFs.
4.4 Radial Distribution Functions and Size of the Solvent Shells
A structural characterization of the solvent environment is afforded
by considering the radial distribution functions between the
center of mass of N2O and the central sulfur atom and the Xe atom,
which are shown in Figure S3A and C, respectively.
They show a wide first peak corresponding to the first solvation
shell around the N2O solute within Å (panel A) for
the xenon and Å (panel C) for the SF6 solvent,
followed by considerably weaker features around 8 Å and beyond
depending on the density.
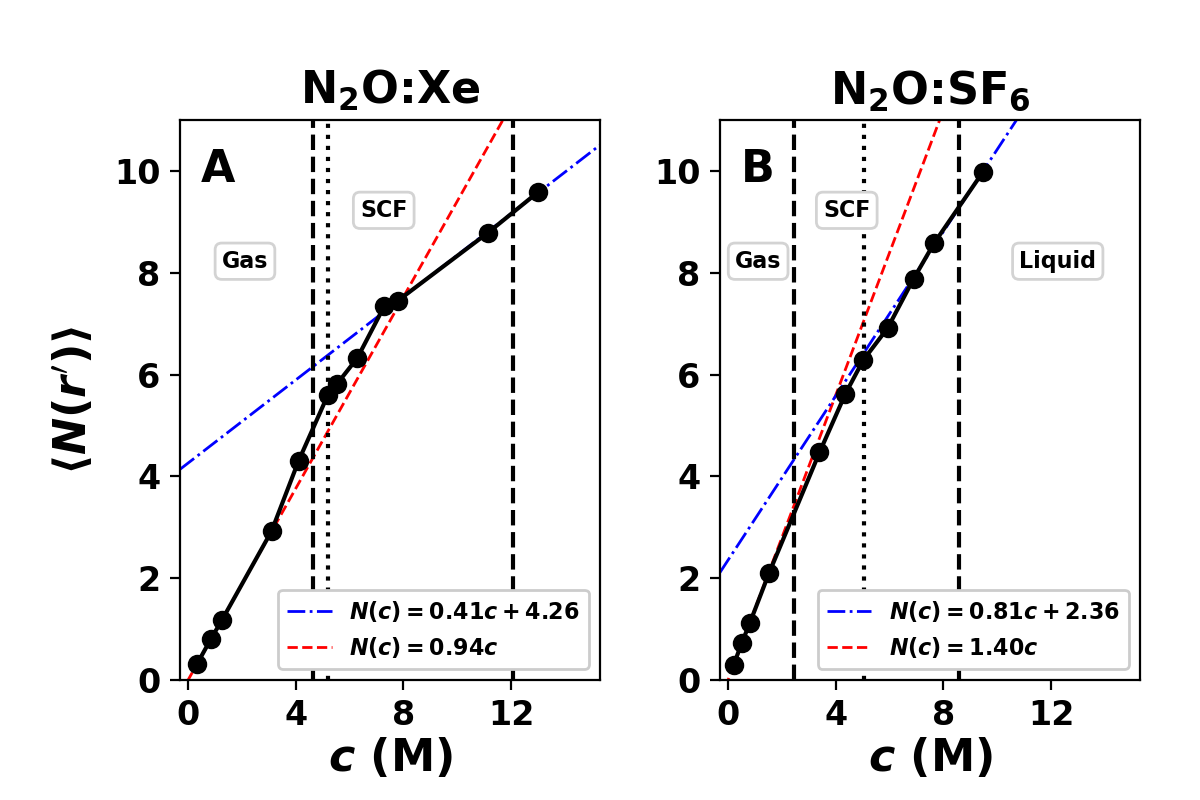
A more concise comparison of how the solvent environment depends on
solvent density can be obtained by considering the average
coordination number of the Xe and SF6
solvent within the first solvation shell (Figures 5A and B)
that are computed from the respective , see Figure
S3. At the respective lowest sampled solvent concentration,
yields an average of Xe atoms (panel A
at M) and SF6 molecules (panel B at M)
within the first solvation shell. The coordination number rises
monotonically with increasing solvent concentration but shows a
decrease in the slope within the SCF regime as the solvation shell
fills. It is interesting to note that both solvents exhibit two slopes
for depending on : a first, steeper one for the
gas-phase-like solvent into the SCF regime, and a second, flatter one,
leading into the liquid-like regime. The slopes for the gas-phase-like
regime is steeper (1.40 M-1) for SF6 than for Xe
(0.94 M-1), which may be related to the solvent-solute
interaction strength.
It is also of potential interest to consider the present results
in the light of the independent binary collision model
(IBC)60, 61, 62 although the
model has also been criticized to be potentially oversimplified when
applied to liquids.63, 64 In the simplest
implementation of the IBC model - where the contact distance is
associated with the position of the first maximum of the
solvent-solute radial distribution function which only
insignificantly changes with density - the rate for a given process,
e.g. vibrational relaxation, depends linearly on a) the collision
rate and b) a density independent probability that a given collision
is effective, see Figures S3A and C. As a consequence,
rates adequately described by an IBC model depend linearly on
density which itself is proportional to the occupancy of the first
solvation shell. This is what is found in the present work for low
densities, see Figure 5. However, towards higher
densities, another linear dependence develops with lower slope for
both solvents. The breakdown of the IBC model occurs at slightly
higher solvent concentration for Xe than for SF6 ( M vs. M, see Figure 5)
compared with values of M and 4.0 M from 2DIR
experimentally determined rotational energy relaxation,
respectively.24 Just as found for comparison of the
simulated and experimental absorption spectra, further refinement of
the N2O–SF6 interactions will provide even better
quantitative agreement with experiment, for example within a PES
morphing approach.65
5 Discussion
Classical MD simulations have been previously used to determine and
analyze rotational vibrational spectra of simple solutes, including CO
or HCl in a solvent (Argon)66, 67 or for
water.68 These calculations demonstrated that
classical MD simulations are capable of realistically capturing P- and
R-branch structures in moderate to high density gases and even in
liquid water.68 Along similar lines, the present MD
simulations of N2O in xenon or SF6 as the solvent reproduce well
the experimentally observed splitting in P-, Q- and R-branches and the
overall lineshapes in the IR spectra of N2O depending on solvent
concentration (see Figures 2 and 3). The
agreement in the computed line shapes of the FTIR
spectrum of N2O in xenon does match with the experimental spectra
as a function of solvent concentration. The separation between the
maxima of the P- and R-branches is cm-1
at M from the simulations, compared with
cm-1 at M from the
experiments. The IR signals for the vibration of
N2O in SF6 show a larger contribution of the Q-branch-like
feature at lower compared to that observed in the
experimental spectra. For simulations in both solvents the computed
spectra are shifted to the red compared with the results from
experiments for .
The computed IR spectra from the classical MD simulations of N2O/Xe
in Figure 2 agree with the relative intensity and band
width of the vibration signal at the corresponding
solvent concentration. The IR spectra of N2O in SF6 in Figure
3 deviate more from the corresponding experimental line
shapes by overestimating solvent-solute interactions, leading to a
somewhat stronger contribution of the Q-branch-like absorption
character at lower solvent concentration. The experimental
signal at the lowest measured solvent density of
M overlaps better with the computed signal at lower solvent
densities of M and M. However, the line shape in
highly dense supercritical and liquid SF6 agrees well with
experiment where the Q-band-like feature dominates the spectral
lineshape and resolvable P- and R-branch contributions are not
evident. At the same absolute density the asymmetric stretch of N2O
is indicative of a more liquid-like character of SF6 as the solvent
compared with xenon, see Figures 2C and
3C.
Splitting of the IR spectrum into P- and R-branches correlates with
free rotor properties of the N2O solute molecule. Based on this,
the results in Figure 3 indicate an overestimation of
the solute-solvent interaction in SF6 because a merged line shape
for arises between 0.81 M and 1.52 M from the
computations whereas experimentally, this occurs for concentrations
between 3.39 M and 4.36 M. Consequently, the rotation of N2O in the
simulations starts to become hindered at lower solvent densities
compared to experiment. This observation correlates with the
long-range and stronger electrostatic interaction between N2O and
polar SF6 rather than xenon as the solvent.
As a comparison, the electrostatic contribution to the interaction
energy of a N2O/SF6 pair in its equilibrium conformation with
kcal/mol is considerably stronger then the polarization
contribution in an N2O/Xe pair with kcal/mol. As the
electrostatic MDCM and vdW parameter fit are only applied to single
molecules or molecule pairs, respectively, the energy function might
insufficiently capture many-body interactions between the N2O
solute and multiple SF6 solvent molecules.
An overtone of the vibration (615 cm-1) of
N2O is found at about twice the frequency between 1220 to
1230 cm-1 in both solvents. The splitting into P- and R-branches
at low solvent densities originates from excitation of simultaneously
two bending mode quanta () and the change of the
rotational state by .69, 70
Consequently, as the splitting of the IR band
depends on the free rotor properties such as for the
and IR band structure, the band shape changes towards
a single Q-branch peak at higher solvent concentrations. In other
words, the rotational “selection rules” followed by the bending
overtone are the same as for the asymmetric stretch vibration which
both have the same symmetry. This quantum mechanical result is seen in
the present classical MD simulations.
The perturbation of the rotational modes by the solvent are visualized
by the INM in Figures S8A and B for N2O in SF6 and
xenon at different densities, respectively. The INM histogram for
N2O in SF6 shows two peaks around the zero frequency line for
low positive and imaginary frequencies (positive and negative second
derivative of the potential projected along normal mode displacement,
respectively). The emerging shoulder(s) in the INM histogram
towards higher solvent densities (Figure S8) are due to
low-frequency modes involving solute-solvent interactions. This
leads to larger deviations from a free rotor movement of the N2O,
akin to motion in a density-dependent rotationally constraining
solvent potential.23 Visual inspection of the
normal modes identifies these as librational modes or frustrated
rotations. The INM histogram for N2O in xenon in Figure
S8B shows less narrow peaks and lower shoulders for gaseous
solvent in comparison with the INM distribution of N2O in SF6 in
Figure S8A. The higher mode density around low frequencies
for the INMs of N2O in xenon relative to SF6 also indicates
lower perturbation of free rotor character in gaseous and
supercritical xenon solvent than SF6.
The change of the IR spectra for linear molecules in gaseous,
supercritical up to liquid solvents can be compared with the
experimental and theoretical work on hydrogen cyanide in an electric
field.71, 72 With increasing field
strength, the molecules evolve from a free rotor to those trapped in
pendular states which is one way to control the population of
rotational states in molecular beam experiments. The electric field
lifts the degeneracy of the quantum number (the projection of
the angular momentum on the electric field direction) for each
rotational state and leads to a manifold of different transitions
that corresponds to the IR spectra. Pendular states are linear
combinations of field-free states covering a range of
values but sharing the same quantum number, i.e. mixing
occurs.71 With increasing electric field strength
the field-free selection rule breaks down. For
excitation along dipole transition vectors parallel to the electric
field the P- and R-branch change into a single Lorentzian-shaped
Q-branch at large electric field strength.71
The effects found for polar molecules in external electrical fields
can be compared with the motion of N2O in a supercritical or liquid
solvent. Here, the solvent molecules form a cavity around the solute
where the direction of the angular momentum is not energetically
degenerate and N2O behaves like in a pendular state. In analogy to
a molecule in an electric field, the P- and R-branches collapse into a
single Q-branch-like band structure for vibrational modes with
transition dipole moments perpendicular to the angular momentum of the
molecule upon breakdown of the usual selection rules.
The IR spectra derived from classical MD simulations can also be analyzed following a model by Skinner et al. who considered the dipole-dipole correlation function as a product ansatz of a vibrational and a rotational component .68 The composition of the IR band by P/R-branch and Q-branch depends on the angle between the vibrational transition vector and the rotational axis. Assigning the vibration and rotation with an angular frequency and , the time-dependence of the correlation function for an idealized classical rotor (without damping) has been expressed as
| (6) |
which assumes constant angular velocity, an approximation that does
not necessarily hold for vibrating molecules.68 The
Fourier transform of in equation 6 leads to
one Q-branch signal at for parallel alignment of
the rotational axis and vibrational transition dipole vector () and two P- and R-branch signals at and
for perpendicularly aligned rotational axis and vibrational transition
dipole vector (). For other cases or an unstable
rotation axis, signals for all P-, Q- and R-branches arise in the IR
spectra.
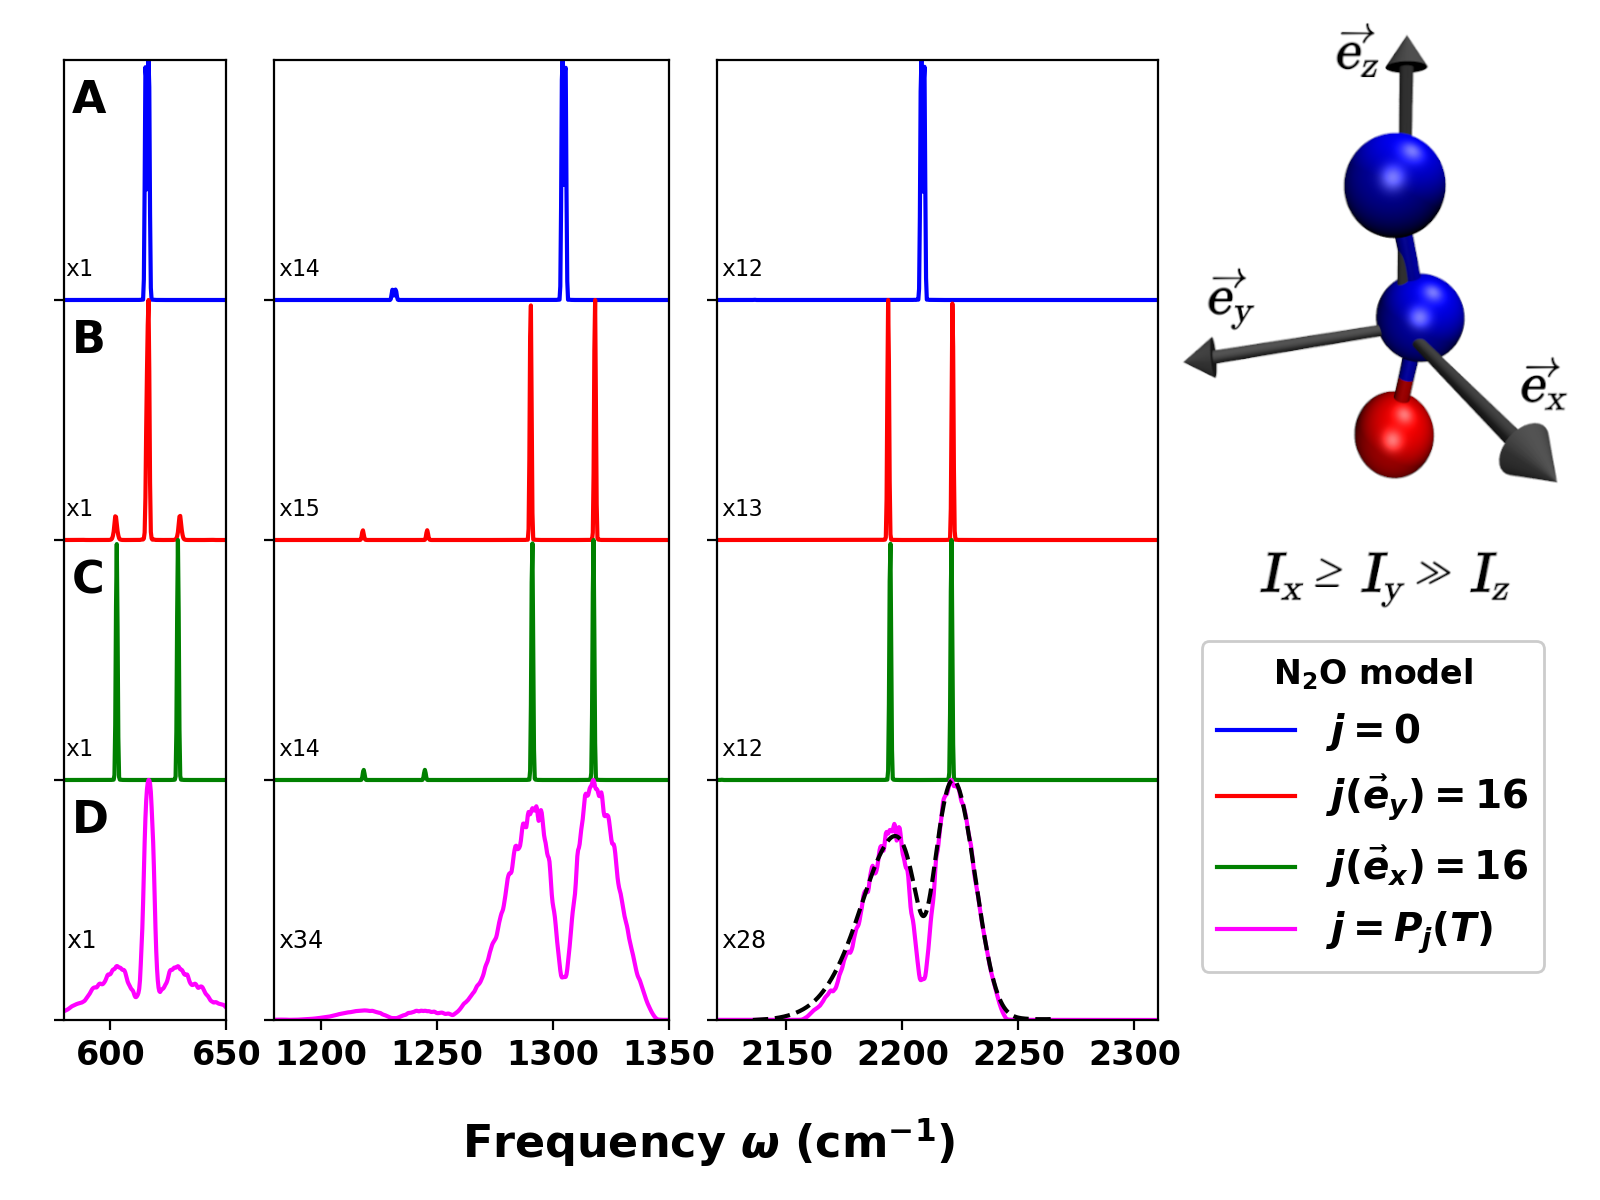
Figure 6 shows computed IR spectra from the Fourier
transform of the dipole-dipole correlation function from MD
simulations of a single N2O molecule with different initial
conditions. For all cases (A-D) intramolecular energy is distributed
along all vibrational normal modes with respect to the thermal energy
at K. Without any rotational energy assigned the IR spectra
in Figure 6A shows no split into P- and R-branches.
With rotational energy assigned around rotational axis parallel
to the transition dipole vector the IR spectra in Figure
6B shows separation into P- and R-branches by
28 cm-1 for stretch that correlates for a
rotational constant of cm-1. The IR signal of
the bending mode primarily consists of the Q-branch with two small P-
and R-branch satellites separated by cm-1 each from the
Q-branch. For rotational energy assigned around a rotational axis perpendicular to both stretch and bending transition dipole moments
all IR signals in Figure 6C split in P- and R-branches
as well ( cm-1) but no Q-branch is
observed. The rotational energy corresponding to the rotational
quantum state is the state with the highest probability
according to the Maxwell-Boltzmann distribution function for
N2O at K.
At lower solvent density, the appearance of P-, Q- and R-branch in the
model IR spectra in Figure 6B can be explained by the
mechanical instability of a rotation around the transition dipole
vector of the bending mode . For bent N2O the moment of
inertia are ordered by . According to the tennis
racket theorem73 the rotation around the axis
with the middle moment of inertia is unstable. Thus, the angle between
rotation axis or angular momentum vector and the transition dipole
vector of the bending mode varies in time and gives rise to P-, Q- and
R-branch signals.
A superposition of model IR spectra at varying rotational energy
states and randomly sampled rotation axis but perpendicular to the
N2O bond axis yields a line shape close to the computed spectra of
N2O in gaseous solvent at lower concentrations. The contribution of
the single IR spectra at rotational state to the model spectra in
Figure 6D are scaled by the probability value
according to K. An average rotational constant cm-1 is computed from the spectra with rotational states
, which is in perfect agreement of the experimentally
determined rotational constant of cm-1.74 Hence, overall two regimes can be
distinguished: for low densities the rotational motion of the solute
is oscillatory and guided by the mechanical instability around the
middle rotational axis (tennis-racket theorem) whereas at higher
densities the constraining effect of the solvent due to tighter
packing leads to a more diffusive rotational motion of the solute.
For additional clarification for how the transition between
P-/R-features and Q-branch-like lineshapes occurs two different models
are briefly considered. The first one operates directly on the
dipole-dipole correlation function of a single N2O molecule whereas
the second one uses a Langevin-type simulation of one N2O molecule
in the gas phase. The influence of a solvent can be heuristically
included by multiplication of the dipole-dipole correlation function
, see Eq. 6, with an exponential damping,
i.e. considering . The damping with
characteristic time models all sources of the dipole
correlation function decay, primarily the solvent density dependence
on orientational relaxation due to collisions between N2O and the
solvent in the present case. With increasing density of the solvent,
for example, decreases, which leads to loss of knowledge about
its rotational motion as well as broadening of the computed IR
signals, see Figure 7A. Consequently, the
P-/R-features collapse into a single Q-branch-like peak for relaxation
decays ps which are considerably shorter
than the rotational periods.
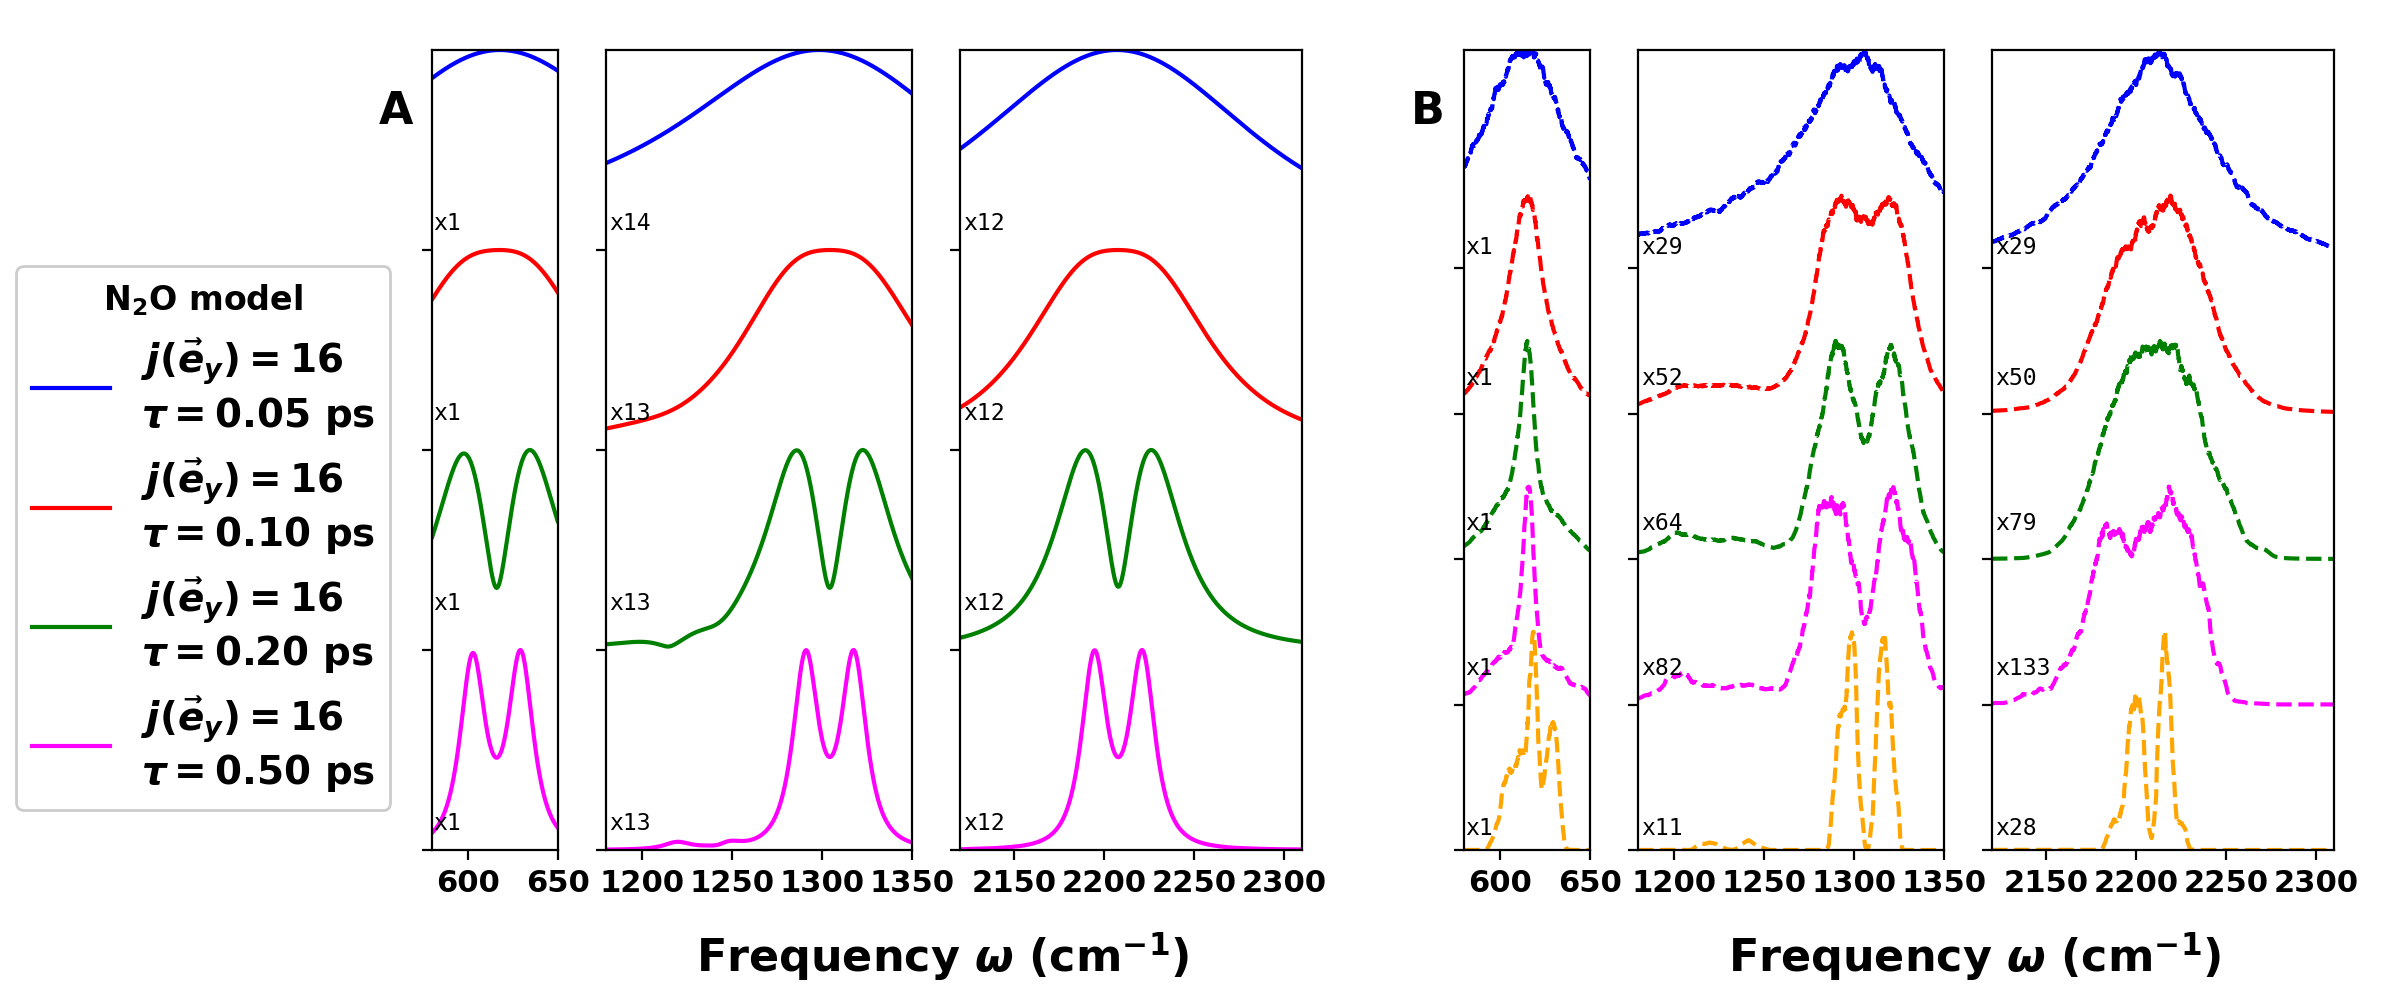
Alternatively, interaction with a solvent can be modelled from MD
simulations with a stochastic thermostat, such as in Langevin
dynamics, which applies random forces on the atoms to simulate
orientational interactions with the heat bath. For this, 10 ns
Langevin simulations with varying coupling strengths were run
for a single N2O molecule in the gas phase using CHARMM and the
dipole-dipole correlation function was determined. Figure
7B shows the computed IR spectra. At low coupling
strength ps-1 the IR spectra
still yield a split of the asymmetric stretch into P- and
R-branches (yellow trace). With increasing friction ps-1
still multiple peaks are visible in the asymmetric stretch absorption
lineshape but the spectral Q-branch-like region is getting filled in
(pink trace). At yet higher ps-1
(green, red, blue traces) the P-/R-features wash out entirely.
Finally, it is of some interest to discuss the results on the
spectroscopy (Figures 2 and 3) and the solvent
structure (Figure 5) from a broader perspective. The
interaction between N2O and Xe is weaker by about 50 % than that
between N2O and SF6. The type of interaction also differs: pure
van der Waals (in the present treatment) for Xe versus van der Waals
and electrostatics for SF6. It is interesting to note that the
transition between the P-/R- and the Q-band-like spectra in Xe occurs
at ( M) compared with
( M) for SF6, see Figures 2 and
3. This is consistent with the increased interaction
strength for N2O–SF6 as fewer solvent molecules are required to
sufficiently perturb the system to illicit the change in the
spectroscopy. Similarly, the slope of vs. concentration can
also serve as a qualitative measure for the interaction strength. To
stabilize a solvent shell of a certain size a smaller number (lower
concentration) of solvent molecules is required if the solvent:solute
interaction is sufficiently strong. These qualitative relationships
are also reflected in the longer values of the FFCFs for
N2O in SF6 compared with Xe as the solvent, see Figure
4. For large polyatomic molecules in highly
compressible fluids, “attractive” solutes have been found to
recruit increased numbers of solvent molecules which leads to local
density augmentation.75 While the amount of
augmentation was found to correlate well with the free energy of
solvation of the solute from simulations, computations and
experiments were reported to follow different correlations.
6 Conclusion
In conclusion, the present work establishes that the rotational structure of the asymmetric stretch band is quantitatively described for N2O in xenon and is qualitatively captured in SF6 compared with experiment. Specifically, the change from P-/R-branches in the gas phase environment changes to a Q-branch-like structure, eventually assuming a Lorentzian-like lineshape once the solvent passes through the supercritical fluid to the liquid state. Transition between the gas- and SCF-like solvent is reflected in a steep increase in the longer correlation time in the FFCF for both solvents. As the density of the solvent increases, additional solvent shells appear in . The present work suggests that atomistic simulations together with machine learned and accurate electrostatic interactions yield a quantitative understanding of the spectroscopy and structural dynamics4 from very low density to the liquid environment with the possibility to characterize transition to the SCF.
7 Supplementary Material
See supplementary material for additional data and figures referred to in the manuscript that further support the findings of this work.
8 Acknowledgment
This work was supported by the Swiss National Science Foundation grants 200021-117810, 200020-188724, the NCCR MUST, and the University of Basel (to MM) and by European Union’s Horizon 2020 research and innovation program under the Marie Skłodowska-Curie grant agreement No 801459 -FP-RESOMUS which is gratefully acknowledged. The support of the National Science Foundation grant CHE-2102427 (LDZ) and the Boston University Photonics Center is gratefully acknowledged. We thank James L. Skinner for valuable correspondence on Ref.68.
9 Data Availability
Raw data were generated at the University of Basel large scale facility. Derived data supporting the findings of this study are available from the corresponding author upon reasonable request. The data and source code that allow to reproduce the findings of this study are openly available at https://github.com/MMunibas/N2O_SF6_Xe.
References
- Stratt and Maroncelli 1996 Stratt, R. M.; Maroncelli, M. Nonreactive dynamics in solution: The emerging molecular view of solvation dynamics and vibrational relaxation. J. Phys. Chem. 1996, 100, 12981–12996
- Turan et al. 2022 Turan, H. T.; Brickel, S.; Meuwly, M. Solvent Effects on the Menshutkin Reaction. J. Phys. Chem. B 2022, 126, 1951–1961
- Hamm and Zanni 2011 Hamm, P.; Zanni, M. Concepts and methods of 2D infrared spectroscopy; Cambridge University Press, 2011
- Meuwly 2022 Meuwly, M. Atomistic Simulations for Reactions and Vibrational Spectroscopy in the Era of Machine Learning - Quo Vadis? J. Phys. Chem. B 2022, 126, 2155–2167
- Guardiola et al. 2017 Guardiola, C.; Olmeda, P.; Pla, B.; Bares, P. In-cylinder pressure based model for exhaust temperature estimation in internal combustion engines. Appl. Therm. Eng. 2017, 115, 212–220
- Hessel et al. 2022 Hessel, V.; Tran, N. N.; Asrami, M. R.; Tran, Q. D.; Long, N. V. D.; Escribà-Gelonch, M.; Tejada, J. O.; Linke, S.; Sundmacher, K. Sustainability of green solvents–review and perspective. Green Chem. 2022,
- Kajimoto 1999 Kajimoto, O. Solvation in Supercritical Fluids: Its Effects on Energy Transfer and Chemical Reactions. Chem. Rev. 1999, 99, 355–*390
- Z̆. Knez et al. 2014 Z̆. Knez,; Markoc̆ic̆, E.; Leitgeb, M.; Primoz̆ic̆, M.; Knez Hrnc̆ic̆, M.; S̆kerget, M. Industrial applications of supercritical fluids: A review. Energy 2014, 77, 235–243
- Töpfer et al. 2022 Töpfer, K.; Pasti, A.; Das, A.; Salehi, S. M.; Vazquez-Salazar, L. I.; Rohrbach, D.; Feurer, T.; Hamm, P.; Meuwly, M. Structure, Organization, and Heterogeneity of Water-Containing Deep Eutectic Solvents. J. Am. Chem. Soc. 2022, 144, 14170–14180
- Kuo et al. 2007 Kuo, C.-H.; Vorobyev, D. Y.; Chen, J.; Hochstrasser, R. M. Correlation of the Vibrations of the Aqueous Azide Ion with the O-H Modes of Bound Water Molecules. J. Phys. Chem. B 2007, 111, 14028–14033
- Bian et al. 2011 Bian, H.; Wen, X.; Li, J.; Chen, H.; Han, S.; Sun, X.; Song, J.; Zhuang, W.; Zheng, J. Ion Clustering in Aqueous Solutions Probed with Vibrational Energy Transfer. Proc. Natl. Acad. Sci. 2011, 108, 4737–4742
- Bian et al. 2011 Bian, H.; Chen, H.; Li, J.; Wen, X.; Zheng, J. Nonresonant and Resonant Mode-Specific Intermolecular Vibrational Energy Transfers in Electrolyte Aqueous Solutions. J. Phys. Chem. A 2011, 115, 11657–11664
- Bian et al. 2012 Bian, H.; Li, J.; Zhang, Q.; Chen, H.; Zhuang, W.; Gao, Y. Q.; Zheng, J. Ion Segregation in Aqueous Solutions. J. Phys. Chem. B 2012, 116, 14426–14432
- Bian et al. 2013 Bian, H.; Chen, H.; Zhang, Q.; Li, J.; Wen, X.; Zhuang, W.; Zheng, J. Cation Effects on Rotational Dynamics of Anions and Water Molecules in Alkali (Li+, Na+, K+, Cs+) Thiocyanate (SCN-) Aqueous Solutions. J. Phys. Chem. B 2013, 117, 7972–7984
- Chen et al. 2012 Chen, H.; Bian, H.; Li, J.; Wen, X.; Zheng, J. Ultrafast Multiple-Mode Multiple-dimensional Vibrational Spectroscopy. Int. Rev. Phys. Chem. 2012, 31, 469–565
- Chen et al. 2014 Chen, H.; Wen, X.; Li, J.; Zheng, J. Molecular Distances Determined with Resonant Vibrational Energy Transfers. J. Phys. Chem. A 2014, 118, 2463–2469
- Chen et al. 2014 Chen, H.; Wen, X.; Guo, X.; Zheng, J. Intermolecular vibrational energy transfers in liquids and solids. Phys. Chem. Chem. Phys. 2014, 16, 13995–14014
- Fernández-Terán and Hamm 2020 Fernández-Terán, R.; Hamm, P. A Closer Look Into the Distance Dependence of Vibrational Energy Transfer on Surfaces Using 2D ATR-IR Spectroscopy. J. Chem. Phys. 2020, 153, 154706
- Schirmer et al. 1970 Schirmer, R. E.; Noggle, J. H.; Davis, J. P.; Hart, P. A. Determination of Molecular Geometry by Quantitative Application of the Nuclear Overhauser Effect. J. Am. Chem. Soc. 1970, 92, 3266–3273
- Bell and Saunders 1970 Bell, R. A.; Saunders, J. K. Correlation of the Intramolecular Nuclear Overhauser Effect with Internuclear Distance. Can. J. Chem. 1970, 48, 1114–1122
- Stryer and Haugland 1967 Stryer, L.; Haugland, R. P. Energy Transfer: A Spectroscopic Ruler. Proc. Natl. Acad. Sci. 1967, 58, 719–726
- Mandal et al. 2018 Mandal, A.; Ng Pack, G.; Shah, P. P.; Erramilli, S.; Ziegler, L. D. Ultrafast Two-Dimensional Infrared Spectroscopy of a Quasifree Rotor: Scrambling and Perfectly Anticorrelated Cross Peaks. Phys. Rev. Lett. 2018, 120, 103401
- Ng Pack et al. 2019 Ng Pack, G.; Rotondaro, M. C.; Shah, P. P.; Mandal, A.; Erramilli, S.; Ziegler, L. D. Two-dimensional infrared spectroscopy from the gas to liquid phase: density dependent J-scrambling, vibrational relaxation, and the onset of liquid character. Phys. Chem. Chem. Phys. 2019, 21, 21249–21261
- Rotondaro et al. 2022 Rotondaro, M. C.; Jain, A.; Erramilli, S.; Ziegler, L. D. Ultrafast 2DIR comparison of rotational energy transfer, isolated binary collision breakdown, and near critical fluctuations in Xe and SF6 solutions. J. Chem. Phys. 2022, 157, 174305
- Devereux et al. 2014 Devereux, M.; Raghunathan, S.; Fedorov, D. G.; Meuwly, M. A Novel, computationally efficient multipolar model employing distributed charges for molecular dynamics simulations. J. Chem. Theo. Comp. 2014, 10, 4229–4241
- Unke et al. 2017 Unke, O. T.; Devereux, M.; Meuwly, M. Minimal distributed charges: Multipolar quality at the cost of point charge elect rostatics. J. Chem. Phys. 2017, 147, 161712
- Devereux et al. 2020 Devereux, M.; Pezzella, M.; Raghunathan, S.; Meuwly, M. Polarizable Multipolar Molecular Dynamics Using Distributed Point Charges. J. Chem. Theo. Comp. 2020, 16, 7267–7280
- Unke and Meuwly 2017 Unke, O. T.; Meuwly, M. Toolkit for the Construction of Reproducing Kernel-based Representations of Data: Application to Multidimensional Potential Energy Surfaces. J. Chem. Inf. and Mod. 2017, 57, 1923–1931
- Koner et al. 2020 Koner, D.; San Vicente Veliz, J. C.; Bemish, R. J.; Meuwly, M. Accurate reproducing kernel-based potential energy surfaces for the triplet ground states of N2O and dynamics for the N + NO O + N2 and N2 + O 2N + O reactions. Phys. Chem. Chem. Phys. 2020, 22, 18488–18498
- Werner et al. 2020 Werner, H.-J.; Knowles, P. J.; Manby, F. R.; Black, J. A.; Doll, K.; Heßelmann, A.; Kats, D.; Köhn, A.; Korona, T.; Kreplin, D. A. et al. The Molpro quantum chemistry package. J. Chem. Phys. 2020, 152, 144107
- Dellis and Samios 2010 Dellis, D.; Samios, J. Molecular force field investigation for Sulfur Hexafluoride: A computer simulation study. Fluid Phase Equilib. 2010, 291, 81–89
- Aziz and Slaman 1986 Aziz, R. A.; Slaman, M. On the Xe-Xe potential energy curve and related properties. Mol. Phys. 1986, 57, 825–840
- Stephenson et al. 1987 Stephenson, R. M.; Malanowski, S.; Ambrose, D. Handbook of the thermodynamics of organic compounds; section on vapor-liquid critical constants of fluids; Elsevier, 1987
- Haynes 2014 Haynes, W. CRC Handbook of Chemistry and Physics; CRC Handbook of Chemistry and Physics; CRC Press, 2014; p. 6-85
- Frisch et al. 2016 Frisch, M. J.; Trucks, G. W.; Schlegel, H. B.; Scuseria, G. E.; Robb, M. A.; Cheeseman, J. R.; Scalmani, G.; Barone, V.; Petersson, G. A.; Nakatsuji, H. et al. Gaussian˜16 Revision C.01. 2016; Gaussian Inc. Wallingford CT
- Olney et al. 1997 Olney, T. N.; Cann, N.; Cooper, G.; Brion, C. Absolute scale determination for photoabsorption spectra and the calculation of molecular properties using dipole sum-rules. Chem. Phys. 1997, 223, 59–98
- Gussoni et al. 1998 Gussoni, M.; Rui, M.; Zerbi, G. Electronic and relaxation contribution to linear molecular polarizability. An analysis of the experimental values. J. Mol. Struct. 1998, 447, 163–215
- Branch et al. 1999 Branch, M. A.; Coleman, T. F.; Li, Y. A Subspace, Interior, and Conjugate Gradient Method for Large-Scale Bound-Constrained Minimization Problems. SIAM J Sci Comput 1999, 21, 1–23
- Boys and Bernardi 1970 Boys, S.; Bernardi, F. The calculation of small molecular interactions by the differences of separate total energies. Some procedures with reduced errors. Molecular Physics 1970, 19, 553–566
- Mayer 1983 Mayer, I. Towards a “chemical” Hamiltonian. Int. J. Quant. Chem. 1983, 23, 341–363
- Paizs and Suhai 1998 Paizs, B.; Suhai, S. Comparative study of BSSE correction methods at DFT and MP2 levels of theory. J. Comp. Chem. 1998, 19, 575–584
- Mentel and Baerends 2014 Mentel, L. M.; Baerends, E. J. Can the Counterpoise Correction for Basis Set Superposition Effect Be Justified? J. Chem. Theo. Comp. 2014, 10, 252–267
- Gray et al. 2022 Gray, M.; Bowling, P. E.; Herbert, J. M. Systematic Evaluation of Counterpoise Correction in Density Functional Theory. J. Chem. Theo. Comp. 2022, 18, 6742–6756
- Brooks et al. 2009 Brooks, B. R.; Brooks III, C. L.; MacKerell Jr., A. D.; Nilsson, L.; Petrella, R. J.; Roux, B.; Won, Y.; Archontis, G.; Bartels, C.; Boresch, S. et al. CHARMM: The Biomolecular Simulation Program. J. Comp. Chem. 2009, 30, 1545–1614
- Ramírez et al. 2004 Ramírez, R.; López-Ciudad, T.; Kumar P, P.; Marx, D. Quantum corrections to classical time-correlation functions: Hydrogen bonding and anharmonic floppy modes. J. Chem. Phys. 2004, 121, 3973–3983
- Cho et al. 1994 Cho, M.; Fleming, G. R.; Saito, S.; Ohmine, I.; Stratt, R. M. Instantaneous normal mode analysis of liquid water. J. Chem. Phys. 1994, 100, 6672–6683
- Kalbfleisch et al. 1996 Kalbfleisch, T. S.; Ziegler, L. D.; Keyes, T. An instantaneous normal mode analysis of solvation: Methyl iodide in high pressure gases. J. Chem. Phys. 1996, 105, 7034–7046
- Tennyson et al. 2004 Tennyson, J.; Kostin, M. A.; Barletta, P.; Harris, G. J.; Polyansky, O. L.; Ramanlal, J.; Zobov, N. F. DVR3D: a program suite for the calculation of rotation–vibration spectra of triatomic molecules. Comput. Phys. Commun. 2004, 163, 85–116
- Herzberg 1945 Herzberg, G. Infrared and Raman Spectra of Polyatomic Molecules; D. Van Nostrand Company, Inc., New York, 1945
- Herzberg and Herzberg 1950 Herzberg, G.; Herzberg, L. Rotation‐Vibration Spectra of Diatomic and Simple Polyatomic Molecules with Long Absorbing Paths VI. The Spectrum of Nitrous Oxide (N2O) below 1.2. J. Chem. Phys. 1950, 18, 1551–1561
- Kagann 1982 Kagann, R. H. Infrared absorption intensities for N2O. J. Mol. Spectrosc. 1982, 95, 297–305
- Maddox et al. 2000 Maddox, M. W.; Goodyear, G.; Tucker, S. C. Origins of Atom-Centered Local Density Enhancements in Compressible Supercritical Fluids. J. Phys. Chem. B 2000, 104, 6248–6257
- Maddox et al. 2000 Maddox, M. W.; Goodyear, G.; Tucker, S. C. Effect of Critical Slowing Down on Local-Density Dynamics. J. Phys. Chem. B 2000, 104, 6266–6270
- Linstorm 1998 Linstorm, P. NIST chemistry webbook, NIST standard reference database number 69. J. Phys. Chem. Ref. Data, Monograph 1998, 9, 1–1951
- Salehi et al. 2019 Salehi, S. M.; Koner, D.; Meuwly, M. Vibrational Spectroscopy of N in the Gas and Condensed Phase. J. Phys. Chem. B 2019, 123, 3282–3290
- Koziński et al. 2007 Koziński, M.; Garrett-Roe, S.; Hamm, P. Vibrational spectral diffusion of CN- in water. Chem. Phys. 2007, 341, 5–10
- Lee et al. 2013 Lee, M. W.; Carr, J. K.; Göllner, M.; Hamm, P.; Meuwly, M. 2D IR spectra of cyanide in water investigated by molecular dynamics simulations. J. Chem. Phys. 2013, 139, 054506
- Maekawa et al. 2005 Maekawa, H.; Ohta, K.; Tominaga, K. Vibrational dynamics in liquids studied by non-linear infrared spectroscopy. Ress Chem. Interm. 2005, 31, 703–716
- Levesque et al. 1983 Levesque, D.; Weis, J.-J.; Oxtoby, D. W. A molecular dynamics simulation of rotational and vibrational relaxation in liquid HCl. J. Chem. Phys. 1983, 79, 917–925
- Litovitz 1957 Litovitz, T. A. Theory of ultrasonic thermal relaxation times in liquids. J. Chem. Phys. 1957, 26, 469–473
- Chesnoy and Gale 1984 Chesnoy, J.; Gale, G. Vibrational energy relaxation in liquids. Ann. Phys. 1984, 9, 893–949
- Adelman et al. 1991 Adelman, S.; Muralidhar, R.; Stote, R. Time correlation function approach to vibrational energy relaxation in liquids: Revised results for monatomic solvents and a comparison with the isolated binary collision model. J. Chem. Phys. 1991, 95, 2738–2751
- Oxtoby 1981 Oxtoby, D. W. Vibrational relaxation in liquids. Annual Review of Physical Chemistry 1981, 32, 77–101
- Dardi and Cukier 1991 Dardi, P. S.; Cukier, R. Can the independent binary collision theory describe the nonlinear solvent density dependence of the vibrational energy relaxation rate? The Journal of chemical physics 1991, 95, 98–101
- Meuwly and Hutson 1999 Meuwly, M.; Hutson, J. M. Morphing ab initio potentials: A systematic study of Ne–HF. J. Chem. Phys. 1999, 110, 8338–8347
- Berens and Wilson 1981 Berens, P. H.; Wilson, K. R. Molecular dynamics and spectra. I. Diatomic rotation and vibration. J. Chem. Phys. 1981, 74, 4872–4882
- Padilla et al. 2010 Padilla, A.; Pérez, J.; Herrebout, W.; Van der Veken, B.; Bulanin, M. A simulation study of the vibration–rotational spectra of HCl diluted in Ar: Rotational dynamics and the origin of the Q-branch. J. Mol. Struct. 2010, 976, 42–48
- Hestand et al. 2019 Hestand, N. J.; Strong, S. E.; Shi, L.; Skinner, J. L. Mid-IR spectroscopy of supercritical water: From dilute gas to dense fluid. J. Chem. Phys. 2019, 150, 054505
- Chabbi et al. 2000 Chabbi, H.; Dahoo, P. R.; Gauthier-Roy, B.; Vasserot, A.; Abouaf-Marguin, L. Infared Stimulated Emission of N2O Trapped in Argon Matrices: Comparison with O3 and CO2. J. Phys. Chem. A 2000, 104, 1670–1673
- Li et al. 2021 Li, X.; Liu, Z.; Duan, C. Rovibrational spectra of nonpolar (N2O)2 and Ar–N2O complexes in the 2 overtone region of N2O. J. Mol. Spectrosc. 2021, 377, 111424
- Rost et al. 1992 Rost, J. M.; Griffin, J. C.; Friedrich, B.; Herschbach, D. R. Pendular states and spectra of oriented linear molecules. Phys. Rev. Lett. 1992, 68, 1299–1302
- Block et al. 1992 Block, P. A.; Bohac, E. J.; Miller, R. E. Spectroscopy of pendular states: The use of molecular complexes in achieving orientation. Phys. Rev. Lett. 1992, 68, 1303–1306
- Ashbaugh et al. 1991 Ashbaugh, M. S.; Chicone, C. C.; Cushman, R. H. The twisting tennis racket. J. Dyn. Differ. Equation 1991, 3, 67–85
- Tidwell et al. 1960 Tidwell, E. D.; Plyler, E. K.; Benedict, W. S. Vibration-Rotation Bands of N2O∗. J. Opt. Soc. Am. 1960, 50, 1243–1263
- Song et al. 2000 Song, W.; Biswas, R.; Maroncelli, M. Intermolecular interactions and local density augmentation in supercritical solvation: a survey of simulation and experimental results. J. Phys. Chem. A 2000, 104, 6924–6939