Analysis of Wind Energy Curtailment in the Ireland and Northern Ireland Power Systems
Abstract
The All-Island power system (AIPS) of Ireland and Northern Ireland currently accommodates up to 75% of system non-synchronous penetration (SNSP) (e.g., wind). These unprecedented levels of renewable penetration challenge the operation of the power system. The AIPS is not always able to accommodate all of the available renewable generation due to binding operational and technical constraints. In this context, this paper analyses wind energy curtailment in the AIPS using actual data. It is found that there is a positive correlation between the installed wind capacity and curtailment levels, and that the trend is that these levels increase. The paper also shows that the main driver for curtailment in AIPS during 2020-2021 was the operational constraint that imposes a minimum number of conventional units online (MUON) (80% of the time), with the SNSP limit accounting for less than 20%. Other system-wide limits, such as rate of change of frequency (RoCoF) and inertia are found to have a negligible impact on wind curtailment.
Index Terms:
Wind Curtailment, dispatch down, low-inertia, power systems.I Introduction
I-A Motivation
Renewable-rich power systems face several challenges such as ensuring dynamic stability [1], economically maintaining a balance of supply and demand, and managing local congestion/constraint [2]. For example, EirGrid and SONI, the transmission system operators (TSOs) of Ireland (IE) and Northern Ireland (NI), respectively, are, at times, forced to dispatch down renewables when there is more power available from renewable sources than can be accommodated by the grid. This may be necessary for various reasons, among others, local congestion (known as “Constraint”) and stability driven limits on non-synchronous generation (known as “Curtailment”). The term dispatch down, thus, is the result of the combined effect of constraint and curtailment. This paper focuses on wind energy curtailment in the All-Island power system (AIPS), which is, to the best of the authors’ knowledge, the largest synchronous power system in the world able to accommodate up to 75% of system non-synchronous penetration (SNSP).
I-B Literature Review
Research in renewable and, in particular, wind energy curtailment in power systems with very high renewable penetration levels is vast [3, 4, 5, 6]. One of the main well-established conclusions in the literature is that curtailment will be the “new normal” for everyday operations [7]. This is because curtailment is seen both as a source of flexibility (maintain the supply-demand balance) and operating reserves [8]. For instance, references [9, 10, 11] propose to use the curtailed wind or solar power output to provide ancillary services such as automatic generation control, ramping and spinning reserve to the TSO. In the same vein, references [12] and [13] discuss the use of emerging technologies such as battery energy storage and data centers to effectively balance the excess renewable energy output.
With respect to current and expected curtailed volumes of renewable output, reference [14] presents an analysis of solar power curtailment for four key countries namely Chile, China, Germany, and the United States. The paper finds that about 6.5 million MWh of solar power output was curtailed in these countries in 2018 and one of the main reasons is attributable to limited transmission capacity. Reference [15], on the other hand, uses a 2025 model of the Nordic power system to estimate the amount of future curtailment. The study considers two wind power scenarios namely 26 and 33 GW and finds curtailment to be below 0.3% and 1.7%, respectively. The study suggests that the most effective measures to decrease curtailment is increased transmission capacity, as well as flexibility of nuclear generation.
Regarding research on wind curtailment in AIPS, reference [16] discusses the effectiveness of compressed air energy storage (CAES) for mitigating wind curtailment on a 2020 scenario and shows that a 270 MW CAES plant in conjunction with a 75% SNSP limit can reduce wind curtailment levels to 2.6%. Using again a 2020 scenario of AIPS, the authors in [17] show that when the SNSP limit is increased from 60% to 75% there is a reduction in wind curtailment from 14% to 7%, while for higher SNSP values wind curtailment is influenced primarily by the inclusion of transmission constraints. These conclusions only in part align with the analysis presented in this paper.
I-C Contributions
Though studies on wind power curtailment are common in the literature, there is a lack of an analysis based on actual data (i.e., the majority use futuristic scenarios) and most importantly on a real-world large-scale renewable-based power system such as AIPS. In this context, this paper brings the following specific contributions:
-
•
An analysis of wind energy curtailment based on a real-world renewable-based system namely the AIPS.
-
•
Show that the main driver currently for curtailment is keeping a minimum number of conventional units online (MUON) to ensure system security and stability.
This paper aims at serving as a reference for other TSOs facing very high levels of renewable energies in the future and motivate researchers to come up with solutions on how to best manage curtailment.
I-D Paper Organization
The remainder of the paper is organized as follows. Section II discusses the AIPS operational constraints impacting wind curtailment. Section III provides the methodology employed in this work to study wind curtailment levels. Section IV presents the results of the curtailment analysis. Finally, Section V presents the main conclusions.
II Operational Policy Constraints in AIPS
EirGrid and SONI have developed various system-wide operational constraints to ensure system security and stability is maintained at all times [18]. In particular, in order to ensure system stability, the AIPS has in place four operational constraints namely: (i) a SNSP limit; (ii) a MUON limit; (iii) a rate of change of frequency (RoCoF) limit; and (iv) a minimum inertia floor. These constraints are explicitly modeled in the scheduling and dispatch process of the TSOs. The evolution and relaxation of these constraints is crucial to achieve the IE and NI targets of 80% of annual electricity demand coming from renewables by 2030 [19, 20]. Note that renewables in AIPS are mostly non-synchronous (e.g., wind) unlike, for example, countries with large hydro resources (e.g., Norway) or geothermal (e.g., Iceland). A brief description of the above constraints is provided below.
II-A System Non-Synchronous Penetration
With increasing level of installed non-synchronous generation capacity (e.g., wind and solar), and further high voltage direct current (HVDC) interconnection to the AIPS, it is necessary to measure and limit the SNSP to ensure secure and prudent operation of the system [21], [22]. Its formulation is shown in the equation below:
| (1) |
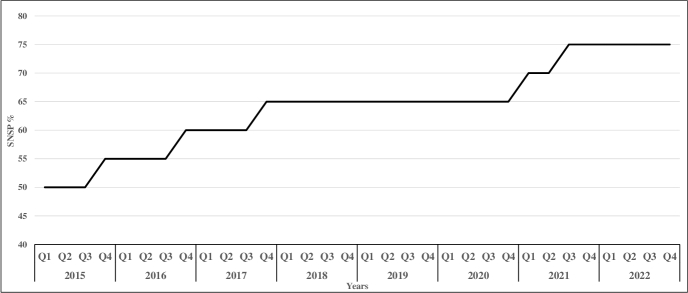
The SNSP metric was developed around a decade ago based on extensive studies to provide a single constraint (modeled in the scheduling and dispatch process of TSOs) that captures the range of issues. Its evolution over the years is shown in Fig. 1. As it can be seen, SNSP limit is currently set at 75%.
II-B Minimum Number of Conventional Units Online
The MUON constraint is a system-wide (“catch-all”) constraint. Currently, it is set to 8 (5 in IE and 3 in NI) large conventional generation units (from a selected subset of the available generators) and planning to move to 7 by next year. It serves to provide stability for a range of potential system phenomena, such as frequency stability, voltage, and system strength. However, there is a need to relax this constraint to make room for more renewables in the system and thus achieve both governments’ targets. In this context, EirGrid and SONI plan to lower this limit to 4 by 2030 [18].
II-C Rate of Change of Frequency
RoCoF is applied as a constraint in the scheduling and dispatch process of the TSOs. Its mathematical formulation is as follows:
| (2) |
where f is the system frequency (Hz); is the the size of the infeed/outfeed lost event (MW); is the system inertia at the time of the event (MWs); and is the inertia of the unit that caused the imbalance (MWs). This constraint is put in place to account for the largest single infeed/outfeed. Around a decade ago, the TSOs performed extensive studies and found out that it would be difficult to ensure stable system operation with a RoCoF of 0.5 Hz/s at high SNSP levels (e.g., 50%). As a result, a program of work was followed by the TSOs, the generator market participants and the distribution system operators to work towards changing the RoCoF setting on all assets to 1 Hz/s. The TSOs are currently trialling this limit of 1 Hz/s.
II-D Inertia Floor
In power systems, inertia refers to the ability of the system to oppose changes in system frequency. According to (2), inertia is inversely proportional to RoCoF. In other words, higher inertia mean lower RoCoF. Currently, this limit is set to 23 GWs and it is planned to lower it to 20 GWs by next year and continue operating at this limit in the future. The inertia floor can be met by a combination of the units that are constrained on by MUON. Deployment of other low carbon inertia sources (e.g., synchronous machines) and potentially inverter-based resources would contribute to providing inertia in the future.
III Methodology of the study
Figure 2 shows the categorization used to calculate the dispatch down of renewables in AIPS, and, in particular, the levels of wind curtailment. Dispatch down is composed of two terms namely constraint and curtailment (i.e., total of constraint and curtailment). Note that dispatch down of renewables for reasons of oversupply (i.e., for energy balancing) are not considered in Fig. 2. Dispatch down of wind farms in the AIPS is managed through the wind dispatch tool implemented in the control centers of the TSOs.
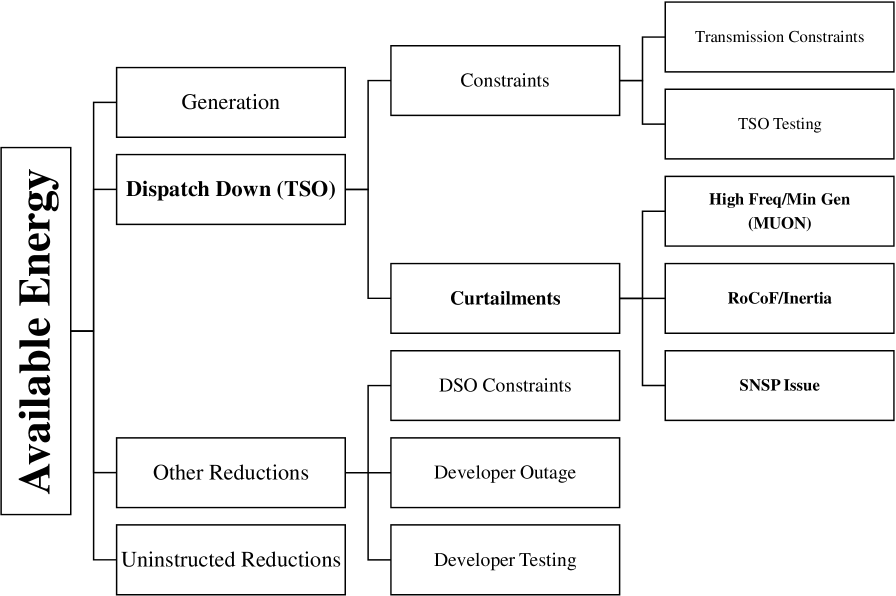
The control center operators use the tool to issue supervisory control and data acquisition (SCADA) control set points (i.e., for curtailment or constraint) to wind farms control systems on a pro-rata basis (applied regionally for constraint and globally for curtailment) resulting in the change to their active power output. These instructions sent to wind farms are labeled with a reason code. Specifically, as Fig. 2 shows, the reason codes for curtailment are the following: (i) MUON; (ii) RoCoF/Inertia; and (iii) SNSP. It is important to mention here that these reason codes can occasionally overlap (e.g., SNSP issue and MUON). However, the methodology for determining the final reason code is based on the reason code used for the last instruction.
Further, these instructions are reported in the dispatch down reports for each wind farm. Next, we select a typical wind farm dispatch down report and see when curtailment was active during the year in a 1 minute resolution. The cases when curtailment is active are then used to download the respective data from the historical information system (coming from SCADA and stored in 1 minute resolution). The interested reader is referred to [23] for further information on the dispatch down methodology in the AIPS.
IV Case Study
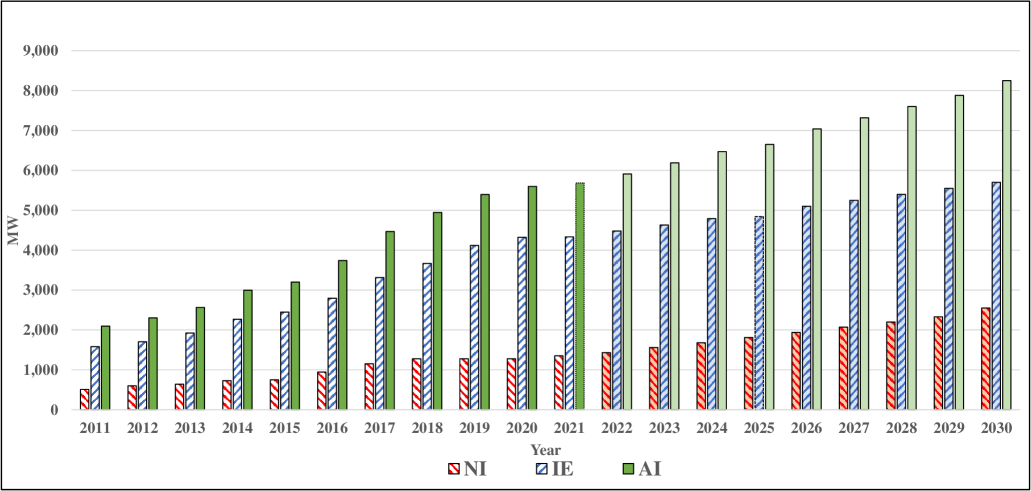
The AIPS is well-known worldwide for successfully integrating high levels of non-synchronous renewable generation, particularly wind power. Figure 3 shows the evolution of installed and forecasted wind capacity in IE and NI power systems. Observe the steady increase in the installed wind in both systems. The trend is expected to continue, where significant offshore and on-shore wind levels are expected by the end of the decade. At the time of writing, the AIPS has approximately 5.7 GW installed wind capacity. This capacity is slightly below the peak demand of 6.9 GW. Such high levels of wind capacity present a challenge for TSOs to ensure system security and stability are maintained (e.g., hard to control the frequency during low demand and high wind).
IV-A Historical Levels of Curtailment in the AIPS
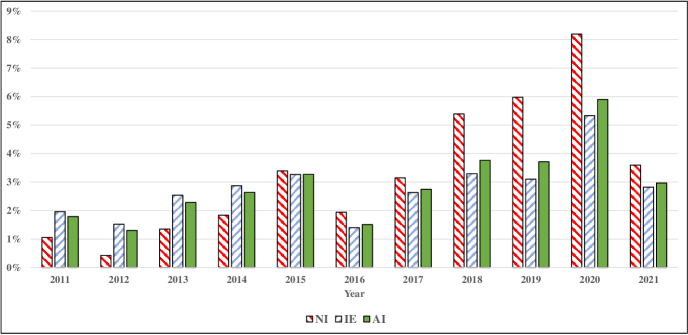
Figure 4 presents the historical levels of wind curtailment in the AIPS. Overall, there is a positive correlation between the installed wind (Fig. 3) and curtailment (Fig. 4). An exception is the year 2021 when wind curtailment has decreased significantly compared to, for example, the year 2020 (i.e., 2587 number of hours of wind curtailment in 2020 to 787 hours in 2021). This is because there was less wind available in 2021 than in 2020, namely 3,114 GWh and the SNSP limit was increased to 75%.
For illustration purposes, Table I shows a breakdown of wind dispatch down on the AIPS over the last decade, including the part of constraint. Overall, curtailment is higher than constraint. These results suggest that as the AIPS accommodates higher and higher levels of wind, significant levels of wind curtailment are expected if no actions are taken to address them. As discussed in section II, EirGrid and SONI are working towards relaxing the operational constraints in order to make more room for wind and, in general, for more renewables in the future.
| Year | Constraint | Curtailment | Total Dispatch Down Levels |
|---|---|---|---|
| 2011 | 0.4% | 1.8% | 2.2% |
| 2012 | 0.8% | 1.3% | 2.1% |
| 2013 | 0.9% | 2.3% | 3.2% |
| 2014 | 1.4% | 2.6% | 4.1% |
| 2015 | 1.8% | 3.3% | 5.1% |
| 2016 | 1.4% | 1.5% | 2.9% |
| 2017 | 1.2% | 2.7% | 4.0% |
| 2018 | 2.2% | 3.8% | 6.0% |
| 2019 | 4.0% | 3.7% | 7.7% |
| 2020 | 6.2% | 5.9% | 12.1% |
| 2021 | 4.4% | 3.0% | 7.4% |
With respect to the reason codes of curtailment, Fig. 5 compares the last two years, namely 2020 and 2021. One can see that the reason code percentages are very similar between 2020 and 2021. The main reason for curtailment during both years is that of MUON with values of 77% and 81%, respectively. While the SNSP accounts for 23% and 18%, respectively. Note that these figures are different compared to that predicted by reference [17] for 2020. On the other hand, RoCoF/Inertia appears to account for less than 1%. These results suggest that the AIPS has to relax the MUON to be able to accommodate more wind in the system. Indeed, the TSOs are currently running a procurement process to procure low-carbon inertia services that will greatly help to reduce the number of conventional units required to be online [25].
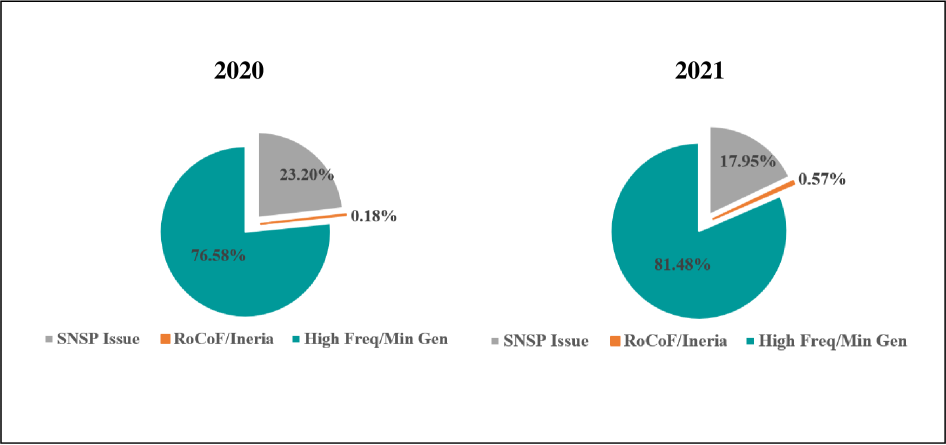
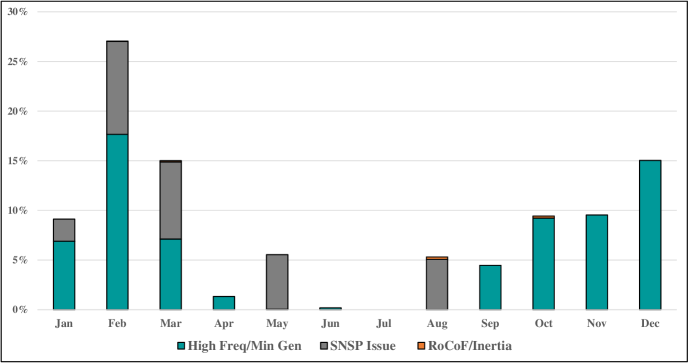
Figure 6 shows the wind curtailment levels and the respective reason codes for the year 2021. As expected, curtailment levels are higher during the winter months (i.e., higher wind availability) and lower during the summer months (i.e., lower wind availability). In particular, it is interesting to see that during February 2021 curtailment was active more than 25% of the time. The figure also shows that again the MUON is, in general, currently the main reason for curtailment.
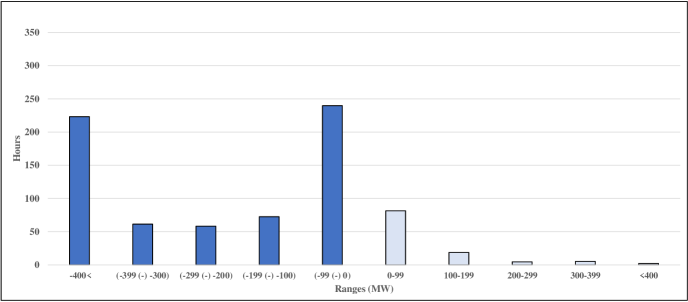
IV-B Conventional Generation Ranges While Curtailing Wind
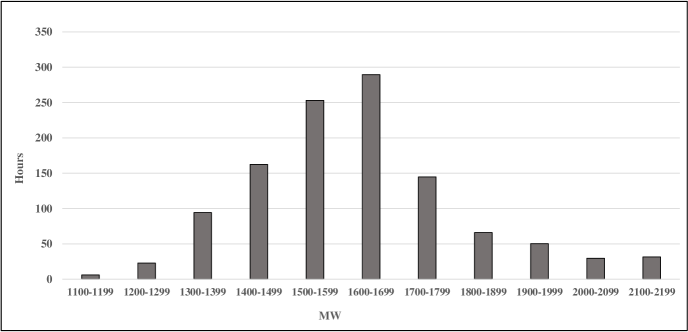
In this section, we compare the conventional generation ranges (in MW) while curtailing wind for the last two years, namely 2020 and 2021. Ideally, before curtailing wind the AIPS should be able to operate with the MUON (e.g., currently 8) at their minimum levels (i.e., to make room for renewables). However, in most cases, this is not possible because the MUON need to operate above their minimum levels to provide system services. Figure 7 shows the conventional generation ranges during 2020. Most of the time, the MW range of conventional units is between 1400 - 1700 MW.
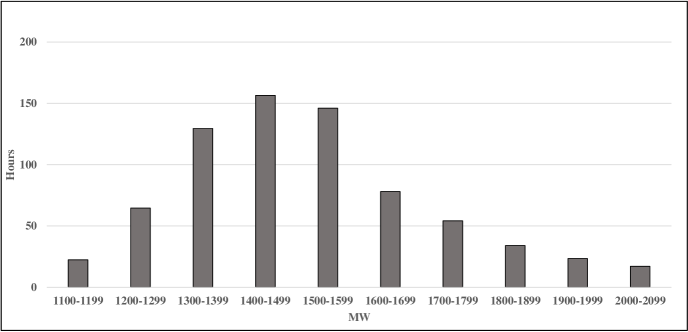
Figure 8 shows the conventional generation ranges for 2021, where we can see that this range is between 1300 - 1600 MW and thus lower compared to 2020. A contributing factor for this difference is an operational policy change in 2021, namely the reduction of negative reserve held on conventional units from 50 MW to 0 MW in IE [18]. In the future, reducing the negative reserve in NI (from 50 MW to 0 MW) will help to reduce the conventional generation ranges.
IV-C Interconnector Flows While Curtailing Wind
The AIPS is a synchronous island power system with (currently) two HVDC interconnectors (IC-1 and IC-2) to Great Britain (GB). The purpose of this section is to show the interconnector flows while wind is being curtailed.
Figures 9 and 10 show the HVDC interconnector flows for IC-1 and IC-2 during 2021 when wind curtailment was active. Figure 9 shows that for around 85% of the time IC-1 was exporting energy to GB. Further, from that 85%, the 34% of that time IC-1 was exporting more than 400 MW. The figure also shows that there are other moments where wind is being curtailed and IC-1 is importing energy from GB (i.e., export headroom on the interconnector is not used). These interconnector flows, however, are determined by the market. With regard to IC-2, it was exporting 82% of the time while curtailment was active in the AIPS. During that time, 17% of the time IC-2 is exporting more that 400 MW. As happened with IC-1, at times IC-2 also appears to import energy from GB while wind is being curtailed. Ideally, the latter situations are not desirable from a wind curtailment point of view.
V Conclusions
This paper presents an analysis of wind curtailment in the AIPS. The paper shows that there have been significant levels of wind curtailment over the last decade with the main reason for it during 2020-2021 being the need to keep a MUON to maintain system stability (80% of the time). The SNSP limit, on the other hand, is currently the bidding constraints for less than 20% of the time. While other system-wide limits such as RoCoF and inertia constraint are found to have a negligible effect on wind curtailment at this point in time. These results suggest a need for EirGrid and SONI to continue develop their operational policy and relax the operational constraints in order to reduce wind curtailment. Both TSOs are currently working towards this direction and plan to publish a 2023-2030 operational policy roadmap that will detail the pathway to achieve renewable energy targets and reduce curtailment as much as possible. The analysis also indicates that at times there remained significant interconnector export capacity available when wind was being curtailed in IE and NI. However, the market conditions were such that this capacity was not used.
References
- [1] F. Milano et al., “Foundations and challenges of low-inertia systems (invited paper),” in Power Systems Computation Conference (PSCC), Dublin, Ireland, Jun 2018, pp. 1–25.
- [2] T. Mai et al., “Getting to 100%: Six strategies for the challenging last 10%,” Joule, vol. 6, no. 9, pp. 1981–1994, 2022.
- [3] D. Millstein et al., “Solar and wind grid system value in the United States: The effect of transmission congestion, generation profiles, and curtailment,” Joule, vol. 5, no. 7, pp. 1749–1775, 2021.
- [4] X. Zhang et al., “What is driving the remarkable decline of wind and solar power curtailment in China? Evidence from China and four typical provinces,” Renewable Energy, vol. 174, pp. 31–42, 2021.
- [5] Y. Wang et al., “Flexible operation of retrofitted coal-fired power plants to reduce wind curtailment considering thermal energy storage,” IEEE Transactions on Power Systems, vol. 35, no. 2, pp. 1178–1187, 2020.
- [6] O. Agbonaye et al., “Value of demand flexibility for managing wind energy constraint and curtailment,” Renewable Energy, vol. 190, pp. 487–500, 2022.
- [7] B. Frew et al., “The curtailment paradox in the transition to high solar power systems,” Joule, vol. 5, no. 5, pp. 1143–1167, 2021.
- [8] A. Olson et al., “Renewable curtailment as a power system flexibility resource,” The Electricity Journal, vol. 27, no. 9, pp. 49–61, 2014.
- [9] E. Rebello et al., “Ancillary services from wind turbines: automatic generation control (AGC) from a single type 4 turbine,” Wind Energy Science, vol. 5, no. 1, pp. 225–236, 2020.
- [10] X. Ge et al., “Optimization of reserve with different time scales for wind-thermal power optimal scheduling considering dynamic deloading of wind turbines,” IEEE Transactions on Sustainable Energy, vol. 13, no. 4, pp. 2041–2050, 2022.
- [11] B. Kroposki et al., “Achieving a 100% renewable grid: Operating electric power systems with extremely high levels of variable renewable energy,” IEEE Power and Energy Magazine, vol. 15, no. 2, pp. 61–73, 2017.
- [12] C. Root et al., “Using battery energy storage to reduce renewable resource curtailment,” in IEEE PES ISGT, 2017, pp. 1–5.
- [13] A. Abada et al., “Renewable energy curtailment via incentivized inter-datacenter workload migration,” in International Conference on Cloud Computing. Springer, 2018, pp. 143–157.
- [14] E. O’Shaughnessy et al., “Too much of a good thing? Global trends in the curtailment of solar PV,” Solar Energy, vol. 208, pp. 1068–1077, 2020.
- [15] E. Nycander et al., “Curtailment analysis for the nordic power system considering transmission capacity, inertia limits and generation flexibility,” Renewable Energy, vol. 152, pp. 942–960, 2020.
- [16] B. Cleary et al., “Assessing the economic benefits of compressed air energy storage for mitigating wind curtailment,” IEEE Transactions on Sustainable Energy, vol. 6, no. 3, pp. 1021–1028, 2015.
- [17] E. Mc Garrigle et al., “How much wind energy will be curtailed on the 2020 Irish power system?” Renewable Energy, vol. 55, pp. 544–553, 2013.
- [18] EirGrid & SONI, “Operational policy roadmap 2022-2023,” 2022. [Online]. Available: www.eirgridgroup.com/library
- [19] Government of Ireland, “Climate action plan 2021 securing our future.” [Online]. Available: https://assets.gov.ie/224574/be2fecb2-2fb7-450e-9f5f-24204c9c9fbf.pdf
- [20] Government of Northern Ireland, “Climate change act (Northern Ireland) 2022.” [Online]. Available: https://www.legislation.gov.uk/nia/2022/31/enacted
- [21] J. O’Sullivan et al., “Studying the maximum instantaneous non-synchronous generation in an island system – Frequency stability challenges in Ireland,” IEEE Transactions on Power Systems, vol. 29, no. 6, pp. 2943–2951, 2014.
- [22] EirGrid & SONI, “System non-synchronous penetration definition and formulation.” [Online]. Available: https://www.eirgridgroup.com/site-files/library
- [23] EirGrid, “Wind dispatch down reports user guide,” 2016. [Online]. Available: www.eirgridgroup.com/library
- [24] EirGrid & SONI, “Ireland capacity outlook 2022-2031,” 2022. [Online]. Available: https://www.eirgridgroup.com/site-files/library
- [25] ——, “Consultation on low carbon inertia service (LCIS) competitive procurement,” 2022. [Online]. Available: www.eirgridgroup.com/library