Dissecting Bitcoin and Ethereum Transactions: On the Lack of Transaction Contention and Prioritization Transparency in Blockchains
Abstract
In permissionless blockchains, transaction issuers include a fee to incentivize miners to include their transactions. To accurately estimate this prioritization fee for a transaction, transaction issuers (or blockchain participants, more generally) rely on two fundamental notions of transparency, namely contention and prioritization transparency. Contention transparency implies that participants are aware of every pending transaction that will contend with a given transaction for inclusion. Prioritization transparency states that the participants are aware of the transaction or prioritization fees paid by every such contending transaction. Neither of these notions of transparency holds well today. Private relay networks, for instance, allow users to send transactions privately to miners. Besides, users can offer fees to miners via either direct transfers to miners’ wallets or off-chain payments—neither of which are public. In this work, we characterize the lack of contention and prioritization transparency in Bitcoin and Ethereum resulting from such practices. We show that private relay networks are widely used and private transactions are quite prevalent. We show that the lack of transparency facilitates miners to collude and overcharge users who may use these private relay networks despite them offering little to no guarantees on transaction prioritization. The lack of these transparencies in blockchains has crucial implications for transaction issuers as well as the stability of blockchains. Finally, we make our data sets and scripts publicly available.
Keywords:
Contention transparency Prioritization transparency Private transactions Bitcoin Ethereum MEV.1 Introduction
The rate at which users issue transactions in permissionless blockchains, e.g., Bitcoin [52] and Ethereum [72], is often much higher than the rate at which miners can include them in a block [24, 41, 45, 48, 49]. Users typically issue transactions using a wallet software [9, 27, 51, 66], whose primary functionality is determining an “appropriate” fee for a given transaction. We use the term “fee” to refer generally to the incentive offered by a user to miners for prioritizing the inclusion of their transaction in a block, albeit its exact form may vary, e.g., fee rate in Bitcoin and gas price in Ethereum. This (prioritization) fee varies, unsurprisingly, as a function of the level of congestion in the blockchain [49] as well as the distribution of fees across available transactions. Inferring either of these is, however, deceptively complicated.
At first glance, these tasks appear straightforward, since every transaction is broadcast to all miners in the blockchain. A user could simply gather all transactions broadcast over time and reconstruct the set of uncommitted transactions available to a miner (i.e., contents of the miner’s Mempool) at any point of time [48]. We refer to this assumption of a public and uniform view (across miners) of all available transactions as contention transparency. If contention transparency exists, a user could rank order available transactions by their fee (based on which miners should select transactions for inclusion) and estimate the commit delay of any transaction [49]. Consequently, they could determine the fee that they must pay to guarantee inclusion of their transaction in a given block. We label this assumption that the (prioritization) fee offered by a transaction is only that publicly declared by that transaction as prioritization transparency. Neither the contention transparency nor the prioritization transparency, however, holds today in permissionless blockchains.
Lack of contention transparency. Not all transactions are publicly broadcast. Users can submit transactions to a subset of miners or mining pools via private channels or relays that are opaque to the public (i.e., transactions remain private to the relay, until they are committed) [25, 31, 37, 62]. Users may also submit their transaction to a specific mining pool that assures them a fast commit time [14, 19, 34, 70]. This paper reveals that such private mining practices (i.e., where transactions are submitted to only a subset of the miners) are becoming commonplace and analyzes the characteristics of these private transactions.
Lack of prioritization transparency. The fees offered by a transaction could be substantially more than that publicly declared by it. A transaction could, for instance, privately offer additional fees to a miner to “accelerate” its inclusion in a block [4, 14, 34, 55, 70]. Many such transaction-accelerator (or front-running as a service (FRaaS)) platforms exist for Bitcoin [14, 34, 55, 70] and Ethereum [28, 37, 62, 63]. Furthermore, the same transaction could offer different fees to different mining pools (via their relays). The presence of such hidden or dark-fees could fundamentally erode the reliability of any fee prediction: Transaction issuers may end up paying substantially large fees without receiving proportional or any reduction in commit delays. This paper characterizes the prevalence of such dark-fee transactions and analyzes the most popular private relay network available in Ethereum, Flashbots [37]. Furthermore, we conduct active experiments in both Bitcoin and Ethereum to validate our assumptions regarding the prioritization transparency. In addition to showing that transaction fees may not be uniform across miners, we claim that, given the lack of contention transparency, the lack of prioritization transparency may become more widespread than it is now.
The lack of contention and prioritization transparencies stem from real, non-trivial concerns of transaction issuers. The risk of transactions being front-run by bots [23, 28, 65, 71], for instance, creates the need for transaction privacy. Mining pools that address this need also facilitate, unsurprisingly, off-chain payments via which transaction issuers can (privately) incentivize the miners [4, 14, 34, 49, 55, 70]. We view these developments as natural and logical steps in the evolution of blockchains and back our assertions with empirical observations. We claim, therefore, in contrast to prior work [23, 63], that it is only the opacity of the overall fees issued by a transaction issuer that poses a fundamental threat to the stability of blockchains: Transaction issuers cannot, for instance, precisely infer the fee required to commit their transactions into the next block, and miners can, consequently, overcharge them as the “real” fees are opaque to the rest of the network [71].
We summarize our contributions as follows. We characterize the lack of contention transparency in both Bitcoin and Ethereum: We show that the use of private channels or relay networks to submit transactions directly to a subset of miners is becoming widespread. This practice will likely erode prioritization transparency, as transaction issuers may not be able to estimate the appropriate fees, none of which are publicly visible. We characterize the prevalence of such private transactions fees. We found that Flashbots bundles represent % of all Ethereum blocks. With the lack of prioritization transparency, miners might overcharge users when they send their transactions privately. We also show that Bitcoin miners collude (with an aggregate hashing power of more than % of the network’s total hashing power) when including dark-fees transactions. Finally, we release our data sets and the scripts used in our analysis to enable the scientific community to reproduce our results [50].
2 Related Work
There is a rich literature on block rewards as incentives for mining [18, 33, 35, 39, 43, 53, 54, 58, 61, 73]. Recent work also analyzed the implications of relying on transaction fees separately [16] and in conjunction with block rewards [67], as well as the relationship between such incentives and transaction waiting times [24]. These prior work assume that transactions are broadcast to all miners and the fees offered is uniform across miners. None of them acknowledge the issue of transparency.
Basu et al. [8] and Lavi et al. [45] addressed the inefficiencies in transaction-fee setting mechanisms (i.e., first-price auctions) by proposing alternative mechanisms. They claim that miners might be dishonest, albeit they present no empirical evidence. Siddiqui et al. [60] used simulations to show that, if transaction fees are the only incentives, miners will select transactions greedily, thereby increasing the commit times of many transactions. Prior work also analyzed the Ethereum fee (i.e., gas price) mechanism to determine the gas price for a given transaction [3, 46, 47, 68]. The fee estimation and fee-based prioritization schemes in these studies do not take into account dark-fees or private mining.
Many transaction-accelerator, or FRaaS, platforms exist for both Bitcoin [14, 34, 55, 70] and Ethereum [28, 37, 62]. Transaction issuers might resort to such acceleration or off-chain payment channels to hide their true fee from competitors and avoid being front-run [23, 63]. Tim Roughgarden [59] discussed the incentives for off-chain agreements (such as dark-fees) between miners and users for first-price auctions and different deviations of the new Ethereum fee mechanism EIP-1559 protocol [15].111The EIP-1559 went live in the Ethereum’s London hard fork upgrade on August 5, 2021, at block number . Roughgarden showed that miners and users cannot strictly increase their joint utility through off-chain payments under EIP-1559 because on-chain bids can be easily replaced by the off-chain bids. However, utility here is only based on the revenue of bidding for block space. The author did not take into account that utility might depend on other factors, such as transaction issuers wanting to keep their actual bids for block space hidden through off-chain payments, which strictly increases their chances of prioritization, as other bidders cannot counter bid, as they are unaware of the bid itself.
Closest to our work are two that analyze private mining. Strehe and Ante [63] investigated exclusive mining (or private mining), where transactions issuers and miners collude to include transactions that have been sent through a private network. In this case, the transactions are not publicly disclosed until they have been included in a block; besides, the fees can remain opaque to everyone forever, as such off-chain agreements may use fiat currencies. Weintraub et al. [71] measured the popularity of Flashbots, the most used private relay network for Ethereum. Our work, in contrast, extensively investigates private transactions in both Bitcoin and Ethereum blockchains. Through active measurements, we empirically show that Bitcoin miners collude and highlight the colluding mining pools. We show that Flashbots bundles are quite prevalent in Ethereum and are mainly used for calling Decentralized Exchanges (DEX) contracts to take advantage of Maximal Extractable Value (MEV) opportunities. Finally, we discuss why our findings are still valid after “The Merge”—an Ethereum hard fork deployed on September 15, 2022 [29, 30].
3 On contention transparency
3.1 The Rise of Private Relay Networks
With the lucrative market of Decentralized Finance (DeFi) in Ethereum, today, bots engage in predatory front-running behaviors such as sandwich attacks and transaction-replay attacks [23, 44, 56, 57, 65, 71, 74]. Relay networks help users to counter such attacks: They provide users with a private channel for communicating with miners, who have to prove their identity to participate in the relay. Relay networks help users completely bypass the P2P network: Users send their transactions to the relay network, which in turn relays them to its participant miners. The relay network and its participants claim (a) not to front-run these transactions and (b) to keep them private until they are included in a block [36]. These transactions, hence, by construction, experience no front-running issues. Relay networks are centralized; if miners misbehave, they may lose their network membership and forfeit their future profits. Multiple relay networks (e.g., bloXroute [12], Taichi Network [62], and others [25, 31]) exist today, but we focus on Flashbots [38], the largest relay network for Ethereum.
Flashbots Flashbots’s users bundle one or more transactions in some specific order [37]. Miners are expected to mine the entire bundle (retaining the ordering of transactions within the bundle) and place it at the top of their blocks. The miners receive a fee (paid via a direct transfer to their wallets) for including the bundle in addition to the (traditional) fees associated with the transactions in that bundle. If there are two competing bundles—capturing the same financial opportunity, e.g., liquidations—miners will choose the one with the highest reward (i.e., maximizing financial incentives). The other bundle is discarded (since the financial opportunity no longer exists after having been captured by the included bundle), albeit its transactions do not expend any gas. Therefore, except for a network base fee introduced in EIP-1559, arbitrageurs and liquidators can participate without having any balance in their wallet: If they successfully capture a financial opportunity, they pay the miner from the profit secured and pocket the rest [38]. Flashbots is a free to use relay network, and they allow anyone to query whether a transaction used their relay network and the private fees paid to the miner (after it has been committed in a block). We use this publicly available data for analyzing the transactions issued (privately) on Flashbots. Flashbots, however, does not list the discarded bundles (or its transactions): we have access, hence, only to committed transactions.
3.2 Characterizing Private Relay Networks
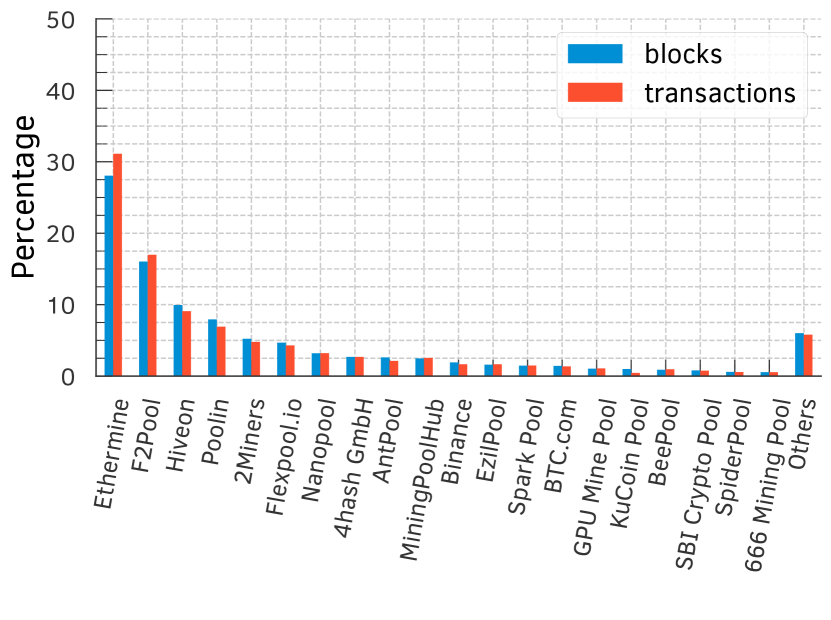
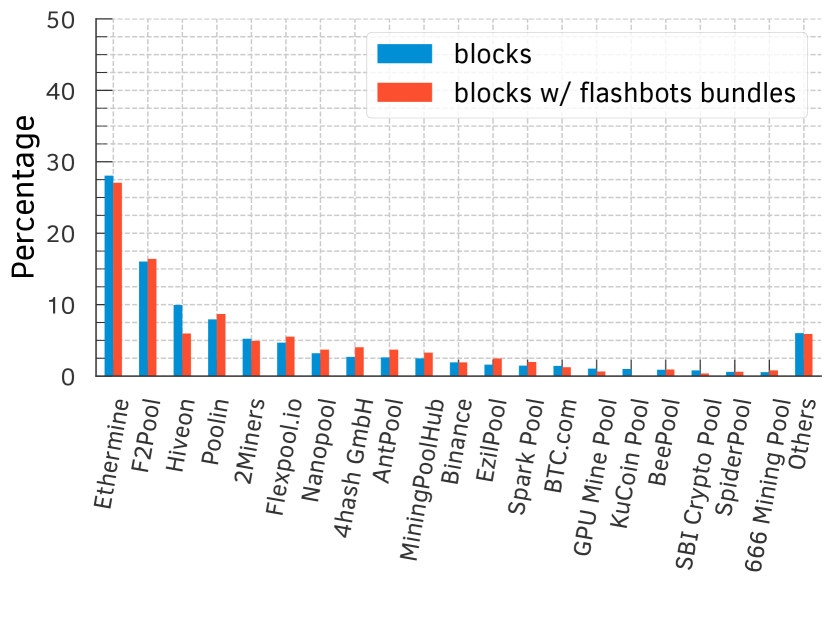
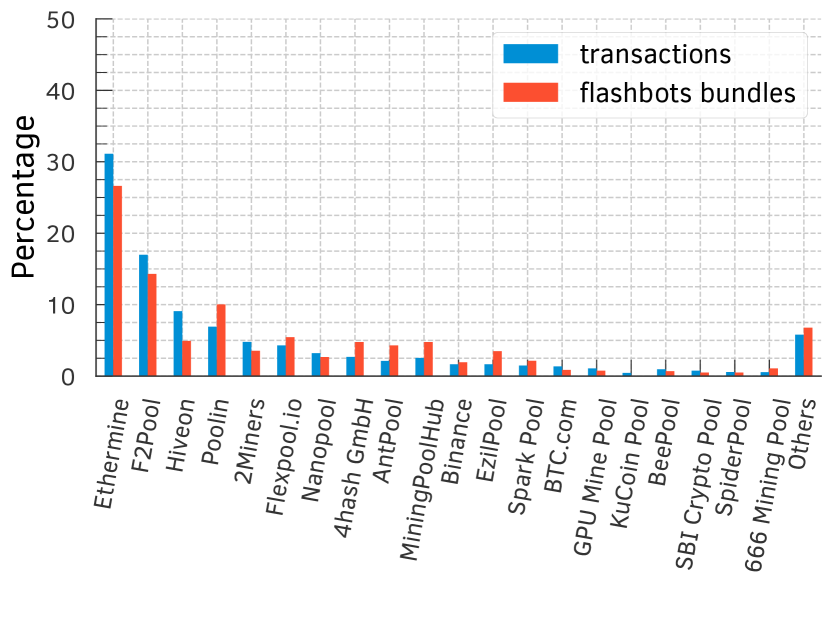
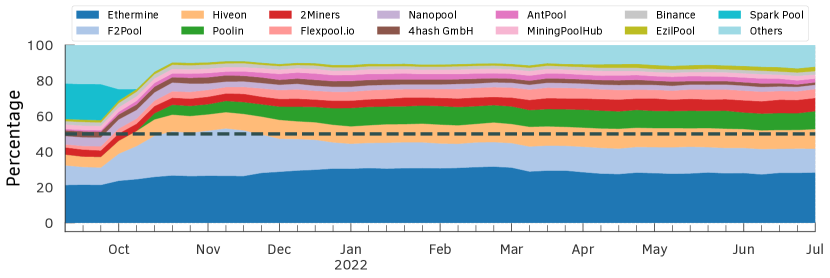
We gathered all Ethereum blocks mined over a -month time period—from September , 2021 to June , 2022—to investigate the behavior of Ethereum mining pools. This data set contains issued transactions and blocks (from block number to ). We used miners’ wallet addresses to infer the block owners, but we failed to identify the owners of blocks (or % of the total); we grouped the latter into one category, “Unknown.” Figure 1(a) shows the distribution of blocks and transactions mined in Ethereum by the top-20 mining pools. We also retrieved transactions ( of all issued transactions) contained in bundles from Flashbots; these are transactions sent privately to miners. () of blocks in the data set have at least one such Flashbots transaction: Private transactions are becoming quite common across most of the powerful mining pools in Ethereum.
Flashbots labels its bundles (and constituent transactions) into one of three categories: (i) flashbots, which represent those sent through their private relay; (ii) rogue, referring to those delivered to a (Flashbots) miner, but via a different relay network; and (iii) miner payout, indicating a bundle containing payouts to users of a mining pool [71]. We find %, %, and % of transactions belonging to the flashbots, miner payout, and rogue categories, respectively. We also noticed that (%) of all Flashbots transactions failed to execute after inclusion in a block. A small fraction of transactions is, hence, not successfully executed despite using private relays.
Flashbots claims to have of the total Ethereum hash rate [38]. Per our analyses, however, the majority of the mining pools ( out of —barring EthPool) use Flashbots, accounting for of the total Ethereum hash rate, A recent work also corroborates our findings [71].
Some of the most powerful mining pools like Spark Pool222Spark Pool suspended their mining services on Sept. 30, 2021, due to regulatory requirements introduced by Chinese authorities [40]. (which cooperates with Taichi Network [62]), Ethermine [31], and F2Pool (part of Eden Network [25]) offer their own relay networks. As these networks allow transaction issuers to send transactions exclusively to a specific miner, we hypothesize that miners would prefer (or prioritize) these transactions to those sent via the public P2P network. Crucially, payments from these private transactions are guaranteed, while those from publicly issued transactions are not—they are available to any miner willing to commit them. Miners, hence, would likely offer preferential treatment for private transactions.
3.3 On preferential treatment of private transactions
We substantiate our hypothesis of preferential treatment for private transactions via an active experiment conducted on September 8, 2021. We issued transactions, where were sent privately via the Taichi Network, powered by Spark Pool, and through the public Ethereum network (refer Table 4 in §0.A).
While running the experiment, we checked if the popular Ethereum blockchain explorers (i.e., Etherscan [32], Blockchain.com [10], and Blockchair [11]) observed any of our private transactions; if they did, it would imply that the Taichi Network leaked the transactions to the public. While the public transactions appeared in these blockchain explorers, right after we sent them through the public P2P network, the private transactions were not observed by any of them until the transactions were included in a block. More importantly, our private transactions were not flagged by Etherscan (which relies on Flashbots API [36] and more recently on EigenPhi [26]) as private, even after inclusion in a block. Measuring the prevalence of private transactions is, hence, challenging; it is likely that our estimates of the volume of private transactions based on such tools represent, hence, a lower bound.
Babel Pool included out of our private transactions. Spark Pool technically supports this mining pool, implying that they “collaborate” in committing private transactions sent over the Taichi network [5]. Our transactions were included, however, in the appropriate position in the block based on their fees. We delve into the prioritization of transactions in the next section.
We also characterize the prevalence of private transactions in Ethereum and indicate that mining pools can each have a distinct set of private transactions in their Mempool. Users, as a result, can no longer rely on the public Mempool alone to estimate their transaction fee. Given the absence of other data, they are highly likely to end up with a false estimate of the “appropriate” transaction fees for their transactions.
4 On prioritization transparency
4.1 Prevalence of transaction bundling
Flashbots bundles are prevalent in Ethereum (refer §3.2). Each Flashbots bundle contains at least transaction and at most transactions; on average they contain transactions, with a median of and a standard deviation of . We noticed that Ethermine alone included more than a quarter () of all bundles (Figure 2). Also, blocks contain at most bundles, with an average of , a median of , and a standard deviation of .
Maximal Extractable Value (MEV) Flashbots allows users to bundle together a set of transactions, thereby specifying the order in which they are executed. The bundles can also include public transactions, propagated over the public P2P network. A public transaction that buys a coin on a DEX can, for example, lead to an arbitrage opportunity [57]. A user can include this transaction in a bundle along with one of their own to capture this arbitrage opportunity. The last transaction in the bundle usually pays the miner (based on the profit made) in ether via a direct transfer (i.e., coinbase transfer) to their wallet addresses [38]. This essentially means that miners are being offered different prices for mining the same transaction. In other words, miners have a financial incentive for including transactions that are in a bundle at the top of a block, even though the public fee offered through gas price in the transaction data is very low. Hence, each transaction in the bundle has a normal gas price and a bundle gas price, which is calculated using the total gas used by all transactions in the bundle and the total miner reward for mining the bundle.
Bundling public transactions To identify bundles with transactions that were probably sent through the public P2P network, we rely on a simple heuristic. Specifically, we focus on transaction bundles of size and , and search for transactions that have likely resulted in a publicly sent transaction being bundled. Then, we find bundles issued from different issuers that include a zero and non-zero max-priority fee333The max-priority fee was introduced in EIP-1559 as the unique financial incentive miners get for including publicly announced transactions. The other fees are burned. transactions. The intuition is that miners have no incentive to include transactions that offer a zero max-priority fee, as they receive no rewards for mining these transactions. Unless they receive extra payment (through Flashbots coinbase transfer). Hence, transactions that have a non-zero max-priority fee were likely sent publicly.
For transaction bundles of size , we look for transactions whose issuers are not the same. Furthermore, we look for cases where the first transaction offers a non-zero max-priority fee, with no coinbase transfer to the miner, and the second transaction offers a max-priority fee and a non-zero coinbase transfer.
For transaction bundles of size , we look for signs of sandwich attacks [56]. We look for bundles where the first and last transactions have the same issuer, but the second transaction has a different issuer. Additionally, we check that the first and third transactions offer a max-priority fee, meaning that the miner receives no reward from the gas price for mining these transactions. Then, we ensure that the second transaction offers miners a non-zero max-priority fee, while the third offers miners a fee through direct coinbase transfer. This scenario might be a classic sandwich attack, where public transactions are bundled between two private transactions, sent by the same issuer, and the miner gets paid via a coinbase transfer from the third transaction [56].
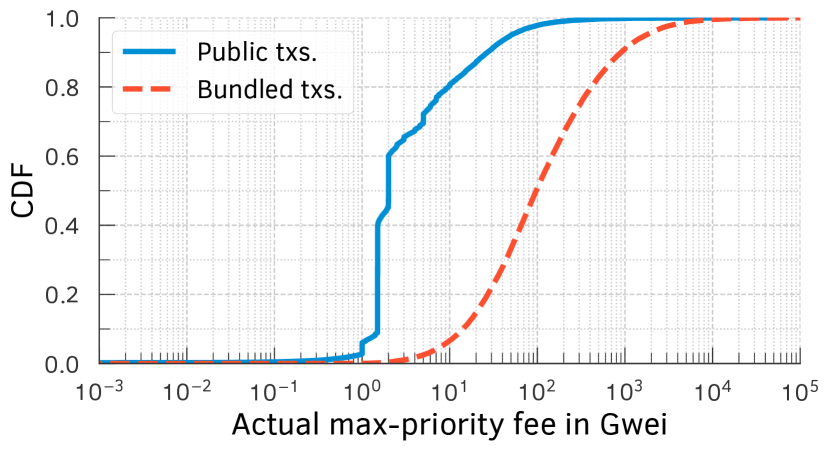
We found transactions in bundles of length , and transactions in bundles of length . From those, we found that (%) and (%) bundles, of lengths and , respectively, fit our heuristic. We then calculate the actual max-priority fee for these bundles, as the total gas used by all transactions in the bundle divided by the total miner reward (from gas usage and coinbase transfer). Figure 3 shows the price difference miners get for including publicly and bundled transactions. Note that around % of transactions differ in the actual max-priority fee by gwei-per-units-of-gas. Flashbots bundles offers much higher gas prices in comparison to the public announced max-priority fee alone.
Towards liquidations through bundling Lending protocols rely on over-collateralization of assets: In order to borrow assets from these protocols, a user has to deposit a collateral of at least % of the borrowed amount. To borrow USDC on AAVE, for example, a user would have to collateralize at least USDC worth of another asset (e.g., in ETH or BTC). If the ratio of the collateral asset versus the borrowed asset falls below , the user’s position can be liquidated by any other participant until the ratio stabilizes to again. The liquidator then pays back a portion of the user’s debt to receive the collateral asset at a discount. In order to assess an asset’s on-chain value, lending protocols rely on oracle services, e.g., Chainlink Data Feeds [13, 17]. In the case of the two largest lending platforms, AAVE V2 [2] and Compound [21], for instance, Chainlink provides the price of each asset in ETH and USD, respectively.
We found liquidations in AAVE and liquidations in Compound. Out of these, there were AAVE liquidations and Compound liquidations that were sent privately through Flashbots. In AAVE, the three largest collateral assets that were liquidated were WETH (%), LINK (%), and WBTC (%). The debt assets paid for, i.e., the assets borrowed by the users, were USDC (%), USDT (%), DAI (%), and GUSD (%), all of which are stablecoins and account for over % of the assets repaid by liquidators. In Compound, the three largest collateral assets that were liquidated were WETH (%), WBTC (%), and UNI (%). The debt assets were USDC (%), DAI (%), USDT (%), and TUSD (%), all of which are stablecoins and account for over % of the assets repaid by liquidators.
Liquidation with bundled oracle updates To check the adverse effect of bundling oracle updates, we looked at bundles with Chainlink oracle updates as they are a key part of liquidations. We identified AAVE liquidations distributed within bundles ( transactions including oracle updates) that contained at least one oracle update. In Compound, we found liquidations distributed within bundles ( transactions including oracle updates) that contained oracle updates. In AAVE, out of bundles, there were (86.14%) bundles that contained an oracle update followed by a liquidation, and (4.51%) with two oracle updates followed by liquidations. In Compound, out of bundles, there were (85.49%) bundles that contained an oracle update followed by a liquidation, and (6.08%) with two oracle updates followed by liquidations. For details on the specific liquidations for both AAVE and Compound, please refer §0.B in the appendix. Out of the total liquidations in AAVE and Compound we found that only were possible in the previous block. Almost % of such liquidations were, hence, only possible because of the Chainlink updates in that block.
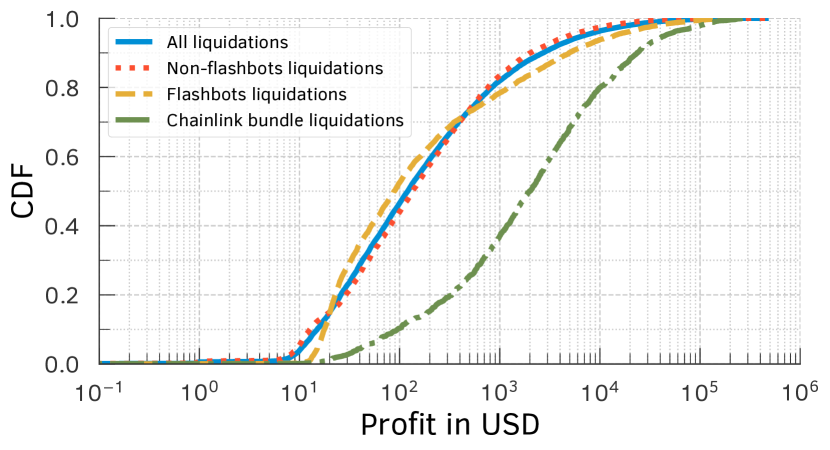
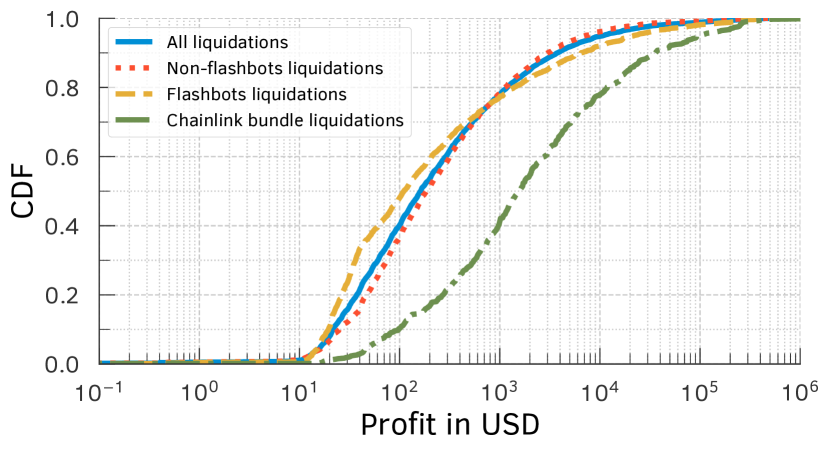
In order to calculate the profit made by the liquidators, we get the amount of debt that was repaid and the amount of the underlying collateral that was received by the liquidator. We calculate the price of each token at the time of liquidation by looking at the on-chain oracle price from Chainlink at the same block number, where the liquidation took place. For AAVE and Compound, we specifically use the Chainlink on-chain price used by AAVE and Compound in their respective protocols. AAVE uses the price in ETH as a reference for its tokens, whereas Compound’s price oracles are denominated in USD. For AAVE, in order to calculate the profit made by each liquidation, we calculate the profit in ETH, and then multiply the profit by the current Chainlink on-chain price of ETH in USD. Per Figure 4, liquidations that are bundled with a Chainlink update also have larger profits for liquidators, which implies that the lucrative liquidations are more likely to be bundled together with a Chainlink update.
Characterizing transaction bundling To investigate which DEXes protocols are called within Flashbots bundles, we focus on the following contract calls: 0x Protocol [1], Balancer [6], Bancor [7], Curve [22], SushiSwap [64], and Uniswap V1 and V3 [69]. In our set of Flashbots bundles, we find that (%) unique Flashbots bundles (and transactions) called at least one of these contracts. Table 1 shows the distribution of the number of transactions and the number of bundles for each of these contracts. We see that Uniswap and SushiSwap are the most bundled DEXes protocols in Flashbots.
| Balancer | Bancor |
|
|
|
|
Total | |||||||||||||||
|---|---|---|---|---|---|---|---|---|---|---|---|---|---|---|---|---|---|---|---|---|---|
| # of bundles |
|
|
|
|
|
|
|
||||||||||||||
| # of transactions |
|
|
|
|
|
|
|
4.2 Side channel (dark-fee) payments and transaction acceleration
We now focus on the Bitcoin blockchain to study dark-fees transactions.
Prevalence of transaction acceleration Dark-fee transactions (or accelerated transactions) are transactions that offer additional fees to specific mining pools via an opaque and non-public side-channel payment [49]. Messias et al. show that in Bitcoin the top 5 mining pools, BTC.com [14], AntPool [4], ViaBTC [70], F2Pool [34], and Poolin [55], deploy transaction acceleration services, which enables users to “accelerate” the confirmation of their transactions by offering mining pools dark-fees [49]. These (dark-)fees are paid in fiat currency through a direct bank transfer or via other crypto coins to the mining pool. They are, therefore, opaque or dark to other participants. Strangely enough, these fees are also non-refundable as the miner receives them regardless of whether they include the transaction in a block or not—a guaranteed payment. The fees paid by the transaction issuer are, furthermore, not made public: only the user and the miner knows the actual fee paid by the transaction inclusion. Since transaction issuers pay the fees off-chain, miners have an incentive for prioritizing these transactions despite the low fee rate offered on-chain. It also implies that the transaction issuer offers a miner a different fee compared to that offered to other miners for including their transaction in a block. Miners do not disclose such private fees paid by issuers. This behavior is different from that of Flashbots in Ethereum: The latter discloses the final dark-fee after the transaction is committed (see §4.1).
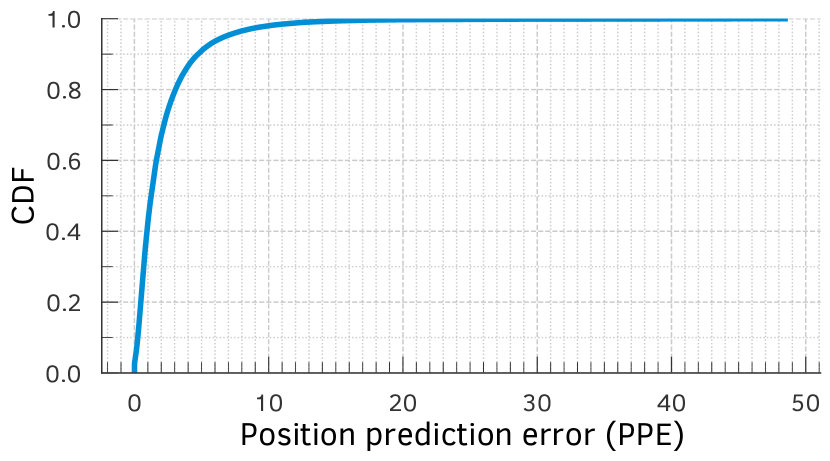
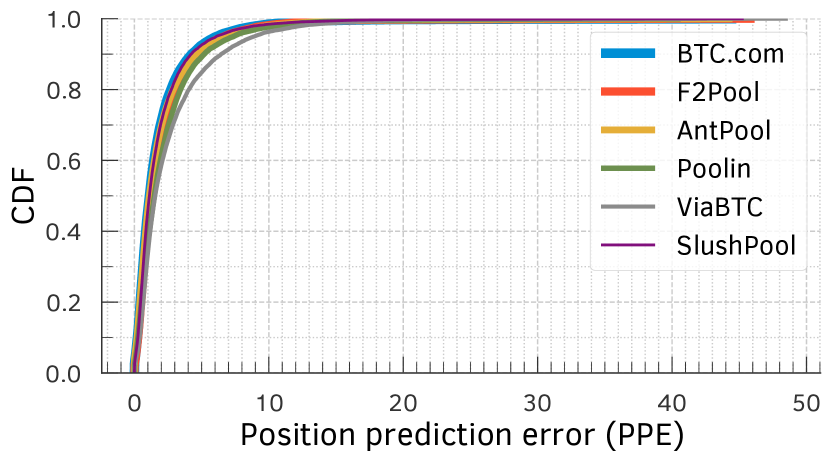
Characterizing transaction acceleration In order to detect accelerated transactions, Messias et al. [49] proposed a metric called signed position prediction error (SPPE) and position prediction error (PPE). The idea behind these measures is that transactions that have been accelerated through off-chain fees are likely to have been “misplaced” in a block based on the on-chain fee they offer. Figure 5 shows that the top-6 mining pools in our Bitcoin data set engage in transaction acceleration. Large SPPE values imply that a transaction that should have been included at the bottom is included at the top of the block, confirming acceleration. We rely on this methodology to infer transaction acceleration in Bitcoin and present our data set and findings below.
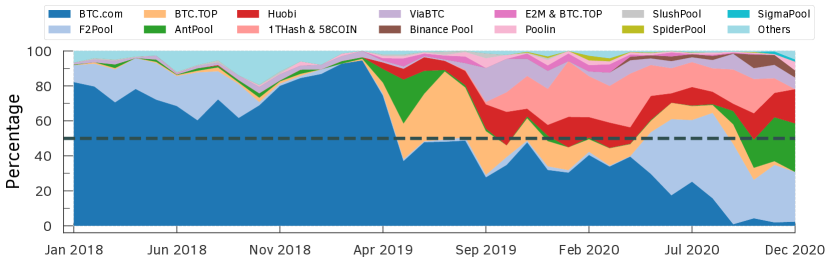
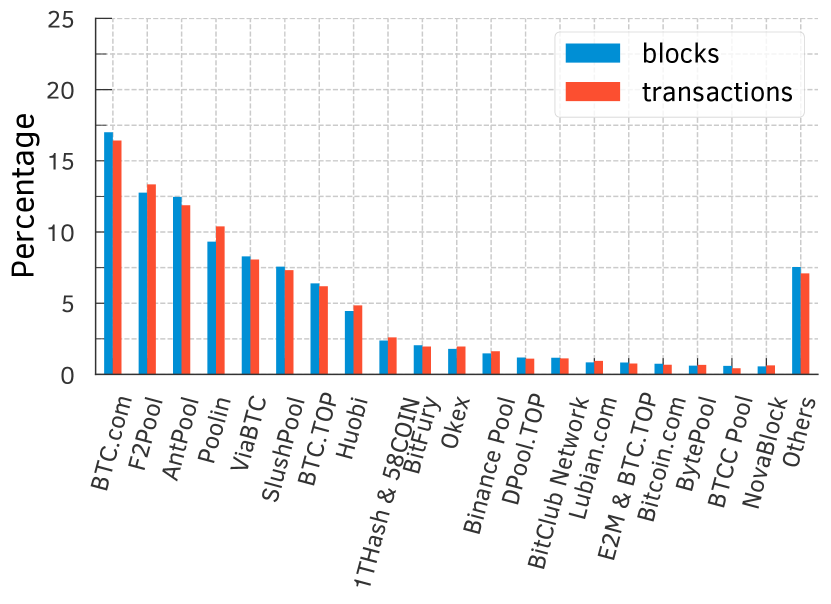
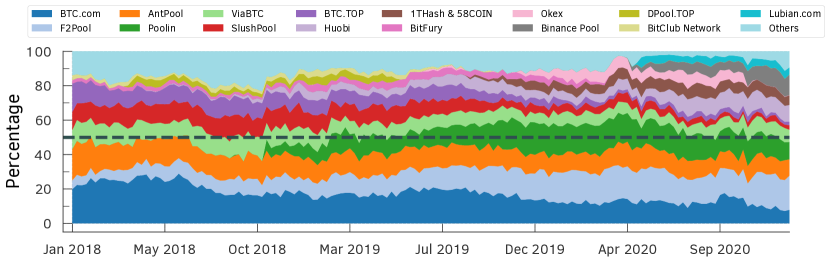
To identify accelerated transactions, we gathered all Bitcoin blocks mined from Jan. 2018 to Dec. . In total, there are blocks from block height to , and transactions. In Bitcoin, mining pools may indicate their ownership of the block by including a signature or marker in the Coinbase transaction (i.e., the first transaction of every block). We used such markers for identifying the mining pool (owner) of each block following techniques from prior work [42, 49, 58]. We failed to identify, however, the owners of blocks (approximately of the blocks) and grouped these blocks under the label “Unknown.” Figure 1(b) shows the distribution of the count of blocks mined and transactions confirmed by the top-20 mining pools. We further removed (21.02%) child-pays-for-parent (CPFP) transactions from our acceleration analyses.
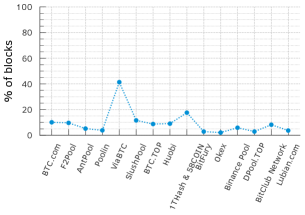
To estimate the prevalence of accelerated transactions in blocks mined by different mining pools, we compute the fraction of blocks mined by the top-15 mining pools, based on their hash rates in our data set (refer to §0.C and Figure 1(b)), that contained transactions with SPPE . Per Figure 6, we find that many large mining pools such as BTC.com, F2Pool, and ViaBTC are likely including accelerated transactions in a sizeable fraction of their mined blocks, with ViaBTC including it in over of their blocks.
If we consider all mining pools’ transactions with an SPPE ( transactions, in total), from to , users transferred in total BTC (or billion USD444Based on the Bitcoin exchange rate on October 19 2022, 1 BTC = USD). The accelerated transactions accounted for BTC (or billion USD), corresponding to approximately .
Aggregated power of colluding miners In order to check the impact of transactions acceleration services on commit time of transaction, we ran active real-world experiments. Specifically, we paid ViaBTC [70] to accelerate selected transactions (see Table 5 in §0.D) during periods of high congestion between November 26 and December 1, 2020. From Mempool snapshots during this period, we selected transactions that offered a very low fee-rate (i.e., 1–2 sat-per-byte) for acceleration. To keep our acceleration costs low, we selected transactions with the smallest size (which was bytes) within this set. For each of the snapshots, we had multiple transactions with such low fee-rates and small size, for a total of transactions across all the snapshots. We randomly selected one transaction from each snapshot (i.e., 10 transactions) and paid ViaBTC EUR to accelerate them.
| metrics | delay in # of blocks | perc. position in a block | ||
| acc. | non-acc. | acc. | non-acc. | |
| minimum | 1 | 9 | 0.07 | 17.47 |
| 25-perc | 1 | 148 | 0.08 | 75.88 |
| median | 2 | 191 | 0.09 | 87.92 |
| 75-perc | 2 | 247 | 0.20 | 95.00 |
| maximum | 3 | 326 | 4.39 | 99.95 |
| average | 1.8 | 198.5 | 0.79 | 84.46 |
We then compare the priority with which the accelerated transactions and the () non-accelerated transactions with similar fee rates and sizes were included in the Bitcoin blockchain. The impact of acceleration was strikingly apparent as shown in Table 2. All accelerated transactions were included within – blocks after their acceleration, with an average delay of blocks. In contrast, the minimum delay for the non-accelerated transactions of comparable fee-rates and sizes was blocks, with an average delay of 198.5 blocks. Interestingly, of the non-accelerated transactions were yet to be included in the blockchain by December 4, 2020. Similarly, the accelerated transactions were included in top – percentile positions, with an average percentile position, while the non-accelerated transactions were included in the beyond top – percentile positions, with an average percentile position. From the above observations, it is clear that the transactions we accelerated were included with high priority, meaning Bitcoin mining pools take off-chain fees into account when prioritizing transactions.
Although, we accelerated our transactions using ViaBTC mining pool, our transactions were included by different mining pools, namely F2Pool, AntPool, Binance, Huobi, and ViaBTC. As we accelerated transaction during time of high congestion in Bitcoin, no mining pool would have included a transaction offering – sat-per-byte, unless they were accelerated. Since we only paid the ViaBTC mining pool, this implies that ViaBTC is colluding with other mining pools to accelerate transactions that offer off-chain fees. Except for Binance, all these colluding pools rank amongst the top- mining pools in terms of their hash rates at the time of our experiments. Table 3 shows the individual as well as the combined hash rates of these colluding mining pools over the last day, last week, and last month before the conclusion of our experiment on December . The most striking and the most worrisome fact is that the combined hash rates of these colluding mining pools exceeds of the total Bitcoin hash rate. For more details, refer to Figures 9 and 10 in §0.D in the appendix. Additionally, if mining pools are colluding to include accelerated transactions, then they might also potentially collude in malicious ways.
| Mining Pool | Hash-rate | ||
|---|---|---|---|
| last 24h | last week | last month | |
| F2Pool | |||
| AntPool | |||
| Binance | |||
| Huobi | |||
| ViaBTC | |||
| Total | |||
Furthermore, due to the lack of transparency into their queue, miners can charge higher prices for their acceleration services when colluding. It means that they can overcharge the transaction issuers for including their transactions.
5 Concluding Discussion
In this section, we discuss the implications of our findings regarding the lack of transparency in transaction contention and prioritization. We also argue why our findings and implications would be relevant even in the face of recent changes to blockchain protocols, e.g., Ethereum Improvement Protocol (EIP) 1559 and the Ethereum Paris Network Upgrade (a.k.a. the Merge).
Implications for publicly mined transactions Most wallet software and crypto-exchanges today rely on reconstructing the current public Mempool state in order to suggest a suitable fee to transaction issuers [9, 20, 27, 51, 66]. With the lack of contention and prioritization transparency, transaction issuers can no longer accurately recreate the current Mempool state for different miners. Consequently, they cannot reliably estimate the fees transactions need to pay for their desired prioritization. Worse, as the fraction of privately mined and accelerated transactions keeps rising, the transaction fees will become less (reliably) predictable in the future.
Implications for privately mined transactions The problem of reliable fee estimation for a desired level of prioritization is even worse for privately mined transactions that are announced on private relay networks. When transaction issuers announce on a private relay network today, they are often unsure what fraction of total hash rate is controlled by the miners listening to the private relay network. It is important to estimate the hash rate controlled by private mining pools to estimate the commit (waiting) times for transactions. Furthermore, transaction issuers on private relay networks are completely blind to other competing transactions. This opacity allows miners offering private mining and transaction acceleration services to overcharge and demand exorbitant fees to commit transactions. For example, in the Ethereum blockchain, users are observed to be overcharged by miners for having their transactions confirmed with high priority through Flashbots bundles [71].
Relevance of findings in light of EIP-1559 and the Ethereum Merge Our observations about the lack of transparency and their implications are fundamental to the current blockchain architectures and hold both before and after the recent major improvements to blockchains, e.g., EIP-1559 and the Ethereum Merge. While EIP-1559 attempts to improve the estimation of transaction fees that need to be offered, it does not address the problems associated with the lack of transaction contention and prioritization transparency. Similarly, after the Ethereum Merge, validators that stake a certain amount of ETH rather than miners would be responsible for selecting and validating transactions to include in the next block [29]. Our observations about private mining would still hold for private validation and the implications would still be valid after the Merge.
In conclusion, our work shows that with private mining and accelerated transactions, the promise of the public decentralized blockchain does not hold. Firstly, mining pools with combined hash rates of over are colluding with each other, showing a centralization in the system. Then, they can also censor certain transactions, breaking the ethos of decentralized public blockchains with no central authorities. Second, it breaks the assumption that all activities in the blockchain are transparent. Although this is true for transactions included in the blockchain, prioritization of transactions is becoming more opaque with the rise of private mining and off-chain fees. Hence, we make the case that to fulfill the transparency promise of public blockchains, prioritization of transactions should be transparent as well. Third, with private mining in Ethereum, Flashbots is increasingly being used for malicious and predatory activities such as sandwich attacks, which essentially levies a tax on users interacting with financial institutions on the blockchain (e.g., in DEX). These concerns need to be addressed if public blockchains are going to live up to their promises.
Acknowledgments
This research was supported in part by a European Research Council (ERC) Advanced Grant “Foundations for Fair Social Computing”, funded under the European Union’s Horizon 2020 Framework Programme (grant agreement no. 789373). It was also supported by MIAI @ Grenoble Alpes (ANR-19-P3IA-0003) and by the French National Research Agency under grant ANR-20-CE23-0007.
References
- [1] 0x Protocol: 0x: Powering the decentralized exchange of tokens on Ethereum. https://www.0x.org (2022)
- [2] AAVE: AAVE - Open Source Liquidity Pool. https://aave.com (2022)
- [3] Antonio Pierro, G., Rocha, H., Tonelli, R., Ducasse, S.: Are the gas prices oracle reliable? a case study using the ethgasstation. In: 2020 IEEE International Workshop on Blockchain Oriented Software Engineering (IWBOSE). pp. 1–8 (2020)
- [4] AntPool: Prioritize Transaction. https://www.antpool.com/user/prioritiseTransaction.htm (2022)
- [5] Babel Finance: Economic Daily: Babel Finance Launches Ethereum Mining Pool. https://babel.finance/articlePress.html?id=2 (2021)
- [6] Balancerl: Balancer AMM DeFi protocol. https://balancer.fi (2022)
- [7] Bancor: Bancor: Grow your ETH. https://bancor.network (2022)
- [8] Basu, S., Easley, D., O’Hara, M., Sirer, E.G.: Towards a Functional Fee Market for Cryptocurrencies. CoRR abs/1901.06830 (2019)
- [9] Bitcoin Core: Bitcoin Core Desktop Wallet. https://bitcoin.org/en/wallets/desktop/mac/bitcoincore (2022)
- [10] Blockchain.com: Ethereum Explorer. https://www.blockchain.com/explorer?view=eth (2021)
- [11] Blockchair: Ethereum Explorer. https://blockchair.com/ethereum (2021)
- [12] BloXroute Labs: BloXroute Labs. https://bloxroute.com/ (2022)
- [13] Breidenbach, L., Cachin, C., Chan, B., Coventry, A., Ellis, S., Juels, A., Koushanfar, F., Miller, A., Magauran, B., Moroz, D., et al.: Chainlink 2.0: Next steps in the evolution of decentralized oracle networks. Chainlink Labs (2021)
- [14] BTC.com: BTC.com Transaction Accelerator. https://pushtx.btc.com (2022)
- [15] Buterin, V., Conner, E., Dudley, R., Slipper, M., Norden, I., Bakhta, A.: “EIP-1559: Fee market change for ETH 1.0 chain,” Ethereum Improvement Proposals. https://eips.ethereum.org/EIPS/eip-1559 (April 2019)
- [16] Carlsten, M., Kalodner, H., Weinberg, S.M., Narayanan, A.: On the instability of bitcoin without the block reward. In: Proceedings of the 2016 ACM SIGSAC Conference on Computer and Communications Security. CCS ’16, Association for Computing Machinery (2016)
- [17] Chainlink: Decentralized Data Feeds. https://data.chain.link (2022)
- [18] Chen, X., Papadimitriou, C., Roughgarden, T.: An axiomatic approach to block rewards. In: Proceedings of the 1st ACM Conference on Advances in Financial Technologies. AFT ’19, Association for Computing Machinery (2019)
- [19] Chris Piatt and Jeffrey Quesnelle and Caleb Sheridan: Eden Network. https://edennetwork.io/EDEN_Network___Whitepaper___2021_07.pdf (2021)
- [20] Coinbase: What are miner fees and does Coinbase pay them? https://help.coinbase.com/en/coinbase/trading-and-funding/pricing-and-fees/what-are-miner-fees-and-does-coinbase-pay-them.html (2022)
- [21] Compound: Compound. https://compound.finance (2022)
- [22] Curve: Curve.fi. https://curve.fi (2022)
- [23] Daian, P., Goldfeder, S., Kell, T., Li, Y., Zhao, X., Bentov, I., Breidenbach, L., Juels, A.: Flash boys 2.0: Frontrunning in decentralized exchanges, miner extractable value, and consensus instability. In: 2020 IEEE Symposium on Security and Privacy (SP) (2020)
- [24] Easley, D., O’Hara, M., Basu, S.: From mining to markets: The evolution of bitcoin transaction fees. Journal of Financial Economics 134(1) (2019)
- [25] Eden Network: Eden Network. https://www.edennetwork.io/ (2022)
- [26] EigenPhi: EigenPhi Crypto & DeFi Analytics. https://eigenphi.io (2022)
- [27] Electrum: Electrum Bitcoin Wallet. https://electrum.org (2022)
- [28] Eskandari, S., Moosavi, S., Clark, J.: Sok: Transparent dishonesty: Front-running attacks on blockchain. In: Bracciali, A., Clark, J., Pintore, F., Rønne, P.B., Sala, M. (eds.) Financial Cryptography and Data Security. Springer International Publishing (2020)
- [29] Ethereum Foundation: Proof-of-Stake (PoS). https://ethereum.org/en/developers/docs/consensus-mechanisms/pos/ (2022)
- [30] Ethereum Foundation: The Merge. https://ethereum.org/en/upgrades/merge/ (2022)
- [31] Ethermine: Ethermine MEV-Relay. https://ethermine.org/mev-relay (2022)
- [32] Etherscan: Etherscan. https://etherscan.io (2021)
- [33] Eyal, I., Sirer, E.G.: Majority is Not Enough: Bitcoin Mining is Vulnerable. Commun. ACM 61(7) (Jun 2018)
- [34] F2Pool: Pushtx. https://www.f2pool.com/pushtx (2022)
- [35] Fiat, A., Karlin, A., Koutsoupias, E., Papadimitriou, C.: Energy equilibria in proof-of-work mining. In: Proceedings of the 2019 ACM Conference on Economics and Computation (EC ’19) (2019)
- [36] Flashbots: Flashbots Blocks API. https://blocks.flashbots.net/ (2022)
- [37] Flashbots: Flashbots Docs. https://docs.flashbots.net (2022)
- [38] Flashbots: How much hashrate is currently on Flashbots Auction? https://docs.flashbots.net/flashbots-auction/searchers/faq#how-much-hashrate-is-currently-on-flashbots-auction (2022)
- [39] Goren, G., Spiegelman, A.: Mind the mining. In: Proceedings of the 2019 ACM Conference on Economics and Computation. EC ’19 (2019)
- [40] Helen Partz: Second-largest Ethereum mining pool to suspend all operations. https://cointelegraph.com/news/second-largest-ethereum-mining-pool-to-suspend-all-operations (2021)
- [41] Huberman, G., Leshno, J.D., Moallemi, C.: Monopoly without a Monopolist: An Economic Analysis of the Bitcoin Payment System. The Review of Economic Studies 88(6) (03 2021)
- [42] Judmayer, A., Zamyatin, A., Stifter, N., Voyiatzis, A.G., Weippl, E.: Merged mining: Curse or cure? In: Data Privacy Management, Cryptocurrencies and Blockchain Technology. Springer (2017)
- [43] Kiayias, A., Koutsoupias, E., Kyropoulou, M., Tselekounis, Y.: Blockchain mining games. In: Proceedings of the 2016 ACM Conference on Economics and Computation (EC ’16) (2016)
- [44] Kiffer, L., Levin, D., Mislove, A.: Stick a fork in it: Analyzing the ethereum network partition. In: Proceedings of the 16th ACM Workshop on Hot Topics in Networks. pp. 94–100 (2017)
- [45] Lavi, R., Sattath, O., Zohar, A.: Redesigning Bitcoin’s Fee Market. In: The World Wide Web Conference. WWW ’19, ACM (2019)
- [46] Liu, F., Wang, X., Li, Z., Xu, J., Gao, Y.: Effective gasprice prediction for carrying out economical ethereum transaction. In: 2019 6th International Conference on Dependable Systems and Their Applications (DSA). pp. 329–334 (2020)
- [47] Mars, R., Abid, A., Cheikhrouhou, S., Kallel, S.: A machine learning approach for gas price prediction in ethereum blockchain. In: 2021 IEEE 45th Annual Computers, Software, and Applications Conference (COMPSAC). pp. 156–165 (2021)
- [48] Messias, J., Alzayat, M., Chandrasekaran, B., Gummadi, K.P.: On blockchain commit times: An analysis of how miners choose bitcoin transactions. In: KDD Workshop on Smart Data for Blockchain and Distributed Ledger. SDBD ’20 (August 2020)
- [49] Messias, J., Alzayat, M., Chandrasekaran, B., Gummadi, K.P., Loiseau, P., Mislove, A.: Selfish & Opaque Transaction Ordering in the Bitcoin Blockchain: The Case for Chain Neutrality. In: Proceedings of the ACM Internet Measurement Conference (IMC ’21) (November 2021)
- [50] Messias, J., Pahari, V., Chandrasekaran, B., Gummadi, K.P., Loiseau, P.: Data sets and scripts used to analyze the contention and prioritization transparency in both Bitcoin and Ethereum blockchains. https://github.com/johnnatan-messias/blockchain-transaction-ordering (2023)
- [51] Metamask: https://metamask.io
- [52] Nakamoto, S.: Bitcoin: A Peer-to-Peer Electronic Cash System. https://bitcoin.org/bitcoin.pdf (October 2008)
- [53] Noda, S., Okumura, K., Hashimoto, Y.: An economic analysis of difficulty adjustment algorithms in proof-of-work blockchain systems. In: Proceedings of the 21st ACM Conference on Economics and Computation (EC ’20) (2020)
- [54] Pass, R., Seeman, L., Shelat, A.: Analysis of the Blockchain Protocol in Asynchronous Networks. In: Coron, J.S., Nielsen, J.B. (eds.) Advances in Cryptology – EUROCRYPT 2017. Springer International Publishing (2017)
- [55] Poolin: Transaction Accelerator. https://pushtx.com (2022)
- [56] Qin, K., Zhou, L., Gervais, A.: Quantifying blockchain extractable value: How dark is the forest? In: 2022 IEEE Symposium on Security and Privacy (SP) (2022)
- [57] Qin, K., Zhou, L., Livshits, B., Gervais, A.: Attacking the DeFi Ecosystem with Flash Loans for Fun and Profit. In: Financial Cryptography and Data Security. FC ’21 (2021)
- [58] Romiti, M., Judmayer, A., Zamyatin, A., Haslhofer, B.: A deep dive into bitcoin mining pools: An empirical analysis of mining shares. In: Workshop on the Economics of Information Security. WEIS ’19 (2019)
- [59] Roughgarden, T.: Transaction fee mechanism design for the ethereum blockchain: An economic analysis of eip-1559. In: Proceedings of the 2021 ACM Conference on Economics and Computation. EC ’21 (2021)
- [60] Siddiqui, S., Vanahalli, G., Gujar, S.: Bitcoinf: Achieving fairness for bitcoin in transaction fee only model. In: Proceedings of the 19th International Conference on Autonomous Agents and MultiAgent Systems. AAMAS ’20, International Foundation for Autonomous Agents and Multiagent Systems (2020)
- [61] Sompolinsky, Y., Zohar, A.: Secure High-Rate Transaction Processing in Bitcoin. In: Böhme, R., Okamoto, T. (eds.) Financial Cryptography and Data Security. FC ’15, Springer Berlin Heidelberg (2015)
- [62] SparkPool: Taichi Network. https://taichi.network (2021)
- [63] Strehle, E., Ante, L.: Exclusive mining of blockchain transactions. In: In Scientific Reports 2020-Conference proceedings of the Scientific Track of the Blockchain Autumn School 2020 (2020)
- [64] SushiSwap: Decentralized Exchange Made For Everybody. https://www.sushi.com (2022)
- [65] Torres, C.F., Camino, R., State, R.: Frontrunner jones and the raiders of the dark forest: An empirical study of frontrunning on the ethereum blockchain. In: 30th USENIX Security Symposium (USENIX Security 21). USENIX Association (Aug 2021), https://www.usenix.org/conference/usenixsecurity21/presentation/torres
- [66] Trezor: Trezor Hardware Wallet. https://trezor.io (2022)
- [67] Tsabary, I., Eyal, I.: The gap game. In: Proceedings of the 2018 ACM SIGSAC Conference on Computer and Communications Security. CCS ’18, Association for Computing Machinery (2018)
- [68] Turksonmez, K., Furtak, M., Wittie, M.P., Millman, D.L.: Two ways gas price oracles miss the mark. In: 2021 IEEE International Conference on Omni-Layer Intelligent Systems (COINS). pp. 1–7 (2021)
- [69] Uniswap: Uniswap Protocol. https://uniswap.org (2022)
- [70] ViaBTC: Transaction Accelerator. https://www.viabtc.com/tools/txaccelerator/ (2022)
- [71] Weintraub, B., Torres, C.F., Nita-Rotaru, C., State, R.: A Flash(bot) in the Pan: Measuring Maximal Extractable Value in Private Pools. In: Proceedings of the ACM Internet Measurement Conference (IMC’22) (October 2022)
- [72] Wood, G., et al.: Ethereum: A secure decentralised generalised transaction ledger. Ethereum project yellow paper 151(2014) (2014)
- [73] Zhang, R., Preneel, B.: Lay down the common metrics: Evaluating proof-of-work consensus protocols’ security. Proceedings - IEEE Symposium on Security and Privacy 2019-May (2019)
- [74] Zhou, L., Qin, K., Torres, C.F., Le, D.V., Gervais, A.: High-frequency trading on decentralized on-chain exchanges. In: 2021 IEEE Symposium on Security and Privacy (SP). pp. 428–445 (2021)
Appendix 0.A Ethereum private transaction experiment
We conducted active experiments where we issued Ethereum transactions; half issued publicly and the other half privately through a private-channel network known as Taichi Network [62]. Table 4 summarizes the transactions in our experiment. Spark Pool and Babel Pool included all private transactions ( transactions each) sent directly to these miners through Taichi Network.
| # | type | tx hash | block number | miner | tx. position | block delay | fee paid | base fee | max fee | max priority fee | gas price | block timestamp |
|---|---|---|---|---|---|---|---|---|---|---|---|---|
| per # of txs. | (in blocks) | (in Ether) | (Gwei) | (Gwei) | (Gwei) | (Gwei) | in UTC | |||||
| 1 | public | bbe88ea4f000 | 13,183,516 | Nanopool | 305 / 336 | 1 | 0.00190489 | 88.98082939 | 116.52835749 | 1.72836605 | 90.70919543 | 2021-09-08 06:39:18 |
| private | c46b75ead538 | 13,183,520 | Babel Pool | 29 / 39 | 5 | 0.00225209 | 105.51391459 | 120.56586232 | 1.72836605 | 107.24228063 | 2021-09-08 06:40:29 | |
| 2 | public | 6d994fc1aadd | 13,183,561 | Binance | 209 / 213 | 2 | 0.00244137 | 114.95482846 | 137.64014705 | 1.30100683 | 116.25583529 | 2021-09-08 06:49:26 |
| private | a4d4ae42ebf5 | 13,183,565 | Spark Pool | 294 / 296 | 6 | 0.00240978 | 113.45059961 | 137.64014705 | 1.30100683 | 114.75160643 | 2021-09-08 06:50:12 | |
| 3 | public | 7257430a6c45 | 13,183,634 | Unknown | 124 / 126 | 2 | 0.00263298 | 123.27216185 | 135.21393222 | 2.10805685 | 125.38021870 | 2021-09-08 07:06:31 |
| private | f2beec15cdf1 | 13,183,635 | Spark Pool | 321 / 340 | 3 | 0.00257468 | 120.49562077 | 135.21393222 | 2.10805685 | 122.60367762 | 2021-09-08 07:06:44 | |
| 4 | public | e216952c1574 | 13,183,679 | Ethermine | 280 / 302 | 13 | 0.00223433 | 104.69510748 | 108.95262574 | 1.70164453 | 106.39675202 | 2021-09-08 07:18:37 |
| private | 4c482b87c76f | 13,183,690 | Babel Pool | 150 / 212 | 24 | 0.00179917 | 83.97323655 | 108.95262574 | 1.70164453 | 85.67488108 | 2021-09-08 07:20:12 |
Appendix 0.B Liquidation with Chainlink oracle updates
In AAVE, of bundles, (86.14%) include one Chainlink oracle update followed by a liquidation. There are (4.51%) with two oracle updates followed by liquidations. Out of oracle updates bundled with liquidations, () are USDC-ETH, () are USDT-ETH, () are DAI-ETH, () are SUSD-ETH, and () are LINK-ETH. In Compound, of bundles, (85.49%) contain one Chainlink oracle update followed by one liquidation, while (6.08%) include two oracle updates followed by liquidations. Out of oracle updates bundled with liquidations, () are ETH-USD, () are BTC-USD, and () are UNI-USD.
Appendix 0.C Hashing rates of mining pools
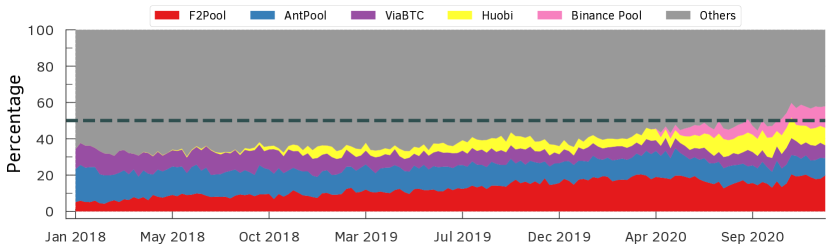
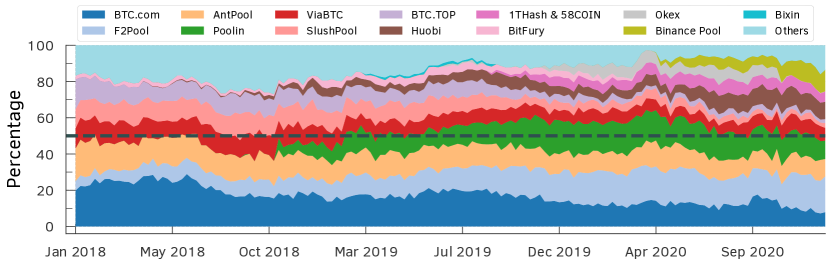
Per Figure 7, the hash rates of Bitcoin mining pools such as BTC.com, F2Pool, and AntPool alone accounted for almost half the total hash rate of the network around May 2018, and roughly a year later, i.e., from March 2019, together with Poolin the four mining pools alone represent more than of the total network hash rate. At the end of 2020, new MPOs, e.g., Lubian.com and Binance Pool, started mining Bitcoin, which help improve the decentralization of Bitcoin. However, BTC.com, F2Pool, AntPool, and Poolin still account for almost half of the hash rates showing that a few mining pools control a considerable portion of the Bitcoin hash rate.
Hash rates of Ethereum mining pools, in contrast to Bitcoin, do not show a high variance (see Figure 8). We also observed that Spark Pool, the second-largest Ethereum mining pool, suspended their mining services on September 30, 2021, due to regulatory requirements in response to Chinese authorities [40].
Appendix 0.D Bitcoin transaction acceleration experiment
| txid | block height | miner | tx. position | delay | acc. cost | vsize | fee rate | Mempool | timestamp | |
|---|---|---|---|---|---|---|---|---|---|---|
| (in blocks) | (BTC) | (byte) | sat-per-vsize | # of txs. | vsize (MB) | in UTC | ||||
| 35b18e52dbc1 | Huobi | 2nd | 2 | 0.001254 | 110 | 2 | 44.63 | 2020-11-26 19:10 | ||
| 65765cbaede2 | F2Pool | 73rd | 1 | 0.001254 | 110 | 2 | 32.55 | 2020-11-27 11:06 | ||
| 0c209829fbf0 | AntPool | 2nd | 2 | 0.001254 | 110 | 1 | 38.01 | 2020-11-27 13:38 | ||
| 1515a7179af3 | Binance | 2nd | 3 | 0.001254 | 110 | 1 | 37.89 | 2020-11-27 21:55 | ||
| 48a0a50ddaec | ViaBTC | 3rd | 1 | 0.001045 | 110 | 1 | 9.82 | 2020-11-30 10:09 | ||
| 9a17cff3734c | Huobi | 2nd | 2 | 0.001045 | 110 | 1 | 9.41 | 2020-11-30 10:28 | ||
| 831b2495d421 | AntPool | 2nd | 1 | 0.001045 | 110 | 1 | 8.66 | 2020-11-30 12:22 | ||
| 1f59bf47096c | F2Pool | 111th | 3 | 0.001045 | 110 | 1 | 11.40 | 2020-11-30 12:58 | ||
| 6942e08c06c3 | Huobi | 2nd | 2 | 0.001045 | 110 | 1 | 19.06 | 2020-11-30 14:49 | ||
| 8e49e2ae825f | ViaBTC | 6th | 1 | 0.001254 | 110 | 2 | 22.59 | 2020-12-01 10:40 | ||
We ran an active Bitcoin transaction acceleration experiment where we paid EUR to ViaBTC [70] to accelerated transactions from different snapshots of our Mempool. To select these transactions, we checked whether the Mempool was congested (i.e., having more transactions waiting for inclusion than the next block would be able to include), with its size being at least . Then, we considered only transactions with low fee rates—less than or equal to 2 sat-per-byte—to ensure that these transactions would be highly unlikely to be included soon in a subsequent block. Next, we sorted the remaining transactions by size to limit the experiment cost as the acceleration-service costs grow proportional to the transaction size. Finally, we select the transaction with the smallest size in bytes for our active experiment.
Most of these accelerated transactions were included nearly in the next block, demonstrating the acceleration efficiency. Also, these transactions were wrongly positioned in the block: They appeared, for instance, at the top of the block, i.e., higher than the non-accelerated transactions, showing that miners indeed prioritized them (see Table 2). Further, we observed that although we had only accelerated transactions via ViaBTC, other top mining pools were also involved in confirming the accelerated transactions.
Table 5 shows the transactions used in our experiments. At the time we conducted our experiments, if we rank the miners whose included these transactions based on their daily hash-rate power as (D) and weekly hash-rate power as (W), we would have Huobi (D: ; W: ), Binance (D: ; W: ), F2Pool (D: ; W: ), AntPool (D: ; W: ), ViaBTC (D: ; W: ). Together these mining pools corresponds to a hash-rate power of (D: ; W: ). Figures 9 and 10 show the hash-rate of mining pools in the active experiment and considering the passive experiment (inferred to be accelerated by BTC.com API), respectively.
Furthermore, BTC.com [14], one of the leading Bitcoin mining pools, provides transaction acceleration services and allows users to verify if transactions have been accelerated through their platform or partner services. From our dataset, we selected those with a SPPE greater than or equal to % ( transactions in total) and checked if they were said to be accelerated by BTC.com’s API. Of these transactions, were found to have been accelerated. Our findings also show that transaction acceleration services are becoming quite common among Bitcoin mining pools (as shown in Figure 11). Between 2018 and April 2019, only BTC.com and F2Pool alone accounted for most of the accelerated transactions. However, as of December 2020, we see that BTC.com accounts for a very small fraction of accelerated transactions, with AntPool, Huobi, and F2Pool accounting for most of the accelerated transactions.