Complex network view for Scuti stars
2Observatory, Faculty of Science, University of Zanjan, University Blvd., Zanjan, 45371-38791, Zanjan, Iran
)
1 Abstract
Extraction of characteristics of the complex light curve of pulsating stars is essential for stellar physics. We investigate the complex network (natural and horizontal visibility graphs) properties of the Sct stars light curves observed by TESS. We find that the average shortest path length of Sct light curves is a linear function of the logarithm of the network sizes, indicating the small-world and non-random properties. The small-world property signifies the connection of significant peaks of the light curve with small nearing peaks and other important peaks. The lognormal behavior of nodes’ degree is evidence for non-random processes for stellar pulsations. This may be rooted in the different mechanisms of stellar dynamics, such as rotation, excitation of modes, and magnetic activity. The PageRank and nodes’ degree distributions of Sct stars collect in two HADS and non-HADS groups. The lower clustering for HADS than non-HADS indicates a more straightforward light curve (containing one or two independent modes) than a more complex light curve (including various oscillation modes) that might be a signature of surface gravity as an indication of stellar evolution. We show that reducing the window size of a light curve to about 5% of the original one based on the network ranking preserves most of the star modes information. In this case, we also observe that the amplitude of most natural modes amplifies compared to the noise background in the power spectrum. These results indicate the capability of the network approach for interpreting pulsating stars’ light curves.
2 Introduction
Asteroseismology is a fundamental approach for identifying and modeling stellar light curves to determine the internal structure and properties of pulsating stars (e.g. Aerts et al.,, 2003; Christensen-Dalsgaard,, 2004; Baglin,, 2003; Chaplin et al.,, 2009; Aerts et al.,, 2010; Handler,, 2013; Basu and Chaplin,, 2017; Bowman,, 2017; Aerts,, 2021; Kurtz,, 2022). Space telescopes such as CoRoT (Baglin et al.,, 2009), Kepler (Gilliland et al.,, 2010) and TESS (Ricker et al.,, 2015) provide the most accurate light curves for astrophysical and exoplanets investigations. The complex network methods for pulsating stars may extract meaningful statistics and hidden characteristics of the system. In complex network theory, a real-world time series maps to a graph to extract the topological features of the system that do not occur in the simple analysis due to the complex behavior of the system.
Several analyses have been employed, e.g., on internal structure, mode identification, and classification for Sct stars (e.g., Balona and Dziembowski,, 2011; Uytterhoeven et al.,, 2011; Chang et al.,, 2013; Kahraman Aliçavuş et al.,, 2017; Niemczura et al.,, 2015; Pakštienė et al.,, 2018; Antoci et al.,, 2019; Jayasinghe et al.,, 2020; Bedding et al.,, 2020; Murphy et al.,, 2020; Chaplin et al.,, 2020; Audenaert et al.,, 2021; Bowman et al., 2021a, ; Barbara et al.,, 2022; Kirmizitas et al.,, 2022). The Sct stars are multi-periodic pulsating stars with intermediate masses. In the HR diagram, the Sct stars are at the transition region between low-mass and high-mass stars. The low-mass stars () have thick convective envelopes, and high-mass stars () have large convective cores and radiative envelopes. These stars have spectral types A0-F5 and pulsate in low-order pressure modes. They are in the lower part of the classical instability strip, within or just above the main sequence stars. Effective temperatures of Sct stars are approximately between 6500 K and 9500 K. The Sct stars represent various cepheid-like significant amplitude radial pulsations and the non-radial multi-periodic pulsations within the classical instability strip with dominant pulsation frequencies in the range of 5-80 d-1 (e.g., Breger,, 2000; Pamyatnykh,, 2000; Bowman et al.,, 2016; Michel et al.,, 2017; Balona,, 2018; Bowman and Kurtz,, 2018; Pakštienė et al.,, 2018; Qian et al.,, 2018; Ziaali et al.,, 2019; Jayasinghe et al.,, 2020; Bedding et al.,, 2020; Hasanzadeh et al.,, 2021; Barac et al.,, 2022).
The high amplitude Sct stars (called HADS), are classified in population of Sct stars with V band amplitude mag and also . However, the SX Phoenicis type of large amplitude Sct stars is metal-poor population II stars. The frequency spectrum of HADS stars mostly shows only one or two independent modes, which are probably radial (Breger,, 2000; Poretti,, 2003; McNamara et al.,, 2007; McNamara,, 2011; Balona et al.,, 2012; Balona,, 2016; Bowman et al., 2021b, ; Yang et al.,, 2022). In Sct stars, the well-known mechanism, which operates in zones of partial ionization of hydrogen and helium, can drive low-order radial and nonradial modes of the low spherical degree to measurable amplitudes (opacity-driven unstable modes). In low temperature Sct stars, near the red edge of the instability strip with substantial outer convection zones, the selection mechanism of modes with observable amplitudes could be affected by induced fluctuations of the turbulent convection. Some studies (e.g., Houdek et al.,, 1999; Samadi et al.,, 2002; Antoci et al.,, 2011; Antoci,, 2014) suggested the opacity-driven unstable p modes, in which nonlinear processes limit their amplitudes, and intrinsically stable stochastically driven (solar-like) p modes can be excited simultaneously in the same Sct star.
de Franciscis et al., (2018) investigated the fractal property of Sct stars via the rescaled range analysis, multifractal spectra analysis, and coarse-graining spectral analysis. They inferred the scale invariances of light curve of Sct stars may be due to the turbulent. The complex system methods have been widely applied for distinguishing individual and collective features in many scientific fields, such as economics (Souma et al.,, 2003), biology (Barabasi and Oltvai,, 2004), earthquakes (Baiesi and Paczuski,, 2004; Pastén et al.,, 2018; Vogel et al.,, 2020), and Solar physics (Daei et al.,, 2017; Gheibi et al.,, 2017; Lotfi et al.,, 2020; Mohammadi et al.,, 2021). The complex network approach could classify features with the same characteristics (e.g., the degree distribution, average clustering coefficient, transitivity, and PageRank) and quantify the complexities of dynamic systems. Graph theory is a powerful mathematical tool for exploring the characteristics of complex systems. Time series analysis based on the complex network provides information about feature structure. By mapping the time series into a natural and horizontal visibility graph, we can capture the essential characteristics of the features into distinct individual categories.
Due to small-amplitude nonradial modes in light curves, categorizing the HADS and non-HADS (low amplitude multi-mode Sct stars) stars is challenging. Amplitude modulation, non-linear driving mechanisms of modes, binarity, and planets’ effects are complex features of stars’ light curves. Here, we study the characteristics of HADS and non-HADS stars by mapping the light curves into the graph using the horizontal visibility graph (HVG) and natural visibility graph (NVG) approaches. We study the networks’ local and global characteristics (nodes’ degree distribution, clustering coefficients, path length, PageRank, etc.) for HADS and non-HADS stars to show the capability of complex network approaches to identifying HADS and non-HADS stars.
3 Data
TESS is a NASA mission and a high-precision photometric instrument (Sullivan et al.,, 2015; Barclay et al.,, 2018) and scans the sky in several sectors for millions of stars at 600-1000 nm bands (Ricker et al.,, 2015). TESS observed hundreds of thousands of stars with a short cadence of 2 minutes and a long cadence of 30 minutes (Campante et al.,, 2016; Stassun et al.,, 2018; Feinstein et al.,, 2019) that are collected into MAST111https://archive.stsci.edu in both target pixels and light curve files. Due to fewer data points, the complex network (Section 4.1) did not form for long cadence TESS observation targets. So, we queried the information and short cadence light curves of 33 (Table 1) and 40 (Table 2) HADS and non-HADS stars, respectively, by using the Python Lightkurve package (Lightkurve Collaboration et al.,, 2018).
4 Methods
4.1 Network representation of a stellar light curve
A complex network is a helpful approach to studying the characteristics of natural complex systems that evolve via complex dynamics. A complex network extracts a complex system’s behavior, composed of individual parts or interacting components. Then show emergent collective characteristics of the system. Natural visibility graph (NVG) and horizontal visibility graph (HVG) are among the several algorithms for building a network for a time series to study the system’s characteristics (e.g., Newman,, 2003; Luque et al.,, 2009; Newman,, 2010; Gheibi et al.,, 2017; Daei et al.,, 2017; Najafi et al.,, 2020; Lotfi et al.,, 2020; Mohammadi et al.,, 2021; Taran et al.,, 2022).
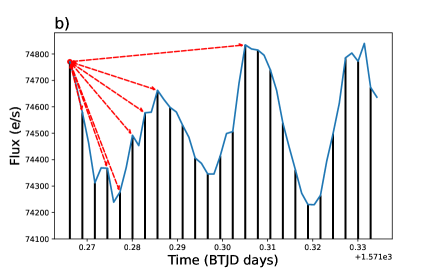
NVG and HVG are algorithms that focus on the interactions of system elements. To map a time series like a stellar light curve to a network, we consider each data point as a node (vertex), and if two elements interact, they are then connected in pairs by lines (edges or links). Figure 1 illustrates the connection of nodes (data points) for HD 112063 (TIC 9591460) light curve via the NVG and HVG algorithms.
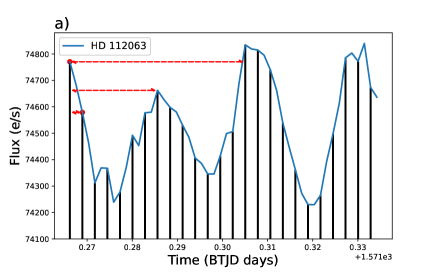
For the HVG network for HD 112063 star, node connects to if an arbitrary point such that satisfies the condition (Figure 1 top panel)
| (1) |
In the NVG algorithm for HD 112063 star, we map the light curve into a network based on the visibility criterion. For two data points and in the light curve have connected nodes in the graph via the criteria:
| (2) |
in which is an arbitrary data point such that .
In the network approach, a set of local and global metrics reflect some particular features of the system. Local metrics describe individual nodes or edges, and global metrics interpret the graph as a whole. We briefly describe the nodes degree, clustering coefficient, shortest path length, and transitivity properties of an HVG network.
The node’s degree of a network is one of the local metrics which measures the centrality. The node’s degree is the number of edges linked to the node. Centrality shows the most influential nodes with effective connectivity through the network (Acosta-Tripailao et al.,, 2021). Local and average clustering coefficients are local metrics in a graph that indicate the node’s tendency to cluster together and their neighbors. Transitivity is a global clustering coefficient that determines the density of triangles in a complex network. Transitivity measures the fraction of triples with their third edge served to complete the triangle. Average shortest-path length is another global metric for complex networks that define the average number of links as the shortest paths for all pairs of nodes. The Google founders developed the PageRank metric that measures the importance of every single node. The assumption is that important nodes have many in-links from essential nodes.
4.2 Power-law and lognormal distribution fits
We applied the maximum likelihood estimation in the Bayesian framework (Clauset et al.,, 2009; Farhang et al.,, 2018; Alipour et al.,, 2022) to obtain the fit parameters of both power-law and lognormal distributions to data. Also, applying the bootstrapping sampling, we computed the parameters’ uncertainty and average (true) value for both the power law and lognormal distributions. We examined a hypothesis test based on K-S (Kolmogorov–Smirnov) statistic. The null hypothesis supposes no significant difference between the nodes’ degree distribution and the lognormal/power law model. But, the alternative hypothesis assumes a substantial difference between the nodes’ degree distribution and the model. We calculate a p-value to decide whether or not the lognormal/power law distribution hypothesis is plausible for our nodes’ degree. A p-value more petite than the threshold of 0.1 refutes the null hypothesis showing that the lognormal/power law distribution is ruled out. We cannot deny the null for a p-value more remarkable than the threshold of 0.1.
The power-law distribution function is given by
| (3) |
where and are threshold and power index, respectively. This power-law or scale-free property is an essential characteristic of a self-oscillatory process that can be considered as the underlying mechanism of self-similar, self-organized, or self-organized criticality systems.
5 Results and discussions
In the current work, we analyzed the complex networks of Sct stars observed by TESS. The HADS stars are mostly radial mono-periodic or double-mode pulsators, but the other Sct stars show several oscillations frequencies (multi modes). We provided a list of HADS stars, including 20 mono-periodic and 13 double-mode HADS stars. We also have 40 non-HADS stars, typically multi-periodic pulsators. We mapped the TESS stellar light curves of HADS and non-HADS stars into the individual networks via the HVG and NVG algorithms.
We applied the HVG and NVG algorithms to investigate the characteristics of 33 and 40 HADS and non-HADS stars, respectively. Due to different algorithms of network structure for HVG and NVG, we represent the results for key metrics of each algorithm. Some network properties in both HVG and NVG algorithms for HADS and non-HADS stars show similar behavior, so we presented the results for one of the algorithms. Also, for some metrics without simple interpretable behavior, we ignored the analysis for those metrics.
Figure 2 represents the average shortest path length for the HVG network of GP And (HADS) and HD 113211 (non-HADS) that compared with the equivalent random network (Luque et al.,, 2009). As shown in the figure, the average shortest path length network for both stars has deviated from the random network. The linear dependency of the average shortest path length to the logarithm of network size for both cases indicated the small-world behavior of networks. We observed similar behavior for all target stars of Tables 1 and 2. The small world behavior for Sct stars network shows that the high peaks at the light curve are connected to several neighboring small peaks and the other high peaks at the light curve. In the context of complex networks, reported a similar behavior for other small-world networks (Watts and Strogatz,, 1998; Mathias and Gopal,, 2001; Latora and Marchiori,, 2001).
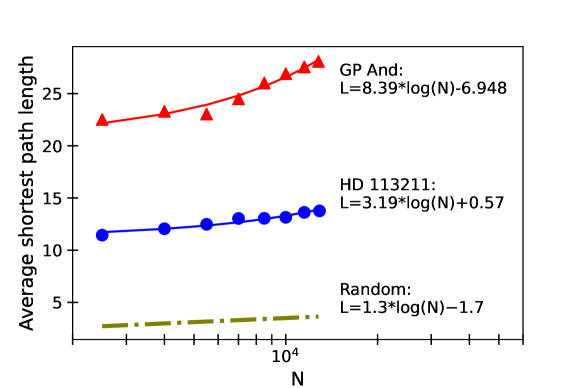
Figure 3 depicts the scattering of the average clustering coefficients and transitivity of HVG networks for HADS (triangles) and non-HADS (circles) stars. The color bar indicates surface gravity, for Terminal-age main sequence (TAMS), for Mid-age main sequence (MAMS), and for Zero-age main sequence (ZAMS) stars (Bowman and Kurtz,, 2018). The HADS stars have high transitivity and low clustering coefficients, but the other Sct stars have different values. So, the HADS and non-HADS stars are clustered in groups with different slopes (linear fits). The RX Cae (HD 28837) star (indicated by a black arrow) is defined as a HADS candidate. As shown in the figure, the HADS are mostly MAMS samples that consider the old stars comparing the non-HADS with large surface gravity. The low clustering coefficient indicates the simple light curve (containing one or two independent modes) for HADS compared with the more complicated light curve (including various oscillation modes) for non-HADS.
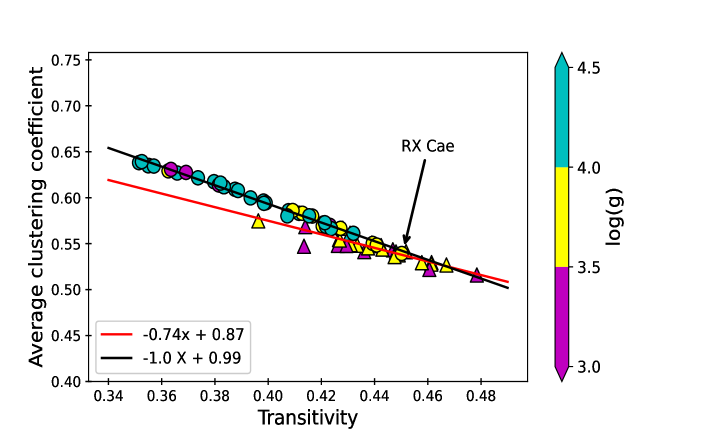
Figure 4 shows PDF and CCDF for nodes’ degree of the HVG network for six HADS stars. As shown in the figure, the distribution of nodes degree is heavy-tail, so we fitted the power-law and lognormal distribution via the maximum likelihood estimation in the Bayesian framework (Section 4.2).
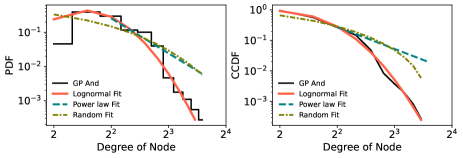
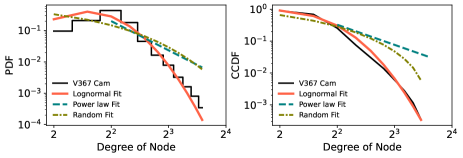
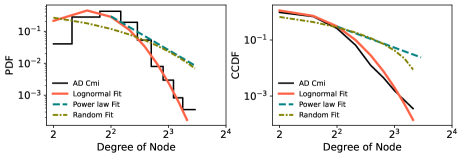
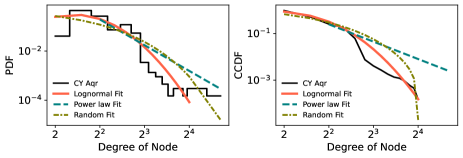
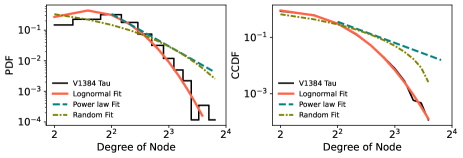
We observe that the peak of the nodes’ degree distribution (Figure 4) for HADS (mono-periodic: GP And (TIC 436546358), CY Aqr (TIC 422412568), AD Cmi (HD 64191), and V367 Cam (TIC 354872568); double mode: V1384 Tau (TIC 415333069) and HD 146953) are precisely three or four. We analyzed the HVG characteristics of a single-mode artificial sinusoidal light curve to address this essential property of HADS stars. Figure 5 displays the horizontal visibility required for the HVG network for a part of a mono-periodic artificial time series. We observe that the nodes with three links are more frequent than the others, with the number of connections differing from three. In other words, we follow that the nodes (black points) connect to three other nodes due to the behavior of a sinusoidal mono-periodic artificial time series—this property of a fully sinusoidal time series with various frequencies/periods. However, most mono-periodic stellar light curves have the HVG node distribution peaks of about three or four, similar to the artificial time series. However, the range of degrees of nodes is different for regular artificial time series and mono-periodic stellar light curves. These differences may indicate the diverse nature of light curves of pulsating stars as , stochastic, or other complex generative mechanisms (Houdek et al.,, 1999; Samadi et al.,, 2002; Antoci et al.,, 2011; Antoci,, 2014) for pulsations from a regular sinusoidal oscillation. We find the p-value for both power-law fit and random model (Luque et al.,, 2009) is less than 0.01, which rejects both models for nodes’ degree distribution of Sct stars. The rejection of the random model implies that the Sct stars light curve is not random. The p-values for lognormal fits are more than 0.1 (Table 1), which indicates we can not refute the lognormal model for nodes’ degree distribution of HADS stars. We obtain the lognormal distribution parameters in the range of 3.05 to 3.86 and 0.2 to 0.6 for scale and shape, respectively. The lognormal distribution is an essential feature of systems handled with multiplicative independent varying parameters (Mitzenmacher,, 2004; Bazarghan et al.,, 2008; Tajfirouze and Safari,, 2012; Tokovinin,, 2014; Ruocco et al.,, 2017; Alipour et al.,, 2022; Farhang et al.,, 2022). The lognormal distribution of the network parameter for Sct stars might originate in the pulsating driving mechanisms. The different mechanisms of stellar dynamics control the pulsating driving mechanisms, including rotation, excitation of modes, and magnetic activity (de Franciscis et al.,, 2018).
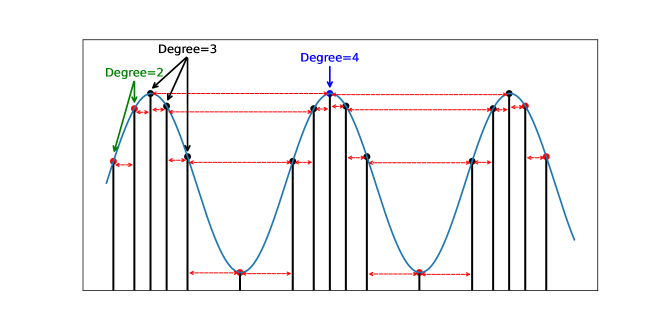
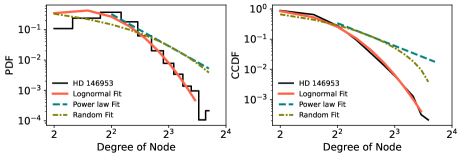
Figure 6 shows PDF and CCDF for nodes’ degree of the HVG network for six non-HADS stars, HD 77914, HD 112063, HD 86312, HD 44930, HD 56843, and V479 Tau (HD 24550). We obtain the p-values more than 0.1 (Table 2) for lognormal fits, which shows we can not reject the lognormal model for nodes’ degree distribution of non-HADS stars. We find the lognormal distribution parameters in the range of 2.4 to 3.9 and 0.33 to 0.6 for scale and shape, respectively. A lognormal distribution is due to a multiplicative process (e.g., Hubble,, 1934; Kolmogorov,, 1962; Miller and Scalo,, 1979; McBreen et al.,, 1994; Mouri et al.,, 2009). So, the lognormal behavior of nodes degree for stellar flux network may indicate the flux of Sct stars forming via some multiplicative process. Pauluhn and Solanki, (2007) and Bazarghan et al., (2008) showed that the small-scale solar brightening features distribution follows a lognormal distribution.
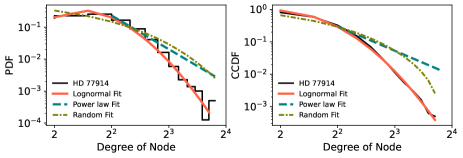
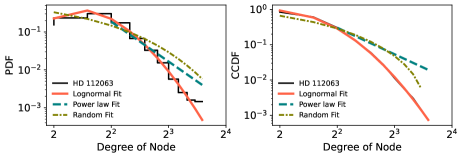
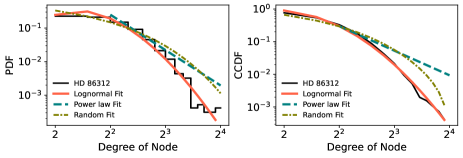
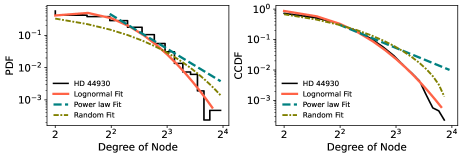
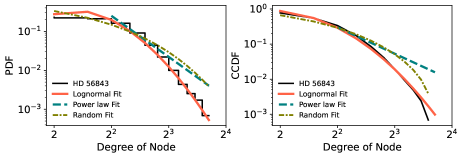
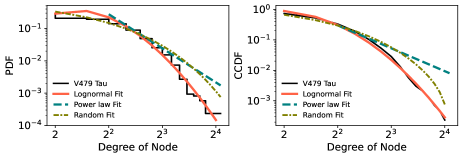
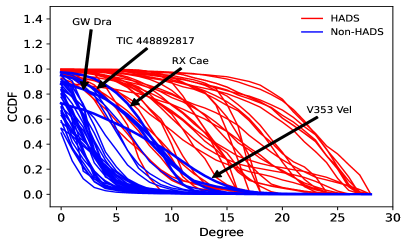
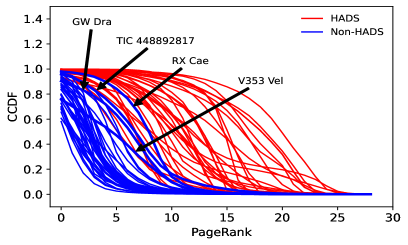
Figure 7 depicts the CCDF of nodes’ degree and PageRank of NVG network for Sct stars. We observe that both nodes’ degree and PageRank distributions for HADS stars (red lines) are grouped above levels than the non-HADS (blue lines) stars. The high nodes’ degree shows the significant number of connections of nodes with others. However, the high PageRank indicates the important nodes or data points in the light curve with many in-links from other nodes. Since HADS are mostly mono-periodic or double mode stars, so high PageRank nodes (importance nodes) show a significant probability over the other nodes. However, due to the superposition of amplitudes of several modes for non-HADS stars, the high PageRanks (tail of the distribution) have low probability than the low PageRank.
Analysis for the network properties (e.g., PageRank and nodes’ degree distributions) indicates that the V353 Vel, TIC 448892817, and GW Dra stars are in the interface of HADS and non-HADS stars. Lv et al., (2022) showed that the TIC 448892817 is a HADS star, confirmed by the present network analysis. Along with the clustering coefficient analysis (Figure 3), the PageRank and degree distribution for RX Cae also suggest considering this star in the HADS subclass. Also, the dominant period ( d) and luminosity ( mag) for RX Cae satisfy the revised P-L relation (Ziaali et al.,, 2019).
5.1 Effect of the noise on networks’ parameters
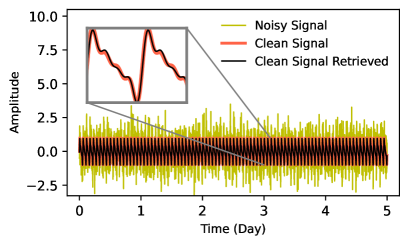
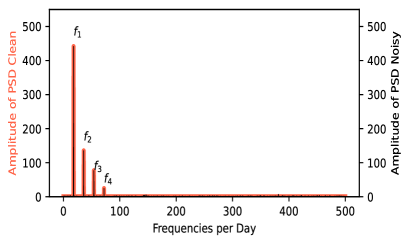
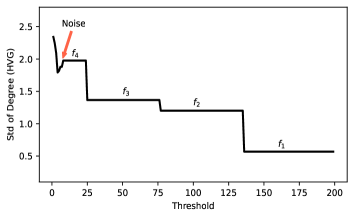
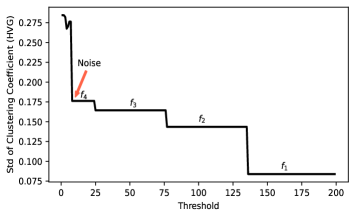
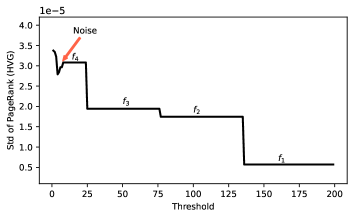
We investigate the effect of noise on the networks’ parameters for a synthetic time series with several frequencies and amplitudes (in the range of Sct stars) with harmonics, including the white noises. Figure 8 shows the synthetic time series and its power spectral density (PSD) calculated with fast Fourier transformation. We reconstruct the related time series via inverse Fourier transformation for different threshold values as a fraction of PSD subtracted from the primary PSD. For each time series, we build the HVG network. Figure 9 displays the standard deviation (std) of network parameters (nodes degree, clustering coefficient, and PageRank) versus the threshold. We observe that the thresholds of decreasing steps for the std of network parameters corresponded to the PSD of frequencies. Therefore, the number of significant steps corresponds to the frequencies made in the time series. Also, the fluctuations of the small thresholds might correspond to the different noise levels.
5.2 Reducing the size of the window for light curves
Reducing the size of the window of a time series without significantly decreasing the essential characteristics of the time series is very important in machine learning applications (Moradkhani et al.,, 2015). The modes’ information, such as frequencies, amplitudes, and phases, are the main characteristics of pulsating star light curves (Aerts et al.,, 2010). We apply the complex network parameter (e.g., PageRank) to reduce a stellar light curve’s data points. To find the key data points of light curves, we first ranked the nodes of a light curve according to their HVG PageRanks. Then we selected a given percentile of data points with higher PageRanks. We extract the characteristics (frequencies and amplitudes) for the resultant light curve.
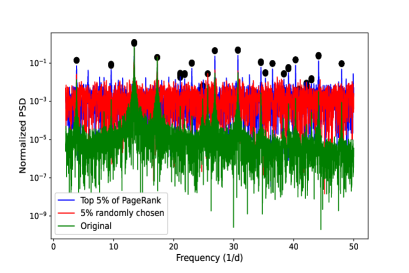
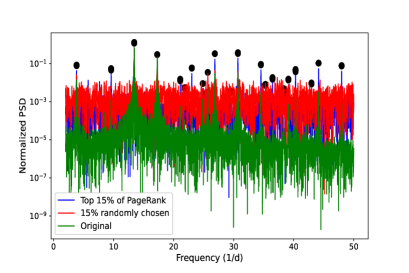
Figure 10 represents the frequency power spectrum for 5% (top panel) and 15% (bottom panel) of TIC 448892817 light curve chosen by the large HVG PageRanks (blue) and random sample (red) that compared with the power spectrum of the full light curve in sector 5 (green). We observe that compared with the random sampling, the modes (frequencies, amplitudes, and phases) obtained from light curves reduced by the network approach are significantly satisfied with the full light curves (black circles) reported by Lv et al., (2022). In this case, we also observe that the most amplitudes for identified frequencies were amplified from the noise background. This result implies that reducing the size of the window to e.g., 5% of the original light curve via the network approach preserves the main characteristics of the light curve. However, some characteristics of the light curve were missed by the random sampling.
6 Conclusions
We investigate the network characteristics Sct stars via the HVG and NVG algorithms, which both algorithms study the interaction of data points along the light curves (Figure 1). We focus on the network metrics to discuss the property of HADS and non-HADS stars.
-
•
The linear dependency of the average shortest path length (Figure 2) for HVG network size (in log space) of Sct stars indicates that the networks are small-world complex networks with non-random properties. This small-world property implies that the peaks of the stellar flux light curves connect with some small close peaks and are then linked to other significant peaks along the light curves.
-
•
Scattering of transitivity and average clustering coefficient of HADS and non-HADS stars are clustered in two groups overlapping at some deals (Figure 3). The low average clustering for RX Cae (HD 28837) star is defined as a HADS sample. The lower clustering coefficient for most HADS stars indicates the simple light curve (containing one or two independent modes). In contrast, the higher clustering for non-HADS cases is a signature of the more complicated light curve (including various oscillation modes). These results may be due to HADS ages (low surface gravity) as older than the non-HADS stars. In other words, the older stars may have simpler light curves than the younger stars.
- •
-
•
We find that the nodes’ degree and PageRank distributions for NVG networks of HADS and non-HADS stars are grouped in two classes for most cases (Figure 7).
-
•
Based on the network ranking for modes, we reduced the window size of a light curve to about 5% of the original one, which preserves most of the star oscillation modes characteristics (frequencies, amplitudes, and phases). We also observe that most natural modes amplify the amplitude compared to the power spectrum’s noise background.
Finally, we observe that the network approach can recognize HADS in the Sct stars as a subgroup of pulsating stars. We conclude that the network analysis of light curves helps interpret pulsating stars and their originating mechanisms via stellar dynamics.
| Star ID | Lognormal | ||||
|---|---|---|---|---|---|
| Name | HD | TIC | p-value | ||
| AD Cmi | 64191 | 266328148 | 0.14 | ||
| BE Lyn | 79889 | 56914404 | 0.16 | ||
| CY Aqr | – | 422412568 | 0.18 | ||
| DX Cet | 16189 | 278962831 | 0.14 | ||
| GP And | – | 436546358 | 0.18 | ||
| GW Uma | – | 150276417 | 0.21 | ||
| PT Com | – | 335826251 | 0.28 | ||
| RS Gru | 206379 | 139845816 | 0.19 | ||
| V 524 And | – | 196562983 | 0.15 | ||
| V367 Cam | – | 354872568 | 0.19 | ||
| V1162 Ori | – | 34512862 | 0.21 | ||
| V2455 Cyg | 204615 | 266794067 | 0.17 | ||
| YZ Boo | – | 233465540 | 0.16 | ||
| AN Lyn | – | 56882581 | 0.20 | ||
| – | 146953 | 210548440 | 0.23 | ||
| V1384 Tau | – | 415333069 | 0.26 | ||
| V1393 Cen | 121517 | 241787384 | 0.20 | ||
| V2855 Ori | 254061 | 166979292 | 0.22 | ||
| ZZ Mic | 199757 | 126659093 | 0.06 | ||
| AE Uma | – | 357132618 | 0.20 | ||
| Pup | 67523 | 154360594 | 0.02 | ||
| BL Cam | – | 392774261 | 0.24 | ||
| BS Aqr | 223338 | 9632550 | 0.17 | ||
| DE Lac | – | 119486942 | 0.27 | ||
| EH Lib | – | 157861023 | 0.20 | ||
| KZ Hya | 94033 | 188209486 | 0.19 | ||
| RY Lep | 38882 | 93441696 | 0.08 | ||
| SS Psc | – | 456857185 | 0.32 | ||
| SX Phe | 223065 | 224285325 | 0.20 | ||
| V1719 Cyg | 200925 | 290277380 | 0.30 | ||
| VX Hya | – | 289711518 | 0.30 | ||
| VZ Cnc | 73857 | 366632312 | 0.21 | ||
| XX Cyg | – | 233310793 | 0.29 | ||
| Star ID | Lognormal | ||||
|---|---|---|---|---|---|
| Name | HD | TIC | p-value | ||
| – | 129831 | 81003 | 0.35 | ||
| – | 77914 | 975071 | 0.29 | ||
| – | 112063 | 9591460 | 0.29 | ||
| RX Cae | 28837 | 7808834 | 0.19 | ||
| CV Phe | 13755 | 7245720 | 0.32 | ||
| – | 21295 | 12524129 | 0.38 | ||
| – | 79111 | 18658256 | 0.35 | ||
| – | 86312 | 26957587 | 0.35 | ||
| – | 181280 | 30624832 | 0.38 | ||
| – | 44930 | 34737955 | 0.40 | ||
| – | 185729 | 79659787 | 0.33 | ||
| – | 25674 | 34197596 | 0.24 | ||
| – | 113221 | 102192161 | 0.42 | ||
| – | 180349 | 121729614 | 0.43 | ||
| – | 216728 | 137796620 | 0.38 | ||
| – | 113211 | 253296458 | 0.43 | ||
| – | 31322 | 246902545 | 0.28 | ||
| – | 32433 | 348792358 | 0.38 | ||
| – | 56843 | 387235455 | 0.38 | ||
| – | 38597 | 100531058 | 0.25 | ||
| – | – | 448892817 | 0.29 | ||
| – | 99302 | 458689740 | 0.41 | ||
| V479 Tau | 24550 | 459908110 | 0.39 | ||
| V353 Vel | 93298 | 106886169 | 0.29 | ||
| – | 17341 | 122615966 | 0.29 | ||
| – | 183281 | 137341551 | 0.32 | ||
| – | 182895 | 159647185 | 0.36 | ||
| – | 46722 | 172193026 | 0.24 | ||
| – | 8043 | 196921106 | 0.38 | ||
| CC Gru | 214441 | 161172103 | 0.16 | ||
| – | 24572 | 242944780 | 0.31 | ||
| – | – | 274038922 | 0.29 | ||
| IN Dra | 191804 | 269697721 | 0.31 | ||
| GW Dra | – | 329153513 | 0.27 | ||
| CP Oct | 21190 | 348772511 | 0.27 | ||
| IO Dra | 193138 | 403114672 | 0.31 | ||
| – | 42005 | 408906554 | 0.33 | ||
| DE Cmi | 67852 | 452982723 | 0.28 | ||
| V435 Car | 44958 | 255548143 | 0.32 | ||
| V1790 Ori | 290799 | 11361473 | 0.33 | ||
References
- Acosta-Tripailao et al., (2021) Acosta-Tripailao, B., Pastén, D., and Moya, P. S. (2021). Applying the Horizontal Visibility Graph Method to Study Irreversibility of Electromagnetic Turbulence in Non-Thermal Plasmas. Entropy, 23(4):470.
- Aerts, (2021) Aerts, C. (2021). Probing the interior physics of stars through asteroseismology. Rev. Mod. Phys., 93:015001.
- Aerts et al., (2010) Aerts, C., Christensen-Dalsgaard, J., and Kurtz, D. (2010). Asteroseismology. Astronomy and Astrophysics Library. Springer Netherlands.
- Aerts et al., (2003) Aerts, C., Thoul, A., Daszynska, J., Scuflaire, R., Waelkens, C., Dupret, M.-A., Niemczura, E., and Noels, A. (2003). Asteroseismology of hd 129929: core overshooting and nonrigid rotation. Science, 300(5627):1926–1928.
- Alipour et al., (2022) Alipour, N., Safari, H., Verbeeck, C., Berghmans, D., Auchère, F., Chitta, L. P., Antolin, P., Barczynski, K., Buchlin, É., Aznar Cuadrado, R., Dolla, L., Georgoulis, M. K., Gissot, S., Harra, L., Katsiyannis, A. C., Long, D. M., Mandal, S., Parenti, S., Podladchikova, O., Petrova, E., Soubrié, É., Schühle, U., Schwanitz, C., Teriaca, L., West, M. J., and Zhukov, A. N. (2022). Automatic detection of small-scale EUV brightenings observed by the Solar Orbiter/EUI. Astronomy and Astrophysics, 663:A128.
- Antoci, (2014) Antoci, V. (2014). Stochastically excited oscillations in the upper main sequence. In Guzik, J. A., Chaplin, W. J., Handler, G., and Pigulski, A., editors, Precision Asteroseismology, volume 301 of IAU Symposium, pages 333–340.
- Antoci et al., (2019) Antoci, V., Cunha, M., Bowman, D., Murphy, S., Kurtz, D. W., Bedding, T., Borre, C., Christophe, S., Daszyńska-Daszkiewicz, J., Fox-Machado, L., et al. (2019). The first view of scuti and doradus stars with the tess mission. Monthly Notices of the Royal Astronomical Society, 490(3):4040–4059.
- Antoci et al., (2011) Antoci, V., Handler, G., Campante, T. L., Thygesen, A. O., Moya, A., Kallinger, T., Stello, D., Grigahcène, A., Kjeldsen, H., Bedding, T. R., Lüftinger, T., Christensen-Dalsgaard, J., Catanzaro, G., Frasca, A., De Cat, P., Uytterhoeven, K., Bruntt, H., Houdek, G., Kurtz, D. W., Lenz, P., Kaiser, A., van Cleve, J., Allen, C., and Clarke, B. D. (2011). The excitation of solar-like oscillations in a Sct star by efficient envelope convection. Nature, 477(7366):570–573.
- Audenaert et al., (2021) Audenaert, J., Kuszlewicz, J. S., Handberg, R., Tkachenko, A., Armstrong, D. J., Hon, M., Kgoadi, R., Lund, M. N., Bell, K. J., Bugnet, L., Bowman, D. M., Johnston, C., García, R. A., Stello, D., Molnár, L., Plachy, E., Buzasi, D., Aerts, C., and T’DA Collaboration (2021). TESS Data for Asteroseismology (T’DA) Stellar Variability Classification Pipeline: Setup and Application to the Kepler Q9 Data. Astronomical Journal, 162(5):209.
- Baglin, (2003) Baglin, A. (2003). COROT: A minisat for pionnier science, asteroseismology and planets finding. Advances in Space Research, 31(2):345–349.
- Baglin et al., (2009) Baglin, A., Auvergne, M., Barge, P., Deleuil, M., Michel, E., and CoRoT Exoplanet Science Team (2009). CoRoT: Description of the Mission and Early Results. In Pont, F., Sasselov, D., and Holman, M. J., editors, Transiting Planets, volume 253 of IAU Symposium, pages 71–81.
- Baiesi and Paczuski, (2004) Baiesi, M. and Paczuski, M. (2004). Scale-free networks of earthquakes and aftershocks. Phys. Rev. E, 69:066106.
- Balona and Dziembowski, (2011) Balona, L. and Dziembowski, W. (2011). Kepler observations of scuti stars. Monthly Notices of the Royal Astronomical Society, 417(1):591–601.
- Balona, (2016) Balona, L. A. (2016). Combination frequencies in high-amplitude Scuti stars. Monthly Notices of the Royal Astronomical Society, 459(1):1097–1103.
- Balona, (2018) Balona, L. A. (2018). Gaia luminosities of pulsating A-F stars in the Kepler field. Monthly Notices of the Royal Astronomical Society, 479(1):183–191.
- Balona et al., (2012) Balona, L. A., Lenz, P., Antoci, V., Bernabei, S., Catanzaro, G., Daszyńska-Daszkiewicz, J., di Criscienzo, M., Grigahcène, A., Handler, G., Kurtz, D. W., Marconi, M., Molenda-Żakowicz, J., Moya, A., Nemec, J. M., Pigulski, A., Pricopi, D., Ripepi, V., Smalley, B., Suárez, J. C., Suran, M., Hall, J. R., Kinemuchi, K., and Klaus, T. C. (2012). Kepler observations of the high-amplitude Scuti star V2367 Cyg. Monthly Notices of the Royal Astronomical Society, 419(4):3028–3038.
- Barabasi and Oltvai, (2004) Barabasi, A.-L. and Oltvai, Z. N. (2004). Network biology: understanding the cell’s functional organization. Nature reviews genetics, 5(2):101–113.
- Barac et al., (2022) Barac, N., Bedding, T. R., Murphy, S. J., and Hey, D. R. (2022). Revisiting bright Scuti stars and their period-luminosity relation with TESS and Gaia DR3. Monthly Notices of the Royal Astronomical Society.
- Barbara et al., (2022) Barbara, N. H., Bedding, T. R., Fulcher, B. D., Murphy, S. J., and Van Reeth, T. (2022). Classifying Kepler light curves for 12 000 A and F stars using supervised feature-based machine learning. Monthly Notices of the Royal Astronomical Society, 514(2):2793–2804.
- Barclay et al., (2018) Barclay, T., Pepper, J., and Quintana, E. V. (2018). A Revised Exoplanet Yield from the Transiting Exoplanet Survey Satellite (TESS). Astrophysical Journal, Supplement, 239(1):2.
- Basu and Chaplin, (2017) Basu, S. and Chaplin, W. (2017). Asteroseismic Data Analysis: Foundations and Techniques. Princeton Series in Modern Observational Astronomy. Princeton University Press.
- Bazarghan et al., (2008) Bazarghan, M., Safari, H., Innes, D. E., Karami, E., and Solanki, S. K. (2008). A nanoflare model for active region radiance: application of artificial neural networks. Astronomy and Astrophysics, 492(1):L13–L16.
- Bedding et al., (2020) Bedding, T. R., Murphy, S. J., Hey, D. R., Huber, D., Li, T., Smalley, B., Stello, D., White, T. R., Ball, W. H., Chaplin, W. J., Colman, I. L., Fuller, J., Gaidos, E., Harbeck, D. R., Hermes, J. J., Holdsworth, D. L., Li, G., Li, Y., Mann, A. W., Reese, D. R., Sekaran, S., Yu, J., Antoci, V., Bergmann, C., Brown, T. M., Howard, A. W., Ireland, M. J., Isaacson, H., Jenkins, J. M., Kjeldsen, H., McCully, C., Rabus, M., Rains, A. D., Ricker, G. R., Tinney, C. G., and Vanderspek, R. K. (2020). Very regular high-frequency pulsation modes in young intermediate-mass stars. Nature, 581(7807):147–151.
- (24) Bowman, D., Hermans, J., Daszyńska-Daszkiewicz, J., Holdsworth, D. L., Tkachenko, A., Murphy, S., Smalley, B., and Kurtz, D. W. (2021a). Kic 5950759: a high-amplitude sct star with amplitude and frequency modulation near the terminal age main sequence. Monthly Notices of the Royal Astronomical Society, 504(3):4039–4053.
- (25) Bowman, D., Hermans, J., Daszyńska-Daszkiewicz, J., Holdsworth, D. L., Tkachenko, A., Murphy, S., Smalley, B., and Kurtz, D. W. (2021b). Kic 5950759: a high-amplitude sct star with amplitude and frequency modulation near the terminal age main sequence. Monthly Notices of the Royal Astronomical Society, 504(3):4039–4053.
- Bowman, (2017) Bowman, D. M. (2017). Amplitude Modulation of Pulsation Modes in Delta Scuti Stars.
- Bowman and Kurtz, (2018) Bowman, D. M. and Kurtz, D. W. (2018). Characterizing the observational properties of Sct stars in the era of space photometry from the Kepler mission. Monthly Notices of the Royal Astronomical Society, 476:3169–3184.
- Bowman et al., (2016) Bowman, D. M., Kurtz, D. W., Breger, M., Murphy, S. J., and Holdsworth, D. L. (2016). Amplitude modulation in Sct stars: statistics from an ensemble study of Kepler targets. Monthly Notices of the Royal Astronomical Society, 460(2):1970–1989.
- Breger, (2000) Breger, M. (2000). Scuti stars (Review). In ASP Conf. Series, Vol. 210, volume 210 of ASP Conf. Series, page 3.
- Campante et al., (2016) Campante, T. L., Schofield, M., Kuszlewicz, J. S., Bouma, L., Chaplin, W. J., Huber, D., Christensen-Dalsgaard, J., Kjeldsen, H., Bossini, D., North, T. S. H., Appourchaux, T., Latham, D. W., Pepper, J., Ricker, G. R., Stassun, K. G., Vanderspek, R., and Winn, J. N. (2016). The Asteroseismic Potential of TESS: Exoplanet-host Stars. Astrophysical Journal, 830(2):138.
- Chang et al., (2013) Chang, S.-W., Protopapas, P., Kim, D.-W., and Byun, Y.-I. (2013). Statistical Properties of Galactic \delta Scuti Stars: Revisited. Astron. J., 145:132.
- Chaplin et al., (2009) Chaplin, W. J., Houdek, G., Karoff, C., Elsworth, Y., and New, R. (2009). Mode lifetimes of stellar oscillations. Implications for asteroseismology. Astronomy and Astrophysics, 500(2):L21–L24.
- Chaplin et al., (2020) Chaplin, W. J., Serenelli, A. M., Miglio, A., Morel, T., Mackereth, J. T., Vincenzo, F., Kjeldsen, H., Basu, S., Ball, W. H., Stokholm, A., et al. (2020). Age dating of an early Milky Way merger via asteroseismology of the naked-eye star Indi. Nature Astronomy, 4(4):382–389.
- Christensen-Dalsgaard, (2004) Christensen-Dalsgaard, J. (2004). An Overview of Helio- and Asteroseismology. In Danesy, D., editor, SOHO 14 Helio- and Asteroseismology: Towards a Golden Future, volume 559 of ESA Special Publication, page 1.
- Clauset et al., (2009) Clauset, A., Shalizi, C. R., and Newman, M. E. J. (2009). Power-Law Distributions in Empirical Data. SIAM Review, 51(4):661–703.
- Daei et al., (2017) Daei, F., Safari, H., and Dadashi, N. (2017). Complex Network for Solar Active Regions. Astrophysical Journal, 845(1):36.
- de Franciscis et al., (2018) de Franciscis, S., Pascual-Granado, J., Suárez, J. C., García Hernández, A., and Garrido, R. (2018). Fractal analysis applied to light curves of Scuti stars. Monthly Notices of the Royal Astronomical Society, 481(4):4637–4649.
- Farhang et al., (2018) Farhang, N., Safari, H., and Wheatland, M. S. (2018). Principle of Minimum Energy in Magnetic Reconnection in a Self-organized Critical Model for Solar Flares. Astrophysical Journal, 859(1):41.
- Farhang et al., (2022) Farhang, N., Shahbazi, F., and Safari, H. (2022). Do Cellular Automaton Avalanche Models Simulate the Quasi-periodic Pulsations of Solar Flares? Astrophysical Journal, 936(1):87.
- Feinstein et al., (2019) Feinstein, A. D., Montet, B. T., Foreman-Mackey, D., Bedell, M. E., Saunders, N., Bean, J. L., Christiansen, J. L., Hedges, C., Luger, R., Scolnic, D., and Cardoso, J. V. d. M. (2019). eleanor: An Open-source Tool for Extracting Light Curves from the TESS Full-frame Images. Publications of the ASP, 131(1003):094502.
- Gheibi et al., (2017) Gheibi, A., Safari, H., and Javaherian, M. (2017). The Solar Flare Complex Network. Astrophysical Journal, 847(2):115.
- Gilliland et al., (2010) Gilliland, R. L., Brown, T. M., Christensen-Dalsgaard, J., Kjeldsen, H., Aerts, C., Appourchaux, T., Basu, S., Bedding, T. R., Chaplin, W. J., Cunha, M. S., De Cat, P., De Ridder, J., Guzik, J. A., Handler, G., Kawaler, S., Kiss, L., Kolenberg, K., Kurtz, D. W., Metcalfe, T. S., Monteiro, M. J. P. F. G., Szabó, R., Arentoft, T., Balona, L., Debosscher, J., Elsworth, Y. P., Quirion, P.-O., Stello, D., Suárez, J. C., Borucki, W. J., Jenkins, J. M., Koch, D., Kondo, Y., Latham, D. W., Rowe, J. F., and Steffen, J. H. (2010). Kepler Asteroseismology Program: Introduction and First Results. Publications of the ASP, 122(888):131.
- Handler, (2013) Handler, G. (2013). Asteroseismology. In Oswalt, T. D. and Barstow, M. A., editors, Planets, Stars and Stellar Systems. Volume 4: Stellar Structure and Evolution, volume 4, page 207.
- Hasanzadeh et al., (2021) Hasanzadeh, A., Safari, H., and Ghasemi, H. (2021). Relations between the asteroseismic indices and stellar parameters of Scuti stars for two years of TESS mission. Monthly Notices of the Royal Astronomical Society, 505(1):1476–1484.
- Houdek et al., (1999) Houdek, G., Balmforth, N. J., Christensen-Dalsgaard, J., and Gough, D. O. (1999). Amplitudes of stochastically excited oscillations in main-sequence stars. Astronomy and Astrophysics, 351:582–596.
- Hubble, (1934) Hubble, E. (1934). The Distribution of Extra-Galactic Nebulae. Astrophysical Journal, 79:8.
- Jayasinghe et al., (2020) Jayasinghe, T., Stanek, K., Kochanek, C., Vallely, P., Shappee, B., Holoien, T. W., Thompson, T. A., Prieto, J., Pejcha, O., Fausnaugh, M., et al. (2020). The asas-sn catalogue of variable stars vi: an all-sky sample of scuti stars. Monthly Notices of the Royal Astronomical Society, 493(3):4186–4208.
- Kahraman Aliçavuş et al., (2017) Kahraman Aliçavuş, F., Niemczura, E., Polińska, M., Hełminiak, K. G., Lampens, P., Molenda-Żakowicz, J., Ukita, N., and Kambe, E. (2017). High-resolution spectroscopy and abundance analysis of Scuti stars near the Doradus instability strip. Monthly Notices of the Royal Astronomical Society, 470(4):4408–4420.
- Kirmizitas et al., (2022) Kirmizitas, O., Cavus, S., et al. (2022). Discovery of new delta scuti stars. arXiv preprint arXiv:2208.11915.
- Kolmogorov, (1962) Kolmogorov, A. N. (1962). A refinement of previous hypotheses concerning the local structure of turbulence in a viscous incompressible fluid at high Reynolds number. Journal of Fluid Mechanics, 13:82–85.
- Kurtz, (2022) Kurtz, D. (2022). Asteroseismology across the HR diagram. In Annual Conference and General Assembly of the African Astronomical Society, page 1.
- Latora and Marchiori, (2001) Latora, V. and Marchiori, M. (2001). Efficient behavior of small-world networks. Phys. Rev. Lett., 87:198701.
- Lightkurve Collaboration et al., (2018) Lightkurve Collaboration, Cardoso, J. V. d. M., Hedges, C., Gully-Santiago, M., Saunders, N., Cody, A. M., Barclay, T., Hall, O., Sagear, S., Turtelboom, E., Zhang, J., Tzanidakis, A., Mighell, K., Coughlin, J., Bell, K., Berta-Thompson, Z., Williams, P., Dotson, J., and Barentsen, G. (2018). Lightkurve: Kepler and TESS time series analysis in Python. Astrophysics Source Code Library, record ascl:1812.013.
- Lotfi et al., (2020) Lotfi, N., Javaherian, M., Kaki, B., Darooneh, A. H., and Safari, H. (2020). Ultraviolet solar flare signatures in the framework of complex network. Chaos, 30(4):043124.
- Luque et al., (2009) Luque, B., Lacasa, L., Ballesteros, F., and Luque, J. (2009). Horizontal visibility graphs: Exact results for random time series. Physical Review E, 80(4):046103.
- Lv et al., (2022) Lv, C., Esamdin, A., Pascual-Granado, J., Hernández, A. G., and Hasanzadeh, A. (2022). Asteroseismology of a Double-mode High-amplitude Scuti Star TIC 448892817. Astronomical Journal, 164(5):218.
- Mathias and Gopal, (2001) Mathias, N. and Gopal, V. (2001). Small worlds: How and why. Phys. Rev. E, 63:021117.
- McBreen et al., (1994) McBreen, B., Hurley, K. J., Long, R., and Metcalfe, L. (1994). Lognormal distributions in gamma-ray bursts and cosmic lightning. Monthly Notices of the Royal Astronomical Society, 271:662–666.
- McNamara, (2011) McNamara, D. H. (2011). Delta Scuti, SX Phoenicis, and RR Lyrae Stars in Galaxies and Globular Clusters. Astronomical Journal, 142(4):110.
- McNamara et al., (2007) McNamara, D. H., Clementini, G., and Marconi, M. (2007). A Scuti Distance to the Large Magellanic Cloud. Astronomical Journal, 133(6):2752–2763.
- Michel et al., (2017) Michel, E., Dupret, M.-A., Reese, D., Ouazzani, R.-M., Debosscher, J., Hernández, A. G., Belkacem, K., Samadi, R., Salmon, S., Suarez, J. C., and Forteza, S. B. (2017). What CoRoT tells us about Scuti stars. Existence of a regular pattern and seismic indices to characterize stars. In EPJWC, volume 160 of EPJWC, page 03001.
- Miller and Scalo, (1979) Miller, G. E. and Scalo, J. M. (1979). The Initial Mass Function and Stellar Birthrate in the Solar Neighborhood. Astrophysical Journal, Supplement, 41:513.
- Mitzenmacher, (2004) Mitzenmacher, M. (2004). A brief history of generative models for power law and lognormal distributions. Internet mathematics, 1(2):226–251.
- Mohammadi et al., (2021) Mohammadi, Z., Alipour, N., Safari, H., and Zamani, F. (2021). Complex Network for Solar Protons and Correlations With Flares. Journal of Geophysical Research (Space Physics), 126(7):e28868.
- Moradkhani et al., (2015) Moradkhani, M., Amiri, A., Javaherian, M., and Safari, H. (2015). A hybrid algorithm for feature subset selection in high-dimensional datasets using fica and iwssr algorithm. Applied Soft Computing, 35:123–135.
- Mouri et al., (2009) Mouri, H., Hori, A., and Takaoka, M. (2009). Large-scale lognormal fluctuations in turbulence velocity fields. Physics of Fluids, 21(6):065107–065107–8.
- Murphy et al., (2020) Murphy, S. J., Saio, H., Takada-Hidai, M., Kurtz, D. W., Shibahashi, H., Takata, M., and Hey, D. R. (2020). On the first sct–roap hybrid pulsator and the stability of p and g modes in chemically peculiar a/f stars. Monthly Notices of the Royal Astronomical Society, 498(3):4272–4286.
- Najafi et al., (2020) Najafi, A., Darooneh, A. H., Gheibi, A., and Farhang, N. (2020). Solar Flare Modified Complex Network. Astrophysical Journal, 894(1):66.
- Newman, (2010) Newman, M. (2010). Networks: An Introduction. OUP Oxford.
- Newman, (2003) Newman, M. E. (2003). The structure and function of complex networks. SIAM review, 45(2):167–256.
- Niemczura et al., (2015) Niemczura, E., Murphy, S., Smalley, B., Uytterhoeven, K., Pigulski, A., Lehmann, H., Bowman, D., Catanzaro, G., van Aarle, E., Bloemen, S., et al. (2015). Spectroscopic survey of kepler stars. i. hermes/mercator observations of a-and f-type stars. Monthly Notices of the Royal Astronomical Society, 450(3):2764–2783.
- Pakštienė et al., (2018) Pakštienė, E., Janulis, R., Tautvaišienė, G., Drazdauskas, A., Klebonas, L., Mikolaitis, Š., Minkevičiūtė, R., and Bagdonas, V. (2018). Variability Analysis of Scuti Candidate Stars. Publications of the ASP, 130(990):084201.
- Pamyatnykh, (2000) Pamyatnykh, A. A. (2000). Pulsational Instability Domain of Scuti Variables. In Breger, M. and Montgomery, M., editors, Delta Scuti and Related Stars, volume 210 of Astronomical Society of the Pacific Conference Series, page 215.
- Pastén et al., (2018) Pastén, D., Czechowski, Z., and Toledo, B. (2018). Time series analysis in earthquake complex networks. Chaos, 28(8):083128.
- Pauluhn and Solanki, (2007) Pauluhn, A. and Solanki, S. K. (2007). A nanoflare model of quiet Sun EUV emission. Astronomy and Astrophysics, 462(1):311–322.
- Poretti, (2003) Poretti, E. (2003). Asteroseismology of HADS stars: V974 Oph, a radial pulsator flavoured by nonradial components. Astronomy and Astrophysics, 409:1031–1035.
- Qian et al., (2018) Qian, S.-B., Li, L.-J., He, J.-J., Zhang, J., Zhu, L.-Y., and Han, Z.-T. (2018). LAMOST views Scuti pulsating stars. Monthly Notices of the Royal Astronomical Society, 475:478–491.
- Ricker et al., (2015) Ricker, G. R., Winn, J. N., Vanderspek, R., Latham, D. W., Bakos, G. Á., Bean, J. L., Berta-Thompson, Z. K., Brown, T. M., Buchhave, L., Butler, N. R., Butler, R. P., Chaplin, W. J., Charbonneau, D., Christensen-Dalsgaard, J., Clampin, M., Deming, D., Doty, J., De Lee, N., Dressing, C., Dunham, E. W., Endl, M., Fressin, F., Ge, J., Henning, T., Holman, M. J., Howard, A. W., Ida, S., Jenkins, J. M., Jernigan, G., Johnson, J. A., Kaltenegger, L., Kawai, N., Kjeldsen, H., Laughlin, G., Levine, A. M., Lin, D., Lissauer, J. J., MacQueen, P., Marcy, G., McCullough, P. R., Morton, T. D., Narita, N., Paegert, M., Palle, E., Pepe, F., Pepper, J., Quirrenbach, A., Rinehart, S. A., Sasselov, D., Sato, B., Seager, S., Sozzetti, A., Stassun, K. G., Sullivan, P., Szentgyorgyi, A., Torres, G., Udry, S., and Villasenor, J. (2015). Transiting Exoplanet Survey Satellite (TESS). Journal of Astronomical Telescopes, Instruments, and Systems, 1:014003.
- Ruocco et al., (2017) Ruocco, G., Daraio, C., Folli, V., and Leonetti, M. (2017). Bibliometric indicators: the origin of their log-normal distribution and why they are not a reliable proxy for an individual scholar’s talent. Palgrave Communications, 3(1):1–8.
- Samadi et al., (2002) Samadi, R., Goupil, M. J., and Houdek, G. (2002). Solar-like oscillations in delta Scuti stars. Astronomy and Astrophysics, 395:563–571.
- Souma et al., (2003) Souma, W., Fujiwara, Y., and Aoyama, H. (2003). Complex networks and economics. Physica A Statistical Mechanics and its Applications, 324(1):396–401.
- Stassun et al., (2018) Stassun, K. G., Oelkers, R. J., Pepper, J., Paegert, M., De Lee, N., Torres, G., Latham, D. W., Charpinet, S., Dressing, C. D., Huber, D., Kane, S. R., Lépine, S., Mann, A., Muirhead, P. S., Rojas-Ayala, B., Silvotti, R., Fleming, S. W., Levine, A., and Plavchan, P. (2018). The TESS Input Catalog and Candidate Target List. Astronomical Journal, 156(3):102.
- Sullivan et al., (2015) Sullivan, P. W., Winn, J. N., Berta-Thompson, Z. K., Charbonneau, D., Deming, D., Dressing, C. D., Latham, D. W., Levine, A. M., McCullough, P. R., Morton, T., Ricker, G. R., Vanderspek, R., and Woods, D. (2015). The Transiting Exoplanet Survey Satellite: Simulations of Planet Detections and Astrophysical False Positives. Astrophysical Journal, 809(1):77.
- Tajfirouze and Safari, (2012) Tajfirouze, E. and Safari, H. (2012). Can a Nanoflare Model of Extreme-ultraviolet Irradiances Describe the Heating of the Solar Corona? Astrophysical Journal, 744(2):113.
- Taran et al., (2022) Taran, S., Khodakarami, E., and Safari, H. (2022). Complex network view to solar flare asymmetric activity. Advances in Space Research.
- Tokovinin, (2014) Tokovinin, A. (2014). From binaries to multiples. ii. hierarchical multiplicity of f and g dwarfs. The Astronomical Journal, 147(4):87.
- Uytterhoeven et al., (2011) Uytterhoeven, K., Moya, A., Grigahcène, A., Guzik, J., Gutiérrez-Soto, J., Smalley, B., Handler, G., Balona, L., Niemczura, E., Machado, L. F., et al. (2011). The kepler characterization of the variability among a-and f-type stars-i. general overview. Astronomy & Astrophysics, 534:A125.
- Vogel et al., (2020) Vogel, E. E., Brevis, F. G., Pastén, D., Muñoz, V., Miranda, R. A., and Chian, A. C.-L. (2020). Measuring the seismic risk along the nazca–south american subduction front: Shannon entropy and mutability. Natural Hazards and Earth System Sciences, 20(11):2943–2960.
- Watts and Strogatz, (1998) Watts, D. J. and Strogatz, S. H. (1998). Collective dynamics of ‘small-world’ networks. Nature, 393:440 – 442.
- Yang et al., (2022) Yang, T.-Z., Zuo, Z.-Y., Sun, X.-Y., Tang, R.-X., and Esamdin, A. (2022). KIC 2857323: A Double-mode High-amplitude Scuti Star with Amplitude Decline of the First Overtone Mode. Astrophysical Journal, 936(1):48.
- Ziaali et al., (2019) Ziaali, E., Bedding, T. R., Murphy, S. J., Van Reeth, T., and Hey, D. R. (2019). The period-luminosity relation for Scuti stars using Gaia DR2 parallaxes. Monthly Notices of the Royal Astronomical Society, 486(3):4348–4353.