Modeling ionic transport and disorder in crystalline electrodes using percolation theory
Abstract
Solid ionic conductors are essential components of batteries and fuel cells. In many cases, ionic conduction through crystalline materials with substitutional disorder can be modeled with atomic-scale lattice model percolation simulations. The ionic percolation theory reviewed in this chapter describes the percolation behavior of diffusion pathways, identifies the fraction of lattice sites that contributes to ionic conduction, and quantifies the tortuosity of diffusion networks. These quantities can be related to the bulk diffusivity and capacity of intercalation battery electrodes. We discuss applications to lithium-ion battery cathodes in the disordered rocksalt and related crystal structures, showing how the diffusion pathways and their tortuosity vary with the Li content short-range order. All examples are based on the free and open-source dribble simulation software.
Introduction
Crystalline ionic conductors are essential for a variety of critical technologies: Lithium-ion (and other alkali ion) batteries require electrode materials that are mixed ionic and electronic conductors,1 and the ionic conductivity strongly affects the capacity and the rate capability of the battery.2 Ceramic ionic conductors are used as solid electrolyte in solid-state batteries, which are promising candidates for the next generation of Li-ion batteries,3; 4 and developing stable solid electrolytes with high ionic conductivity is one of the key challenges. The solid electrolyte materials in solid-oxide fuel and electrolyzer cells (SOCs) are oxide-ion (\ceO^2-), proton (\ceH+), or hydride (\ceH-) ion conductors,5 and the operation temperature required by SOCs is, to a large extent, determined by the ionic conductivity of the solid electrolyte.6 Ionic conductors have also been proposed as components of memristors,7 non-linear electrical components that could provide new circuit functions.
Atomic-scale simulations have been instrumental in obtaining mechanistic insight into ionic diffusion on the atomic scale.8; 2 However, since such simulations rely on idealized structure models with small periodic units, they cannot provide information about the nature of extended diffusion pathways in materials with substitutional disorder, a common phenomenon in ionic conductors. Here we discuss how lattice model simulations can complement atomistic simulations and experimental characterization to identify diffusion pathways in disordered crystalline ionic conductors.
In the next section, we will briefly review select previous work on simulating ionic percolation in crystalline materials. This is followed by a description of the ionic percolation methodology and its implementation in the free and open-source Dribble software. We will then discuss examples of applications in the area of battery materials before considering the strengths and limitations of the methodology in a final discussion section.
I Background
I.1 Ionic percolation in crystalline solids
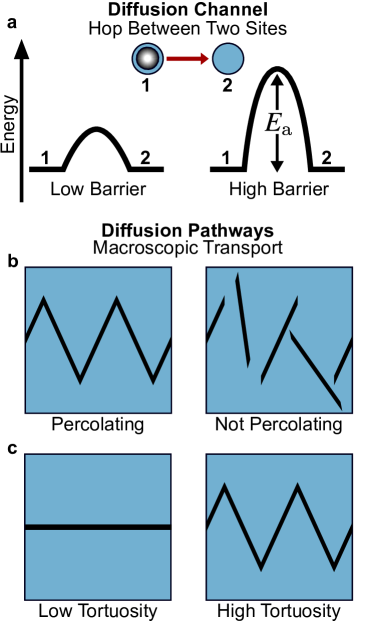
A crystalline ionic conductor is a solid material through which a specific type of ion can diffuse over macroscopic length scales. For example, Li ions in a Li-ion battery (LIB) diffuse through the bulk of the electrode particles during the charging and discharging of the battery. Two requirements have to be met so that macroscopic ionic transport is possible in a given material:
-
(i)
There have to exist diffusion channels that are active at operation conditions, i.e., at room temperature and under realistic applied potentials in the case of batteries (Fig. 1a), and
-
(ii)
These channels need to be interconnected in percolating diffusion pathways that span the material (Fig. 1b).
In this picture, a diffusion channel is defined as the minimum-energy pathway connecting two lattice sites. Whether a diffusion channel is active depends on the activation energy that needs to be overcome when an ion migrates through the channel. For given conditions (temperature, chemical potentials, electric field, etc.), the activation energy determines the rate with which ions hop from one of the lattice sites to the other. The magnitude of an acceptable activation energy depends on the application. For example, an activation barrier of 300 meV is typical for Li diffusion in LIB cathodes.9 The activation energy for \ceO^2- hopping in SOCs is much greater, which is the reason why SOCs need to be operated at high temperatures. First principles calculations are routinely used for predicting the activation energy associated with a given diffusion channel.10; 11
Even when active diffusion channels are present, a material might still not be an ionic conductor if the channels do not form a network across the entire material. The conditions for the formation of such percolating diffusion pathways is the focus of the present chapter. In addition to percolation, we will also consider the tortuosity of diffusion pathways which is a measure of how direct the pathways are (Fig. 1c).
In an ordered crystal structure it is often obvious from visual inspection if the active diffusion channels form percolating diffusion pathways. For example, a two-dimensional network of percolating Li diffusion pathways is available in layered \ceLiCoO212 and graphite,13 and one-dimensional pathways exist in \ceLiFePO4.14; 15 A negative example is \ceNa3GaV(PO4)2F3, in which fast isolated Na diffusion channels exist but do not form percolating pathways.16
However, many crystalline ionic conductors exhibit substitutional disorder, i.e., sites that can be occupied by different atomic species. In such disordered materials, the percolation properties might no longer be obvious, since the activation energy of a diffusion channel can depend sensitively on the neighboring atomic species. Important examples of such disordered ion conductors are cation-disordered cathode materials for LIBs17; 18; 19; 20 and common solid electrolytes for solid oxide fuel and electrolyzer cells (SOCs), such as yttria-stabilized zirconia21 and doped ceria.22 Note that long-range disorder does not equal a fully random distribution on shorter length scales, and short-range order can significantly affect ion transport.23
I.2 Diffusion mechanism and diffusion channels
In the following, we consider rocksalt-type LIB cathodes as a concrete example of a class of crystalline ionic conductors with substitutional disorder. Nevertheless, the discussed concepts are transferable to other crystal structures and materials.
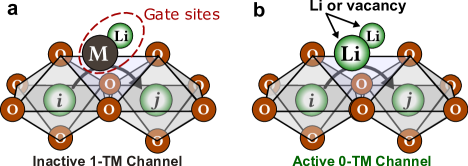
Li diffusion in rocksalt-type Li transition-metal (TM) oxides has been extensively studied with experiments and simulations, as reviewed by Van der Ven et al.2 In these materials, the cation (Li and TM) and anion (oxygen) sites are on separate face-centered cubic sublattices. The cation sites are octahedral, i.e., each site is coordinated by six oxygen ions, and Li diffusion between two octahedral (o) sites takes place via a tetrahedral (t) activated state in the presence of a second vacancy (o–t–o di-vacancy mechanism).12; 2 The activation barrier for Li diffusion depends on the species on the two gate sites that coordinate the tetrahedral site along the o–t–o diffusion channel (Fig. 2), and because of electrostatic repulsion, the barrier is generally greater if one or both of the gate sites are occupied by TM ions (1-TM and 2-TM channels) and lower for Li ions or vacancies (0-TM channels).2; 17 In ordered crystal structures such as the layered \ceLiCoO2 structure the diffusion channels are within the Li layer and are typically larger than in cation-disordered structures.17 As a consequence, 1-TM diffusion channels are typically active in the layered structure but are inactive in cation-disordered structures.17 Therefore, 0-TM channels are the most important diffusion channel in cation-disordered rocksalt-type materials, which can be good Li-ion conductors if their 0-TM channels form percolating diffusion pathways.
II Method
II.1 Lattice percolation theory
Percolation theory, and specifically the percolation of sites and bonds on lattices, is a standard problem in statistical and computational physics,24; 25 and has a long history in the simulation of transport phenomena.26 The general site percolation problem is as follows: Given an infinite lattice with randomly vacant or occupied sites, what concentration of occupied sites is required so that nearest-neighbor bonds between occupied sites span infinitely across the lattice, i.e., become percolating. On an infinite lattice, there is exactly one critical concentration of occupied sites , the percolation threshold, below which the system is never percolating and above which it is always percolating. The percolation probability is thus a step function
| (1) |
For many regular two-dimensional lattices the percolation threshold can be calculated analytically, but for three-dimensional lattices numerical Monte Carlo (MC) simulations are needed to obtain approximate values.27; 25 Practical simulations employ finite lattices or periodic boundary conditions, resulting in finite-size errors that lead to deviations from the ideal case. For finite lattices, the percolation probability is a sigmoidal function that approaches the step function of equation (1) with increasing lattice (or unit cell) dimension. The percolation threshold can be approximated by the inflection point of the sigmoidal function but needs to be converged with respect to the cell size.
II.2 Application of lattice percolation theory to ionic transport
Ionic percolation simulations have been instrumental in understanding under which conditions cation-disordered LIB cathodes become Li conducting and allow for the reversible extraction of large Li capacities.17; 28; 23 Percolation simulations have been used to elucidate the impact of fluorine doping on Li-ion conduction,29 and they have led to the discovery of highly energy-dense partially disordered spinel LIB cathodes.30 Apart from applications to LIBs, the method has also been used to investigate the effect of inversion on Mg-ion conduction in spinel-type materials31 and Na-ion conduction in Na-ion battery cathodes.32
The formation of percolating diffusion pathways in ion conductors can be described by site percolation if the lattice decoration uniquely determines which neighboring sites are connected by active diffusion channels. The precise relationship between site occupancies and active/inactive diffusion channels is generally more complex than the nearest-neighbor criterion of the conventional site percolation problem of section II.1. Defining criteria for active diffusion channels requires prior knowledge of the relationship between lattice occupancies and diffusion barriers, such as the 0-TM channels in cation-disordered rocksalts discussed above. Criteria for active diffusion channels can often be defined in terms of bond or site rules.
Bond rules are a set of criteria that determine if two neighboring sites and are connected by an active diffusion channel. In the simplest case, such bond rules can depend only on the common neighboring sites of sites and . For example, a 0-TM channel exists between sites and if (i) at least two sites and that are nearest neighbors of both and are also Li sites; and (ii) and are themselves nearest neighbors. This definition identifies two gate sites (Fig. 2) and ensures that they are both Li sites.
Site rules define neighbor shell decorations for which a site of a specific sublattice may become part of a diffusion pathway. For example, 0-TM channels can be defined in terms of a site rule by explicitly including the sublattice of the tetrahedral transition states and requiring that only those tetrahedral sites that are surrounded by 4 octahedral Li sites are considered. For rocksalt-type structures, this site rule definition might appear less intuitive than the above bond rule, since it involves two types of sites: tetrahedral and octahedral sites. However, it is the more natural framework for partially inverted spinel structures, where vacancies have to be explicitly considered.31 Note that the octahedral cation sites of the rocksalt structure and the tetrahedral intermediates together define the fluorite (\ceCaF2) structure.
II.3 Detecting percolation in simulations
The most fundamental question to address with percolation theory is whether a given crystal structure with integer site occupancies (i.e., without disorder) is percolating. For large unit cells and complex atomic ordering, for example if atomic configurations were themselves obtained from MC simulations,33 it might not be immediately obvious if percolating diffusion pathways exist.
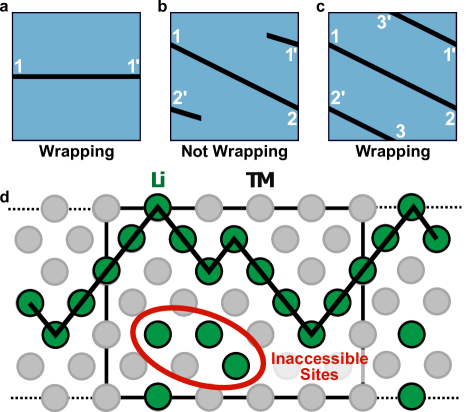
On a finite lattice with periodic boundary conditions, percolation is equivalent to periodic wrapping: If a diffusion pathway exists that connects one site in the structure with any periodic image of the same site, then the structure is percolating (Fig. 3a-c). Note that a periodically wrapping diffusion pathway can cross the boundaries of the crystal unit cell multiple times (Fig. 3c).
Efficient algorithms to detect periodic wrapping have previously been developed, such as the method by Newman and Ziff,27 which incrementally grows interconnected domains of sites and detects when a domain connects to a periodic image of an already connected site.
II.4 Accessible sites
Even though a given structure is percolating, not all sites of the diffusing species are necessarily connected to a percolating diffusion pathway (Figure 3d). This means, there can exist isolated domains of sites in a percolating structure that are occupied by the diffusing species but do not contribute to ionic conduction. We define the fraction of accessible sites as the number of sites that are connected to percolating diffusion pathways divided by the total number of sites of the diffusing species ()
| (2) |
The fraction of accessible sites is important, for example, in LIB cathodes where the amount of extractable Li determines the capacity, and inaccessible sites thus do not contribute to the practical capacity of the cathode and are essentially unused material.28 The capacity is either given relative to the composition-specific mass or volume of the material or it is normalized to a formula unit. For example, the capacity in terms of Li atoms per \ceLi_xM_2-xO2 formula unit is then .
II.5 Tortuosity
Two percolating structures with the same amount of accessible sites are not necessarily equally good ionic conductors. Another factor that contributes to the overall ionic conductivity is the tortuosity of the diffusion pathways, i.e., the length of the diffusion pathway relative to the net distance that an ion travels
| (3) |
The tortuosity thus corresponds to a detour that the diffusing ion takes, and one can expect that a high tortuosity is detrimental for ionic conduction. For example, in the case of mass transport in porous media, the tortuosity of the medium gives rise to a scaling factor of the diffusion constant which has been extensively studied.34 The effect of tortuosity on ionic transport in composite materials such as the electrodes in LIBs35 and SOCs36 is also an important performance parameter.
In lattice model percolation simulations, the tortuosity of a given structure can be determined by calculating the shortest diffusion pathway between each site in a percolating domain and all of its periodic images that are part of the same domain. The length of the shortest pathway divided by the distance between site and its periodic image is then the tortuosity for site . We define the tortuosity of a structure for ionic conductivity as the mean tortuosity of all sites
| (4) |
II.6 Lattice percolation simulations with Dribble
The free and open-source simulation software Dribble (https://github.com/atomisticnet/dribble) implements an MC method similar to that by Newman and Ziff27 for the calculation of all of the quantities discussed above, the percolation threshold, the fraction of accessible sites, and the ionic tortuosity.
Apart from analyzing static structures, the response of the percolation properties to composition changes and/or to changes in the degree of substitutional disorder is often of interest. For example, 0-TM channels are a local lithium-rich environment, and therefore their concentration increases with the Li content, i.e., we can identify a percolation threshold for 0-TM channels in terms of the Li content. For fully Li/M disordered rocksalt-type structures with composition \ceLi_xM_1-xO2, this percolation threshold lies at around .17 Remnants of an ordered structure, such as short-range order similar to the layered or spinel structure, additionally alter the percolation threshold.28; 23
Dribble therefore also provides MC algorithms for the scanning of compositions and for the sampling of disordered structures. Substitutional disorder is simulated by repeating the analysis for a user-specified number of randomly generated lattice decorations. Here, the composition of each sublattice can be defined independently. For example, in a fully disordered \ce(Li, M)2O2, each cation site is occupied by either Li or M with equal probability. To scan a composition range \ceM2O2–\ceLi2O2, the simulation is initialized with composition \ceM2O2 followed by the iterative flipping of randomly selected M sites to Li until the composition \ceLi2O2 has been reached. The convergence of the wrapping probability with MC sampling can be accelerated by evaluating the convolution of the observed wrapping probability with a binomial distribution.27
Random sampling becomes more accurate with increasing size of the simulation cell, and care has to be taken to converge computed quantities with respect to the cell size. Owing to finite-size effects, as mentioned above, the periodic wrapping probability resembles a sigmoidal function for small cell sizes and approaches the ideal step function of equation (1) with increasing cell size.25 On the other hand, the computational cost also increases with the cell size so that the smallest cell should be determined that gives the desired precision.
All calculations of percolation thresholds, wrapping probabilities, and accessible sites reported in this chapter were done over 500 MC steps. Tortuosity calculations generally were done for 50 MC steps because of their greater computational cost.
III Examples of lattice percolation simulations
To illustrate the concepts outlined above, this section discusses two concrete LIB cathode materials: fully disordered rocksalts \ce(Li_x, M_1-x)2O2 and orthorhombic \ceLiMnO2 with varying degree of Li Mn mixing. For both systems, 0-TM channels were taken to be the only active diffusion channels, and the bond rule definition described in section II.2 was used for channel detection.
III.1 Properties of fully disordered rocksalts
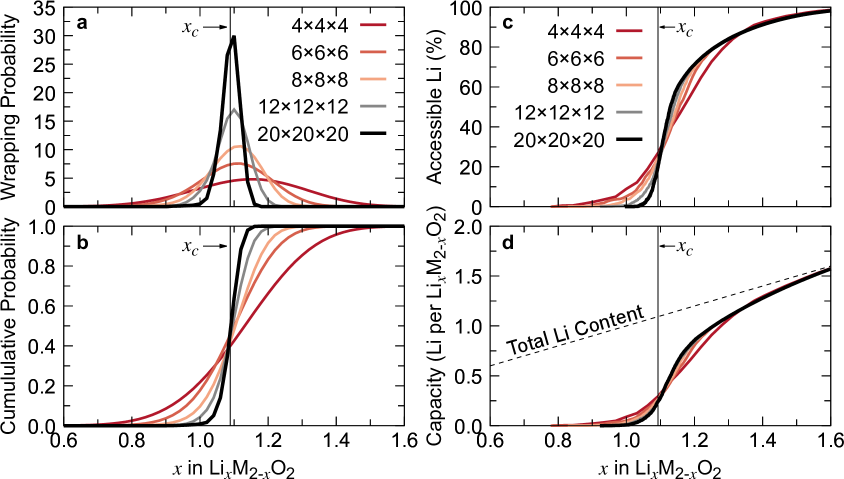
Fully disordered crystal structures are most similar to the conventional lattice percolation problem of statistical physics. The first system that we consider here is therefore the ideal \ce(Li, M)_2O2 disordered rocksalt structure in which \ceLi and \ceM atoms share the same sublattice and are statistically distributed. Figure 4 shows the convergence of the periodic wrapping probability and accessible sites in a rocksalt structure with the size of the simulations cell. The periodic wrapping probability plotted in Figure 4a is the probability distribution function of the lowest Li content for which periodic wrapping was detected in the MC simulation. This quantity is determined in MC simulations by initially decorating the cation sublattice only with M atoms and incrementally increasing the Li content until periodically wrapping diffusion pathways are observed.
As discussed in section II.1, the percolation probability is a step function for an infinitely extended lattice. The probability of the lowest percolating concentration thus is a (Dirac) delta function centered at the percolation threshold
| (5) |
As seen in Figure 4a, this delta function is broadened to continuous distributions for finite cell sizes. Importantly, the distributions are not exactly centered around the true percolation threshold , and using the peak of a distribution as an approximation for can lead to a substantial overestimation of the percolation threshold for small cell sizes.
Figure 4b shows the corresponding cumulative distribution function of the periodic wrapping probability (i.e., the integral of Figure 4b), which approaches the percolation probability of equation (1) with increasing cell size. The percolation threshold is a Li content of , i.e., around 10% Li excess compared to the stoichiometric \ceLiMO2 composition, which is consistent with our previous report.28
As seen in Fig. 4c, the fraction of accessible sites as function of the Li content also needs to be converged with respect to the simulation cell. Although, it converges rapidly for Li contents well above the percolation threshold, convergence near requires large cell sizes. Per definition, on an ideal infinite lattice no sites are accessible below the percolation threshold, and thus the predicted amount of accessible sites for is a finite-size artifact that must vanish for increasingly larger supercells. As discussed in section II.4, the fraction of accessible Li sites can be converted into the expected capacity of an LIB cathode and is therefore a key quantity for composition optimization (Fig. 4d).
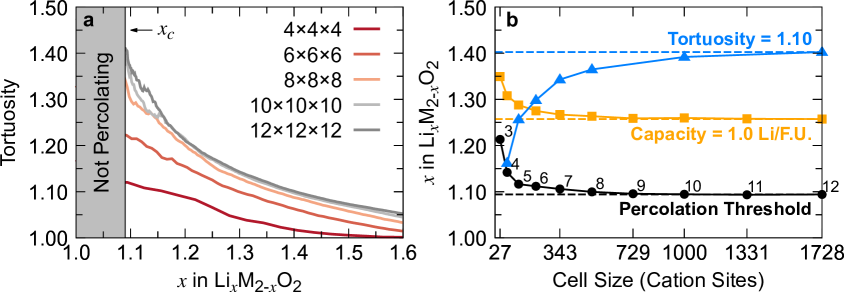
Figure 5a shows the tortuosity of 0-TM diffusion pathways in increasingly larger cells of the disordered rocksalt structure. The tortuosity can only be evaluated for percolating structures, so that only Li contents above the percolation threshold are meaningful. Note that tortuosity calculations using the definition of of equation (4) are computationally demanding for large cell sizes, as they involve the calculation of the length of all possible percolating diffusion pathways (see section II.5). As seen in the figure, the tortuosity of the cell is essentially converged, so that no data for cell sizes beyond the supercell (1 728 sites) are shown. Right at the percolation threshold , the tortuosity is greater than , i.e., 0-TM diffusion pathways are on average 40% longer than the distance that they span. Realistic compositions for high-capacity cathodes with still have an average tortuosity of 20%.
The cell-size convergence tests for the percolation threshold, a realistic target capacity, and a realistic target tortuosity are summarized in Figure 5b. As seen in the figure, even though the wrapping probability and accessible Li sites converge slowly near the percolation threshold, the threshold and the capacity are already converged to within in terms of the Li content for an supercell. Since, the 0-TM capacity is a lower bound of the capacity and not an absolute prediction, a greater precision should not be needed. Because of the slow decay of the tortuosity with the Li content, the error in the Li content for a given tortuosity value is slightly higher () but probably also within an acceptable tolerance. Thus, for practical applications cell sizes with around 500 sites ( cation sites) yield quantitative results.
III.2 Li percolation in orthorhombic \ceLiMnO2
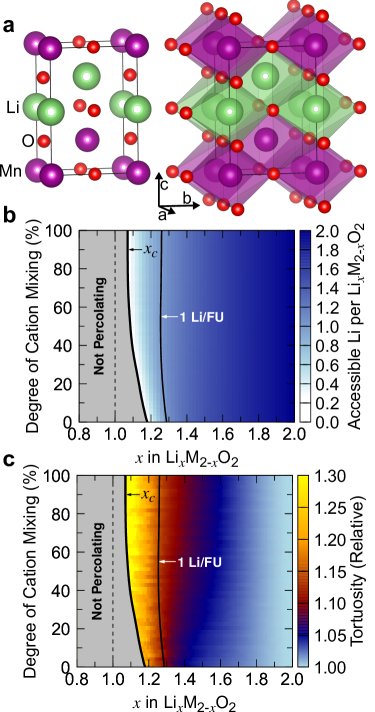
Statistical (random) disorder is an idealization, and in real materials some degree of cation ordering is likely to be present. It is therefore useful to inspect how the percolation behavior changes when an ordered crystal structure gradually becomes disordered, e.g., by mixing the Li and M sublattices in the case of LIB cathode materials. Such percolation maps for the gradual disordering of the layered (\ceα-NaCoO2) structure, the low-temperature \ceLi2Co2O4 spinel structure, and the \ceγ-LiFeO2 structure have previously been reported.28 Motivated by the recent interest in Mn-based disordered rocksalts and spinels,18; 20; 30 we consider here the orthorhombic \ceLiMnO2 (\ceo-LiMnO2) crystal structure (Fig. 6a) which is the thermodynamic ground-state crystal structure of \ceLiMnO2 at ambient conditions.39 Cation-disordered LIB cathode materials can exhibit short-range order that is similar to the cation ordering in related ordered oxides,23 so compositions containing a significant amount of \ceMn(III) might exhibit short-range order that is related to the cation ordering in \ceo-LiMnO2.
Figure 6b depicts a map of the 0-TM capacity as function of the Li content and the degree of disorder ranging from the ideal ordered \ceo-LiMnO2 structure (0% cation mixing) to the fully random rocksalt structure (100% cation mixing). As seen in the figure, the 0-TM percolation threshold decreases with cation mixing from for \ceo-LiMnO2 to the rocksalt value of . In other words, around 20% Li excess are needed for the \ceo-LiMnO2 structure to become 0-TM percolating. On the other hand, the 0-TM capacity of compositions beyond % Li excess does not vary strongly with the degree of cation mixing.
The color-code in the map shown in Fig. 6c indicates the expected tortuosity for the same configuration and composition space. Note that the tortuosity increases with the degree of cation mixing. Hence, while cation mixing lowers the percolation threshold in the case of \ceo-LiMnO2 it increases the tortuosity, and a degree of \ceo-LiMnO2-like short-range order might therefore be beneficial for the rate capability of the cathode material.
IV Discussion
In this chapter, we reviewed the requirements for ionic conduction in crystalline solids with substitutional disorder and introduced a lattice model methodology for the simulation of properties related to the ionic percolation behavior. We furthermore introduced definitions for the percolation threshold, the fraction of accessible sites, and the tortuosity for ionic conduction.
We applied the methodology to the example of Li-ion conduction in fully and partially cation disordered rocksalt-type cathodes in which Li transport is facilitated by fast 0-TM diffusion channels. In the context of LIB cathode materials, the percolation threshold determines whether a given composition is an ionic conductor, the fraction of accessible sites can be converted to expected capacities, and the tortuosity can be understood as a scaling factor for the diffusivity and thus affects the ionic conductivity (rate capability). However, the methodology is general and can be applied to any kind of crystal structure and is agnostic of the diffusing species.
Some additional remarks regarding Li transport and the concept of 0-TM diffusion are warranted: First, in the discussed examples, we did not distinguish between Li and vacancy sites despite mentioning that Li diffusion relies on a di-vacancy mechanism. This is rooted in the assumption that vacancies can always be created along the percolating 0-TM diffusion pathway so that the diffusion mechanism is, in fact, always the di-vacancy mechanism. However, such a simplification is not always possible. For example, in materials with a fixed vacancy concentration such as solid electrolytes it might be required to model vacancies explicitly. This is possible within the framework of ionic percolation theory, and one example from the literature is the description of Mg percolation in Mg transition metal spinels.31
Second, at high vacancy concentrations some of the tetrahedral sites in a rocksalt-type oxide may become more stable than the neighboring octahedral sites, so that the diffusion mechanism locally changes from octahedral–tetrahedral-octahedral to tetrahedral–octahedral–tetrahedral. This does not affect the overall Li diffusion pathway and therefore has no effect on the percolation properties discussed in the present paper. However, it is in general possible to distinguish between different sublattices, such as octahedral and tetrahedral sites, in ionic percolation simulations.31
Third, it is important to keep in mind that the 0-TM capacity is a lower bound on the expected capacity. The activation energies of diffusion channels in disordered compounds follow a distribution, and while nearly all 0-TM channels will have a low barrier and will be active, some of the 1-TM channels might also contribute to Li transport. Hence, even compositions below the 0-TM percolation threshold will typically exhibit some amount of capacity.
The tortuosity of diffusion pathways in disordered LIB cathodes had, to the author’s knowledge, not previously been considered. Based on the herein made observations, in the composition space of most cation-disordered cathode materials (i.e., compositions with Li contents per \ceLi_xM_2-xO2 formula unit), the average tortuosity is with 1.2 to 1.4 relatively high. Such tortuosity corresponds to diffusion pathways that are 20% to 40% longer than linear diffusion pathways, giving rise to an effective reduction of the diffusivity by the same amount. This observation is notable since the tortuosity of ordered cathode materials in the layered, spinel, and \ceo-LiMnO2 structures is equal to 1, if 1-TM channels are active (a reasonable assumption in ordered structures). Short-range order can reduce the tortuosity of cation-disordered materials and might therefore be beneficial for the ionic conductivity.
Finally, other factors not discussed in this chapter can affect the performance of an ionic conductor. In structures that are not percolating, the mean length of (non-percolating) diffusion paths and the mean distance between diffusion path domains can be useful criteria for estimating the ionic conductivity. 23 The dimensionality of diffusion networks consisting of interconnected diffusion paths can also play a role. For example, one-dimensional diffusion pathways are more sensitive to blockage by point defects,40 whereas cation disorder typically creates three-dimensional diffusion networks. Finally, the effect of realistic short-range order on the ionic transport can be incorporated into the ionic percolation theory framework, for example, in combination with MC sampling of the atomic configurations. 23; 29
V Conclusions and final remarks
This book chapter reviewed percolation on regular lattices in the context of ionic conductors and discussed applications to Li-ion conduction in Li-ion battery cathode materials. All examples are based on the free and open-source Dribble package, and Python notebooks with examples are available at https://github.com/atomisticnet/dribble. We showed how to estimate percolation thresholds, the fraction of accessible sites, and the tortuosity of diffusion pathways for the example of the disordered rocksalt structure and the related ordered orthorhombic \ceLiMnO2 structure. We find that \ceo-LiMnO2-like short-range order in disordered rocksalt cathodes is slightly detrimental for the percolation threshold, increasing the required amount of Li excess from 9% to 18%. At the same time, the short-range order reduces the tortuosity of the diffusion pathways, which can be expected to be beneficial for the rate capability. The presented framework for percolation analysis is not limited to Li transport or Li-ion battery materials, but can be generally applied to the modeling of ionic conductors with substitutional disorder.
References
- Whittingham 2004 M. S. Whittingham, Chem. Rev. 104, 4271 (2004), http://pubs.acs.org/doi/pdf/10.1021/cr020731c .
- Van der Ven, Bhattacharya, and Belak 2013 A. Van der Ven, J. Bhattacharya, and A. A. Belak, Acc. Chem. Res. 46, 1216 (2013), http://pubs.acs.org/doi/pdf/10.1021/ar200329r .
- Bachman et al. 2016 J. C. Bachman, S. Muy, A. Grimaud, H.-H. Chang, N. Pour, S. F. Lux, O. Paschos, F. Maglia, S. Lupart, P. Lamp, L. Giordano, and Y. Shao-Horn, Chem. Rev. 116, 140 (2016).
- Janek and Zeier 2016 J. Janek and W. G. Zeier, Nat. Energy 1, 16141 (2016).
- Malavasi, Fisher, and Islam 2010 L. Malavasi, C. A. J. Fisher, and M. S. Islam, Chem. Soc. Rev. 39, 4370 (2010).
- Singh et al. 2017 B. Singh, S. Ghosh, S. Aich, and B. Roy, J. Power Sources 339, 103 (2017).
- Strukov et al. 2008 D. B. Strukov, G. S. Snider, D. R. Stewart, and R. S. Williams, Nature 453, 80 (2008).
- Chroneos et al. 2011 A. Chroneos, B. Yildiz, A. Tarancón, D. Parfitt, and J. A. Kilner, Energy Env. Sci. 4, 2774 (2011).
- Urban, Seo, and Ceder 2016 A. Urban, D.-H. Seo, and G. Ceder, npj Comput. Mater. 2, 16002 (2016).
- Wang et al. 2015 Y. Wang, W. D. Richards, S. P. Ong, L. J. Miara, J. C. Kim, Y. Mo, and G. Ceder, Nat. Mater. 14, 1026 (2015).
- Richards et al. 2016 W. D. Richards, T. Tsujimura, L. J. Miara, Y. Wang, J. C. Kim, S. P. Ong, I. Uechi, N. Suzuki, and G. Ceder, Nat. Commun. 7 (2016), 10.1038/ncomms11009.
- Van der Ven and Ceder 2000 A. Van der Ven and G. Ceder, Electrochem. Solid-State Lett. 3, 301 (2000).
- Persson et al. 2010 K. Persson, V. A. Sethuraman, L. J. Hardwick, Y. Hinuma, Y. S. Meng, A. van der Ven, V. Srinivasan, R. Kostecki, and G. Ceder, J. Phys. Chem. Lett. 1, 1176 (2010).
- Morgan, Van der Ven, and Ceder 2004 D. Morgan, A. Van der Ven, and G. Ceder, Electrochem. Solid-State Lett. 7, A30 (2004).
- Islam et al. 2005 M. S. Islam, D. J. Driscoll, C. A. J. Fisher, and P. R. Slater, Chem. Mater. 17, 5085 (2005).
- Matts et al. 2015 I. L. Matts, S. Dacek, T. K. Pietrzak, R. Malik, and G. Ceder, Chem. Mater. 27, 6008 (2015).
- Lee et al. 2014 J. Lee, A. Urban, X. Li, D. Su, G. Hautier, and G. Ceder, Science 343, 519 (2014), http://www.sciencemag.org/content/343/6170/519.full.pdf .
- Yabuuchi et al. 2015 N. Yabuuchi, M. Takeuchi, M. Nakayama, H. Shiiba, M. Ogawa, K. Nakayama, T. Ohta, D. Endo, T. Ozaki, T. Inamasu, K. Sato, and S. Komaba, Proc. Natl. Acad. Sci. USA 112, 7650–7655 (2015).
- Chen et al. 2015 R. Chen, S. Ren, M. Knapp, D. Wang, R. Witter, M. Fichtner, and H. Hahn, Adv. Energy Mater. 5, 1401814 (2015).
- Lee et al. 2018 J. Lee, D. A. Kitchaev, D.-H. Kwon, C.-W. Lee, J. K. Papp, Y.-S. Liu, Z. Lun, R. J. Clément, T. Shi, B. D. McCloskey, J. Guo, M. Balasubramanian, and G. Ceder, Nature 556, 185 (2018).
- Marrocchelli et al. 2011 D. Marrocchelli, P. A. Madden, S. T. Norberg, and S. Hull, Chem. Mater. 23, 1365 (2011).
- Ou et al. 2008 D. R. Ou, T. Mori, F. Ye, J. Zou, G. Auchterlonie, and J. Drennan, Physical Review B 77, 024108 (2008).
- Ji et al. 2019 H. Ji, A. Urban, D. A. Kitchaev, D.-H. Kwon, N. Artrith, C. Ophus, W. Huang, Z. Cai, T. Shi, J. C. Kim, H. Kim, and G. Ceder, Nat. Commun. 10, 592 (2019).
- Stauffer and Aharony 1994 D. Stauffer and A. Aharony, Introduction to Percolation Theory (Taylor & Francis, Philadelphia, PA, 1994).
- Landau and Binder 2009 D. Landau and K. Binder, Monte Carlo Simulations in Statistical Physics (Cambridge University Press, 2009).
- Isichenko 1992 M. B. Isichenko, Rev. Mod. Phys. 64, 961 (1992).
- Newman and Ziff 2000 M. E. J. Newman and R. M. Ziff, Phys. Rev. Lett. 85, 4104 (2000).
- Urban, Lee, and Ceder 2014 A. Urban, J. Lee, and G. Ceder, Adv. Energy Mater. 4, 1400478 (2014).
- Ouyang et al. 2020 B. Ouyang, N. Artrith, Z. Lun, Z. Jadidi, D. A. Kitchaev, H. Ji, A. Urban, and G. Ceder, Adv. Energy Mater. 10, 1903240 (2020).
- Ji et al. 2020 H. Ji, J. Wu, Z. Cai, J. Liu, D.-H. Kwon, H. Kim, A. Urban, J. K. Papp, E. Foley, Y. Tian, M. Balasubramanian, H. Kim, R. J. Clément, B. D. McCloskey, W. Yang, and G. Ceder, Nat. Energy 5, 213 (2020).
- Gautam et al. 2017 G. S. Gautam, P. Canepa, A. Urban, S.-H. Bo, and G. Ceder, Chem. Mater. 29, 7918 (2017).
- Ganesan, Thangavel, and Lee 2023 B. K. Ganesan, R. Thangavel, and Y. S. Lee, Mater. Today Chem. 28, 101368 (2023).
- Das et al. 2017 H. Das, A. Urban, W. Huang, and G. Ceder, Chem. Mater. 29, 7840 (2017).
- Shen and Chen 2007 L. Shen and Z. Chen, Chem. Eng. Sci. 62, 3748 (2007).
- Thorat et al. 2009 I. V. Thorat, D. E. Stephenson, N. A. Zacharias, K. Zaghib, J. N. Harb, and D. R. Wheeler, J. Power Sources 188, 592 (2009).
- Wilson et al. 2006 J. R. Wilson, W. Kobsiriphat, R. Mendoza, H.-Y. Chen, J. M. Hiller, D. J. Miller, K. Thornton, P. W. Voorhees, S. B. Adler, and S. A. Barnett, Nat. Mater. 5, 541 (2006).
- Momma and Izumi 2008 K. Momma and F. Izumi, J. Appl. Cryst. 41, 653–658 (2008).
- Momma and Izumi 2011 K. Momma and F. Izumi, J. Appl. Cryst. 44, 1272–1276 (2011).
- Hewston and Chamberland 1987 T. Hewston and B. Chamberland, J. Phys. Chem. Solids 48, 97 (1987).
- Malik et al. 2010 R. Malik, D. Burch, M. Bazant, and G. Ceder, Nano Lett. 10, 4123 (2010), http://pubs.acs.org/doi/pdf/10.1021/nl1023595 .