Solid-amorphous transition is related to the waterlike anomalies in a fluid without liquid-liquid phase transition
Departamento de Física, Instituto de Física e Matemática,
Universidade Federal de Pelotas
Caixa Postal 354, CEP 96001-970, Pelotas, RS, Brazil
jrbordin@ufpel.edu.br
\And
Centro de Ciências, Tecnologias e Saúde, Campus Araranguá
Universidade Federal de Santa Catarina
Rua Pedro João Pereira, 150, CEP 88905-120, Araranguá, SC, Brazil
leandro.krott@ufsc.br
Abstract
The most accepted origin for the water anomalous behavior is the phase transition between two liquids (LLPT) in the supercooled regime connected to the glassy first order phase transition at lower temperatures. Two length scales potentials are an effective approach that have long being employed to understand the properties of fluids with waterlike anomalies and, more recently, the behavior of colloids and nanoparticles. These potentials can be parameterized to have distinct shapes, as a pure repulsive ramp, such as the model proposed by de Oliveira et al. [J. Chem. Phys. 124, 64901 (2006)]. This model has waterlike anomalies despite the absence of LLPT. To unravel how the waterlike anomalies are connected to the solid phases we employ Molecular Dynamics simulations. We have analyzed the fluid-solid transition under cooling, with two solid crystalline phases, BCC and HCP, and two amorphous regions being observed. We show how the competition between the scales creates an amorphous cluster in the BCC crystal that leads to the amorphization at low temperatures. A similar mechanism is found in the fluid phase, with the system changing from a BCC-like to an amorphous-like structure in the point where a maxima in is observed. With this, we can relate the competition between two fluid structures with the amorphous clusterization in the BCC phase.Those findings help to understand the origins of waterlike behavior in systems without liquid-liquid critical point.
1 Introduction
Every known fluid solidifies upon cooling. However, the cooling process can lead to solid structures with distinct types of ordering. While crystalline solid phases show a long-range, macroscopic order, in condensed amorphous phases, as a glass or amorphous solid, no long-range order is observed Debenedetti (1997); Petrenko and Whitworth (2002). In fact, understanding the glass transition and the behavior of fluids in the vicinity is a huge task in condensed matter physics; and the challenge grows for polyamorphic systems. A one-component system has polyamorphism if it has the coexistence (often metastable) of two amorphous phases Kivelson and Tarjus (2002); Brazhkin and Lyapin (2003); Loerting et al. (2009); Angell. (2014); Anisimov et al. (2018); Woutersen et al. (2018); Bachler et al. (2019); McMillan and Wilding (2021); Hernandes et al. (2021).
Certainly, the most famous polyamorphous material is water. There are growing evidences that, deep into the supercooled liquid region, water have a liquid–liquid first-order phase transition that ends in a liquid-liquid critical point (LLCP), which is connected to the first order phase transition observed between two glassy phases at lower temperatures Mishima et al. (1985); Poole et al. (1992); Stanley et al. (2009); Giovambattista et al. (2012); Gallo et al. (2016); Kim et al. (2020); Shi and Tanaka (2020); Bachler et al. (2021); Foffi and Sciortino (2021); Giovambattista and Poole (2021); Caupin and Anisimov (2021); Lucas et al. (2022); Verde et al. (2022). It is possible to investigate the location of a critical point through an analysis of the thermodynamic response functions. For instance, the specific heat and isothermal compressibility display a line of maxima in the P-T plane (Widom’s line) that typically ends at the critical point where the maximum evolves into a divergence in the thermodynamic limit Simeoni et al. (2010); Brazhkin et al. (2011, 2018); Zerón et al. (2019); Losey and Sadus (2019); Bianco and Franzese (2019). Water, in addition to the Widom line ending at the vapor-liquid critical point, shows a second ending at the LLCP Xu et al. (2005); Franzese and Stanley (2007); Stanley, H. E. et al. (2008); Kumar et al. (2008); Abascal and Vega (2010); Luo et al. (2015); Gallo et al. (2016). Predicted in 1992 by Poole and co-authors Poole et al. (1992), experimental studies to observe the LLCP have been hampered by the spontaneous crystallization in the no-man’s land for 25 years. Only recently the Widom line was detected in experiments Kim et al. (2017, 2020); Amann-Winkel et al. (2023); Kringle et al. (2020). Nevertheless, many other systems have evidences of polyamorphism, as silicon Sastry and Austen Angell (2003); Beye et al. (2010); Goswami et al. (2021), silica Saika-Voivod et al. (2004); Lascaris et al. (2014); Chen et al. (2017); Trang et al. (2020); Yu et al. (2022), hydrogen Zaghoo et al. (2016); Fried et al. (2022), sulfur Plašienka et al. (2015); Henry et al. (2020); Shumovskyi et al. (2022), phosphorous Katayama et al. (2000, 2004); Yang et al. (2021), carbon Glosli and Ree (1999); Sundqvist (2021), triphenyl phosphite Tanaka et al. (2004), gallium Liu et al. (2021), molten elements Brazhkin et al. (1999), metallic glasses Sheng et al. (2007); Greaves et al. (2008); Li et al. (2022), germania Smith et al. (1995), tellurium Sun et al. (2022) and more Angell (1995); Rizzatti et al. (2019); Tanaka (2020); Lucas (2021); Desgranges and Delhommelle (2018).
The existence of LLCP is the mainly accepted scenario to explain the anomalous behavior of water Gallo et al. (2021). In fact, water is the most anomalous known material, with more than 70 thermodynamic, dynamic and structural behaviors that strongly diverge from the observed in most fluids Chaplin (2023); Podgornik (2011). For instance, it is long known that water density increases as the temperature grows from 0oC to 4oC at 1 atm Kellu (1975), whereas in most materials heating is associated naturally with the thermal expansion. Once most of these anomalies, and the LLCP, occur in the supercooled regime, and due to the difficulty to access this region experimentaly Gallo et al. (2021), computer simulations have long been applied to overcome the experimental barriers and understand the behavior of water and others anomalous fluids Stanley et al. (2009); Gallo et al. (2016); Liu et al. (2012); Gallo et al. (2021). In this sense, many models are able to reproduce the water polyamorphism and the LLCP Giovambattista and Poole (2021); Palmer et al. (2013, 2018); Chiu et al. (2013). It is interesting that models without LLCP, such as the SPC/E, show a low density amorphous (LDA) - high density amorphous (HDA) phase transition and waterlike anomalies Giovambattista et al. (2012).
Water molecules interaction are known to be computationally expensive and difficult to treat, especially in many body atomistic models Abella et al. (2023). Is this way, many isotropic core-softened potentials with two characteristic length scales have been employed to unveil the waterlike behavior, searching for the origins of anomalies Vilaseca and Franzese (2011). Since the early 1970’s, where Hemmer and Stell Hemmer and Stell (1970) observed that we can induce polyamorphism by softening a hard core interaction judiciously, obtaining a core-softened (CS) potential, passing by the seminal works by Jagla in the late 1990’s Jagla (1998, 1999, 1999), many spherical symmetric core-softened potentials have been employed to study polyamorphous systems Xu et al. (2010); Gnan et al. (2014); Xu (2019); Dasgupta et al. (2020); Fomin (2020) and to understand the relation between waterlike behavior and the competition between distinct structures in the fluid Yan et al. (2006); Gibson and Wilding (2006); Franzese (2007); Xu et al. (2011); Reisman and Giovambattista (2013); Das et al. (2013); Krott et al. (2015a); Luo et al. (2015); Bordin et al. (2015); Bordin (2016); Pinheiro et al. (2017); de Haro et al. (2018); Higuchi et al. (2018); Ryzhov et al. (2020); Martín-Roca et al. (2022); Bretonnet and Bomont (2022). In fact, these simple models can be applied for a variety of systems Likos (2001). Experimental works have shown that the effective interaction in solutions of pure or grafted PEG colloids are well described by core-softened potentials Quesada-Perez et al. (2001); Contreras-Aburto and amd R.C. Priego (2010); Haddadi et al. (2020), and computational studies indicate the same type of effective interactions for polymer-grafted nanoparticles S. Marques et al. (2020); Lafitte et al. (2014) or star polymers Bos et al. (2019).
The existence of two length scales in the CS potential does not guarantee the existence of waterlike anomalies Quigley and Probert (2005). The competition between the length scales is a key ingredient to observe the anomalous thermodynamic, dynamic and structural behavior in such fluids de Oliveira et al. (2008); Franzese (2007); Stanley et al. (2009); da Silva et al. (2010); Barraz et al. (2009); Marques et al. (2020, 2021), reproducing the competition between two liquids in supercooled water Gallo et al. (2016, 2021). However, for purely repulsive potentials, as the one proposed by de Oliveira and co-authors, no LLCP was observed - despite the competition between the scales and the waterlike anomalies de Oliveira et al. (2008, 2006); da Silva et al. (2010). This is a similar scenario from the observed in SPC/E water Giovambattista et al. (2012) - however, the existence of solid poly(a)morphism and their relation with the waterlike anomalies were not investigated.
To unravel the solid phases and the relation with the waterlike anomalous behavior, we perform large scale and Molecular Dynamics simulations cooling a purely repulsive CS from the fluid to the solid phase. To this end, we employ the model proposed by de Oliveira et al. de Oliveira et al. (2006), reproducing the waterlike anomalies obtained in previous works de Oliveira et al. (2006); Barros De Oliveira et al. (2006); De Oliveira et al. (2006); de Oliveira et al. (2008); da Silva et al. (2010). We expand these works by looking to the low temperature regime. Four distinct solids structures were observed: two crystalline and two amorphous. Our results indicate that the system undergoes a fluid-crystal solid first order phase transition, and a second order fluid-amorphous transition. Also, we show how the anomalies are connected to a crystal-amorphous phase transition, and found a maxima in the isothermal comprehensibility that does not end in a LLCP but it is connected to the amorphization of a crystal structure.
The remainder of the paper is organized as follows. In Section II we present our anomalous fluid model and summarize the details of the simulations. Next, in section III our most significant results. In particular, we will focus on the solidification scenario for the distinct solid structures and in their relations with waterlike anomalies. The paper is closed with a brief summary of our main conclusions and perspectives.
2 Model and Simulation Details
2.1 The Model
Once it is an effective model, and for the sake of simplicity, all quantities will be depicted in standard LJ units Scott et al. (1991). The fluid particles interaction was modeled by the CS potential given by Barros De Oliveira et al. (2006); De Oliveira et al. (2006)
| (1) |
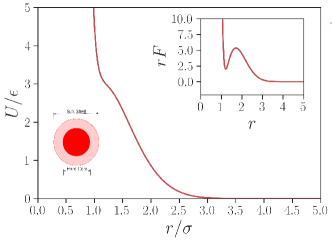
which is composed of a short-range attractive Lennard-Jones potential and a repulsive Gaussian potential centered at , with depth and width . Using the parameters , , and Barros De Oliveira et al. (2006); De Oliveira et al. (2006); Bordin and Barbosa (2018) the potential (1) acquire the purely repulsive ramp-like shape shown in Fig.1. The waterlike anomalous behavior in this potential arises from the competition between two characteristic length scales da Silva et al. (2010); Bordin and Barbosa (2018): a closer one located at the shoulder in , where the force has a local minimum (as we can see in Fig. 1 graph inset), while the further length scale is located at , where the fraction of imaginary modes of the instantaneous normal modes spectrum has a local minimumBarros De Oliveira et al. (2010). The cutoff radius for the interaction is .
2.2 Simulation Details
The phase diagram was obtained by simulations in the isothermal-isobaric ensemble () with fixed number of particles , as implemented in the ESPResSo package Limbach et al. (2006); Arnold et al. (2013). For the simulations, isobars raging from up to with distinct intervals were simulated. Along each isobar we perform a cooling process, starting at , reducing the temperature up to with a temperature step . A random system is created at the highest temperature - at this temperature, the system is always in the fluid state Barros De Oliveira et al. (2006). Then, time steps in the ensemble thermalizes the system, followed by time steps in the ensemble to equilibrate the system’s pressure and density. time steps are then performed for the production of the results, with averages and snapshots being taken at every steps. After that, we cool down the system to along the isobar, repeating the thermalization and the equilibration process in the and ensembles, respectively, in order to relax the system at the new temperature and achieve the proper new density before run the production steps. In this way, the two equilibration steps allow the system to cool down and relax at the new state. To ensure that the system is in the equilibrium we averaged quantities as energy, entalpy, density, instantaneous pressure and kinetic temperature along the simulations, including in the equilibration processes. The Langevin thermostat Allen et al. (2017), that keeps the temperature fixed in our ESPResSo implementation, has a coupling parameter . The piston parameters for the Anderson barostat Allen et al. (2017) are and mass . Here, the molecule density is defined as with being the mean volume at a given pressure and temperature.
To confirm the low temperature phase transitions, simulations using the isothermal ensemble () were performed in the range and as implemented in a fortran90 code developed in the house Krott and Bordin (2013); Krott et al. (2015b). The temperature was controlled using the Nosè-Hoover thermostat Frenkel and Smit (1996) with coupling parameter . Two different initial configurations of the systems were simulated: solid and liquid states. Using different initial configurations allow us to identify precisely the final state of the system, avoiding metastability. The equilibrium state was reached after steps, followed by simulation run. We used a time step = 0.001. All the physical quantities were obtained from 50 uncorrelated samples. To check the stability of the systems, we verified the energy as a function of time and the pressure, evaluated by the virial, as a function of density.
The temperature of maximum density (TMD) along each isobar was used to characterize the density anomaly. Also, the locus of the maximum of response functions were obtained: the isothermal compressibility , the isobaric expansion coefficient and the specific heat at constant pressure and at constant volume ,
| (2) |
Here, is the system entalpy. The quantities shown were obtained by numerical differentiation and, as consistency check, using statistical fluctuations: the compressibility as the measure of volume fluctuations, the isobaric heat capacity is proportional to the entropy fluctuations experienced by particles at fixed pressure, and the thermal expansion coefficient reflects the correlations between entropy and volume fluctuations Allen et al. (2017); Tuckerman (2010).
In order to describe the connection between structure and thermodynamics, we have analyzed translational and orientational properties. The radial distribution function (RDF) was evaluated and subsequently used to compute the excess entropy and the translational order parameter . The first one can be obtained by counting all accessible configurations for a real fluid and comparing it with the ideal gas entropy Dzugutov (1996). Then, is a negative quantity that increases with temperature, as the full entropy does Dyre (2018); Bell et al. (2020). Expanding in terms of two-particle, three-particle contributions, etc. Galliero et al. (2011), we have
| (3) |
The two-particle contribution,
| (4) |
corresponds to and of the total excess entropy in Lennard-Jones systems, being the dominant contribution to excess entropy Raveché (1971); Baranyai and Evans (1989); Sharma et al. (2006).
In order to ascertain how the short and long range coordination shells behaves, we evaluated the cumulative two-body entropy Krekelberg et al. (2008); Cardoso et al. (2021)
| (5) |
Here, is the upper integration limit. It is relevant to address that the two-body excess entropy is not a thermodynamic quantity, but a structural order metric that connects thermodynamics and structure. Then, is a useful tool to analyze long-range structural characteristics of the core-softened system.
The translational order parameter is defined as Errington and Debenedetti (2001)
| (6) |
where is the interparticle distance scaled with the average separation between pairs of particles . is a cutoff distance, defined as , where is the simulation box size. For an ideal gas (completely uncorrelated fluid), and vanishes. For crystals or fluids with long range correlations over long distances, which leads to . The excess entropy and the translational order parameter are linked, once both are dependent on the deviation of from unity. The translational structural anomaly can then be characterized by an anomalous decrease of under compression.
Another structural quantity evaluated was the orientational order parameter (OOP), that gives insight on the local orientational order Steinhardt et al. (1983); Errington and Debenedetti (2001); De Oliveira et al. (2006); Yan et al. (2005). The OOP for a specific particle with neighbors is given by
| (7) |
with
| (8) |
where are the spherical harmonics of order and is the distance between two particles. The OOP for a whole system is obtained by taking the average over the parameter value for each particle , . In this work we evaluated the OOP for and 6, using the Freud python library Ramasubramani et al. (2020) – the number of neighbors for each particle was found computing Voronoi diagrams using voro++ Rycroft (2009), as explained in details in our previous work Hernandes et al. (2021). The anomalous behavior is characterized by a maxima in and a minima in
The dynamic behaviour was analyzed by the mean square displacement (MSD), given by
| (9) |
where and denote the particle position at a time and at a later time , respectively. The MSD is then related to the diffusion coefficient by the Einstein relation,
| (10) |
The diffusion anomaly region was obtained using the isotherms. For regular fluids decreases by compressing. However, for a range of pressures, increases with in fluids with diffusion anomaly. With this, the diffusion anomaly extrema (DE) may be defined using the minima and maxima in these curves de Oliveira et al. (2008); Vilaseca and Franzese (2010); S. Marques et al. (2020).
3 Results and Discussion
3.1 The Fluid-Solid Transitions
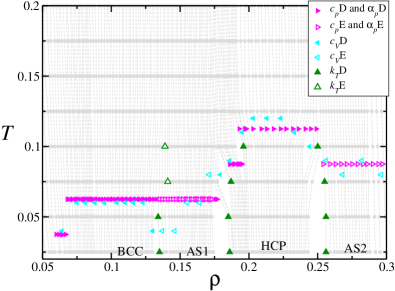
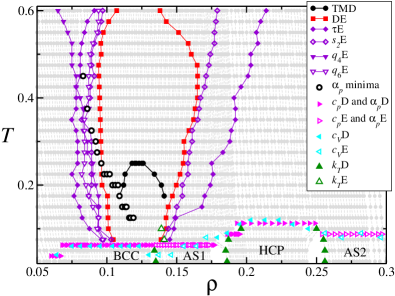
Although anomalous, fluid polymorphism was not reported for the purely repulsive CS model employed in this work De Oliveira et al. (2006); Barros De Oliveira et al. (2006); da Silva et al. (2010). One possibility is that the fluid properties vary very smoothly, with the fluid near a crystalline phase behaving distinctly from water near an amorphous phase. In the original works by de Oliveira and co-authors De Oliveira et al. (2006); Barros De Oliveira et al. (2006), and in their next articles Oliveira et al. (2008); da Silva et al. (2010), the crystallization limit was not explored. Recently, Bordin and co-authors Cardoso et al. (2021); Nogueira and Bordin (2022) explored the 2D limit, and found three distinct crystalline solid phases separated by two amorphous solid phases. To check if a poly(a)morphism will be observed in the 3D limit, we can first look to the specific heat behavior along an isobar (for the simulations), and corroborate the findings evaluation the specific heat at constant volume using the simulations. In this way, we show in Fig. 2 the phase diagram for temperatures below . Here, the gray circles connected by gray dashed lines indicate the behavior of the isobar upon cooling and, to identify the fluid-solid phase transitions, the response functions were evaluated. Interesting, both and can show discontinuities ( and ) or extrema ( and ) depending on the isobar - in a similar way, can also have extrema or discontinuities along distinct isochores.
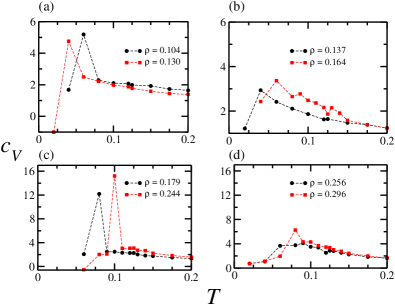
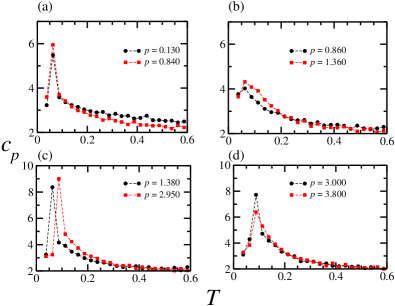
In Fig. 3 we show the behavior. At low pressures, up to , the specific heat has a discontinuity (D) at low temperatures, indicating a first order phase transition, as we can see in Fig. 3(a). Analysing isochores in the same region, as illustrated in Fig. 4(a), we can see that also has a discontinuity in a close temperature. On the other hand, for pressures ranging from to 1.360, the has a maxima. This like curve is typical from second order phase transitions, and was observed for both , Fig. 3(b), and , Fig. 4(b). Compressing the system, the discontinuous behavior is recovered for both specific heats, see Fig. 3(c) and Fig. 4(c) and, for the higher pressures and densities, it changes once again to a shape. Such behavior was also observed in another response function, , shown in Fig. 5. Here is also possible to observe two waterlike features of this model: the density anomaly and a fluid phase denser than the solid phase (as the isobars in Fig. 2 shown).
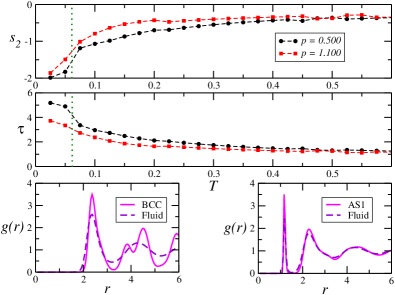
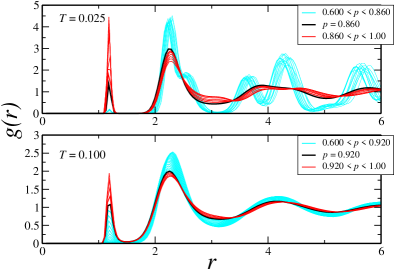
The discontinuous/continuous transitions can also be observed using structural parameters. First, we analyze the behavior of and along two pressures isobars. The first one, , has a discontinuity in the response functions and , and the second, , a continuous behavior. By looking to the and curves, shown in Fig. 6, we can also see a discontinuous behavior along the fluid-solid transition, evidenced by the abrupt change in the RDF behavior in the lower panel of Fig. 6. Cooling down the system from to leads to an abrupt change in the RDF, from a fluid to a solid with defined structure – with the PTM method Larsen et al. (2016); Stukowski (2010) and and analyzes Lechner and Dellago (2008) we identified as a body-centered cubic (BCC) structure. On the other hand, along the isobar the translational structural parameters and change continuously once the structure at the amorphous phase is similar to the fluid structure, as shown in the RDF of the lower panel of Fig. 6. This amorphous region will be denominated as AS1.
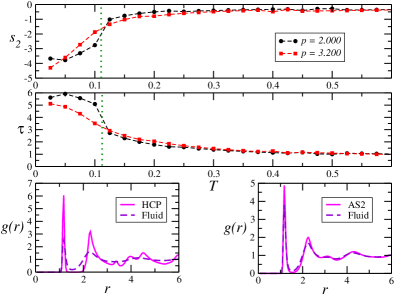
Compressing the system, and show a discontinuous behavior along the isobar and continuous at in Fig. 7, as the thermodynamic response functions. The discontinuous behavior can be associated to a fluid-solid transition, with a hexagonal closed packed (HCP) Lechner and Dellago (2008); Larsen et al. (2016); Stukowski (2010) structure in the solid crystalline phase, while the continuous behavior correspond to a fluid-amorphous transition - the AS2 phase. As in the fluid-AS1 transition, the main difference between the fluid and AS2 structures is the occupancy in the two characteristic length scales, as the RDF in the lower panel of Fig. 7 show: the amorphous phases have higher peaks at and and the occupancy between the peaks vanishes, indicating the solidification.
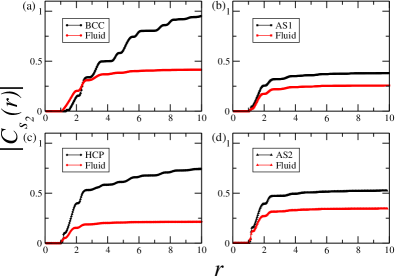
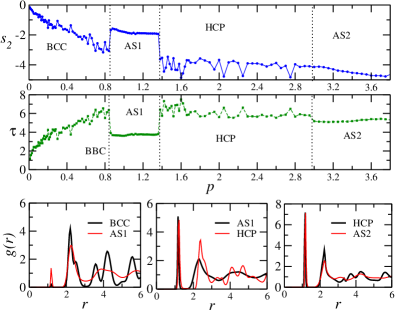
The existence of two crystalline solid phases and two amorphous phases can also be inferred from the longer range translational ordering. For a ordered solid, increases with , while for disordered systems - as fluid or amorphous solids – reaches a plateau as the RDF 1.0 at short distances. It can be seen in the cumulative two-body entropy, Fig. 8: the BCC and HCP phases entropy continually increase until large distances , indicating a longer range ordering in the coordination shells. On the other hand, the fluid and amorphous solid phases reach a plateau after a short distance, characterizing a shorter range ordering.
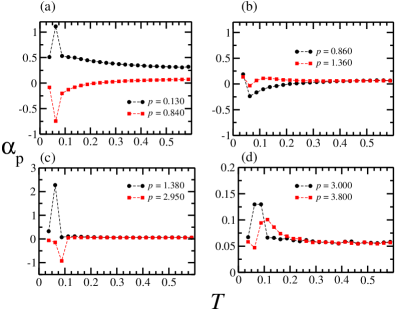
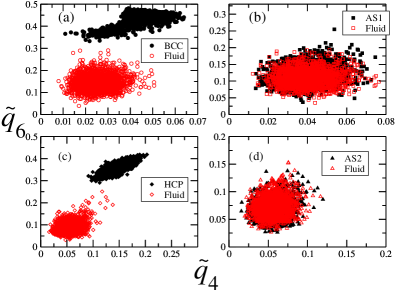
To understand the orientational ordering we can plot the behavior of it’s mean value, , for each particle as function of the mean value of Hernandes et al. (2021); Steinhardt et al. (1983); Lechner and Dellago (2008); Eslami et al. (2018); Geiger and Dellago (2013); Boattini et al. (2018, 2019). In Fig. 9(a) each point corresponds to one particle in the system in the isobar at (black points, BCC phase) and (red squares, fluid phase). As we can see, the sixfold ordering drastically decreases upon cooling. Similar behavior can be seen in the isobar ,(c), where there is a drastic change in the OOP values from the solid HCP phase at to the fluid phase at . However, in the fluid-amorphous transitions, (b) and (d), the orientational behavior is practically the same, without an abrupt change in the OOP values.
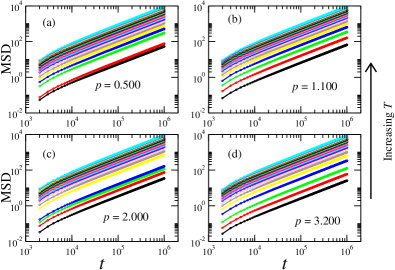
Not only the thermodynamic and structural behaviors indicate a discontinuous transition between fluid and crystalline solids and a fluid-amorphous continuous transition, but also the dynamics leads to this conclusion. In Fig. 10 we show the MSD along distinct isobars for all simulated temperatures. It is clear that the MSD – and, consequently, the diffusion coefficient – have a discontinuity in the fluid-crystalline solid transition, while it has a continuous behavior in the fluid-amorphous solid transition. With this, we can see that the thermodynamic response functions, the translational order parameter, the two-body excess entropy, the OOP and the dynamic of the system indicate the existence of two crystalline solid and two amorphous solid for the potential, Eq. (1), with discontinuous fluid-crystalline transition and continuous fluid-amorphous transition. Next, we explore the solid-solid transitions in the system.
3.2 The Solid-Solid transitions

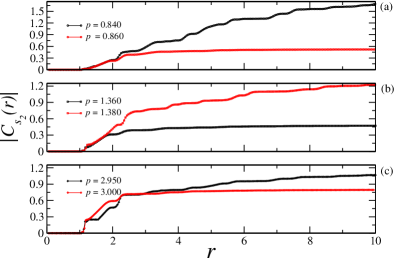
We start this discussion by analyzing the isothermal compressibility, , looking for the solid-solid pressure transitions between the four phases: BCC, AS1, HCP and AS2. The BCC and AS1 phases were observed for , and the HCP and AS2 phases in the region. The correspondent curves are shown in Fig. 11. As we can see, at the lowers temperatures, and 0.050, the curve has tree peaks. For , they are located at , the BCC-AS1 transition, at and , the AS1-HCP and HCP-AS2 transitions, respectively. Upon heating, at and , the peak at low temperatures is replaced by a small bump in the curve in the regions near the BCC-AS1 transition observed in the colder isotherms. This bump vanishies at higher temperatures. As shown in the phase diagram at low temperatures, Fig. 2, the extrema E line and discontinuous D lines correspond to the borders between the crystalline and amorphous solid phases - with the E line going to inside the fluid phase, as a prolongation of the BCC-AS1 transition. But how the structural properties are related to this?
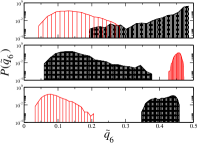
First, lets take a look at the orientational ordering, given by the OOPs. In Fig. 12 we show in the left panel the diagram for pressures in the border of the phase transitions along the isotherm . In the right panel are the correspondent probabilities of a particle have a OOP , . As the system is compressed from to the structure change from a BCC to the AS1, as the curve in Fig. 11. Interestingly, at some particles have an amorphous-like orientational ordering Lechner and Dellago (2008), as indicated at Fig. 12(a). The correspondent , in the right panel, shows a overlap in the probability distributions for both pressures. This indicates that AS1 clusters grow in the BCC phase, promoting the amorphization. On the other hand, the AS1-HCP and HCP-AS2 transitions have a distinct behavior. As the Fig. 12(b) and (c) show, there is no overlap in the probabilities, the values of are distinct for each phase. This indicates a discontinuous orientational transition, with all particles changing from AS1 to HCP and, under compression, from HCP to AS2.
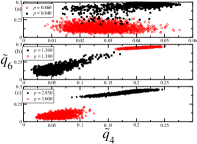
From the radial distribution function is possible to correlate the maxima in at lower pressures with the competition between the two characteristic length scales. The RDF for the isotherm , shown in the upper panel of Fig. 13, shows how as the BCC phase is compressed the particles start to move from the second length scale, , to the first length scale, , reaching at the pressure of transition, . This corroborates the idea that an amorphous cluster grows in the BCC phase as the particles start to occupy the first length scale, leading to the observed decrease in for some particles, and the overlap in for this transition. At this point, it is relevant to analyze the RDF behavior along the isotherm. At this temperature and in the range of pressures the system is in the fluid phase. However, has a maxima at due the small bump. Interestingly, this is the pressure where , following the observed in the BCC-AS1 transition. Although this purely repulsive model does not have fluid-fluid phase transition, it is striking to find this maxima line that converges to the BCC-AS1 transition. Sure, it can not be characterized as the Widom line since it does not end in a LLCP.
Then, as the occupancy in the first length scale grows under compression, the amorphous cluster grows, leading to the order-disorder transition indicated by the and at curves, Fig. 14 upper and lower panel, respectively. A sharp change in the structure can also be seen at the AS1-HCP transition. However, in the HCP-AS2 phase transition the translational structure varies smoothly – unlike the OOPs, where the orientation changes abruptly, as the Fig. 12 indicates. Looking to the RDFs at the lower panel of Fig. 14, we can see that while the BCC-AS1 phase transition is characterized by the particles moving from the first to the second scale, at the AS1-HCP the first scale occupancy did not change, but the ordering for distances from the second scale, , and beyond are affected. The last solid transition, HCP-AS2, does not have a significant change in the occupancy in the first two coordination shells, but the long range behavior is affected. It can be easily seen in the correspondent cumulative pair entropy, shown in Fig. 15 for the three phase boundaries.
3.3 The waterlike anomalies
Our findings show that the BCC-AS1 transition is ruled by the competition between the scales, with a sharp change in the translational ordering and the nucleation of a amorphous cluster in the BCC crystal under compression - on the other hand, in the HCP-AS2 transition we have not observed the amorphization of the HCP crystal. The amorphization of the BCC phase seems to affect the fluid phase near the fluid-BCC transition, where maxima in where observed. This indicates that, although this model does not have LLCP, there are two structures, one more BCC-like and another one AS1-like, competing in the fluid phase. Therefore, if there is competition then there should exist waterlike anomalies as well de Oliveira et al. (2008); Stanley et al. (2009); Gallo et al. (2016); Angell. (2014).
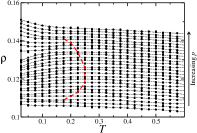
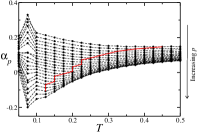
Among the thermodynamic anomalies observed in real water Chaplin (2023), here we show the density anomaly, characterized by a maximum in as function of at constant , and the minimum in - which corresponds to the region where the fluid expand over cooling. The isobars are shown in black in Fig. 16(a) and (b), with the extrema connected by the red curve.
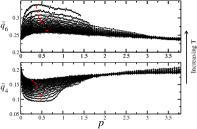
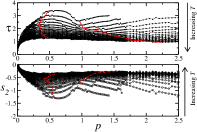
The orientational structural anomaly is usually characterized by a maxima in under compression, as we observed – Fig. 17(a). Also, a minima in was observed in a similar region of the phase diagram. The translational structural anomaly can be observed by an anomalous decrease in under compression - in normal fluids, the translational ordering increases with . Likewise, for regular fluids the pair entropy decreases under compression, but water has an anomalous region delimited by a minima and a maxima in the isotherm. The behavior of both translational parameters are shown in Fig. 17(b).
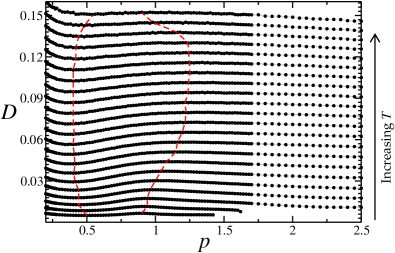
Finally, the diffusion anomaly is characterized by the increase in the self-diffusion coefficient under compression. As the isotherms in Fig. 18 show, there is a region in the phase diagram where the fluid diffuses faster as the pressure increases. All these anomalies are indicated in the phase diagram, Fig. 19. As in the original works by de Oliveira and co-workers De Oliveira et al. (2006); Barros De Oliveira et al. (2006), a waterlike hierarchy of anomalies was obtained as the diffusion, , , and extrema (DE, E and E, E and E curves, respectively) show. At last, it is interesting to notice how the diffusion and structural anomalous region limit begin at the point were has a maxima, and , reinforcing the idea that the competition between two fluids leads to the anomalous behavior.
4 Conclusions and Perspectives
In this paper we have explored the phase diagram of the core-softened potential proposed by de Oliveira and co-authors De Oliveira et al. (2006); Barros De Oliveira et al. (2006). We depicted for the first time the solid phases of this fluid, showing that it has solid poly(a)morphism. At low densities, a BCC crystalline phase is observed, followed by an amorphous phase as we compress the system. This ordered-disordered solid transition is a consequence from the competition between the two length scales in the particle’s interaction, with an amorphous cluster growing in the BCC crystal , promoting the amorphization. It reflects in the fluid near the BCC and AS1 phases, where we can correlate a maxima in to a transition from a BCC-like fluid to a AS1-like fluid, where the first coordination shell reaches . Compressing the first amorphous phase, the system changes to a HCP crystal phase, with changes in the second coordination shell, and at high pressures, a second amorphous region is observed – here the long range ordering rules the ordered-disordered transition. However, no amorphous cluster was observed in the HCP phase. Our findings show that even for fluid without LLCP we can find a maxima in the connected to the BCC-AS1 phase transition and to the existence of amorphous clusters in the BCC crystal. It is remarkable that the mechanism observed in the 3D system is similar to what we have observed in the 2D case Cardoso et al. (2021); Nogueira and Bordin (2022). However, in the 2D limit there were more than one anomalous regions, corresponding to ordered-disordered transitions where an amorphous cluster grows inside the crystal. Then, for confined anomalous fluids, there should be a minimal pore size where we will observe a 2D like or a 3D like behavior.
5 acknowledgments
Without public funding this research would be impossible. simulations were performed in the Quindim/Camafeu Workstations from the Bordin Lab at UFPel – proc. 403427/2021-5 from the Brazilian National Council for Scientific and Technological Development (CNpq). JRB is also grateful to the CNPq, proc. 407818/2018-9, and Research Support Foundation of the State of Rio Grande do Sul (FAPERGS), TO 21/2551-0002024-5, for the funding support. JRB thanks L. C. de Matos for the illuminating insights and L. Pinheiro and T. P. O. Nogueira for the critical reading of the manuscript.
Data Availability Statement
The data that support the findings of this study are available from the corresponding author upon reasonable request.
References
- Debenedetti (1997) Pablo G. Debenedetti. Metastable Liquids. Princeton University Press, Princeton, 1997. ISBN 9780691213941. doi:doi:10.1515/9780691213941. URL https://doi.org/10.1515/9780691213941.
- Petrenko and Whitworth (2002) Victor F. Petrenko and Robert W. Whitworth. Physics of Ice. Oxford University Press, 01 2002. ISBN 9780198518945. doi:10.1093/acprof:oso/9780198518945.001.0001. URL https://doi.org/10.1093/acprof:oso/9780198518945.001.0001.
- Kivelson and Tarjus (2002) Daniel Kivelson and Gilles Tarjus. Apparent polyamorphism and frustration. Journal of Non-Crystalline Solids, 307-310:630–636, 2002. ISSN 0022-3093. doi:https://doi.org/10.1016/S0022-3093(02)01514-4. URL https://www.sciencedirect.com/science/article/pii/S0022309302015144.
- Brazhkin and Lyapin (2003) V V Brazhkin and A G Lyapin. High-pressure phase transformations in liquids and amorphous solids. Journal of Physics: Condensed Matter, 15(36):6059, aug 2003. doi:10.1088/0953-8984/15/36/301. URL https://dx.doi.org/10.1088/0953-8984/15/36/301.
- Loerting et al. (2009) Thomas Loerting, Vadim V. Brazhkin, and Tetsuya Morishita. Multiple Amorphous–Amorphous Transitions, chapter 2, pages 29–82. John Wiley & Sons, Ltd, 2009. ISBN 9780470508602. doi:https://doi.org/10.1002/9780470508602.ch2. URL https://onlinelibrary.wiley.com/doi/abs/10.1002/9780470508602.ch2.
- Angell. (2014) C. Austen Angell. Two phases? Nat. Mater., 13:673–675, 2014.
- Anisimov et al. (2018) Mikhail A. Anisimov, Michal Duška, Frédéric Caupin, Lauren E. Amrhein, Amanda Rosenbaum, and Richard J. Sadus. Thermodynamics of fluid polyamorphism. Phys. Rev. X, 8:011004, Jan 2018. doi:10.1103/PhysRevX.8.011004. URL https://link.aps.org/doi/10.1103/PhysRevX.8.011004.
- Woutersen et al. (2018) Sander Woutersen, Bernd Ensing, Michiel Hilbers, Zuofeng Zhao, and C. Austen Angell. A liquid-liquid transition in supercooled aqueous solution related to the hda-lda transition. Science, 359(6380):1127–1131, 2018. doi:10.1126/science.aao7049. URL https://www.science.org/doi/abs/10.1126/science.aao7049.
- Bachler et al. (2019) Johannes Bachler, Philip H. Handle, Nicolas Giovambattista, and Thomas Loerting. Glass polymorphism and liquid–liquid phase transition in aqueous solutions: experiments and computer simulations. Phys. Chem. Chem. Phys., 21:23238–23268, 2019. doi:10.1039/C9CP02953B. URL http://dx.doi.org/10.1039/C9CP02953B.
- McMillan and Wilding (2021) Paul F. McMillan and Martin C. Wilding. Polyamorphism and Liquid–Liquid Phase Transitions, chapter 3.9, pages 359–370. John Wiley & Sons, Ltd, 2021. ISBN 9781118801017. doi:https://doi.org/10.1002/9781118801017.ch3.9. URL https://onlinelibrary.wiley.com/doi/abs/10.1002/9781118801017.ch3.9.
- Hernandes et al. (2021) V F Hernandes, M S Marques, and José Rafael Bordin. Phase classification using neural networks: application to supercooled, polymorphic core-softened mixtures. Journal of Physics: Condensed Matter, 34(2):024002, oct 2021. doi:10.1088/1361-648X/ac2f0f. URL https://dx.doi.org/10.1088/1361-648X/ac2f0f.
- Mishima et al. (1985) O. Mishima, L. Calvert, and E. Whalley. An apparently first-order transition between two amorphous phases of ice induced by pressure. Nature, 314:76–78, 1985. doi:10.1038/314076a0.
- Poole et al. (1992) Peter Poole, Francesco Sciortino, Ulrich Essmann, and H. Stanley. Phase-behavior of metastable water. Nature, 360:324–328, 11 1992. doi:10.1038/360324a0.
- Stanley et al. (2009) H. E. Stanley, S. V. Buldyrev, S.-H. Chen, G. Franzese, S. Han, P. Kumar, F. Mallamace, M. G. Mazza, L. Xu, and Z. Yan. Liquid Polyamorphism and the Anomalous Behavior of Water, pages 249–266. Springer Berlin Heidelberg, Berlin, Heidelberg, 2009. ISBN 978-3-540-85859-1. doi:10.1007/978-3-540-85859-1_20. URL https://doi.org/10.1007/978-3-540-85859-1_20.
- Giovambattista et al. (2012) Nicolas Giovambattista, Thomas Loerting, Boris R. Lukanov, and Francis W. Starr . Interplay of the glass transition and the liquid-liquid phase transition in water. Sci. Rep., 2:390, 2012. doi:10.1038/srep00390.
- Gallo et al. (2016) Paola Gallo, Katrin Amann-Winkel, Charles Austen Angell, Mikhail Alexeevich Anisimov, Frédéric Caupin, Charusita Chakravarty, Erik Lascaris, Thomas Loerting, Athanassios Zois Panagiotopoulos, John Russo, Jonas Alexander Sellberg, Harry Eugene Stanley, Hajime Tanaka, Carlos Vega, Limei Xu, and Lars Gunnar Moody Pettersson. Water: A tale of two liquids. Chemical Reviews, 116(13):7463–7500, 2016. doi:10.1021/acs.chemrev.5b00750. URL https://doi.org/10.1021/acs.chemrev.5b00750. PMID: 27380438.
- Kim et al. (2020) Kyung Hwan Kim, Katrin Amann-Winkel, Nicolas Giovambattista, Alexander Späh, Fivos Perakis, Harshad Pathak, Marjorie Ladd Parada, Cheolhee Yang, Daniel Mariedahl, Tobias Eklund, Thomas. J. Lane, Seonju You, Sangmin Jeong, Matthew Weston, Jae Hyuk Lee, Intae Eom, Minseok Kim, Jaeku Park, Sae Hwan Chun, Peter H. Poole, and Anders Nilsson. Experimental observation of the liquid-liquid transition in bulk supercooled water under pressure. Science, 370(6519):978–982, 2020. doi:10.1126/science.abb9385. URL https://www.science.org/doi/abs/10.1126/science.abb9385.
- Shi and Tanaka (2020) Rui Shi and Hajime Tanaka. The anomalies and criticality of liquid water. Proceedings of the National Academy of Sciences, 117(43):26591–26599, 2020. doi:10.1073/pnas.2008426117. URL https://www.pnas.org/doi/abs/10.1073/pnas.2008426117.
- Bachler et al. (2021) Johannes Bachler, Johannes Giebelmann, and Thomas Loerting. Experimental evidence for glass polymorphism in vitrified water droplets. Proceedings of the National Academy of Sciences, 118(30):e2108194118, 2021. doi:10.1073/pnas.2108194118. URL https://www.pnas.org/doi/abs/10.1073/pnas.2108194118.
- Foffi and Sciortino (2021) Riccardo Foffi and Francesco Sciortino. Structure of high-pressure supercooled and glassy water. Phys. Rev. Lett., 127:175502, Oct 2021. doi:10.1103/PhysRevLett.127.175502. URL https://link.aps.org/doi/10.1103/PhysRevLett.127.175502.
- Giovambattista and Poole (2021) Nicolas Giovambattista and Peter H. Poole. Liquid–liquid phase transition in simulations of ultrafast heating and decompression of amorphous ice. Journal of Non-Crystalline Solids: X, 11-12:100067, 2021. ISSN 2590-1591. doi:https://doi.org/10.1016/j.nocx.2021.100067. URL https://www.sciencedirect.com/science/article/pii/S259015912100008X.
- Caupin and Anisimov (2021) Frédéric Caupin and Mikhail A. Anisimov. Minimal microscopic model for liquid polyamorphism and waterlike anomalies. Phys. Rev. Lett., 127:185701, Oct 2021. doi:10.1103/PhysRevLett.127.185701. URL https://link.aps.org/doi/10.1103/PhysRevLett.127.185701.
- Lucas et al. (2022) Pierre Lucas, Julian Pries, Shuai Wei, and Matthias Wuttig. The glass transition of water, insight from phase change materials. Journal of Non-Crystalline Solids: X, 14:100084, 2022. ISSN 2590-1591. doi:https://doi.org/10.1016/j.nocx.2022.100084. URL https://www.sciencedirect.com/science/article/pii/S2590159122000048.
- Verde et al. (2022) Alejandro R. Verde, Laureano M. Alarcón, and Gustavo A. Appignanesi. A journey into the local structural order of liquid water: from the insights earned by geometrically-inspired descriptors to the development of a brand new energy-based indicator. The European Physical Journal Plus, 137(10), October 2022. doi:10.1140/epjp/s13360-022-03318-x. URL https://doi.org/10.1140/epjp/s13360-022-03318-x.
- Simeoni et al. (2010) G. G. Simeoni, T. Bryk, F. A. Gorelli, M. Krisch, G. Ruocco, M. Santoro, and T. Scopigno. The widom line as the crossover between liquid-like and gas-like behaviour in supercritical fluids. Nature Physics, 6:503–507, 2010. doi:https://doi.org/10.1038/nphys1683.
- Brazhkin et al. (2011) V. V. Brazhkin, Yu. D. Fomin, A. G. Lyapin, V. N. Ryzhov, and E. N. Tsiok. Widom line for the liquid–gas transition in lennard-jones system. The Journal of Physical Chemistry B, 115(48):14112–14115, 2011. doi:10.1021/jp2039898. URL https://doi.org/10.1021/jp2039898. PMID: 21699267.
- Brazhkin et al. (2018) V.V. Brazhkin, Yu.D. Fomin, V.N. Ryzhov, E.N. Tsiok, and K. Trachenko. Physica A: Statistical Mechanics and its Applications, 509:690 – 702, 2018. ISSN 0378-4371. doi:https://doi.org/10.1016/j.physa.2018.06.084. URL http://www.sciencedirect.com/science/article/pii/S0378437118308094.
- Zerón et al. (2019) I.M. Zerón, J. Torres-Arenas, E.N. de Jesús, B.V. Ramírez, and A.L. Benavides. Discrete potential fluids in the supercritical region. Journal of Molecular Liquids, 293:111518, 2019. ISSN 0167-7322. doi:https://doi.org/10.1016/j.molliq.2019.111518. URL http://www.sciencedirect.com/science/article/pii/S016773221933168X.
- Losey and Sadus (2019) James Losey and Richard J. Sadus. The widom line and the lennard-jones potential. The Journal of Physical Chemistry B, 123(39):8268–8273, 2019. doi:10.1021/acs.jpcb.9b05426. URL https://doi.org/10.1021/acs.jpcb.9b05426. PMID: 31498625.
- Bianco and Franzese (2019) Valentino Bianco and Giancarlo Franzese. Hydrogen bond correlated percolation in a supercooled water monolayer as a hallmark of the critical region. Journal of Molecular Liquids, 285:727 – 739, 2019. ISSN 0167-7322. doi:https://doi.org/10.1016/j.molliq.2019.04.090. URL http://www.sciencedirect.com/science/article/pii/S0167732218350086.
- Xu et al. (2005) Limei Xu, Pradeep Kumar, S. V. Buldyrev, S.-H. Chen, P. H. Poole, F. Sciortino, and H. E. Stanley. Relation between the widom line and the dynamic crossover in systems with a liquid–liquid phase transition. Proceedings of the National Academy of Sciences, 102(46):16558–16562, 2005. ISSN 0027-8424. doi:10.1073/pnas.0507870102. URL https://www.pnas.org/content/102/46/16558.
- Franzese and Stanley (2007) Giancarlo Franzese and H Eugene Stanley. The widom line of supercooled water. Journal of Physics: Condensed Matter, 19(20):205126, apr 2007. doi:10.1088/0953-8984/19/20/205126.
- Stanley, H. E. et al. (2008) Stanley, H. E., Kumar, P., Franzese, G., Xu, L., Yan, Z., Mazza, M. G., Buldyrev, S. V., Chen, S.-H., and Mallamace, F. Liquid polyamorphism: Possible relation to the anomalous behaviour of water. Eur. Phys. J. Special Topics, 161:1–17, 2008. doi:10.1140/epjst/e2008-00746-3. URL https://doi.org/10.1140/epjst/e2008-00746-3.
- Kumar et al. (2008) Pradeep Kumar, Giancarlo Franzese, and H Eugene Stanley. Dynamics and thermodynamics of water. Journal of Physics: Condensed Matter, 20(24):244114, 05 2008. doi:10.1088/0953-8984/20/24/244114. URL https://doi.org/10.1088%2F0953-8984%2F20%2F24%2F244114.
- Abascal and Vega (2010) José L. F. Abascal and Carlos Vega. Widom line and the liquid–liquid critical point for the tip4p/2005 water model. The Journal of Chemical Physics, 133(23):234502, 2010. doi:10.1063/1.3506860. URL https://doi.org/10.1063/1.3506860.
- Luo et al. (2015) Jiayuan Luo, Limei Xu, C. Austen Angell, H. Eugene Stanley, and Sergey V. Buldyrev. Physics of the jagla model as the liquid-liquid coexistence line slope varies. The Journal of Chemical Physics, 142(22):224501, 2015. doi:10.1063/1.4921559. URL https://doi.org/10.1063/1.4921559.
- Kim et al. (2017) Kyung Hwan Kim, Alexander Späh, Harshad Pathak, Fivos Perakis, Daniel Mariedahl, Katrin Amann-Winkel, Jonas A. Sellberg, Jae Hyuk Lee, Sangsoo Kim, Jaehyun Park, Ki Hyun Nam, Tetsuo Katayama, and Anders Nilsson. Maxima in the thermodynamic response and correlation functions of deeply supercooled water. Science, 358(6370):1589–1593, 2017. ISSN 0036-8075. doi:10.1126/science.aap8269. URL https://science.sciencemag.org/content/358/6370/1589.
- Amann-Winkel et al. (2023) Katrin Amann-Winkel, Kyung Hwan Kim, Nicolas Giovambattista, Marjorie Ladd-Parada, Alexander Späh, Fivos Perakis, Harshad Pathak, Cheolhee Yang, Tobias Eklund, Thomas J. Lane, Seonju You, Sangmin Jeong, Jae Hyuk Lee, Intae Eom, Minseok Kim, Jaeku Park, Sae Hwan Chun, Peter H. Poole, and Anders Nilsson. Liquid-liquid phase separation in supercooled water from ultrafast heating of low-density amorphous ice. Nature Communications, 14(1), January 2023. doi:10.1038/s41467-023-36091-1. URL https://doi.org/10.1038/s41467-023-36091-1.
- Kringle et al. (2020) Loni Kringle, Wyatt A. Thornley, Bruce D. Kay, and Greg A. Kimmel. Reversible structural transformations in supercooled liquid water from 135 to 245 k. Science, 369(6510):1490–1492, 2020. doi:10.1126/science.abb7542. URL https://www.science.org/doi/abs/10.1126/science.abb7542.
- Sastry and Austen Angell (2003) S. Sastry and C. Austen Angell. Liquid–liquid phase transition in supercooled silicon. Nature Materials, 2:739–743, 2003. doi:10.1038/nmat994.
- Beye et al. (2010) Martin Beye, Florian Sorgenfrei, William F. Schlotter, Wilfried Wurth, and Alexander Föhlisch. The liquid-liquid phase transition in silicon revealed by snapshots of valence electrons. Proceedings of the National Academy of Sciences, 107(39):16772–16776, 2010. doi:10.1073/pnas.1006499107. URL https://www.pnas.org/doi/abs/10.1073/pnas.1006499107.
- Goswami et al. (2021) Yagyik Goswami, Vishwas V. Vasisht, Daan Frenkel, Pablo G. Debenedetti, and Srikanth Sastry. Thermodynamics and kinetics of crystallization in deeply supercooled stillinger–weber silicon. The Journal of Chemical Physics, 155(19):194502, 2021. doi:10.1063/5.0069475. URL https://doi.org/10.1063/5.0069475.
- Saika-Voivod et al. (2004) Ivan Saika-Voivod, Francesco Sciortino, Tor Grande, and Peter H. Poole. Phase diagram of silica from computer simulation. Phys. Rev. E, 70:061507, Dec 2004. doi:10.1103/PhysRevE.70.061507. URL https://link.aps.org/doi/10.1103/PhysRevE.70.061507.
- Lascaris et al. (2014) Erik Lascaris, Mahin Hemmati, Sergey V. Buldyrev, H. Eugene Stanley, and C. Austen Angell. Search for a liquid-liquid critical point in models of silica. The Journal of Chemical Physics, 140(22):224502, 2014. doi:10.1063/1.4879057. URL https://doi.org/10.1063/1.4879057.
- Chen et al. (2017) Renjie Chen, Erik Lascaris, and Jeremy C. Palmer. Liquid–liquid phase transition in an ionic model of silica. The Journal of Chemical Physics, 146(23):234503, 2017. doi:10.1063/1.4984335. URL https://doi.org/10.1063/1.4984335.
- Trang et al. (2020) G T T Trang, P H Kien, P K Hung, and N V Hong. Molecular dynamics simulation of amorphous silica under pressures. Journal of Physics: Conference Series, 1506(1):012021, mar 2020. doi:10.1088/1742-6596/1506/1/012021. URL https://dx.doi.org/10.1088/1742-6596/1506/1/012021.
- Yu et al. (2022) Zheng Yu, Dane Morgan, M. D. Ediger, and Bu Wang. Understanding the fragile-to-strong transition in silica from microscopic dynamics. Phys. Rev. Lett., 129:018003, Jun 2022. doi:10.1103/PhysRevLett.129.018003. URL https://link.aps.org/doi/10.1103/PhysRevLett.129.018003.
- Zaghoo et al. (2016) Mohamed Zaghoo, Ashkan Salamat, and Isaac F. Silvera. Evidence of a first-order phase transition to metallic hydrogen. Phys. Rev. B, 93:155128, Apr 2016. doi:10.1103/PhysRevB.93.155128. URL https://link.aps.org/doi/10.1103/PhysRevB.93.155128.
- Fried et al. (2022) Nathaniel R. Fried, Thomas J. Longo, and Mikhail A. Anisimov. Thermodynamic modeling of fluid polyamorphism in hydrogen at extreme conditions. The Journal of Chemical Physics, 157(10):101101, 2022. doi:10.1063/5.0107043. URL https://doi.org/10.1063/5.0107043.
- Plašienka et al. (2015) Dušan Plašienka, Peter Cifra, and Roman Martoňák. Structural transformation between long and short-chain form of liquid sulfur from ab initio molecular dynamics. The Journal of Chemical Physics, 142(15):154502, 2015. doi:10.1063/1.4917040. URL https://doi.org/10.1063/1.4917040.
- Henry et al. (2020) Laura Henry, Mohamed Mezouar, Gaston Garbarino, David Sifré, Gunnar Weck, and Frédéric Datchi . Liquid–liquid transition and critical point in sulfur. Nature, 584:382–386, 2020. doi:10.1038/314076a0.
- Shumovskyi et al. (2022) Nikolay A. Shumovskyi, Thomas J. Longo, Sergey V. Buldyrev, and Mikhail A. Anisimov. Modeling fluid polyamorphism through a maximum-valence approach. Phys. Rev. E, 106:015305, Jul 2022. doi:10.1103/PhysRevE.106.015305. URL https://link.aps.org/doi/10.1103/PhysRevE.106.015305.
- Katayama et al. (2000) Yoshinori Katayama, Takeshi Mizutani, Wataru Utsumi, Osamu Shimomura, Masaaki Yamakata, and Ken ichi Funakoshi. A first-order liquid–liquid phase transition in phosphorus. Nature, 403:170–173, 2000. doi:10.1038/35003143.
- Katayama et al. (2004) Yoshinori Katayama, Yasuhiro Inamura, Takeshi Mizutani, Masaaki Yamakata, Wataru Utsumi, and Osamu Shimomura. Macroscopic separation of dense fluid phase and liquid phase of phosphorus. Science, 306(5697):848–851, 2004. doi:10.1126/science.1102735. URL https://www.science.org/doi/abs/10.1126/science.1102735.
- Yang et al. (2021) Manyi Yang, Tarak Karmakar, and Michele Parrinello. Liquid-liquid critical point in phosphorus. Phys. Rev. Lett., 127:080603, Aug 2021. doi:10.1103/PhysRevLett.127.080603. URL https://link.aps.org/doi/10.1103/PhysRevLett.127.080603.
- Glosli and Ree (1999) James N. Glosli and Francis H. Ree. Liquid-liquid phase transformation in carbon. Phys. Rev. Lett., 82:4659–4662, Jun 1999. doi:10.1103/PhysRevLett.82.4659. URL https://link.aps.org/doi/10.1103/PhysRevLett.82.4659.
- Sundqvist (2021) Bertil Sundqvist. Carbon under pressure. Physics Reports, 909:1–73, 2021. ISSN 0370-1573. doi:https://doi.org/10.1016/j.physrep.2020.12.007. URL https://www.sciencedirect.com/science/article/pii/S0370157320304385. Carbon under pressure.
- Tanaka et al. (2004) Hajime Tanaka, Rei Kurita, and Hiroshi Mataki. Liquid-liquid transition in the molecular liquid triphenyl phosphite. Phys. Rev. Lett., 92:025701, Jan 2004. doi:10.1103/PhysRevLett.92.025701. URL https://link.aps.org/doi/10.1103/PhysRevLett.92.025701.
- Liu et al. (2021) Yizhi Liu, Gang Sun, and Limei Xu. Glass polyamorphism in gallium: Two amorphous solid states and their transformation on the potential energy landscape. The Journal of Chemical Physics, 154(13):134503, 2021. doi:10.1063/5.0038058. URL https://doi.org/10.1063/5.0038058.
- Brazhkin et al. (1999) V.V Brazhkin, S.V Popova, and R.N Voloshin. Pressure–temperature phase diagram of molten elements: selenium, sulfur and iodine. Physica B: Condensed Matter, 265(1):64–71, 1999. ISSN 0921-4526. doi:https://doi.org/10.1016/S0921-4526(98)01318-0. URL https://www.sciencedirect.com/science/article/pii/S0921452698013180.
- Sheng et al. (2007) H. W. Sheng, H. Z. Liu, Y. Q. Cheng, J. Wen, P. L. Lee, W. K. Luo, S. D. Shastri, and E. Ma. Polyamorphism in a metallic glass. Nature Materials, 7:192–197, 2007. doi:10.1038/nmat1839.
- Greaves et al. (2008) G. N. Greaves, M. C. Wilding, S. Fearn, D. Langstaff, F. Kargl, S. Cox, Q. Vu Van, O. Majérus, C. J. Benmore, R. Weber, C. M. Martin, and L. Hennet. Detection of first-order liquid/liquid phase transitions in yttrium oxide-aluminum oxide melts. Science, 322(5901):566–570, 2008. doi:10.1126/science.1160766. URL https://www.science.org/doi/abs/10.1126/science.1160766.
- Li et al. (2022) Zhichao Li, Tao Li, Erli Ni, Jian Huang, Di Zhang, Junping Qian, and Hui Li. Liquid–liquid phase transition in metallic droplets. The Journal of Physical Chemistry A, 126(29):4772–4780, 2022. doi:10.1021/acs.jpca.2c03122. URL https://doi.org/10.1021/acs.jpca.2c03122. PMID: 35834351.
- Smith et al. (1995) K. H. Smith, E. Shero, A. Chizmeshya, and G. H. Wolf. The equation of state of polyamorphic germania glass: A two-domain description of the viscoelastic response. The Journal of Chemical Physics, 102(17):6851–6857, 1995. doi:10.1063/1.469122. URL https://doi.org/10.1063/1.469122.
- Sun et al. (2022) Peihao Sun, Giulio Monaco, Peter Zalden, Klaus Sokolowski-Tinten, Jerzy Antonowicz, Ryszard Sobierajski, Yukio Kajihara, Alfred Q. R. Baron, Paul Fuoss, Andrew Chihpin Chuang, Jun-Sang Park, Jonathan Almer, and J. B. Hastings. Structural changes across thermodynamic maxima in supercooled liquid tellurium: A water-like scenario. Proceedings of the National Academy of Sciences, 119(28):e2202044119, 2022. doi:10.1073/pnas.2202044119. URL https://www.pnas.org/doi/abs/10.1073/pnas.2202044119.
- Angell (1995) C. A. Angell. Formation of glasses from liquids and biopolymers. Science, 267(5206):1924–1935, 1995. doi:10.1126/science.267.5206.1924. URL https://www.science.org/doi/abs/10.1126/science.267.5206.1924.
- Rizzatti et al. (2019) Eduardo Osório Rizzatti, Márcio Sampaio Gomes Filho, Mariana Malard, and Marco Aurélio A. Barbosa. Waterlike anomalies in the bose–hubbard model. Physica A: Statistical Mechanics and its Applications, 518:323–330, 2019. ISSN 0378-4371. doi:https://doi.org/10.1016/j.physa.2018.12.003. URL https://www.sciencedirect.com/science/article/pii/S0378437118315085.
- Tanaka (2020) Hajime Tanaka. Liquid–liquid transition and polyamorphism. The Journal of Chemical Physics, 153(13):130901, 2020. doi:10.1063/5.0021045. URL https://doi.org/10.1063/5.0021045.
- Lucas (2021) Pierre Lucas. Fragile-to-strong transitions in glass forming liquids. Journal of Non-Crystalline Solids, 557:119367, 2021. ISSN 0022-3093. doi:https://doi.org/10.1016/j.jnoncrysol.2019.03.032. URL https://www.sciencedirect.com/science/article/pii/S0022309319301887.
- Desgranges and Delhommelle (2018) Caroline Desgranges and Jerome Delhommelle. Communication: Existence and control of liquid polymorphism in methanol under shear. The Journal of Chemical Physics, 149(11):111101, 2018. doi:10.1063/1.5052376. URL https://doi.org/10.1063/1.5052376.
- Gallo et al. (2021) Paola Gallo, Johannes Bachler, Livia E. Bove, Roland Böhmer, Gaia Camisasca, Luis E. Coronas, Horacio R. Corti, Ingrid de Almeida Ribeiro, Maurice de Koning, Giancarlo Franzese, Violeta Fuentes-Landete, Catalin Gainaru, Thomas Loerting, Joan Manuel Montes de Oca, Peter H. Poole, Mauro Rovere, Francesco Sciortino, Christina M. Tonauer, and Gustavo A. Appignanesi . Advances in the study of supercooled water. Eur. Phys. J. E, 44:143, 2021.
- Chaplin (2023) M. Chaplin. Anomalous properties of water. http://www.lsbu.ac.uk/water/anmlies.html, Jan 2023.
- Podgornik (2011) Rudolf Podgornik. Water and life: the unique properties of h2o: Ruth m. lynden-bell, simon conway morris, john d. barrow, john l. finney and charles harper (eds). crc press; 1 edition, 2010. Journal of Biological Physics, 37, 03 2011. doi:10.1007/s10867-011-9217-9.
- Kellu (1975) G. S Kellu. Density, thermal expansivity, and compressibility of liquid water from 0.deg. to 150.deg.. correlations and tables for atmospheric pressure and saturation reviewed and expressed on 1968 temperature scale. J. Chem. Eng. Data, 20:97–105, 1975.
- Liu et al. (2012) Y. Liu, J. C. Palmer, A. Z. Panagiotopoulos, and P. G. Debenedetti. Liquid-liquid transition in st2 water. J. Chem. Phys., 137:214505, 2012.
- Palmer et al. (2013) Jeremy C. Palmer, Roberto Car, and Pablo G. Debenedetti. The liquid–liquid transition in supercooled st2 water: a comparison between umbrella sampling and well-tempered metadynamics. Faraday Discuss., 167:77–94, 2013. doi:10.1039/C3FD00074E. URL http://dx.doi.org/10.1039/C3FD00074E.
- Palmer et al. (2018) Jeremy C. Palmer, Peter H. Poole, Francesco Sciortino, and Pablo G. Debenedetti. Advances in computational studies of the liquid–liquid transition in water and water-like models. Chemical Reviews, 118(18):9129–9151, 2018. doi:10.1021/acs.chemrev.8b00228. URL https://doi.org/10.1021/acs.chemrev.8b00228. PMID: 30152693.
- Chiu et al. (2013) Janet Chiu, Francis W. Starr, and Nicolas Giovambattista. Pressure-induced transformations in computer simulations of glassy water. The Journal of Chemical Physics, 139(18):184504, 2013. doi:10.1063/1.4829276. URL https://doi.org/10.1063/1.4829276.
- Abella et al. (2023) David Abella, Giancarlo Franzese, and Javier Hernández-Rojas. Many-body contributions in water nanoclusters. ACS Nano, -(-):null, 2023. doi:10.1021/acsnano.2c06077. URL https://doi.org/10.1021/acsnano.2c06077. PMID: 36695562.
- Vilaseca and Franzese (2011) Pol Vilaseca and Giancarlo Franzese. Isotropic soft-core potentials with two characteristic length scales and anomalous behaviour. Journal of Non-Crystalline Solids, 357:419–426, 01 2011. doi:10.1016/j.jnoncrysol.2010.07.053.
- Hemmer and Stell (1970) P. C. Hemmer and G. Stell. Fluids with several phase transitions. Phys. Rev. Lett., 24:1284–1287, Jun 1970. doi:10.1103/PhysRevLett.24.1284. URL https://link.aps.org/doi/10.1103/PhysRevLett.24.1284.
- Jagla (1998) E. A. Jagla. Phase behavior of a system of particles with core collapse. Phys. Rev. E, 58:1478, Aug. 1998.
- Jagla (1999) E. A. Jagla. Core-softened potentials and the anomalous properties of water. The Journal of Chemical Physics, 111(19):8980–8986, 1999.
- Xu et al. (2010) Limei Xu, Sergey V. Buldyrev, Nicolas Giovambattista, and H. Eugene Stanley. Liquid-liquid phase transition and glass transition in a monoatomic model system. International Journal of Molecular Sciences, 11(12):5184–5200, 2010. ISSN 1422-0067. doi:10.3390/ijms11125184. URL https://www.mdpi.com/1422-0067/11/12/5184.
- Gnan et al. (2014) Nicoletta Gnan, Gayatri Das, Matthias Sperl, Francesco Sciortino, and Emanuela Zaccarelli. Multiple glass singularities and isodynamics in a core-softened model for glass-forming systems. Phys. Rev. Lett., 113:258302, Dec 2014. doi:10.1103/PhysRevLett.113.258302. URL https://link.aps.org/doi/10.1103/PhysRevLett.113.258302.
- Xu (2019) Ning Xu. Phase behaviors of soft-core particle systems. Chinese Journal of Polymer Science volume, 37:1065–1082, 2019. doi:10.1007/s10118-019-2304-2.
- Dasgupta et al. (2020) Tonnishtha Dasgupta, Gabriele M. Coli, and Marjolein Dijkstra. Tuning the glass transition: Enhanced crystallization of the laves phases in nearly hard spheres. ACS Nano, 14(4):3957–3968, 2020. doi:10.1021/acsnano.9b07090. URL https://doi.org/10.1021/acsnano.9b07090. PMID: 32250589.
- Fomin (2020) Yu. D. Fomin. A comparison of dynamic properties of a core-softened system of particles across glass transition, melting and random tiling formation. Physics and Chemistry of Liquids, 58(3):290–301, 2020. doi:10.1080/00319104.2019.1698043. URL https://doi.org/10.1080/00319104.2019.1698043.
- Yan et al. (2006) Zhenyu Yan, Sergey V. Buldyrev, Nicolas Giovambattista, Pablo G. Debenedetti, and H. Eugene Stanley. Family of tunable spherically symmetric potentials that span the range from hard spheres to waterlike behavior. Phys. Rev. E, 73:051204, May 2006. doi:10.1103/PhysRevE.73.051204. URL https://link.aps.org/doi/10.1103/PhysRevE.73.051204.
- Gibson and Wilding (2006) H. M. Gibson and N. B. Wilding. Metastable liquid-liquid coexistence and density anomalies in a core-softened fluid. Phys. Rev. E, 73:061507, Jun 2006. doi:10.1103/PhysRevE.73.061507. URL https://link.aps.org/doi/10.1103/PhysRevE.73.061507.
- Franzese (2007) Giancarlo Franzese. Differences between discontinuous and continuous soft-core attractive potentials: The appearance of density anomaly. Journal of Molecular Liquids, 136(3):267 – 273, 2007. ISSN 0167-7322. doi:https://doi.org/10.1016/j.molliq.2007.08.021. URL http://www.sciencedirect.com/science/article/pii/S016773220700150X. EMLG/JMLG 2006.
- Xu et al. (2011) Limei Xu, Nicolas Giovambattista, Sergey V. Buldyrev, Pablo G. Debenedetti, and H. Eugene Stanley. Waterlike glass polyamorphism in a monoatomic isotropic jagla model. The Journal of Chemical Physics, 134(6):064507, 2011. doi:10.1063/1.3521486. URL https://doi.org/10.1063/1.3521486.
- Reisman and Giovambattista (2013) Shaina Reisman and Nicolas Giovambattista. Glass and liquid phase diagram of a polyamorphic monatomic system. The Journal of Chemical Physics, 138(6):064509, 2013. doi:10.1063/1.4790404. URL https://doi.org/10.1063/1.4790404.
- Das et al. (2013) Gayatri Das, Nicoletta Gnan, Francesco Sciortino, and Emanuela Zaccarelli. Unveiling the complex glassy dynamics of square shoulder systems: Simulations and theory. The Journal of Chemical Physics, 138(13):134501, 2013. doi:10.1063/1.4795837. URL https://doi.org/10.1063/1.4795837.
- Krott et al. (2015a) Leandro B. Krott, José Rafael Bordin, Ney M. Barraz, and Marcia C. Barbosa. Effects of confinement on anomalies and phase transitions of core-softened fluids. The Journal of Chemical Physics, 142(13):134502, 2015a. doi:10.1063/1.4916563. URL https://doi.org/10.1063/1.4916563.
- Bordin et al. (2015) José Rafael Bordin, Leandro B. Krott, and Marcia C. Barbosa. Self-assembly and water-like anomalies in janus nanoparticles. Langmuir, 31(31):8577–8582, 2015. doi:10.1021/acs.langmuir.5b01555. URL https://doi.org/10.1021/acs.langmuir.5b01555. PMID: 26190234.
- Bordin (2016) J.R. Bordin. Waterlike features, liquid-crystal phase and self-assembly in janus dumbbells. Physica A: Statistical Mechanics and its Applications, 459:1–8, 2016. cited By 14.
- Pinheiro et al. (2017) L. Pinheiro, A.P. Furlan, L.B. Krott, A. Diehl, and M.C. Barbosa. Critical points, phase transitions and water-like anomalies for an isotropic two length scale potential with increasing attractive well. Physica A: Statistical Mechanics and its Applications, 468:866–879, 2017. ISSN 0378-4371.
- de Haro et al. (2018) Mariano López de Haro, Álvaro Rodríguez-Rivas, Santos B. Yuste, and Andrés Santos. Structural properties of the jagla fluid. Phys. Rev. E, 98:012138, Jul 2018. doi:10.1103/PhysRevE.98.012138. URL https://link.aps.org/doi/10.1103/PhysRevE.98.012138.
- Higuchi et al. (2018) Saki Higuchi, Daiki Kato, Daisuke Awaji, and Kang Kim. Connecting thermodynamic and dynamical anomalies of water-like liquid-liquid phase transition in the fermi–jagla model. The Journal of Chemical Physics, 148(9):094507, 2018. doi:10.1063/1.5017105. URL https://doi.org/10.1063/1.5017105.
- Ryzhov et al. (2020) V N Ryzhov, E E Tareyeva, Yu D Fomin, and E N Tsiok. Complex phase diagrams of systems with isotropic potentials: results of computer simulations. Physics-Uspekhi, 63(5):417, aug 2020. doi:10.3367/UFNe.2018.04.038417. URL https://dx.doi.org/10.3367/UFNe.2018.04.038417.
- Martín-Roca et al. (2022) José Martín-Roca, Raúl Martinez, Fernando Martínez-Pedrero, Jorge Ramírez, and Chantal Valeriani. Dynamical anomalies and structural features of active brownian particles characterized by two repulsive length scales. The Journal of Chemical Physics, 156(16):164502, 2022. doi:10.1063/5.0087601. URL https://doi.org/10.1063/5.0087601.
- Bretonnet and Bomont (2022) Jean-Louis Bretonnet and Jean-Marc Bomont. Analytical treatment of the structure for systems interacting via core-softened potentials. Chemical Physics, 555:111445, 2022. ISSN 0301-0104. doi:https://doi.org/10.1016/j.chemphys.2021.111445. URL https://www.sciencedirect.com/science/article/pii/S0301010421003566.
- Likos (2001) Christos N. Likos. Effective interactions in soft condensed matter physics. Physics Reports, 348(4):267–439, 2001. ISSN 0370-1573. doi:https://doi.org/10.1016/S0370-1573(00)00141-1. URL https://www.sciencedirect.com/science/article/pii/S0370157300001411.
- Quesada-Perez et al. (2001) M. Quesada-Perez, A. Moncho-Jorda, F. Martinez-Lopez, and R. Hidalgo-Álvarez. Probing interaction forces in colloidal monolayers: Inversion of structural data. Journal of Chemical Physics, 115:10897, 2001.
- Contreras-Aburto and amd R.C. Priego (2010) C. Contreras-Aburto and J.M. Méndez-Alcaraz amd R.C. Priego. Structure and effective interactions in parallel monolayers of charged spherical colloids. Journal of Chemical Physics, 132:174111, 2010.
- Haddadi et al. (2020) Sara Haddadi, Marie Skepö, Patric Jannasch, Sophie Manner, and Jan Forsman. Building polymer-like clusters from colloidal particles with isotropic interactions, in aqueous solution. Journal of Colloid and Interface Science, 581:669–681, 2020.
- S. Marques et al. (2020) Murilo S. Marques, Thiago P. O. Nogueira, Rodrigo F. Dillenburg, Marcia C. Barbosa, and José Rafael Bordin. Waterlike anomalies in hard core–soft shell nanoparticles using an effective potential approach: Pinned vs adsorbed polymers. Journal of Applied Physics, 127(5):054701, 2020. doi:10.1063/1.5128938. URL https://doi.org/10.1063/1.5128938.
- Lafitte et al. (2014) Thomas Lafitte, Sanat K. Kumar, and Athanassios Z. Panagiotopoulos. Self-assembly of polymer-grafted nanoparticles in thin films. Soft Matter, 10(5):786–794, 2014. ISSN 1744683X.
- Bos et al. (2019) Inge Bos, Pieter van der Scheer, Wouter G. Ellenbroek, and Joris Sprakel. Two-dimensional crystals of star polymers: a tale of tails. Soft Matter, 15:615–622, 2019.
- Quigley and Probert (2005) D Quigley and M. I. J. Probert. Phase behavior of a three-dimensional core-softened model system. Phys. Rev. E, 71:065701, Jun 2005. doi:10.1103/PhysRevE.71.065701. URL https://link.aps.org/doi/10.1103/PhysRevE.71.065701.
- de Oliveira et al. (2008) Alan Barros de Oliveira, Giancarlo Franzese, Paulo A. Netz, and Marcia C. Barbosa. Waterlike hierarchy of anomalies in a continuous spherical shouldered potential. The Journal of Chemical Physics, 128(6):064901, 2008. doi:10.1063/1.2830706. URL https://doi.org/10.1063/1.2830706.
- da Silva et al. (2010) Jonathas Nunes da Silva, Evy Salcedo, Alan Barros de Oliveira, and Marcia C. Barbosa. Effects of the attractive interactions in the thermodynamic, dynamic, and structural anomalies of a two length scale potential. The Journal of Chemical Physics, 133(24):244506, 2010. doi:10.1063/1.3511704. URL https://doi.org/10.1063/1.3511704.
- Barraz et al. (2009) Ney M. Barraz, Evy Salcedo, and Marcia C. Barbosa. Thermodynamic, dynamic, and structural anomalies for shoulderlike potentials. The Journal of Chemical Physics, 131(9):094504, 2009. doi:10.1063/1.3213615. URL https://aip.scitation.org/doi/abs/10.1063/1.3213615.
- Marques et al. (2020) Murilo Sodré Marques, Vinicius Fonseca Hernandes, Enrique Lomba, and José Rafael Bordin. Competing interactions near the liquid-liquid phase transition of core-softened water/methanol mixtures. Journal of Molecular Liquids, 320:114420, 2020. ISSN 0167-7322. doi:https://doi.org/10.1016/j.molliq.2020.114420. URL http://www.sciencedirect.com/science/article/pii/S0167732220354945.
- Marques et al. (2021) Murilo S. Marques, Vinicius F. Hernandes, and José Rafael Bordin. Core-softened water–alcohol mixtures: the solute-size effects. Phys. Chem. Chem. Phys., 23:16213–16223, 2021.
- de Oliveira et al. (2006) Alan Barros de Oliveira, Paulo A. Netz, Thiago Colla, and Marcia C. Barbosa. Structural anomalies for a three dimensional isotropic core-softened potential. The Journal of Chemical Physics, 125(12):124503, 2006. doi:10.1063/1.2357119. URL https://doi.org/10.1063/1.2357119.
- Barros De Oliveira et al. (2006) Alan Barros De Oliveira, Paulo A. Netz, Thiago Colla, and Marcia C. Barbosa. Thermodynamic and dynamic anomalies for a three-dimensional isotropic core-softened potential. Journal of Chemical Physics, 124(8):64901, 2006. ISSN 00219606.
- De Oliveira et al. (2006) Alan Barros De Oliveira, Paulo A. Netz, Thiago Colla, and Marcia C. Barbosa. Structural anomalies for a three dimensional isotropic core-softened potential. Journal of Chemical Physics, 125(12):124503, sep 2006. ISSN 00219606.
- Scott et al. (1991) R. Scott, M. P. Allen, and D. J. Tildesley. Computer Simulation of Liquids., volume 57. Oxford university press, 1991.
- Bordin and Barbosa (2018) José Rafael Bordin and Marcia C. Barbosa. Waterlike anomalies in a two-dimensional core-softened potential. Physical Review E, 97(2):022604, feb 2018. ISSN 2470-0045.
- Barros De Oliveira et al. (2010) Alan Barros De Oliveira, Evy Salcedo, Charusita Chakravarty, and Marcia C. Barbosa. Entropy, diffusivity and the energy landscape of a waterlike fluid. Journal of Chemical Physics, 132(23):234509, jun 2010. ISSN 00219606.
- Limbach et al. (2006) H.J. Limbach, A. Arnold, B.A. Mann, and C. Holm. Espresso—an extensible simulation package for research on soft matter systems. Computer Physics Communications, 174(9):704 – 727, 2006. ISSN 0010-4655. doi:https://doi.org/10.1016/j.cpc.2005.10.005. URL http://www.sciencedirect.com/science/article/pii/S001046550500576X.
- Arnold et al. (2013) Axel Arnold, Olaf Lenz, Stefan Kesselheim, Rudolf Weeber, Florian Fahrenberger, Dominic Roehm, Peter Košovan, and Christian Holm. Espresso 3.1: Molecular dynamics software for coarse-grained models. In Michael Griebel and Marc Alexander Schweitzer, editors, Meshfree Methods for Partial Differential Equations VI, pages 1–23, Berlin, Heidelberg, 2013. Springer Berlin Heidelberg. ISBN 978-3-642-32979-1.
- Allen et al. (2017) M.P. Allen, D.J. Tildesley, and D.J. Tildesley. Computer Simulation of Liquids. Oxford University Press, 2017. ISBN 9780198803195. URL https://books.google.com.br/books?id=nlExDwAAQBAJ.
- Krott and Bordin (2013) Leandro B. Krott and José Rafael Bordin. Distinct dynamical and structural properties of a core-softened fluid when confined between fluctuating and fixed walls. Journal of Chemical Physics, 139(15):154502, oct 2013. ISSN 00219606.
- Krott et al. (2015b) Leandro B. Krott, José Rafael Bordin, and Marcia C. Barbosa. New structural anomaly induced by nanoconfinement. Journal of Physical Chemistry B, 119(1):291–300, 2015b. ISSN 15205207.
- Frenkel and Smit (1996) D. Frenkel and B. Smit. Understanding Molecular Simulation. Academic Press, San Diego, 1st edition, 1996.
- Tuckerman (2010) M.E. Tuckerman. Statistical Mechanics: Theory and Molecular Simulation. Oxford graduate texts. Oxford University Press, 2010. URL https://books.google.com.br/books?id=UMM2NAEACAAJ.
- Dzugutov (1996) M. Dzugutov. Universal scaling law for atomic diffusion in condensed matter. Nature, 381:137–139, 05 1996. doi:10.1038/381137a0.
- Dyre (2018) Jeppe C. Dyre. Perspective: Excess-entropy scaling. The Journal of Chemical Physics, 149(21):210901, 2018. doi:10.1063/1.5055064. URL https://doi.org/10.1063/1.5055064.
- Bell et al. (2020) Ian Bell, Jeppe Dyre, and Trond Ingebrigtsen. Excess-entropy scaling in supercooled binary mixtures. Nature Communications, 2020(11):015012, 08 2020. ISSN 2041-1723. doi:10.1038/s41467-020-17948-1.
- Galliero et al. (2011) Guillaume Galliero, Christian Boned, and Josefa Fernández. Scaling of the viscosity of the lennard-jones chain fluid model, argon, and some normal alkanes. The Journal of Chemical Physics, 134(6):064505, 2011. doi:10.1063/1.3553262. URL https://doi.org/10.1063/1.3553262.
- Raveché (1971) Harold J. Raveché. Entropy and molecular correlation functions in open systems. i. derivation. The Journal of Chemical Physics, 55(5):2242–2250, 1971. doi:10.1063/1.1676399. URL https://doi.org/10.1063/1.1676399.
- Baranyai and Evans (1989) Andras Baranyai and Denis J. Evans. Direct entropy calculation from computer simulation of liquids. Physical Review A, 40(7):3817–3822, 1989. ISSN 10502947.
- Sharma et al. (2006) Ruchi Sharma, Somendra Nath Chakraborty, and Charusita Chakravarty. Entropy, diffusivity, and structural order in liquids with waterlike anomalies. Journal of Chemical Physics, 125(20):204501, nov 2006. ISSN 00219606.
- Krekelberg et al. (2008) William P. Krekelberg, Jeetain Mittal, Venkat Ganesan, and Thomas M. Truskett. Structural anomalies of fluids: Origins in second and higher coordination shells. Phys. Rev. E, 77:041201, Apr 2008. doi:10.1103/PhysRevE.77.041201. URL https://link.aps.org/doi/10.1103/PhysRevE.77.041201.
- Cardoso et al. (2021) Daniel Souza Cardoso, Vinicius Fonseca Hernandes, T.P.O. Nogueira, and José Rafael Bordin. Structural behavior of a two length scale core-softened fluid in two dimensions. Physica A: Statistical Mechanics and its Applications, 566:125628, 2021. ISSN 0378-4371. doi:https://doi.org/10.1016/j.physa.2020.125628. URL https://www.sciencedirect.com/science/article/pii/S0378437120309262.
- Errington and Debenedetti (2001) J. R. Errington and P. D. Debenedetti. Relationship between structural order and the anomalies of liquid water. Nature (London), 409:318, Jan. 2001.
- Steinhardt et al. (1983) Paul J. Steinhardt, David R. Nelson, and Marco Ronchetti. Bond-orientational order in liquids and glasses. Phys. Rev. B, 28:784–805, Jul 1983. doi:10.1103/PhysRevB.28.784. URL https://link.aps.org/doi/10.1103/PhysRevB.28.784.
- Yan et al. (2005) Zhenyu Yan, Sergey V. Buldyrev, Nicolas Giovambattista, and H. Eugene Stanley. Structural order for one-scale and two-scale potentials. Phys. Rev. Lett., 95:130604, Sep 2005. doi:10.1103/PhysRevLett.95.130604. URL https://link.aps.org/doi/10.1103/PhysRevLett.95.130604.
- Ramasubramani et al. (2020) Vyas Ramasubramani, Bradley D. Dice, Eric S. Harper, Matthew P. Spellings, Joshua A. Anderson, and Sharon C. Glotzer. freud: A software suite for high throughput analysis of particle simulation data. Computer Physics Communications, 254:107275, 2020. ISSN 00104655.
- Rycroft (2009) Chris H. Rycroft. Voro++: A three-dimensional voronoi cell library in c++. Chaos: An Interdisciplinary Journal of Nonlinear Science, 19(4):041111, 2009. doi:10.1063/1.3215722. URL https://doi.org/10.1063/1.3215722.
- Vilaseca and Franzese (2010) Pol Vilaseca and Giancarlo Franzese. Softness dependence of the anomalies for the continuous shouldered well potential. The Journal of Chemical Physics, 133(8):084507, 2010. doi:10.1063/1.3463424. URL https://doi.org/10.1063/1.3463424.
- Larsen et al. (2016) Peter Mahler Larsen, Søren Schmidt, and Jakob Schiøtz. Robust structural identification via polyhedral template matching. Modelling and Simulation in Materials Science and Engineering, 24(5):055007, may 2016. doi:10.1088/0965-0393/24/5/055007. URL https://doi.org/10.1088%2F0965-0393%2F24%2F5%2F055007.
- Stukowski (2010) Alexander Stukowski. Visualization and analysis of atomistic simulation data with OVITO - the Open Visualization Tool. Modelling and Simulation in Materials Science and Engineering, 18(1):015012, JAN 2010. ISSN 0965-0393. doi:10.1088/0965-0393/18/1/015012.
- Oliveira et al. (2008) Alan Oliveira, Paulo Netz, and Marcia Barbosa. Which mechanism underlies the water-like anomalies in core-softened potentials? The European Physical Journal B, 64:481–486, 01 2008. doi:10.1140/epjb/e2008-00101-6.
- Nogueira and Bordin (2022) T.P.O. Nogueira and José Rafael Bordin. Patterns in 2d core-softened systems: From sphere to dumbbell colloids. Physica A: Statistical Mechanics and its Applications, 605:128048, 2022. ISSN 0378-4371. doi:https://doi.org/10.1016/j.physa.2022.128048. URL https://www.sciencedirect.com/science/article/pii/S0378437122006550.
- Lechner and Dellago (2008) Wolfgang Lechner and Christoph Dellago. Accurate determination of crystal structures based on averaged local bond order parameters. The Journal of Chemical Physics, 129(11):114707, 2008. doi:10.1063/1.2977970. URL https://doi.org/10.1063/1.2977970.
- Eslami et al. (2018) Hossein Eslami, Parvin Sedaghat, and Florian Müller-Plathe. Local bond order parameters for accurate determination of crystal structures in two and three dimensions. Phys. Chem. Chem. Phys., 20:27059–27068, 2018. doi:10.1039/C8CP05248D. URL http://dx.doi.org/10.1039/C8CP05248D.
- Geiger and Dellago (2013) Philipp Geiger and Christoph Dellago. Neural networks for local structure detection in polymorphic systems. The Journal of Chemical Physics, 139(16):164105, 2013. doi:10.1063/1.4825111. URL https://doi.org/10.1063/1.4825111.
- Boattini et al. (2018) Emanuele Boattini, Michel Ram, Frank Smallenburg, and Laura Filion. Neural-network-based order parameters for classification of binary hard-sphere crystal structures. Molecular Physics, 116(21-22):3066–3075, 2018. doi:10.1080/00268976.2018.1483537. URL https://doi.org/10.1080/00268976.2018.1483537.
- Boattini et al. (2019) Emanuele Boattini, Marjolein Dijkstra, and Laura Filion. Unsupervised learning for local structure detection in colloidal systems. The Journal of Chemical Physics, 151(15):154901, 2019. doi:10.1063/1.5118867.