Rearrangements during slow compression of a jammed two-dimensional emulsion
Abstract
As amorphous materials get jammed, both geometric and dynamic heterogeneity are observed. We investigate the correlation between the local geometric heterogeneity and local rearrangements in a slowly compressed bidisperse quasi-two-dimensional emulsion system. The compression is driven by evaporation of the continuous phase, and causes the area packing fraction to increase from 0.88 to 0.99. We quantify the structural heterogeneity of the system using the radical Voronoi tessellation following the method of [Rieser et al., Phys. Rev. Lett. 116, 088001 (2016)]. We define two structural quantities characterizing local structure, the first which considers nearest neighbors and the second of which includes information from second nearest neighbors. We find that droplets in heterogeneous local regions are more likely to have local rearrangements. These rearrangements are generally T1 events where two droplets converge toward a void, and two droplets move away from the void to make room for the converging droplets. Thus the presence of the voids tends to orient the T1 events. The presence of a correlation between the structural quantities and the rearrangement dynamics remains qualitatively unchanged over the entire range of packing fractions observed.
I Introduction
There are a variety of soft amorphous solids: for example, emulsions, foams, and colloids. An emulsion is composed of droplets of one liquid immersed in a second immiscible liquid, with the droplets coated with surfactant molecules to prevent droplet coalescence. A foam is similar except with gas bubbles. A colloid is composed of solid particles in a liquid. In all of these cases, these materials become “jammed” as the packing fraction of the systems increases [1]. The control parameter is the volume fraction (or area fraction for two-dimensional systems). For a foam, for example, if the gas volume fraction is above about , the foam has a yield stress and can form a pile on the table [2, 3, 4]; this identifies as the jamming volume fraction. In contrast to solids which crystallize, the structure of these jammed solids is amorphous and thus spatially heterogeneous [5, 6].
Even though such materials have a yield stress, emulsions and foams are composed of soft components (bubbles, droplets) and thus can be forced to flow at high [7, 8, 9, 10, 11, 12, 13, 14]. Given the structural disorder and the fact that flowing requires the component particles to move past one another, it is not surprising that the flow is highly disordered and involves particles moving and rearranging collectively [15]. It also is sensible that there can be some connection between local structure and local dynamics [6, 16, 17, 18, 19]. Much of the prior work was done at constant density, leaving an open question as to what are useful ways to characterize structure that are density-independent (although see Ref. [20] for recent work applying machine learning across a range of densities).
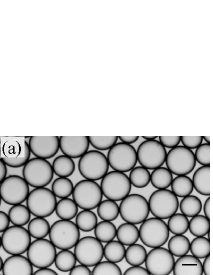
In this manuscript, we study a quasi-two-dimensional emulsion sample composed of oil droplets in water. The water is allowed to slowly evaporate so that we can study the rearrangements that occur as the area fraction increases from (just above jamming) to (overjammed), as shown in Fig. 1. We characterize the structural heterogeneity of the jamming emulsions using structural quantities proposed by Rieser et al. [21]. These quantities derive from the radical Voronoi tessellation, and account for the structure of first nearest neighbors, or both first and second nearest neighbors. We observe correlations between structural measures indicating voids between droplets, and the rearrangements those droplets exhibit. As is expected, droplets are more likely to move if they are near voids. However, in particular we note that droplets tend to move with definite orientations relative to those voids. Intriguingly, we demonstrate that the correlations between structure and motion stay qualitatively (and in some cases quantitatively) similar even as the area fraction changes significantly. This shows the utility of the structural measures introduced by Rieser et al.
II Experimental methods
We use emulsions for several reasons. First, they are relatively inexpensive samples to produce [22, 23]. Second, we can achieve values of well above jamming as the droplets can deform [24]. Third, we can exploit evaporation to slowly change in situ. Fourth, unlike foams, the emulsion samples do not coarsen – the volume in each oil droplet remains constant throughout the experiment.
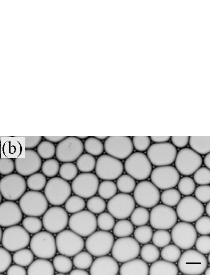
Our emulsions are mixtures of water and silicon oil droplets using Fairy detergent (mass fraction 0.025) as a surfactant to stabilize the droplets against coalescence. The oil droplets are generated using a standard co-flow microfluidic technique [25]. We make bidisperse emulsions with two batches of monodispersed droplets at a volume ratio of about 1:1; thus the small droplets are more numerous. The droplets are then placed in a quasi-two-dimensional (quasi-2D) sample chamber and deform into pancake shapes [24, 11]. We make our sample chamber with two 25 mm 75 mm microscope glass slides separated by 100 m thick spacers (transparency film) sealed with epoxy. The spacers with the epoxy create a gap of 120 m between the two glass slides. The spacers are cut with a central circular space to contain the sample, and two smaller openings at the sides for evaporation; see Fig. 2.
The mean 2D diameters of the small droplets and the large droplets are 265 m and 379 m respectively, resulting in a size ratio of about . The individual droplet species have a polydispersity (standard deviation of droplet radii divided by mean radius) of 4% and 2% for small and large droplets. The diameters are well defined at the start of the experiment (), and as the droplets compress into polygons, the diameter defined as stays similar for each droplet as compared to its earlier value. The data to be presented are from one experimental run. In this sample, there is additionally one unusually large droplet with diameter 883 m, formed likely due to coalescence of droplets prior to adding the sample to the microscope slide. All droplet diameters are larger than the sample chamber thickness, ensuring that the sample is quasi-2D.
After the sample chamber is filled, it is placed on a microscope for imaging with a objective lens. A 1280 1024 pixel image is recorded every 30 seconds with a camera mounted on the microscope for 100 minutes. The field of view is 6.07 4.85 and is comprised of over 300 droplets. We track the trajectories of all the droplets using standard techniques [26, 11]. Our particle position uncertainty is m.
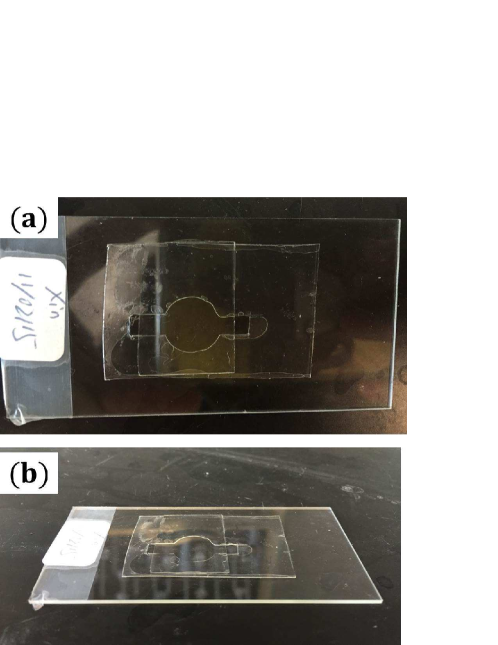
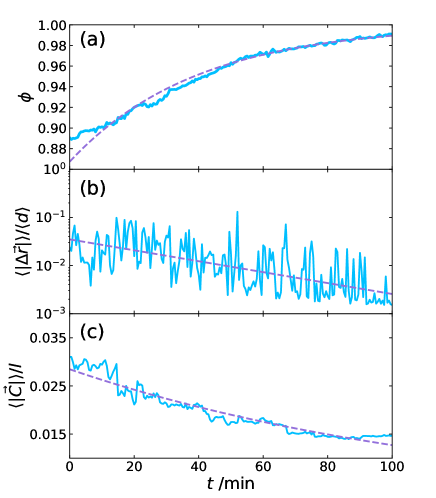
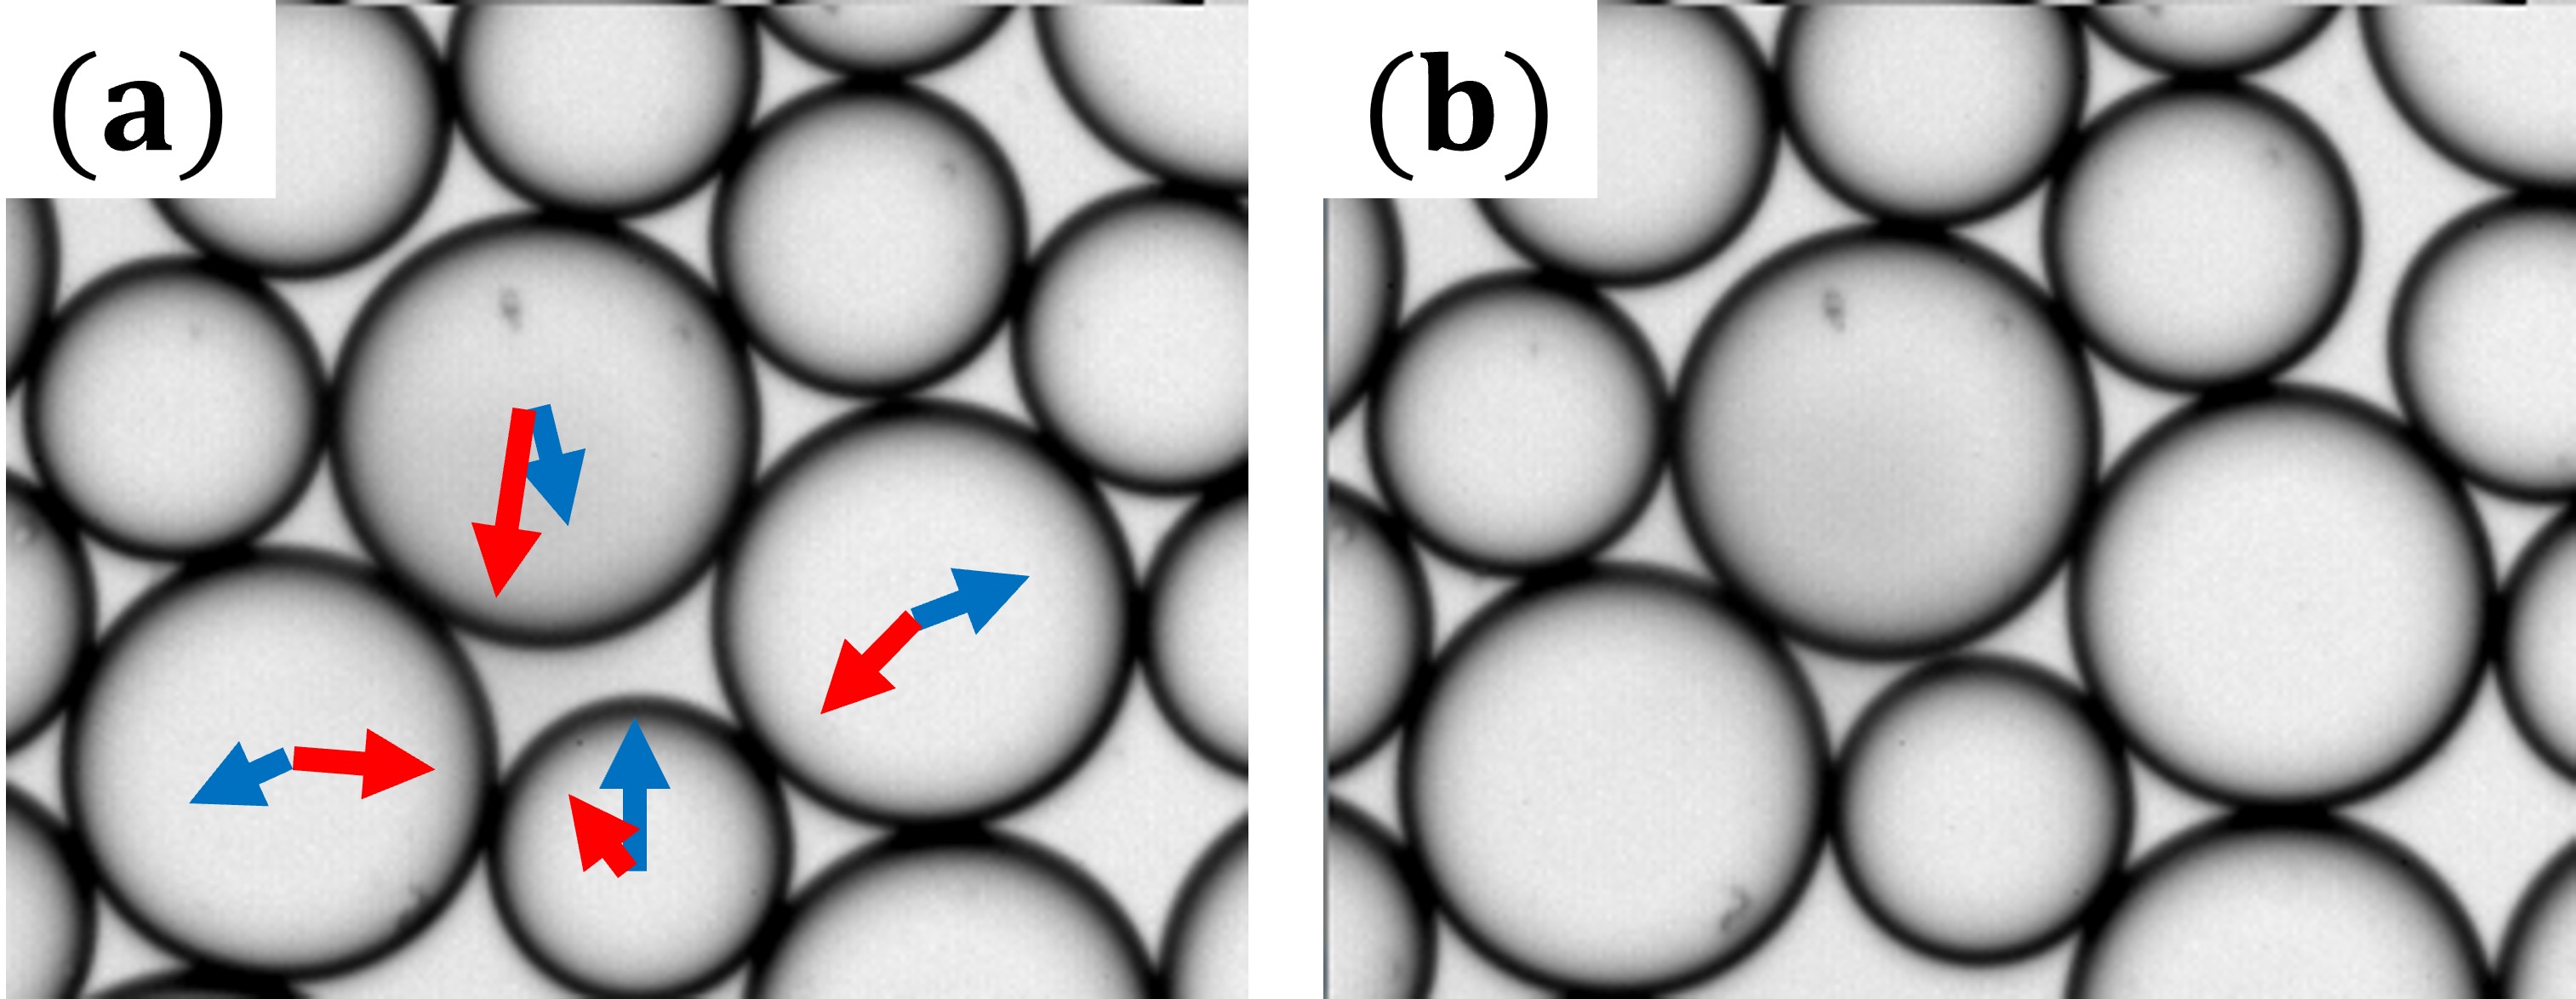
To slowly drive rearrangements, we allow water to evaporate from the two sample chamber openings. Over the course of the experiment, the sample transitions from less jammed to well overjammed with the packing fraction increasing from 0.88 to 1.00. (The sample is expected to jam at [27, 28, 29].) Images from the beginning and end of the experiment are shown in Fig. 1(a,b). In panel (a), the droplets are randomly close packed and barely deform at s. At min in Fig. 1(b), the droplets are deformed into non-circular shapes, some of which are close to polygons. As the area fraction slowly increases, droplets deform and occasionally rearrange. The area fraction as a function of time is plotted in Fig. 3(a). The data for is well fit by an exponential function, although we do not know of a particular reason that it should be an exponential. It is plausible that as increases, the remaining small amount of water finds it harder to travel through the smaller channels between droplets, thus decreasing the evaporation rate. The fitted decay time of 39 min quantifies the slow speed at which the sample changes. This time scale can be compared to previously observed droplet motion time scales: droplet rearrangements in a slowly driven quasi-2D emulsion similar to our sample occurred on time scales of a few seconds [11]. This suggests that the area fraction of our experiment increases quite slowly compared to the time scale for any rearrangements that are caused by that area fraction change.
III Results
Our goal is to understand how local structure influences where the occasional droplet rearrangements occur. We first need to quantify rearrangements and do so by calculating the displacement of each droplet, using the time scale s. There is a difficulty with this definition: occasionally large groups of droplets all move collectively – but these are motions relative to the camera, not relative to each other. Accordingly, we quantify the motion using the concept of the cage-relative displacement [30]. The cage-relative displacement is defined as the displacement of a droplet relative to the average displacement of its nearest neighbors, where we define nearest neighbors through a radical Voronoi tessellation (discussed further below). Thus, these displacements quantify rearrangements of droplets relative to their neighbors rather than collective motions. In the remainder of this paper, we will use to refer to the cage-relative displacements. Figure 3(c) is the plot of the average cage-relative displacement of the droplets rescaled by the mean diameter of all the droplets m. In general the average local movement of the droplets, , gradually slows down, but with many fluctuations. In some moments the movements are dramatically larger than the others, revealing the temporal dynamic heterogeneity through the entire compression process.
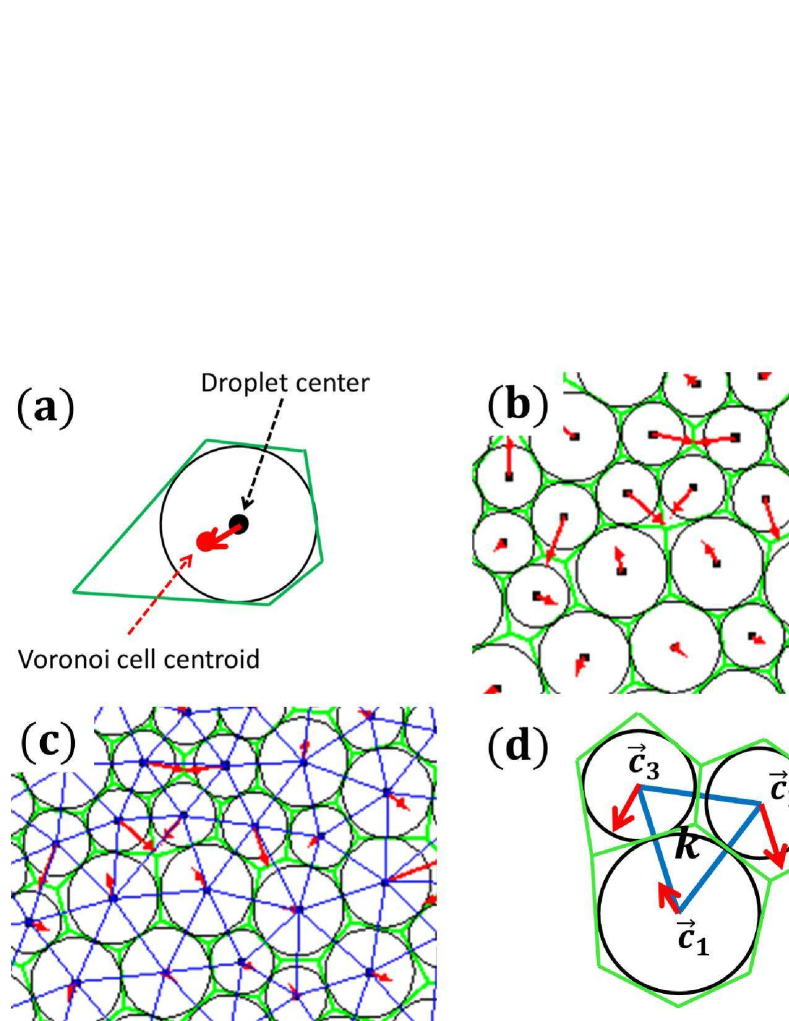
We next wish to quantify the local structure so as to determine what features of the structure influence the cage-relative motions. We quantitatively characterize the local geometric heterogeneity of the system based on radical Voronoi tessellation. The radical Voronoi tessellation is a standard partition of space which takes into account the radius of each droplet, and which highlights the closest free space near each droplet. We start by determining the radical Voronoi cell for each droplet, which is displayed as the green polygons in Fig. 4. Then, we define the anisotropy vector as the vector pointing from the droplet centroid to the Voronoi cell centroid, displayed as the red arrows in Fig. 4. The magnitude of anisotropy vector is zero if the free space is homogeneously distributed near a droplet. Thus, the length of anisotropy vector, , represents the geometric heterogeneity of the nearest neighborhood of a droplet.
As the sample area fraction increases over time, the average vector lengths decrease. However, there are two potential reasons for this decrease: the sample could be restructuring in interesting ways, or the droplets could merely be moving closer together (consistent with the increasing area fraction) and thus the size of the Voronoi cells decreases. To remove the trivial geometric effect of droplets getting close together, we divide by the typical distance between droplets , which is the square root of the inverted number density of the droplets in each packing. Thus, quantifies the local geometric heterogeneity of a droplet. In our experiment of the droplets ranges from to . The average of this quantity decreases roughly exponentially with time, as shown in Fig. 3(b). Given the normalization by , this remaining time dependence reflects that the structure becomes more homogeneous as increases: droplets are more likely to reside close to the centers of their Voronoi polygons.
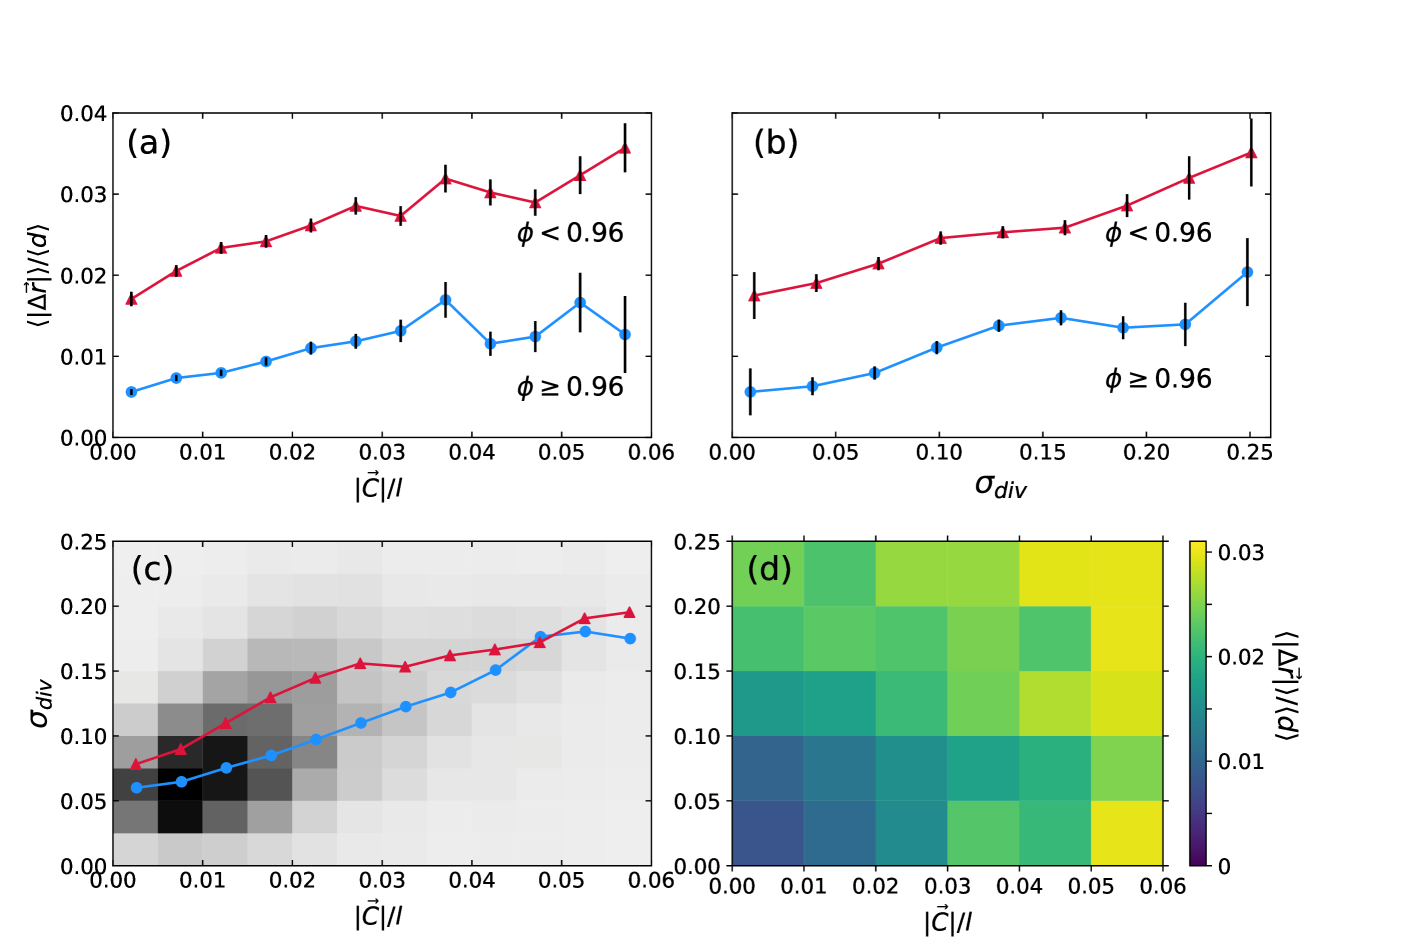
Given that a droplet with larger than average is in a more geometrically heterogeneous environment – and in particular has a larger void in the direction of – we conjecture that the value of is positively correlated with motion. Figure 5(a) shows that this conjecture is true: droplets with larger exhibit faster motion on average in both less jammed (red curve with ) and overjammed (blue curve with ) packings. The droplets’ motion, , is the cage-relative displacement of a droplet within s rescaled by the average diameter of the droplets. During jamming, the droplets move faster if they reside in a heterogeneous nearest neighborhood. The top curve in Fig. 5(a) corresponds to the low area fraction data (, roughly the first half of the experiment) when motion is faster than the high area fraction data shown in the bottom curve. While the overall magnitude of cage-relative motion decreases over the course of the experiment, the qualitative relation between the magnitude of the motion and the structural quantity stays similar. This result is qualitatively similar to prior observations of dense amorphous systems which found connections between locally heterogeneous environments and enhanced likelihood of motion [31, 32, 33, 34].
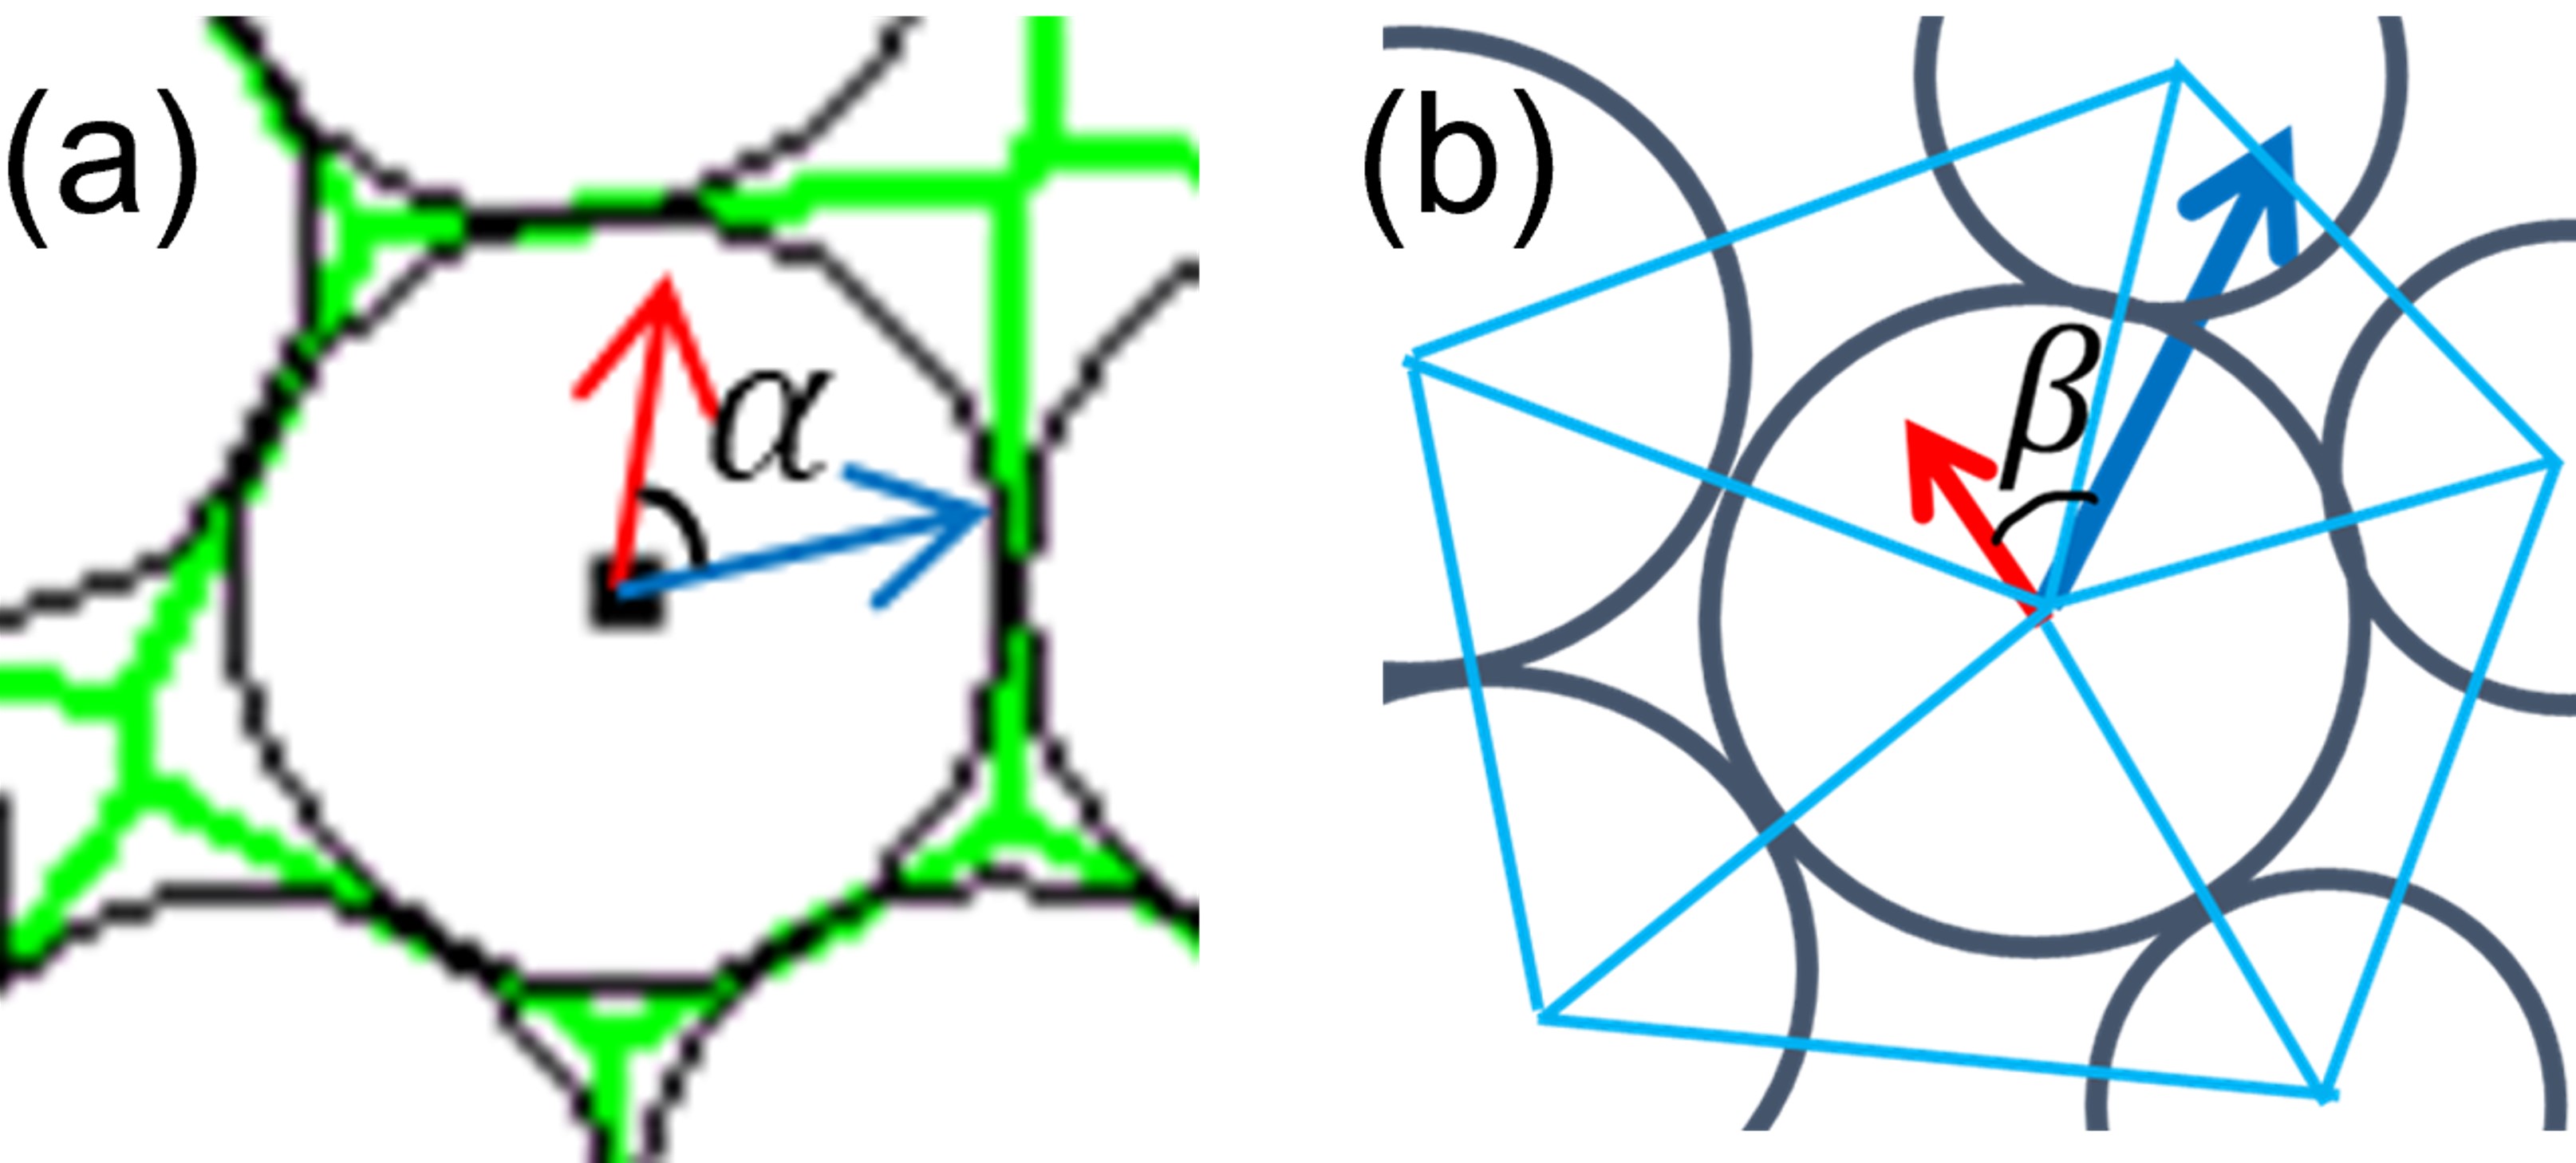
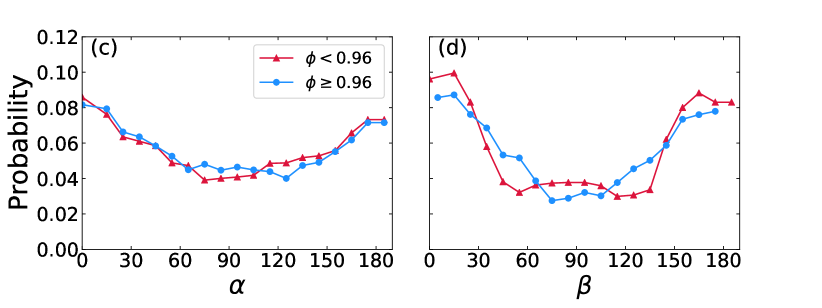
Given that has information about a droplet’s neighbors (through the radial Voronoi tessellation), droplets may move in a direction influenced by . As is shown in Fig. 4(b), the anisotropy vector of a droplet typically points towards the free space in its nearest neighborhood. As increases, the droplets tend to fill in the free space and get closer to the neighbors. We calculate the angle between and the cage-relative displacement of each droplet; see the sketch in Fig. 6(a). The probability distribution of , as is shown in Fig. 6(c), peaks at ranges of and with probability and respectively. This is true in both packings that are less jammed (red curve with ) and overjammed (blue curve with ). In other words, the droplets are likely to move towards the direction of with , or to the opposite direction with . This experimental phenomenon can be well explained with T1 topological neighbor-exchanging events [35, 4, 36, 37, 38, 39, 40, 8, 41, 11]. In a T1 rearrangement, two droplets move inward to fill in the free space (), and the other two move outward (), as shown in Fig. 7. Thus, not only does a large Voronoi anisotropy vector make it more likely that a droplet rearranges, it also influences the direction of that rearrangement. The motion with is similar to that observed in prior work which studied motion in a 3D granular packing [42]; however, they did not observe the motion, perhaps because T1 events are more complex in 3D materials.
Rieser et al. note that the anisotropy vectors “tend to point in toward locally less well-packed and away from locally more well-packed regions of the packing, reminiscent of sinks and sources in a vector field” [21]. Accordingly, they examined the divergence of the anisotropy vector field as a way to characterize voids in the packing, which we will now do with our droplet data. As is illustrated in Fig. 4(c), the 2D packing is partitioned into many local regions based on Delaunay triangulation (the blue lines). The vertices of a Delaunay triangle are the centers of three neighboring droplets corresponding to three anisotropy vectors, shown in Fig. 4(d). We choose the Delaunay triangle as the local region, and calculate the divergence of the three anisotropy vectors in each Delaunay triangle. We weight the result with the area of each triangle divided by the mean area of all of the triangles, resulting in the final quantity considered by Rieser et al.,
| (1) |
where is the interpolated field of anisotropy vectors [21]. is a dimensionless quantity that represents the geometric property of the corresponding local region defined by the Delaunay triangle . Positive (negative) values indicates overpacked (underpacked) regions. As was true for Rieser et al., the distribution of has a zero mean, is nearly Gaussian, but has a slight negative skewness: the underpacked areas () are more probable than would be expected for a perfect Gaussian [21]. Also in agreement with the results of Rieser et al., the standard deviation of the distribution decreases as the area fraction increases (data not shown).
As displayed in Fig. 4(c), each droplet is the surrounded by several Delaunay triangles, which corresponds to several local divergence . We next compute the standard deviation of the several surrounding each droplet. Each anisotropy vector represents structural information for a droplet and all of its nearest neighbors, and each uses information from a droplet’s and the of its nearest neighbors. Accordingly, is determined by both the and order nearest neighbors, and represents the structural character of a larger neighborhood than . Large indicates that the droplet resides in a heterogeneous local structure and small indicates a homogeneous local structure.
As we can see from Fig. 5(b), the droplets with larger move faster on average in both less jammed and overjammed packs. At this point this is expected: large is another way to note that a particle is in a spatially heterogeneous environment, much as does. Thus it is reasonable that the trend of the curves in Fig. 5(a,b) are similar: both and influence particle rearrangements. We might thus also expect that the ’s have some directional information, like . Among the several Delaunay triangles surrounding a droplet, the one with smallest is the most underpacked region near the droplet. As increases, in general, the droplets move to fill in the underpacked regions. To investigate how relates to the direction of droplet’s motion, we define the angle as the angle between and the direction of the mass center of the Delaunay triangle with the smallest . This angle is sketched in Fig. 6(b). The probability distribution of , Fig. 6(d), peaks at ranges of and with probability and in both jammed and over-jammed packings. As with the angle [Fig. 6(c)], this result can also be explained with T1 neighbor-exchanging events.
Clearly both and have a similar influence on particle motion, as seen in Fig. 5(a,b) and Fig. 6(c,d). Both quantities relate to the void structure around a droplet: has geometric information from the nearest neighbors, and includes information also from second nearest neighbors. To examine correlations between these two quantities, Fig. 5(c) shows a a heat map of the two quantities for all droplets at all times; they are indeed correlated. The red and blue lines show the mean as a function of for lower and higher volume fractions, respectively, and in both cases there is a positive correlation between the two structural quantities. Are these two quantities redundant for predicting motion, or is one more useful than the other? To check this, we make a heat map of the magnitude of the cage relative displacement as a function of both variables in Fig. 5(d). The blue data in the lower left corner shows that the smallest magnitude motion is for particles that have both small and . The right portion of the data suggests that is more influential over droplet motion, in that droplets with small but large are among the most mobile particles. That being said, droplets with small but larger are slightly more mobile than those droplets with both quantities small.
In terms of directionality, Fig. 6 shows that both the first and secondary nearest neighbors influence the direction of droplets movement. Seeing that the peaks of the probability distributions of in Fig. 6(d) are slightly higher than the ones of in Fig. 6(c), the structure of the secondary nearest neighbors appears to have a more significant impact on the directionality of droplets movement. Likewise, and , a further indication that is more influential. (This average would be 1 if motion was completely parallel and/or antiparallel to the given direction, and would be 0 if the angle is uniformly distributed.) We also note that the directions of the Voronoi anisotropy vector and the direction of the smallest are similar: the distribution of the difference between their angles has a mean of and a standard deviation of .
IV Conclusion
Our goal has been to understand how local structure influences rearrangements in a quasi-two-dimensional emulsion where the area fraction slowly increases toward . To do this, we use the Voronoi polygon analysis introduced by Rieser et al. [21]. Rieser et al. in particular introduce one measure that has information about a particle and its nearest neighbors; and a secondary measure that includes information from the second nearest neighbors as well. These two measures characterize spatial heterogeneity, for example the presence of larger voids near a particle, or the presence of a more densely packed region nearby. We find both of these measures are correlated with particle motion: larger spatial heterogeneity predicts subsequent larger particle displacements. Moreover, both measures are vectors pointing toward voids. These directions preferentially orient the T1 rearrangements, giving a sense of where droplets can converge together (to fill in the void) or move apart (thus making room for the converging droplets). These two measures of spatial heterogeneity are correlated, so it makes sense that they are both effective predictors of motion. That being said, the measure accounting for first nearest neighbors is slightly more predictive of a particle’s likelihood of rearranging, while the measure accounting for first and second nearest neighbors is slightly more predictive of the particle’s direction of motion.
In our experiment the sample changes area fraction from just mildly jammed () to nearly confluent (). It is intriguing that the relationship between the structural measures and the particle displacements remains consistent over the entire area fraction range. During the experiment the mean value of one measure drops by more than factor of 2 [Fig. 3(b)] and the displacements drop by more than a factor of 10 [Fig. 3(c)], yet the correlations between structure and displacement magnitude are qualitatively the same [Fig. 5(a,b)], and correlations between structure and displacement direction are quantitatively the same [Fig. 6(c,d)]. It is plausible that machine learning techniques could discern structural measures with even stronger predictive power [43, 44, 45]. Our results suggest that for machine learning algorithms, it would be useful to use area-fraction independent structural quantities for the machine learning analysis. Our results also suggest that key structural features of importance are the spatial heterogeneity of and in particular the voids.
Acknowledgements: We thank X. Hong, C. Orellana, J. Rieser, and D. Sussman for helpful discussions. This material is based upon work supported by the National Science Foundation under Grant No. CMMI-1250199/-1250235 (X.D.) and CBET-2002815 (E.R.W.).
References
- [1] A. J. Liu and S. R. Nagel, Jamming is not just cool any more, Nature, 396, 21–22 (1998).
- [2] A. J. Liu and S. R. Nagel, The jamming transition and the marginally jammed solid, Ann. Rev. Cond. Mat. Phys., 1, 347–369 (2010).
- [3] M. V. Hecke, Jamming of soft particles: geometry, mechanics, scaling and isostaticity, J. Phys.: Condens. Matter, 22, 033101 (2010).
- [4] A. M. Kraynik, Foam flows, Ann. Rev. Fluid Mech., 20, 325–357 (1988).
- [5] A. van Blaaderen and P. Wiltzius, Real-space structure of colloidal hard-sphere glasses, Science, 270, 1177–1179 (1995).
- [6] C. P. Royall, S. R. Williams, T. Ohtsuka, and H. Tanaka, Direct observation of a local structural mechanism for dynamic arrest, Nat Mater, 7, 556–561 (2008).
- [7] T. G. Mason, J. Bibette, and D. A. Weitz, Elasticity of compressed emulsions, Phys. Rev. Lett., 75, 2051–2054 (1995).
- [8] B. Dollet and F. Graner, Two-dimensional flow of foam around a circular obstacle: local measurements of elasticity, plasticity and flow, J. Fluid Mech., 585, 181–211 (2007).
- [9] B. Dollet, Local description of the two-dimensional flow of foam through a contraction, J. Rheo., 54, 741–760 (2010).
- [10] S. A. Jones, B. Dollet, N. Slosse, Y. Jiang, S. J. Cox, and F. Graner, Two-dimensional constriction flows of foams, Colloid Surf. A: Physicochemical and Engineering Aspects, 382, 18–23 (2011).
- [11] D. Chen, K. W. Desmond, and E. R. Weeks, Topological rearrangements and stress fluctuations in quasi-two-dimensional hopper flow of emulsions, Soft Matter, 8, 10486–10492 (2012).
- [12] B. Dollet, A. Scagliarini, and M. Sbragaglia, Two-dimensional plastic flow of foams and emulsions in a channel: experiments and lattice Boltzmann simulations, J. Fluid Mech., 766, 556–589 (2015).
- [13] V. V. Vasisht, S. K. Dutta, E. Del Gado, and D. L. Blair, Rate dependence of elementary rearrangements and spatiotemporal correlations in the 3D flow of soft solids, Phys. Rev. Lett., 120 (2018).
- [14] C. Cao, J. Liao, V. Breedveld, and E. R. Weeks, Rheology finds distinct glass and jamming transitions in emulsions, Soft Matter, 17, 2587–2595 (2021).
- [15] D. Chen, D. Semwogerere, J. Sato, V. Breedveld, and E. R. Weeks, Microscopic structural relaxation in a sheared supercooled colloidal liquid, Phys. Rev. E, 81, 011403 (2010).
- [16] M. Tsamados, A. Tanguy, C. Goldenberg, and J. L. Barrat, Local elasticity map and plasticity in a model Lennard-Jones glass, Phys. Rev. E, 80, 026112 (2009).
- [17] M. L. Manning and A. J. Liu, Vibrational modes identify soft spots in a sheared disordered packing, Phys. Rev. Lett., 107, 108302 (2011).
- [18] R. L. Jack, A. J. Dunleavy, and C. P. Royall, Information-theoretic measurements of coupling between structure and dynamics in glass formers, Phys. Rev. Lett., 113, 095703 (2014).
- [19] E. D. Cubuk, S. S. Schoenholz, J. M. Rieser, B. D. Malone, J. Rottler, D. J. Durian, E. Kaxiras, and A. J. Liu, Identifying structural flow defects in disordered solids using machine-learning methods, Phys. Rev. Lett., 114, 108001 (2015).
- [20] I. Tah, S. A. Ridout, and A. J. Liu, Fragility in glassy liquids: A structural approach based on machine learning, J. Chem. Phys., 157, 124501 (2022).
- [21] J. M. Rieser, C. P. Goodrich, A. J. Liu, and D. J. Durian, Divergence of voronoi cell anisotropy vector: A threshold-free characterization of local structure in amorphous materials, Phys. Rev. Lett., 116, 088001 (2016).
- [22] J. Bibette, L. F. Calderon, and P. Poulin, Emulsions: basic principles, Rep. Prog. Phys., 62, 969–1033 (1999).
- [23] S. R. Derkach, Rheology of emulsions, Adv. Coll. Int. Sci., 151, 1–23 (2009).
- [24] K. W. Desmond, P. J. Young, D. Chen, and E. R. Weeks, Experimental study of forces between quasi-two-dimensional emulsion droplets near jamming, Soft Matter, 9, 3424–3436 (2013).
- [25] R. K. Shah, H. C. Shum, A. C. Rowat, D. Lee, J. J. Agresti, A. S. Utada, L.-Y. Chu, J.-W. Kim, A. Fernandez-Nieves, C. J. Martinez, and D. A. Weitz, Designer emulsions using microfluidics, Materials Today, 11, 18–27 (2008).
- [26] J. C. Crocker and D. G. Grier, Methods of digital video microscopy for colloidal studies, J. Colloid Interface Sci., 179, 298–310 (1996).
- [27] F. Bolton and D. Weaire, Rigidity loss transition in a disordered 2D froth, Phys. Rev. Lett., 65, 3449–3451 (1990).
- [28] D. J. Durian, Foam mechanics at the bubble scale, Phys. Rev. Lett., 75, 4780–4783 (1995).
- [29] D. J. Koeze, D. Vågberg, B. B. T. Tjoa, and B. P. Tighe, Mapping the jamming transition of bidisperse mixtures, Europhys. Lett., 113, 54001+ (2016).
- [30] S. Mazoyer, F. Ebert, G. Maret, and P. Keim, Dynamics of particles and cages in an experimental 2D glass former, Europhys. Lett., 88, 66004 (2009).
- [31] E. R. Weeks and D. A. Weitz, Properties of cage rearrangements observed near the colloidal glass transition, Phys. Rev. Lett., 89, 095704 (2002).
- [32] G. C. Cianci, R. E. Courtland, and E. R. Weeks, Correlations of structure and dynamics in an aging colloidal glass, Solid State Comm., 139, 599–604 (2006).
- [33] G. S. Matharoo, M. S. G. Razul, and P. H. Poole, Structural and dynamical heterogeneity in a glass-forming liquid, Phys. Rev. E, 74, 050502 (2006).
- [34] T. Kawasaki, T. Araki, and H. Tanaka, Correlation between dynamic heterogeneity and medium-range order in two-dimensional glass-forming liquids, Phys. Rev. Lett., 99, 215701 (2007).
- [35] D. Weaire and J. P. Kermode, Computer simulation of a two-dimensional soap froth II. Analysis of results, Philosophical Magazine B, 50, 379–395 (1984).
- [36] J. Stavans, The evolution of cellular structures, Rep. Prog. Phys., 56, 733 (1993).
- [37] S. Hutzler, D. Weaire, and F. Bolton, The effects of plateau borders in the two-dimensional soap froth III. further results, Phil. Mag. Part B, 71, 277–289 (1995).
- [38] M. Dennin and C. M. Knobler, Experimental studies of bubble dynamics in a slowly driven monolayer foam, Phys. Rev. Lett., 78, 2485–2488 (1997).
- [39] A. Kabla and G. Debrégeas, Local stress relaxation and shear banding in a dry foam under shear, Phys. Rev. Lett., 90, 258303 (2003).
- [40] M. Dennin, Statistics of bubble rearrangements in a slowly sheared two-dimensional foam, Phys. Rev. E, 70, 041406 (2004).
- [41] D. Weaire, J. D. Barry, and S. Hutzler, The continuum theory of shear localization in two-dimensional foam, J. Phys.: Condens. Matter, 22, 193101 (2010).
- [42] S. Slotterback, M. Toiya, L. Goff, J. F. Douglas, and W. Losert, Correlation between particle motion and voronoi-cell-shape fluctuations during the compaction of granular matter, Phys. Rev. Lett., 101, 258001 (2008).
- [43] E. D. Cubuk, R. J. S. Ivancic, S. S. Schoenholz, D. J. Strickland, A. Basu, Z. S. Davidson, J. Fontaine, J. L. Hor, Y. R. Huang, Y. Jiang, N. C. Keim, K. D. Koshigan, J. A. Lefever, T. Liu, X. G. Ma, D. J. Magagnosc, E. Morrow, C. P. Ortiz, J. M. Rieser, A. Shavit, T. Still, Y. Xu, Y. Zhang, K. N. Nordstrom, P. E. Arratia, R. W. Carpick, D. J. Durian, Z. Fakhraai, D. J. Jerolmack, D. Lee, J. Li, R. Riggleman, K. T. Turner, A. G. Yodh, D. S. Gianola, and A. J. Liu, Structure-property relationships from universal signatures of plasticity in disordered solids, Science, 358, 1033–1037 (2017).
- [44] V. Bapst, T. Keck, A. Grabska-Barwińska, C. Donner, E. D. Cubuk, S. S. Schoenholz, A. Obika, A. W. Nelson, T. Back, D. Hassabis, et al., Unveiling the predictive power of static structure in glassy systems, Nature Phys., 16, 448–454 (2020).
- [45] E. Boattini, F. Smallenburg, and L. Filion, Averaging local structure to predict the dynamic propensity in supercooled liquids, Phys. Rev. Lett., 127, 088007 (2021).