Evaluation of Virtual Reality Interaction Techniques: the case of 3D Graph
Abstract
The virtual reality (VR) and human-computer interaction (HCI) combination has radically changed the way users approach a virtual environment, increasing the feeling of VR immersion, and improving the user experience and usability. The evolution of these two technologies led to the focus on VR locomotion and interaction. Locomotion is generally controller-based, but today hand gesture recognition methods were also used for this purpose. However, hand gestures can be stressful for the user who has to keep the gesture activation for a long time to ensure locomotion, especially continuously. Likewise, in Head Mounted Display (HMD)-based virtual environment or Spherical-based system, the use of classic controllers for the 3D scene interaction could be unnatural for the user compared to using hand gestures such e.g., pinching to grab 3D objects. To address these issues, we propose a user study comparing the use of the classic controllers (six-degree-of-freedom (6-DOF) or trackballs) in HMD and spherical-based systems, and the hand tracking and gestures in both VR immersive modes. In particular, we focused on the possible differences between spherical-based systems and HMD in terms of the level of immersion perceived by the user, the mode of user interaction (controller and hands), on the reaction of users concerning usefulness, easiness, and behavioral intention to use.
Keywords User Interaction, Locomotion, HCI, Virtual Reality, Visualization, Freehand, 3D Graph
1 Introduction
The development of interaction and locomotion approaches represents the new challenge of VR technologies. Indeed, traditional approaches such as controllers [1, 2] have been overcome through the combination of VR and HCI methods. In this direction, more and more approaches were proposed [3, 4] considering also locomotion [5, 6, 7] studies useful to increase the level of user immersion in the virtual environment. Hand tracking and gesture recognition represent one of the most popular novelties of VR with HCI applications [8, 9, 10, 11]. Specific devices such as omnidirectional treadmill (ODT) [12], hand tracking methods onboard of HMDs [13, 14] were affirmed and consolidated, allowing a significant increase in the user’s sense of immersion in VR. However, ODT, for example, requires ad-hoc hardware which needs effective technology as support, such as haptic and harness tools, to ensure a low-stress and comfortable low-stress user experience. Hand tracking and gesture recognition-based approaches are affected by the tired arm and muscle fatigue which is called also “gorilla arm effect”. This is due to the necessity to keep for long time hands visible to the tracking devices, such as Leap Motion, Dept Cameras, simple Webcam, etc. In particular, this effect is more evident when the hand gestures are used for the user’s locomotion continuous because he has to keep the arm still for a long time, consequently increasing stress and fatigue [6, 15]. These problems are further accentuated in spatial data exploration contexts [16] where there is a need to understand how data are structured and related. Indeed, a new research field called Immersive Analytics [17] has recently emerged with the aim of understanding how visualization and interaction technologies can assist data scientists in the data analysis through the user immersion in the data itself [18]. The relationships between big data are often visualized through graph structures to understand their intrinsic features. Indeed, the visualization of large graphs has been empirically proven to be a tool that greatly improves the ability to understand the relationships between objects [19, 20]. In this context, visualizing data on traditional displays and interacting with them through standard devices such as keyboard and mouse is becoming a trend cumbersome [21]. To address these issues, we propose a comparative study among different approaches for user interaction, locomotion, and visualization in VR. On the other hand, in this paper, we propose an evaluation study involving participants divided into groups of users. We asked each group to interact and locomote in VR scene using different devices and methodologies: the first group used the HMD HTC Vive for VR immersion and its 6-DOF controllers to interact with virtual objects and locomote within the VR scene (); we asked the second group to visualize the VR scene using the same HMD and a multimodal approach [22] using the 6-DOF controller to locomote around the VR scene and hand tracking based on a Leap Motion device placed on top of HMD to interact with the virtual objects (); third group instead used an Immersive Visualization Environment (IVE) (spherical-based virtual environment), discussed in Section 3.2 and two trackballs to interact with 3D objects and locomote in the VR scene (); in the last group we asked to use IVE for VR visualization, a trackball for locomotion and hand tracking through Leap Motion device placed on the user’s forehead (). The proposed use case is represented by a virtual 3D scene in which users have to explore a 3D graph and interact with the nodes or with the entire graph itself. The results of our comparative study show that the spherical systems for VR purposes are promising and competitive with respect to the HMD systems, and the interaction and locomotion with two controllers still represent the optimal choice for HMD-based environments. However, the multimodal approach based on a single trackball and Leap Motion device provides interesting results in terms of usability and accuracy within the IVE-based environment.
The remainder of this paper is structured as follows: an overview of the state-of-the-art is reported in Section 2; some details on the background and methods used in our approach can be found in Section 3; a description of the 3D graph and details on VR scene is reported in Section 4; the evaluation study and details on the experiment can be found in Section 5; results and discussion are reported in Section 6; finally, conclusions and future directions of our work are reported in Section 7.
2 Related Work
Interaction with virtual objects and Locomotion in a virtual scene requires a high user effort [23, 24, 25, 26, 27], especially through freehand locomotion techniques with continuous controlling, where the user has to keep the hands in the same position for all movement time [28, 6]. An empirical evaluation study was proposed from [6] about a comparison among freehand-steering locomotion techniques and a controller-based approach. The focus was to evaluate the efficiency, effectiveness, and user preference in continuously controlling the locomotion direction using controller-steering, palm-steering, index-steering, and gaze-steering techniques. Eye gaze is also used in a VR interaction method proposed in [3] to select virtual objects and the manipulation was ensured through freehand gestures. In particular, the authors proposed gestures as two-handled scaling or pinch-to-select to the virtual objects observed by the user. [28] proposed a double-hand gestures locomotion technique, where the right thumb was used to turn left or right and the left palm was used to control the backward and forward movements. Another interesting approach based on hand gestures was proposed from [29], which is focused on AR intangible digital map navigation. The authors conducted a study exploring the handedness effect and input mapping defining two techniques to transit between positions smoothly. They reported that input-mapping transitions could increase performance and reduce arms fatigue. One of the freehand input limitations is the different operations that can be invoked concerning the user’s intention. This effect was investigated from [30], who proposed an experimental analysis to evaluate some techniques to disambiguate the effect of the freehand manipulations in VR. The study was conducted by comparing the hand gaze, speech, and foot tap input methods, putting together three-timing (before, during, and after an interaction) in which they provide settings to resolve the ambiguity. To allows the arm fatigue, [23] proposed a combination of feasible techniques called “ProxyHand” and “StickHand”. The first enabled the user to interact with the VR scene through his arm in a comfortable position through a 3D-spatial offset between his real hands and the virtual representation. The second is used where the “ProxyHand” was not suitable. [26] proposed a VR low-fatigue hand-controller-based travel technique for a limited physical space. Through a single controller, the average of hand and controllers, or the head, the user can choose the travel orientation. A comparison between VR systems and traditional mouse-keyboard and joypad configurations was proposed from [31]. The authors proposed an empirical evaluation study about the interaction and locomotion with 3D graphs using the Oculus Rift and Leap Motion, designing a specific natural user interface. They developed a plug-in module for the Gephi software to evaluate the 3D graph interaction through VR and standard monitor combined with keyboard-mouse, joypad, and Leap Motion input devices. In such a study, the authors concluded that the VR based on HMD was more challenging compared with the traditional devices. Exploring and interacting with 3D graphs in VR was also investigated in [32], in which we studied the better graph layout which allows the nodes to be positioned to reduce as more as possible entropy levels. To the best of our knowledge, there are no specific studies that compare VR visualization systems based on IVE and HMD and at the same time compare different modalities of interactions, hand tracking, gesture recognition based, controller based, and trackball based.
3 Background and Methods
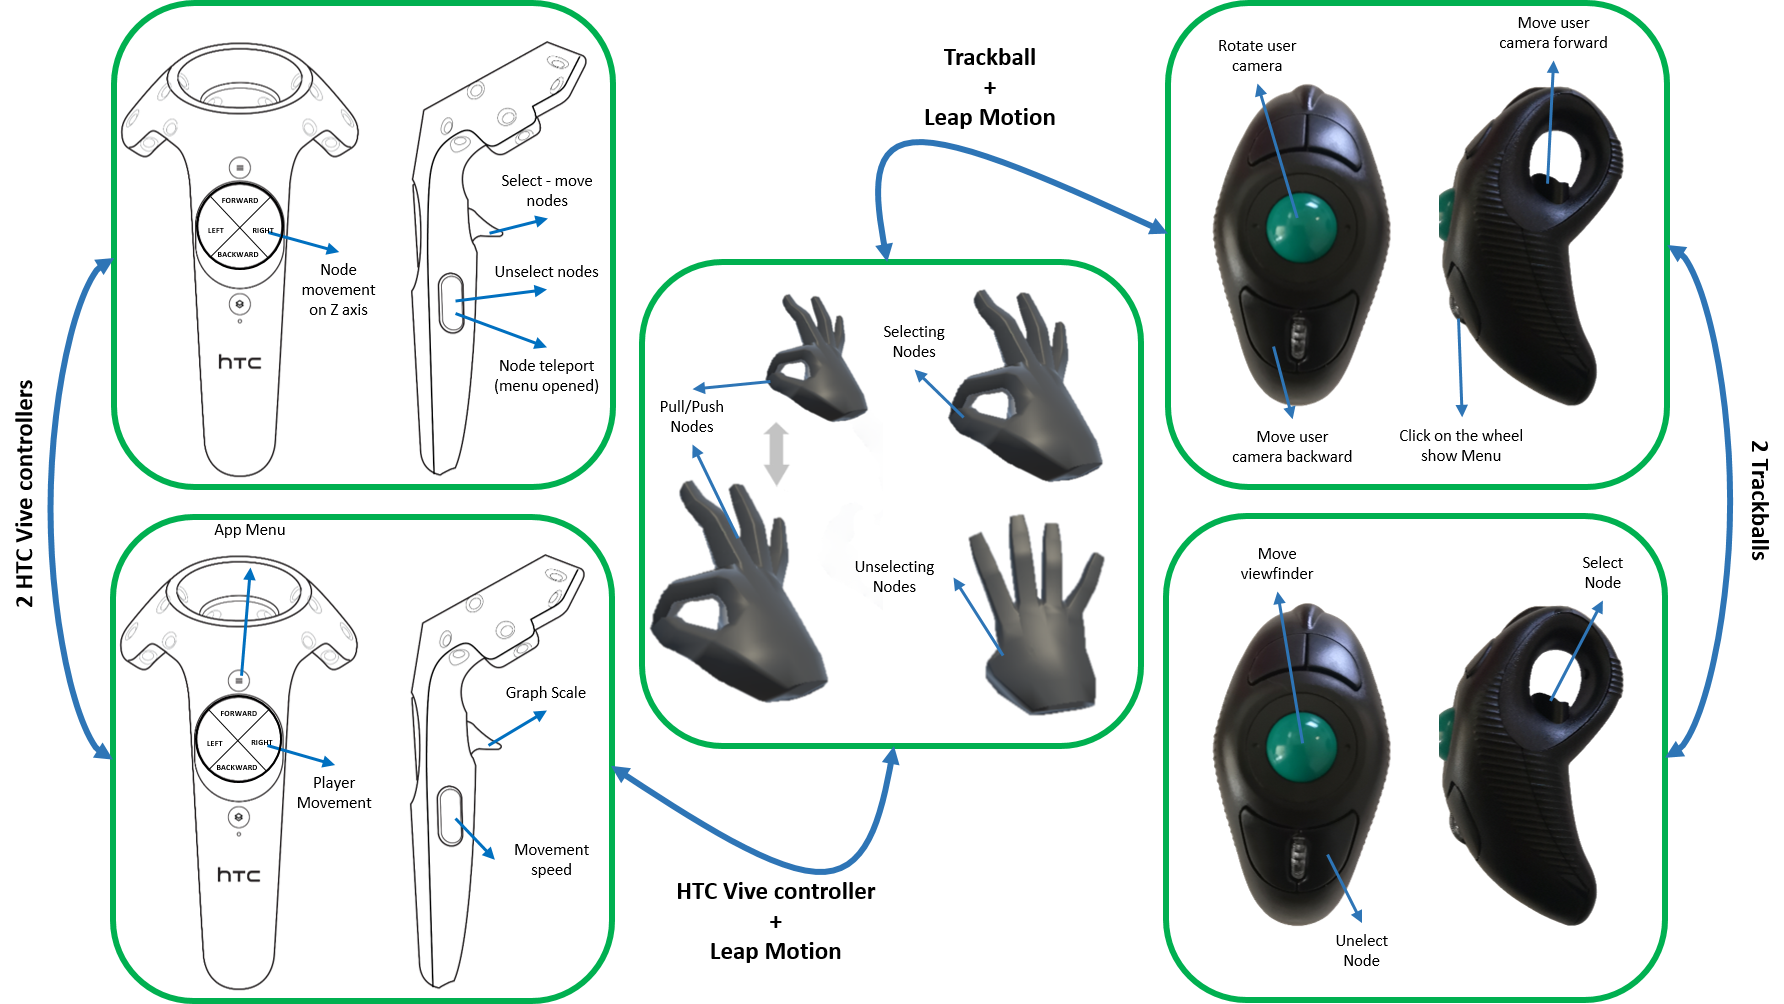
On the left, are the features associated with the HTC Vive controllers to interact and locomote in the 3D Graph. On the center, the gestures associated with the hand tracking using the Leap Motion controller to interact with the scene components. On the right, the features associated with the trackballs to locomote and interact with the 3D graph. The arrows indicate the configurations of the input devices based on the experiment they were used
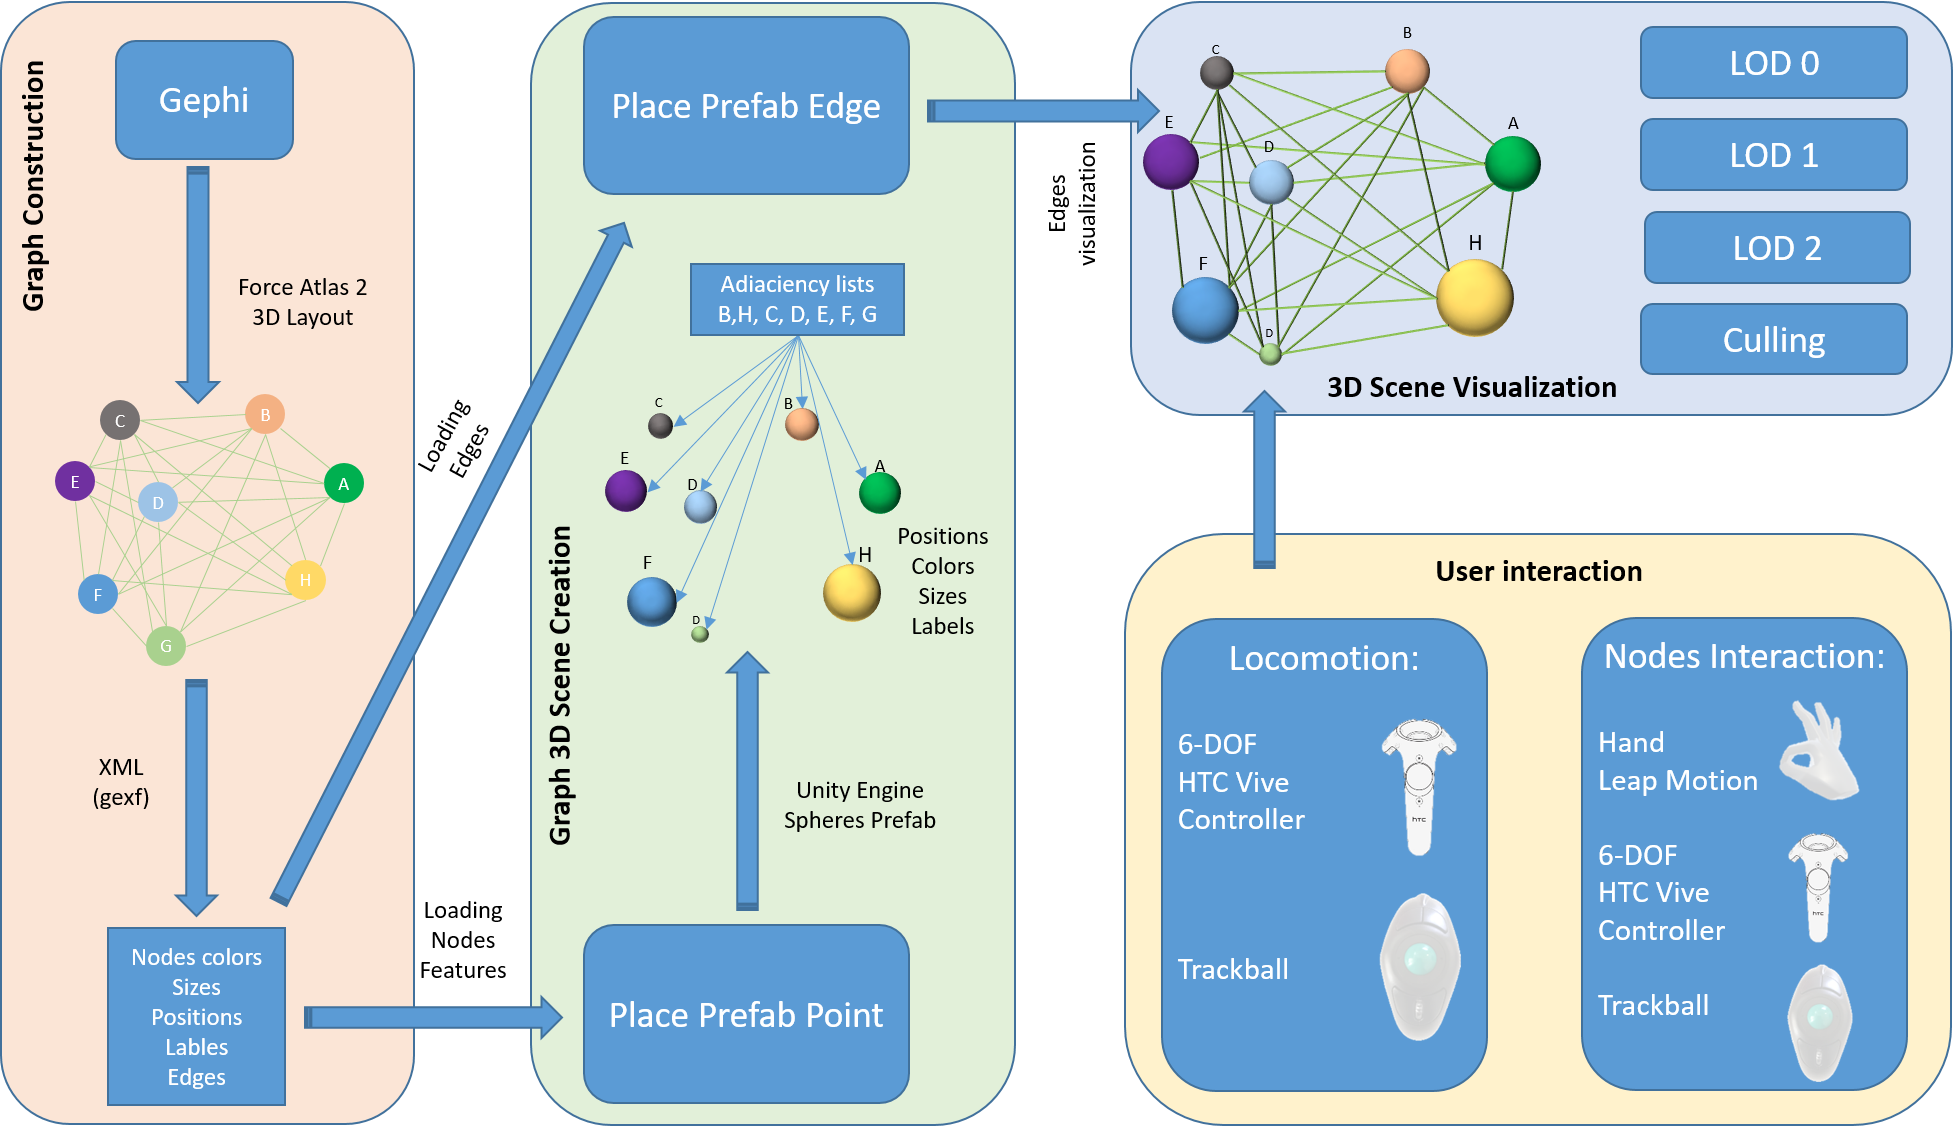
The proposed evaluation study was conducted on a well-designed scene based on the 3D Graph visualization (see Section 4). The graph structure used for our purposes was generated and exported using the Gephi [33] software, which allows us to define colors, size, node positions, and edges defined through adjacent nodes. The Force Atlas 2 [34] 3D layout was used as graph layout and the overall graph description was exported through a .gexf output file. The latter is the standard XML-based Gephi format which can be imported into our 3D scene using a parsing function properly developed. Furthermore, we tested the robustness of our 3D application, generating a random large graph with a growing variable number of edges and nodes. The imported .gexf file was scanned from a Unity 3D prefab we developed, called PlacePrefabPoint. Prefab is a serialized off-the-shelf Unity 3D game object which was previously created and configured. It creates another specific prefab for each node found in the .gexf file, tying it with its graphic features such as sphere size, color, position etc.. PlacePrefabPoint creates also for each node, an empty adjacency list, which is filled with its connected nodes defined by the edges also reported in the .gexf file. The filling operation was performed with another prefab that we called PlacePrefabEdge. Our study case was developed using the unity 3D game engine which allowed us to quickly integrate the Leap Motion SDK for hand gesture recognition, the Steam VR framework to support the HTC Vive HMD and its controllers, and the screen-keyboard-mouse paradigm. In the next subsections we discussed the two VR visualization approaches and for each of them the two interaction methods as reported in Figure 8.
3.1 HMD
To allow the user the VR experience using the HMD, we used HTC Vive (first version) with a inch AMOLED display with per eye, as a field of view degree, and 90Hz as refresh rate. Such HMD allows the user to adapt the interpupillary and lens distances according to his needs, and the allowed range for the user movement is bounded with a defined room scale [35] tracked from the base stations. For the experiment, we used an HTC Vive controller (also tracked with base stations) for the locomotion, which is based on a 6-DOF and can be associated with a left or right user hand (see Figure 2(a)). In particular, the user can move using the controller’s trackpad along the horizontal axis: forward, backward, left, and right in flight mode. The vertical movement can be performed through the HMD forward direction by pointing and pressing the forward trackpad button. Furthermore, the locomotion speed can be increased through the Grip Button of the controller (see left part of Figure 1). The same controller allows the user to open and close the application menu. In the same experiment, the second 6-DOF controller is used to interact with the 3D scene graph and the nodes. In experiment, we used the same approach used for for the locomotion and the Leap Motion controller to allows the 3D scene interaction (see Figure 2(b)). This controller is a compact infrared-camera device useful for hand tracking and gesture recognition which can be mounted on an HMD device, allowing the group of this experiment participants to visualize the 3D simulated hands in the virtual scene and faithfully follow the movements of their real hands, increasing the VR immersion feeling.

In both HMD experiments, the buttons of the locomotion controller are used to activate and interact with the application menu. This menu allows the user to change the option setting such as e.g., max graph plot scale and max user speed movement of the application. The menu allows also the user to navigate and visualize the node list, select one of them and teleport in front of it. Finally, the menu allows viewing the labels of the selected nodes.
3.2 Immersive Visualization Environment Experiment
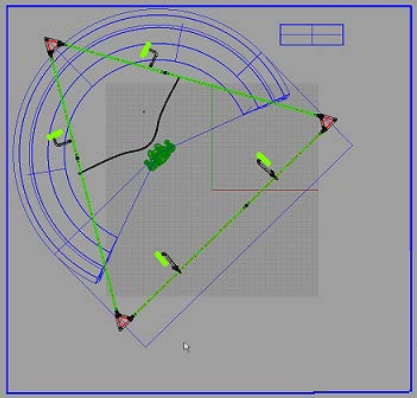
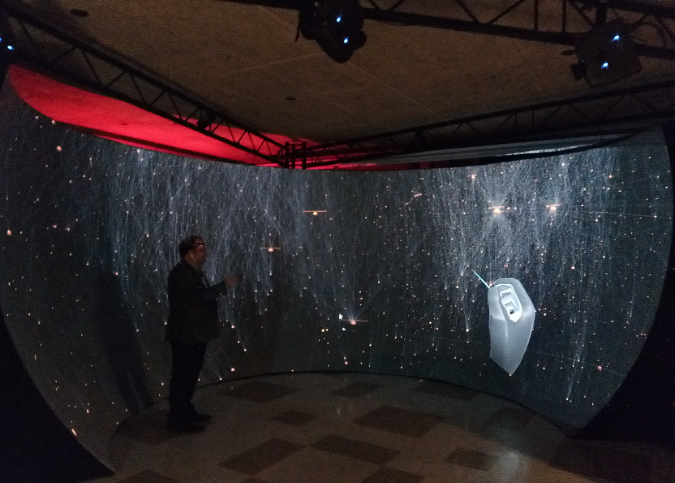
IVE, also known as a dome-shaped system (see Figures 1 and 2) located at Visualization & Simulation Research Cluster (coles.kennesaw.edu/vsr). This state-of-the-art equipment enhances the immersive virtual environment imaging with multiple digital projectors and a large cylindrical screen. The particular immersive system used for the experiment is a spatially immersive visualization and features four digital projectors, OmniFocus™ Series 500 wide-angle single-lens projection system, and an 8ft by 10ft cylindrical screen with multi-channel visual display, coupled with integrated hardware and software warp and blend technology (see Figure 2, a schematic configuration of the IVE system). Numerous variations of IVE are designed and implemented at research and training laboratories in prime industries, such as Boeing, BMW, and Lockheed Martin, and in branches of the Department of Defense, Army, Air Force, Navy, and National Security Agency, just to list a few. Such installations have a wide range of applications, such as architectural design, flight simulation, military simulation, scientific visualization, experiential marketing, and industrial simulation [36].

As IVE can be used with screen-keyboard-mouse paradigm, to allows high user immersion feeling, we used an ergonomic like-mouse trackball. In experiment, we configured two trackballs, one for locomotion and the other for interaction. To allow the user orientation during the visualization and locomotion we replaced the HMD head rotational movement with the trackball sphere and buttons for movements. The other trackball is used to allows the user the interaction with the 3D graph and its nodes like (see Figure 4(a)). In the last experiment configuration , we used a multimodal approach with a trackball for the locomotion and the Leap Motion placed with a headband, for the user interaction like (see Figure 4(b)). Locomotion trackball allows also the user to interact with the application menu similarly reported in the Sections 3.1 and 3.3 by using the wheel button.
3.3 Interaction
User interaction was allowed using the ray casting technique [37] using as collision distance. As shown in Figure 1, in the Leap Motion interaction method, the user has to perform a pinch gesture to select one or more 3D Graph nodes by considering the index and thumb fingers (see Figure 2(b)). A distance range between and on index and thumb fingers was considered to activate this gesture. In the experiment, the multiple node selection was allowed by combining the activated pinch gesture with the user gaze direction displayed with a viewfinder [38] towards the position of the nodes. In this modality, the ray was cast from the position of HMD by following the VR camera direction, and the user has to keep his hand in the HMD field of view because losing the hand tracking deactivates the gesture recognition not allowing him to grab additional nodes. To deselect the nodes, the open hand gesture has to be performed by the user by keeping the fingers except the thumb in the up direction. Indeed, this latter has to e closed toward the palm. As shown in Figure 1, in the , the trigger button of the HMD controller was used to select a target node. If the user keeps the trigger button pressed the ray was cast from the controller head like a lightsaber, by continuously selecting all the nodes it encounters forward of it. Similarly, the user can deselect the already selected nodes using one or both of the controller’s grip buttons. In both the HMD interaction methods, the grip button of the locomotion controller can be used to increase the movement speed. In the the viewfinder can be moved using the ball of the locomotion trackball which move also the user camera, and the ray was cast from its position to the forwarding direction (see Figure 4(b)). Also, in this case, the hand tracking can be loose if the hand is out of Leap Motion’s field of view, and consequently not allowing further node selection. In the last experiment, the trigger button of the interaction trackball can be used to select the target node by casting the ray from the mouse cursor (represented as a viewfinder) which can be moved through the interaction trackball ball. Also in this case, by keeping the trigger button pressed, the user can select encounters forward nodes and the down buttons to deselect the same nodes. In both the trackball interaction methods, the movement speed can be changed through the application settings. To provide user feedback, we change their colors to purple when they are selected. Furthermore, we change from green to yellow the color of the ray from when it hit an unselected node and to the red color when it hit an already selected node. When the selected nodes were further selected (see Figure 1, the user can move these nodes and place them in other scene positions by following the viewfinder until they are released. The graph can be also scaled using the trigger button of the HMD controller and moving the tracked hand or the other controller away from each other, or an application setting in the trackball experiments.
4 3D Graph Scene
The reasons behind the proposed virtual scene are motivated by the high user effort required to navigate and interact with the 3D graph. Indeed, the user’s ability to move and interact with the scene is severely tested by the representation of complex data structures with a high level of interconnection. The 3D graph is a floating virtual scene and the user has to move in flying mode following all possible directions. As shown in Figure 5, the graph nodes are represented through basic polygonal spheres [32] which allows the user interaction and edges through rendered lines. In this way the user interaction with the edges cannot be carried out since it is a useless feature in our application context and since the use of a non-polygonal representation reduces the complexity of the scene in terms of computing resources and allows to visualize more nodes.

To allow the user the highest level of performance we have developed the scene with a set of tricks. In particular, we noticed the worst rendering time when the user is placed in the 3D graph center or all nodes are visible in the VR camera field of view. As too low render time can lead to motion sickness and general user discomfort [39], we address this problem by introducing three Levels Of Detail (LOD) and an occlusion culling level [40] (see Figure 6). Thus, the 3D nodes’ geometric complexity was automatically adapted based on their distance from the VR camera. Furthermore, the occlusion culling removes the rendering computation for the nodes occluded from other objects and hidden from the VR camera.
Starting from , each LOD is associated with a polygonal complexity of the sphere. In particular, the LOD allows the spheres visualization in high poly with simple labels associated that represent the node’s description. The latter rotates towards the VR camera so that they are always visible to the user. Labels in LOD are hidden because we assumed they were not visible beyond a significant distance from the user, and the spheres are less complex in terms of polygons. In LOD , we further reduce the complexity of the sphere because there is a great distance from the user. We determine the LOD activation distance considering the percentage of the camera engaged from nodes. To obtain better performance in terms of graphics quality and rendering time, we activated the LOD when the percentage was between and , the LOD when the percentage was between and , and the LOD when the percentage was between and . To further reduce the computational effort, we firstly hide the edges when the nodes are selected and moved in the scene by the user and then we recompute their lengths and positions when the nodes were released in the new positions. Thereby, we displayed again them, decreasing the positions computation effort which was performed only one time, and the rendering time. After generating the graph by importing the .gexf file, the user can select the display mode and subsequently the interaction mode (see Section 3 ). The VR camera movement is allowed freely in all directions, and the movement speed can be increased or decreased. The viewfinder can be activated and moved on the target nodes enabling the ray casting using the pinch gesture or the trigger button of the HTC controller or the trackball, based on the visualization experiment the user was involved in. The viewfinder is also activated to deselect the nodes using the methods discussed in Section 3.3. It is possible to deselect all nodes by pointing the viewfinder and enabling the ray casting toward an empty scene area.
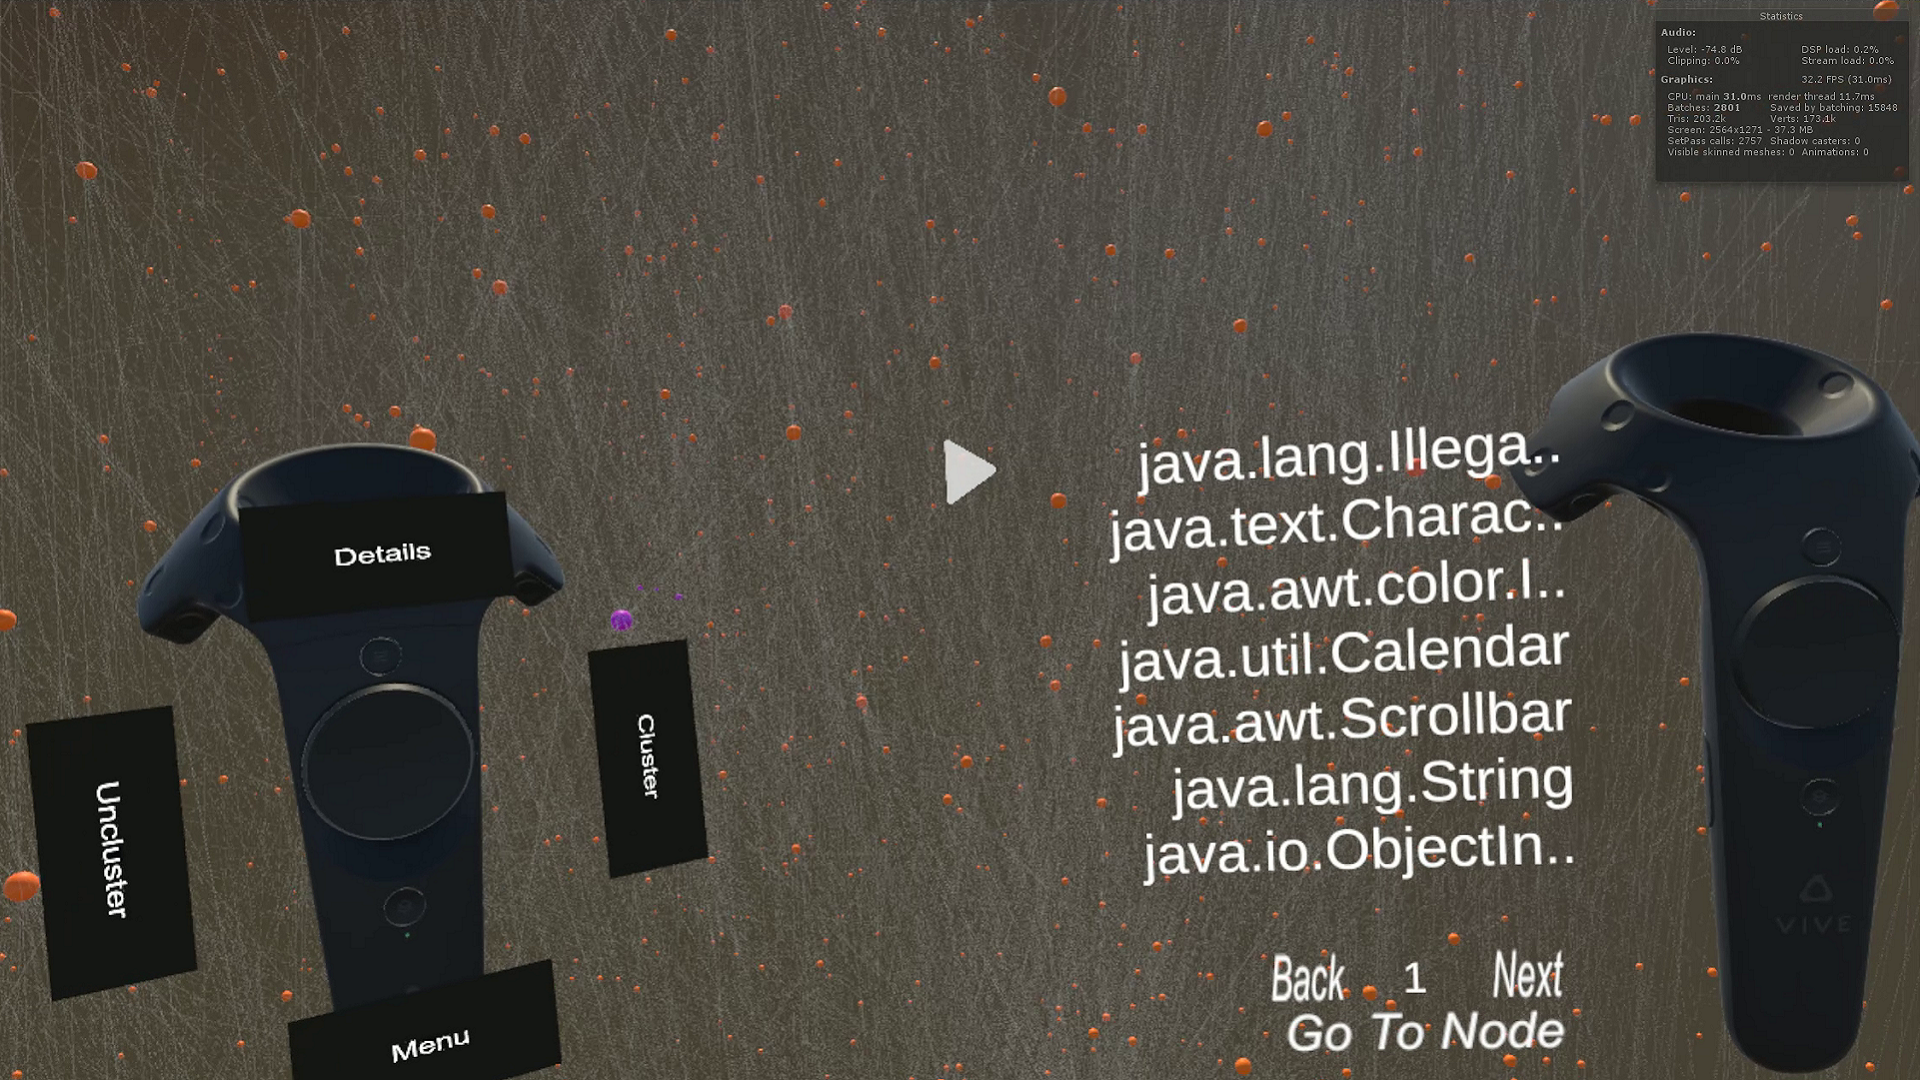
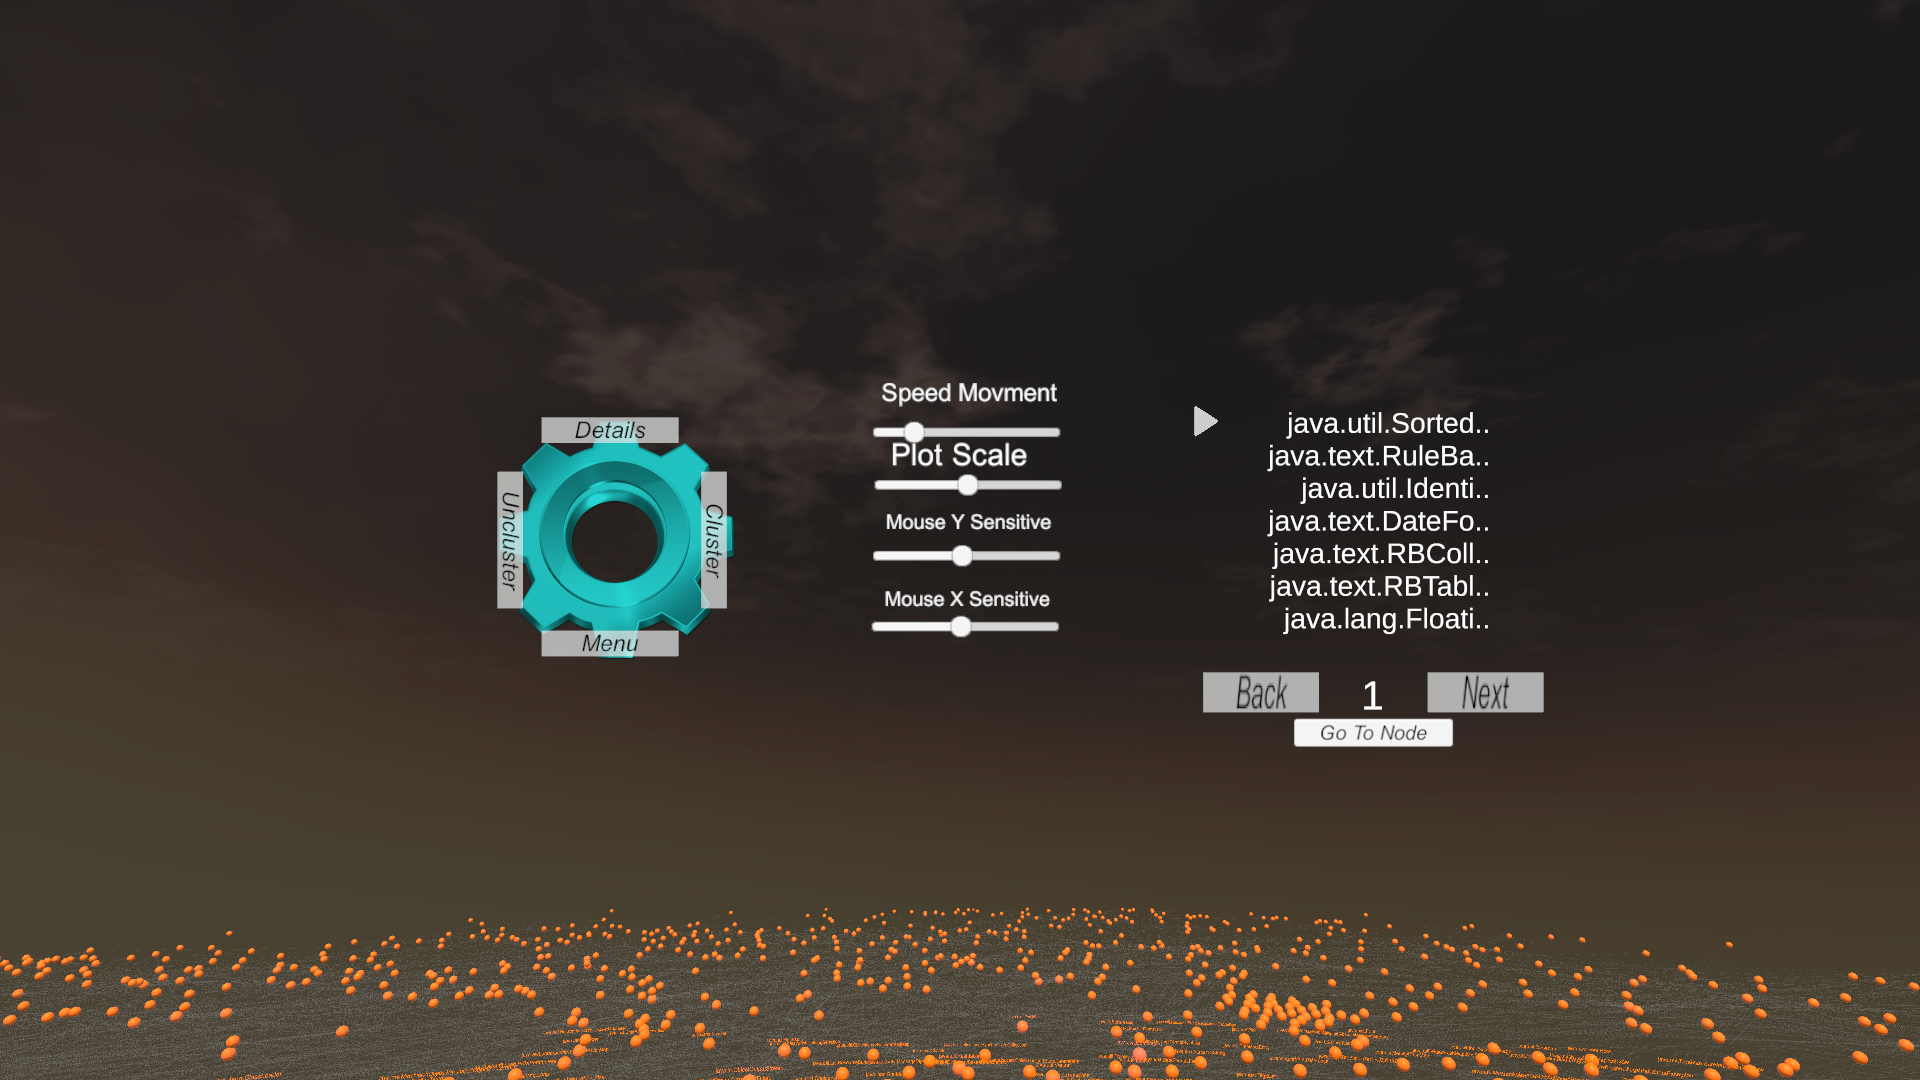
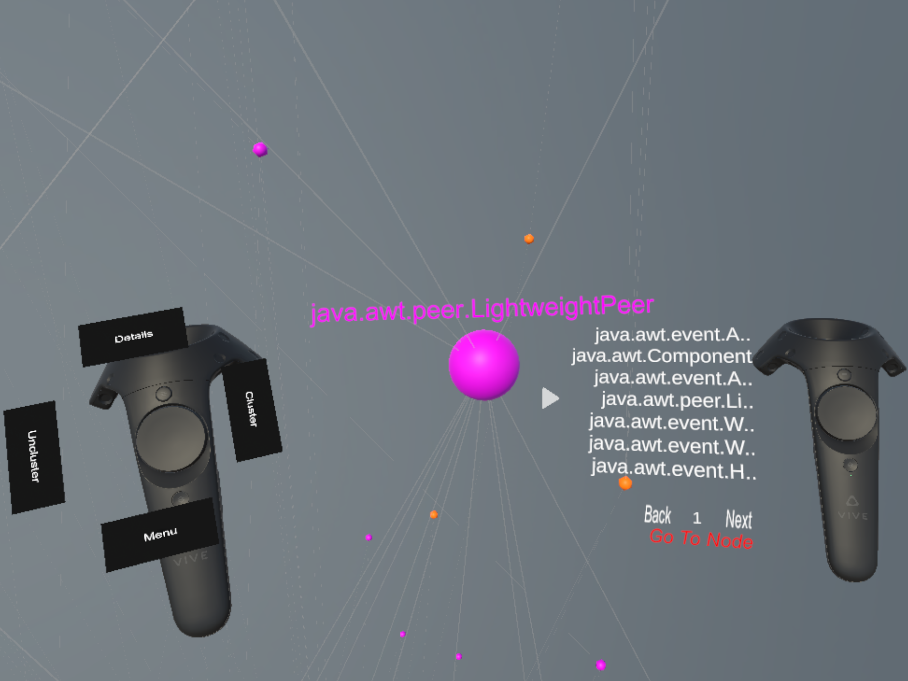
As shown in Figure 7, we implemented an application menu to allow settings and features. This menu allows the user to view the list of selected nodes, chose a node, and teleport himself in front of it using the Go To Node feature. When the application menu is activated, four buttons are displayed on the HTC locomotion controller or the IVE, as shown in Figure 7. It is possible to gather the selected nodes in a cluster node using the button Cluster. The label related to the cluster node contains a progressive number as text. It is possible to create clusters of clusters or clusters with clusters and nodes. Likewise through the Uncluster button is possible to split the nodes of the selected cluster. Furthermore, the button Menu allows the user to close the menu, and the button Details enable the user to view the selected node label or the list of nodes contained in the cluster. Finally, as shown in Figure 7(b), the application menu in IVE mode allows changing some settings such as the movement speed, the scale, and the ball (or mouse pointer) sensibility.
5 Evaluation Study
Our evaluation study is based on the human-computer interaction methodology [41], which is applied in several contexts [42, 43, 44, 45, 46]. Considering the configurations shown in Fig. 8, we try to answer the following research questions:
-
•
What differences exist, when navigating structured data in a 3D environment, between Immersive Visualization Environment-based visualization systems and HMD-based visualization systems in terms of the degree of immersion perceived by users?
-
•
Which, among the four different interaction modalities experimented, is the most effective and usable?
-
•
Which is the reaction of users concerning the experimented interaction modalities, in terms of usefulness, easiness, and behavioral intention to use?
5.1 Procedure
To find answers to the above questions and analyze the use of different configurations in the context of 3D data visualization, we conducted an evaluation study involving two samples of 30 participants among students from both the Italy and the US University campuses.
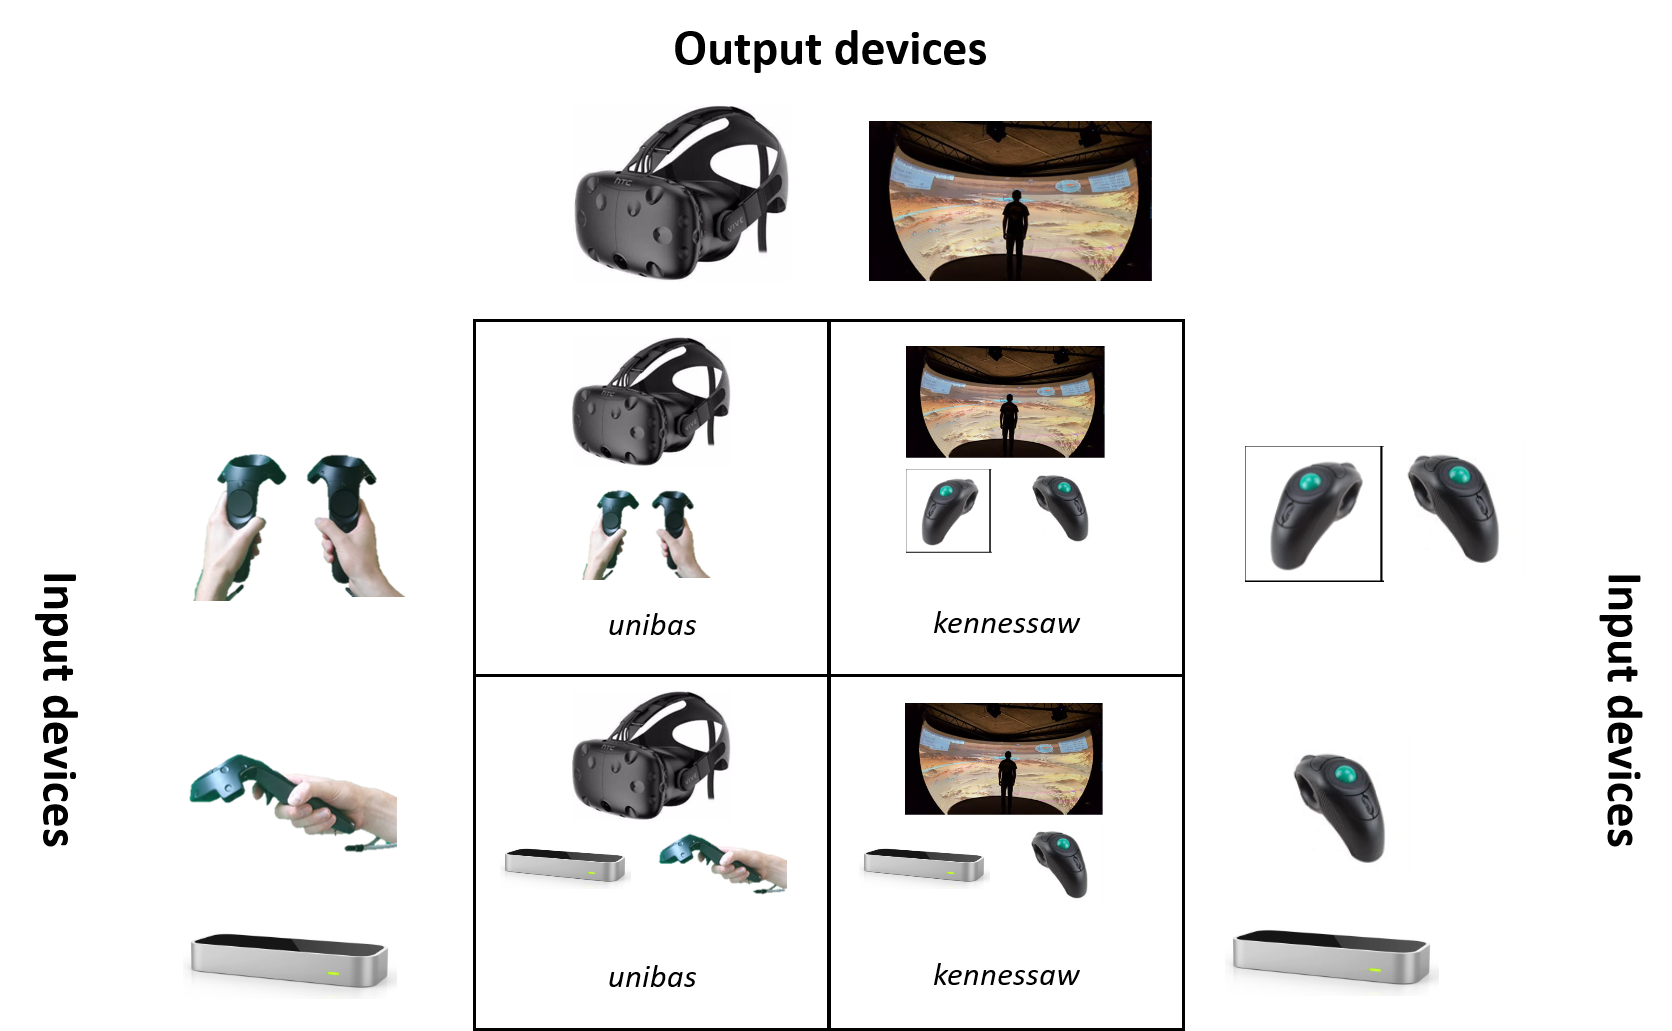
The Italian study was conducted in the Parallel and Computer Graphics Lab research at the University of Basilicata, Italy. We tested here two configurations involving the use of the HTC Vive as the output device, the use of two controllers () and one controller and a Leap Motion as input devices (). We refer to this set of experiments as unibas (see Fig. 8). A workstation was used, equipped with an i7, 3.60GHz, an NVidia Titan Xp GPU, and 16 GB of main memory.
The US study was conducted in the Visualization & Simulation Research Center Cluster laboratory at the Kennesaw State University, Georgia, US. Here were tested two configurations involving the use of an IVE as output device and the use of two controllers () and of one controller and a Leap Motion as input devices (). We refer to this set of experiments as kennesaw (see Fig. 8).
The graph consists of nodes and edges, rendered in a fixed frame rate of frame per second in the HMD environment, and frame per second in IVE. However, we aimed to analyze the users’ interactions, locomotion, and VR visualization of the explored graph and obtain information about which interaction, locomotion, and visualization modality were most effective and usable.
The study consisted of three phases, namely: (a) a Preliminary Survey; (b) a Testing Phase; and (c) a Summary Survey, as defined and implemented in the same and other contexts [47, 48, 31]. In the first phase, we asked participants to fill in a preliminary questionnaire to collect: (a) demographic information (i.e., gender, age, education level); (b) information and communications technology (ICT) expertise; (c) general attitudes towards video games; and (d) general familiarity and experience with both virtual reality and graph theory. The 20 questions (listed in Appendix A.1) took various forms; some were open-ended, others required a “yes” or “no” answer, others required stating a preference from up to 10 possible choices, and finally, others were rated on a 5-point Likert scale with strongly agree/strongly disagree as verbal anchors. In the Testing Phase, users were given a 10-minute training period to become familiar with the configuration. Then they were asked to complete the following three tasks:
-
•
T1 (Search): Given the JPLD graph, “try to find four gray nodes within a fixed amount of time, and try to read their labels”. When the user will approach the node, it will become green.
-
•
T2 (Exploration): Given the JPLD graph, “explore it to select as many labels as possible (mild recommendation), within a fixed amount of time”. When the user will select a node, it will assume the magenta color.
-
•
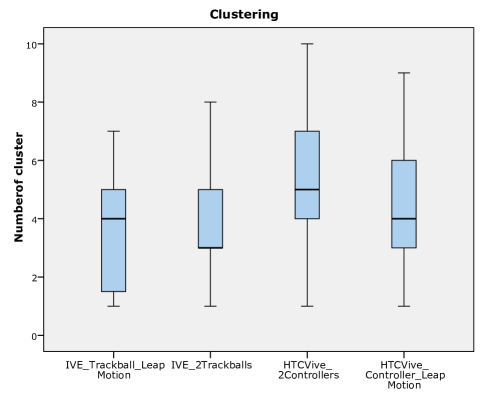
T3 (Clustering): Given the JPLD graph, “try to find and cluster gray nodes”. A cluster is made up of at least two nodes. When a cluster is created, the corresponding nodes will group into a red node.
The first task aimed to reveal the capacity of users to orient themselves. The second aimed to test their ability (rapidity) to move through a dense graph to have an idea of the structure of the graph. We have to emphasize that labels were not counted by users, but just selected. Conversely, the system counted the number of nodes selected by the participants in the study. Moreover, labels were not selected (and therefore counted) multiple times, since, after their selection from users, the system changes their color. In this way, users are informed that the nodes cannot be selected anymore. Finally, the third task was designed to test complex user interactions.
In all tasks, the user was not told the maximum time allowed (5 min for the Search and Clustering tasks, and 2 min for the Exploration task). This allowed us to assess the degree of the user’s involvement, without creating anxiety during task execution. At the end of each task, we asked participants to rate how easy it was to perform. Other questions addressed the responsiveness of the configuration, how natural the interaction was, and finally, whether they experienced any problems during task execution (dizziness, nausea, tiredness, movement limitations, etc.). The first three questions were rated on a 5-point Likert scale, while the fourth offered up to 9 different choices (see Appendix A.2). Users were monitored during the experiment and could call for assistance if they did not understand any of the instructions. Testing was performed in an isolated environment in our research lab to avoid distractions due to the presence of other people. Users were also encouraged to provide informal feedback (such as general comments or suggestions).
At the end of the testing phase, we asked users to fill in a questionnaire, adapted from the standard Presence Questionnaire [49], aiming to assess the perceived degree of involvement and enjoyment. From this questionnaire, we extracted questions that allow us to obtain sub-scores in terms of four factors: realism (RF), control (CF), distraction (DF), and involvement (INV). Each question was a rating on a 7-point Likert scale, with strongly agree and strongly disagree as verbal anchors (see Appendix A.3).
Finally, in the last phase, we asked users to complete a summary questionnaire. The objective is to derive participants’ summary conclusions about easiness, and usefulness, as well as their interest in the idea and their behavioral intention to use such systems in the future. This final questionnaire asked them to state their preferences from a maximum of 15 options and included three other questions rated on a 5-point Likert scale. (see Appendix A.4). Each configuration was tested once by each user on the same day, and each test lasted between 45 and 50 minutes. The full test schedule in the US required one week to be completed, while the Italian test schedule required two weeks, given the breaks due to the pandemic COVID-19 period. The questionnaires that were used are reported in Appendix A.
5.2 Recruitment
Participants were students at two university campuses, the first one in Italy, i.e., the University of Basilicata, and the second one in the US, i.e., the Kennesaw State University. They were recruited through word-of-mouth, advertising, and student mailing lists. Their participation was voluntary and anonymous. Participants were informed that all the information they provided would remain confidential.
5.3 Data Analysis
Non-parametric tests were applied to study differences between the groups testing the defined configurations. The Shapiro–Wilk goodness-of-fit test was used to assess the normality of the data [50]. We recall too the reader that the p-value is used in the context of null hypothesis testing to quantify the statistical significance and that the smaller the p-value, the larger that significance. Finally, questionnaire responses were analyzed using SPSS version 20.111http://www-01.ibm.com/software/analytics/spss/.
6 Results
In this section, we discuss the results of each of the three phases of our evaluation study.
6.1 Preliminary Survey Results
As shown in Table 1, we recruited 60 participants with bachelor’s (60%), master’s (20%), and Ph.D. students (7%) from the Computer Science and the Coles College of Business departments at the University of Salerno and Kennesaw State University, respectively. The majority were male (65%) with the age of participants mostly in the range of 20-26 years (68.3%). The majority of respondents (85%) said that they spend less than 7 hours per week playing video games, and more than half (70%) considered themselves to be “competent/expert” in ICT.
| Number | Percentage | |
| Total Participants | 60 | |
| Gender | ||
| Male | 39 | 82% |
| Female | 21 | 18% |
| Age | ||
| 20–23 years | 20 | 33% |
| 24–26 years | 21 | 35% |
| 26+ years | 19 | 32% |
| Education Level Attained | ||
| Bachelor’s, Master’s, PhD | 52 | 87% |
| High School | 8 | 13% |
| Time Playing Video Games per Week | ||
| 0–7 hours | 51 | 85% |
| 8–21 hours | 8 | 13% |
| 21+ hours | 1 | 2% |
| Experience in ICT field | ||
| Beginner | 18 | 30% |
| Competent | 16 | 27% |
| Expert | 26 | 43% |
Results of the preliminary survey show that participants were not very familiar with video games (only 28% rated themselves as “expert” in the field, 85% spend about an hour per week playing a video game, on average) and that they mostly used traditional input devices, namely mouse and keyboard (48.3%), and the PlayStation console (46.7%) to play them. Moreover, when interviewed about their familiarity with natural user interfaces, only 16.7% of participants in the study gave Leap Motion as an answer. To derive the background of the participants concerning the domain under analysis, we submitted specific questions about the graph theory and the immersive environments. When interviewed about their familiarity with graph theory, 40% of the participants expressed high familiarity, while “orientation” was the most rated issue when interacting with a graph (13.3%). Finally, 31.6% of participants stated that they were familiar with Virtual Reality, 72% of participants affirmed knowing immersive devices, but only 39% of participants rated high his experience with them.
Three questions from the preliminary survey questionnaire (i.e., Q1, Q2, and Q3 in the Preliminary Survey Questionnaire) were supplied as input to the k-means clustering algorithm [51]. As a result, we identified three groups of participants: (i) a LowGamers group, who do not like so many video games (55%), (ii) a MediumGamers group, who do like video games and spend a small proportion of their time playing them (31.7%), and (iii) a HardGamers group, who spend a considerable proportion of their time playing video games (13.3%).
In summary, the first phase allowed us to build a profile of our participants. Specifically, our sample had participants with a low interest in video gaming (only 28% rated themselves as the expert) and immersive environments (only 7% expressed high familiarity, while almost 50% of participants rated themselves as inexpert in that field), with high technical skills (being Computer Science students) and low familiarity with graph theory (beginner the 60% of our participants). Finally, 15% of participants were left-handed, 8% suffered from motion sickness, 22% had vision deficiencies (myopia), and more than half of the participants wore glasses.
6.2 Testing Phase Results
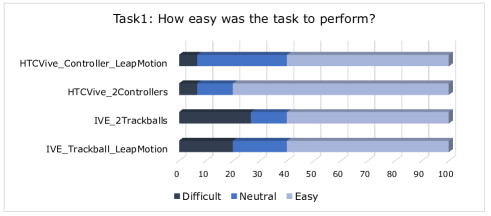
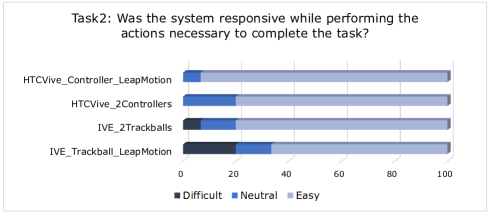
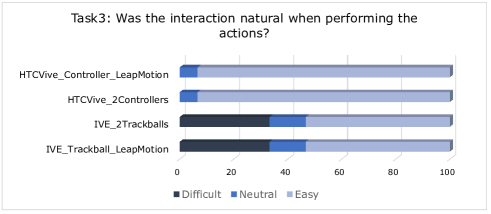
The second phase involved interaction with the developed system. Recall that participants were asked to perform three tasks and to evaluate afterwards their easiness (Fig. 9), the responsiveness of the overall configuration (Fig. 10), and how natural the interactions felt during the testing of the configuration (Fig. 11). As we can see, all configurations were evaluated positively, even if HMD-based configurations (i.e., and ) obtained slightly better results across all tasks. Interestingly, no participants who tested HMD-based configurations rated negatively (“Low” value for Task 2, “Difficult” value for Task3) the responsiveness and the naturalness of the interactions. We also analyzed whether differences existed between the 4 groups (configurations) and whether these were statistically significant. We found that groups did not differ regarding the easiness, responsiveness, and naturalness of interactions tested in the three assigned tasks.
During this phase, sessions were monitored to measure the time required by participants to complete the tasks and to measure the corresponding precision/correctness. We have to emphasize that for Task 2 we did not measure the completion time, since here we asked participants to explore as many nodes as possible in the fixed time of 2 minutes. About the correctness, for Task 1, the correctness is given by the number of nodes that participants were able to find, while for Task 3, the precision is given by the number of clusters that participants were able to build. Task2 did not require any analysis of correctness, since here we were interested in deriving information about the rapidity of participants while exploring the graph.
As we can see in Fig. 12, about Task1, participants who tested spent less time completing the task. The worse result was obtained by participants testing , where only 3 participants out of 15 were able to complete the task without reaching the time limit of 5 minutes. This difference among configurations is also statistically significant (). About completion time for Task 3, we observed that all participants except those who tested the reached the maximum allowed time to perform the task. The HMD-based configuration employing two controllers as input devices ensured the completion of the task within the time limit (M=271.3 seconds, SD=64.6 seconds).
When analyzing precision/correctness, we found out, concerning Task 1, that the highest precision was exhibited by participants testing , where indeed 87% of them completed the task with no error. The second-best performing configuration was, , with 47% of participants performing the task with 0 errors.

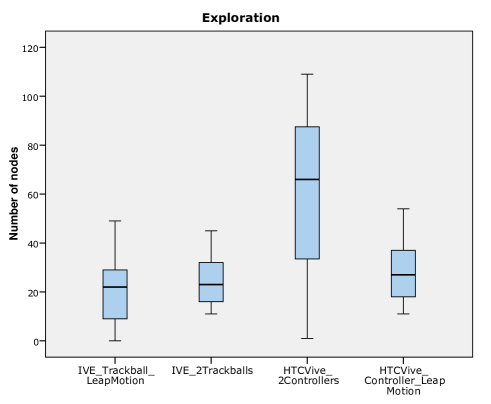
With regard to Task 2, in Fig. 13 we show how participants testing were able to find the highest number of nodes. We also found a significant statistical difference among the groups (p0.01). Finally, with regard to Task 3, we observed that even here, the participants testing performed better, building the highest number of clusters (see Fig. 14).
Finally, we did not find any statistical difference among the three video gamers groups (NoGamers, LowGamers, and HardGamers) with regard to both time and precision/correctness for Task 1. Conversely, when analyzing video gamers groups with regard to the number of nodes explored in Task 2 and the number of clusters built-in Task 3 we found significant statistical differences (p for both). The insight here is that video gamers were more skillfully in activities requiring the selection of the nodes and their clustering (complex operations).
In summary, the analysis of the Testing phase ended with the interesting result that the configuration involving the use of the HTC Vive as an output device and 2 controllers as input devices shows the best results in terms of both performance and correctness. Additionally, this result is still valid with regard to the analysis of the subjective metrics envisioned in our study (easiness, responsiveness, and naturalness of interactions of the performed tasks), with better results obtained by participants who tested the configuration.
As described in Section 5.1, to analyze the opinions of participants in terms of immersion and their overall subjective experience, we used the standard Presence Questionnaire (PQ). It measures to what degree users feel as if they are part of the experienced environment. From this questionnaire, we extracted questions that allow obtaining sub-scores in terms of four factors: realism (RF), control factor (CF), Distraction Factor (DF), and involvement (INV).
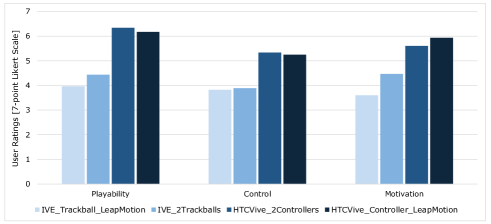
First, we report in Fig. 15 the results of users’ perceptions about playability, the control they had within the immersive experience (represented by their tasks), and their motivation. Regarding playability, all participants enjoyed the experience, with the best scores obtained with participants testing the (M=6.3, SD=0.7) and (M=6.17, SD=0.79) configurations, with a significant statistical difference (p.0001). About the Control factor, participants rated positively the aesthetics of the virtual representation (M=5.0, SD=1.6), with slightly better results achieved with HMD-based configurations. We also found a statistical difference across the configurations (p.01). Moreover, they agreed with how easy it was to use the immersive devices, M=3.7, SD=2.2) and expressed high satisfaction in terms of the sensitivity of the controllers (“The game controller sensitivity in the virtual experience was adequate”, M=5.1, SD=1.6). Similarly, the Motivation factor was positively rated by our sample (M=4.9, SD=1.8). Even here, better results were obtained by participants testing HMD-based configurations, with a significant statistical difference among the 4 groups (p.01).
As shown in Table 2, the Presence questionnaire is aggregated into four factors, almost all positively rated. Participants were found out responsive to the overall environment (M=5.1, SD=0.7), and they perceived very natural interactions within the immersive experience (M=4.8, SD=1.1). Additionally, they rated very positively their involvement (M=5.3, SD=0.5), until to the extent they lost track of the time (M=5.0, SD=0.4). Less positive results were obtained with questions related to the Distraction and Realism factors, with mostly disagree ratings about the questions: “To what degree did you feel confused or disoriented at the beginning of breaks or the end of the experimental session?” (M=2.8,SD=0.2), “How distracting was the control mechanism?”” (M=2.6, SD=0.4), and finally, “How much did the control devices interfere with the performance of assigned tasks or with other activities?” (M=2.7,SD=0.3). Similar to the previous analysis, questions were positively rated mostly by participants testing the and ) configurations.
| ID | Question | IVE_ | IVE_ | HTCVive_ | HTCVive_ | Factor |
| Trackball_ | 2Trackballs | 2Controllers | Controller_ | |||
| LeapMotion | LeapMotion | |||||
| P1 | How responsive was the environment to actions that you initiated (or performed)? | 4.33 | 4.80 | 5.80 | 5.60 | CF |
| P2 | How natural did your interactions with the environment seem? | 3.67 | 3.93 | 5.87 | 5.60 | CF |
| P3 | How involved were you in the virtual environment experience? | 4.80 | 5.07 | 5.87 | 5.67 | INV |
| P4 | Were you involved in the experimental task to the extent that you lost track of time? | 4.40 | 5.13 | 4.87 | 5.47 | INV |
| P5 | How proficient in moving and interacting with the virtual environment did you feel at the end of the experience? | 4.40 | 4.33 | 5.53 | 5.93 | CF |
| P6 | How aware were you of events occurring in the real world around you? | 3.53 | 2.67 | 4.20 | 4.00 | DF |
| P7 | How aware were you of your display and control devices? | 3.60 | 1.73 | 5.27 | 4.73 | DF |
| P8 | To what degree did you feel confused or disoriented at the beginning of breaks or at the end of the experimental session? | 2.80 | 2.53 | 2.73 | 3.07 | RF |
| P9 | How distracting was the control mechanism? | 2.73 | 2.00 | 2.93 | 2.87 | DF |
| P10 | How much did the control devices interfere with the performance of assigned tasks or with other activities? | 2.67 | 2.27 | 3.00 | 3.00 | DF, CF |
6.3 Summary Survey Results
In this section, we report the results of the questions posed in the questionnaire submitted in the last phase of our evaluation study (see Table 3). Generally, all participants rated as positive the usefulness (M=3.0) and the ease of use (M=3.2) of the tested configurations. At the question: “Do you think the proposed system was interesting?”, 33% of participants testing the configuration expressed their disagreement. Conversely, participants testing the and configurations highly positively rated all questions. Indeed, we found a significant statistical difference among the groups concerning all three questions (last column in Table 3). Finally, both future own personal use and the propensity to recommend to others the experience were positively rated. Participants testing HMD-based configurations had a higher propensity, and indeed we found a significant statistical difference for both questions (see Table 3).
| ID | Question | IVE_ | IVE_ | HTCVive_ | HTCVive_ | P value |
| Trackball_ | 2Trackballs | 2Controllers | Controller_ | |||
| LeapMotion | LeapMotion | |||||
| SQ1 | Do you think the proposed system was useful to use? | 3.0 (1.4) | 2.9 (1.6) | 4.3 (0.6) | 4.0 (0.8) | .01 |
| SQ2 | Do you think the proposed system was interesting? | 3.4 (1.5) | 2.9 (1.7) | 4.7 (0.5) | 4.7 (0.5) | .001 |
| SQ3 | Do you think the proposed system was easy to use? | 3.2 (1.5) | 3.3 (1.5) | 4.4 (0.6) | 4.4 (0.6) | .05 |
| SQ4 | Would you take into consideration the possibility of continuing to use the system in the near future? | 3.3 (1.9) | 3.7 (2.6) | 3.7 (1.6) | 5.3 (1.6) | .05 |
| SQ5 | I will strongly recommend others to use the system | 3.4 (1.8) | 3.9 (2.5) | 6.2 (0.9) | 6.2 (1.3) |
7 Conclusions and Future Works
We investigated the effectiveness of spherical-based and HMD-based systems for VR immersion focusing on different methods to explore and interact with the 3D graphs. In particular, we proposed a user study to compare the use of two HTC Vive 6-DOF controllers and a multimodal approach based on a single 6-DOF controller and the Leap Motion device for the user locomotion and interaction in a VR system based on HMD. We try to highlight the differences among these approaches in terms of the level of immersion perceived by the users, the usefulness, easiness, and behavioral intention to use our system. This study was conducted at the University of Basilicata (Italy) by involving participants and asked them to locomote and interact with the 3D graph using the previously mentioned approaches. A similar study was conducted in parallel at the Kennesaw State University (USA) but using the IVE spherical-based system as a VR environment. In this parallel study conducted with other participants, a comparison between two trackballs and one trackball and a Leap Motion device was performed. Participants were students of both universities, recruited through advertising, word-of-mouth, and student mailing lists. As a case study, we proposed the VR 3D graph visualization application and provided details on the hand-based, controller-based, and trackball-based methods to interact with nodes, visualize their details, and locomote in the 3D scene using the controllers, hands, or trackball. Our proposed study is based on three phases: a preliminary survey in which we asked the participant to provide demographic information, ITC expertise, general video games, and attitude toward VR and graph theory; in the testing phase we provided a 10-minute training period to allow the user the configuration familiarization. Then we asked the participants to complete three tasks at different times as reported in Section 5.1 and at the end of each task, we asked participants several questions about the easiness the responsiveness of the configuration, how natural the interaction was, etc. At the end of the testing phase, we asked the participants to fill a Presence-like questionnaire; Finally, we asked the participants to complete a summary questionnaire which aim was to investigate the easiness, the usefulness, and their possible intention to use our system in future. The results of the preliminary investigation suggest that most of the participants are not particularly fond of video games, allowing us to define a profile of our participants. The results of the testing phase suggest that achieve the best performance and correctness, by matching the analysis of subjective metrics such as easiness, responsiveness, and naturalness of the performed tasks. Interesting is also the second-best configuration achieved by the approach, and regardless the Task 1, the participants perform errors. About the PQ, the playability, control, and motivation in HMD configuration. Finally, the summary survey results report positive feedback about the usefulness and ease of use in all tested configurations. Furthermore, the participants appear to be inclined to use our system in the future and to positively recommend the same experience to others. To provide a well-designed case study with a good level of rendering performance and graph complexity, we provided also simple computer graphics techniques to render as many as possible nodes and edges. In future work, we will investigate the use of deep learning-based systems to replace the Leap Motion controller with a simple RGB camera [52, 53] and extend these approaches by introducing a new gesture recognition layer [54]. We will try to define the best type of hand gestures for interaction and locomotion within environments based on eXtended reality (XR) and we will try to propose a similar work with these new technologies trying to investigate the effectiveness of the use of the new paradigm of touchless interaction.
Acknowledgments
This effort was supported by an equipment grant from the U.S. Department of Defense/U.S. Army Research Office (ARO), a National Security Agency (NSA) grant, and technical support by Immersive Display Systems Inc. The content of this work does not reflect the position or policy of the ARO, NSA, or IDS and no official endorsement should be inferred. We sincerely thank Professor James “Wes” Rhea for his professional support.
References
- [1] Yang LI, Jin HUANG, Feng TIAN, Hong-An WANG, and Guo-Zhong DAI. Gesture interaction in virtual reality. Virtual Reality & Intelligent Hardware, 1(1):84–112, 2019.
- [2] Ryan P. McMahan, Chengyuan Lai, and Swaroop K. Pal. Interaction fidelity: The uncanny valley of virtual reality interactions. In Stephanie Lackey and Randall Shumaker, editors, Virtual, Augmented and Mixed Reality, pages 59–70, Cham, 2016. Springer International Publishing.
- [3] Ken Pfeuffer, Benedikt Mayer, Diako Mardanbegi, and Hans Gellersen. Gaze + pinch interaction in virtual reality. In Proceedings of the 5th Symposium on Spatial User Interaction, SUI ’17, page 99–108, New York, NY, USA, 2017. Association for Computing Machinery.
- [4] Thammathip Piumsomboon, Gun Lee, Robert W. Lindeman, and Mark Billinghurst. Exploring natural eye-gaze-based interaction for immersive virtual reality. In 2017 IEEE Symposium on 3D User Interfaces (3DUI), pages 36–39, Los Angeles, CA, USA, 2017. IEEE.
- [5] Vangelis Metsis, Kenneth S. Smith, and Denise Gobert. Integration of virtual reality with an omnidirectional treadmill system for multi-directional balance skills intervention. In 2017 International Symposium on Wearable Robotics and Rehabilitation (WeRob), pages 1–2, Houston, TX, USA, 2017. IEEE.
- [6] Giuseppe Caggianese, Nicola Capece, Ugo Erra, Luigi Gallo, and Michele Rinaldi. Freehand-steering locomotion techniques for immersive virtual environments: A comparative evaluation. International Journal of Human–Computer Interaction, 36(18):1734–1755, 2020.
- [7] Sang Hun Pyo, Ho Su Lee, Bui Minh Phu, Sang Joon Park, and Jung Won Yoon. Development of an fast-omnidirectional treadmill (f-odt) for immersive locomotion interface. In 2018 IEEE International Conference on Robotics and Automation (ICRA), pages 760–766, Brisbane, QLD, Australia, 2018. IEEE.
- [8] Nicola Capece, Ugo Erra, Monica Gruosso, and Marco Anastasio. Archaeo Puzzle: An Educational Game Using Natural User Interface for Historical Artifacts. In Michela Spagnuolo and Francisco Javier Melero, editors, Eurographics Workshop on Graphics and Cultural Heritage. The Eurographics Association, Spain, 2020.
- [9] B. Katalin Szabó. Interaction in an immersive virtual reality application. In 2019 10th IEEE International Conference on Cognitive Infocommunications (CogInfoCom), pages 35–40, Naples, Italy, 2019. IEEE.
- [10] Po-Wei Lee, Han-Yu Wang, Ying-Chao Tung, Jhe-Wei Lin, and Andries Valstar. Transection: Hand-based interaction for playing a game within a virtual reality game. In Proceedings of the 33rd Annual ACM Conference Extended Abstracts on Human Factors in Computing Systems, CHI EA ’15, page 73–76, New York, NY, USA, 2015. Association for Computing Machinery.
- [11] Daniele Regazzoni, Caterina Rizzi, and Andrea Vitali. Virtual reality applications: guidelines to design natural user interface. In International Design Engineering Technical Conferences and Computers and Information in Engineering Conference, volume 51739, page V01BT02A029, Quebec City, Canada, 2018. American Society of Mechanical Engineers.
- [12] Kyle Hooks, Wesley Ferguson, Pedro Morillo, and Carolina Cruz-Neira. Evaluating the user experience of omnidirectional vr walking simulators. Entertainment Computing, 34:100352, 2020.
- [13] Jan-Niklas Voigt-Antons, Tanja Kojic, Danish Ali, and Sebastian Möller. Influence of hand tracking as a way of interaction in virtual reality on user experience. In 2020 Twelfth International Conference on Quality of Multimedia Experience (QoMEX), pages 1–4, Athlone, Ireland, 2020. IEEE.
- [14] Cornel Hillmann. Comparing the Gear VR, Oculus Go, and Oculus Quest, pages 141–167. Apress, Berkeley, CA, 2019.
- [15] Daniel PO Wiedemann, Peter J Passmore, and Magnus Moar. An experiment design: investigating vr locomotion & virtual object interaction mechanics, 2017.
- [16] Devamardeep Hayatpur, Haijun Xia, and Daniel Wigdor. Datahop: Spatial data exploration in virtual reality. In Proceedings of the 33rd Annual ACM Symposium on User Interface Software and Technology, UIST ’20, page 818–828, New York, NY, USA, 2020. Association for Computing Machinery.
- [17] Benjamin Bach, Raimund Dachselt, Sheelagh Carpendale, Tim Dwyer, Christopher Collins, and Bongshin Lee. Immersive analytics: Exploring future interaction and visualization technologies for data analytics. In Proceedings of the 2016 ACM International Conference on Interactive Surfaces and Spaces, ISS ’16, page 529–533, New York, NY, USA, 2016. Association for Computing Machinery.
- [18] Adam Drogemuller, Andrew Cunningham, James Walsh, William Ross, and Bruce H Thomas. Vrige: Exploring social network interactions in immersive virtual environments. In Proceedings of the international symposium on big data visual analytics (BDVA). IEEE NJ, USA, 2017.
- [19] C. W. Muelder and K. Ma. Large-scale graph visualization and analytics. Computer, 46(07):39–46, jul 2013.
- [20] Ugo Erra, Delfina Malandrino, and Luca Pepe. A methodological evaluation of natural user interfaces for immersive 3d graph explorations. Journal of Visual Languages & Computing, 44:13–27, 2018.
- [21] Adam Drogemuller, Andrew Cunningham, James Walsh, Maxime Cordeil, William Ross, and Bruce Thomas. Evaluating navigation techniques for 3d graph visualizations in virtual reality. In 2018 International Symposium on Big Data Visual and Immersive Analytics (BDVA), pages 1–10, 2018.
- [22] Nicola Capece, Monica Gruosso, Ugo Erra, Rosario Catena, and Gilda Manfredi. A preliminary investigation on a multimodal controller and freehand based interaction in virtual reality. In Lucio Tommaso De Paolis, Pasquale Arpaia, and Patrick Bourdot, editors, Augmented Reality, Virtual Reality, and Computer Graphics, pages 53–65, Cham, 2021. Springer International Publishing.
- [23] Hasan Iqbal, Seemab Latif, Yukang Yan, Chun Yu, and Yuanchun Shi. Reducing arm fatigue in virtual reality by introducing 3d-spatial offset. IEEE Access, 9:64085–64104, 2021.
- [24] Juan David Hincapié-Ramos, Xiang Guo, Paymahn Moghadasian, and Pourang Irani. Consumed endurance: A metric to quantify arm fatigue of mid-air interactions. In Proceedings of the SIGCHI Conference on Human Factors in Computing Systems, CHI ’14, page 1063–1072, New York, NY, USA, 2014. Association for Computing Machinery.
- [25] Sujin Jang, Wolfgang Stuerzlinger, Satyajit Ambike, and Karthik Ramani. Modeling cumulative arm fatigue in mid-air interaction based on perceived exertion and kinetics of arm motion. In Proceedings of the 2017 CHI Conference on Human Factors in Computing Systems, CHI ’17, page 3328–3339, New York, NY, USA, 2017. Association for Computing Machinery.
- [26] Bhuvaneswari Sarupuri, Miriam Luque Chipana, and Robert W. Lindeman. Trigger walking: A low-fatigue travel technique for immersive virtual reality. In 2017 IEEE Symposium on 3D User Interfaces (3DUI), pages 227–228, Los Angeles, CA, USA, 2017. IEEE.
- [27] R. De Chiara, V. Di Santo, U. Erra, and V. Scarano. Real positioning in virtual environments using game engines. In 5th Eurographics Italian Chapter Conference 2007 - Proceedings, volume 1, pages 203–208, Trento, Italy, 2007. The Eurographics Association. cited By 12.
- [28] Fan Zhang, Shaowei Chu, Ruifang Pan, Naye Ji, and Lian Xi. Double hand-gesture interaction for walk-through in vr environment. In 2017 IEEE/ACIS 16th International Conference on Computer and Information Science (ICIS), pages 539–544, Wuhan, China, 2017. IEEE.
- [29] Kadek Ananta Satriadi, Barrett Ens, Maxime Cordeil, Bernhard Jenny, Tobias Czauderna, and Wesley Willett. Augmented reality map navigation with freehand gestures. In 2019 IEEE Conference on Virtual Reality and 3D User Interfaces (VR), pages 593–603, Osaka, Japan, 2019. IEEE.
- [30] Di Laura Chen, Ravin Balakrishnan, and Tovi Grossman. Disambiguation techniques for freehand object manipulations in virtual reality. In 2020 IEEE Conference on Virtual Reality and 3D User Interfaces (VR), pages 285–292, Atlanta, GA, USA, 2020. IEEE.
- [31] Ugo Erra, Delfina Malandrino, and Luca Pepe. Virtual Reality Interfaces for Interacting with Three-Dimensional Graphs. Int. J. Hum. Comput. Interact., 35(1):75–88, 2019.
- [32] Nicola Capece, Ugo Erra, and Jari Grippa. Graphvr: A virtual reality tool for the exploration of graphs with htc vive system. In 2018 22nd International Conference Information Visualisation (IV), pages 448–453, Fisciano, Italy, 2018. IEEE.
- [33] Mathieu Bastian, Sebastien Heymann, and Mathieu Jacomy. Gephi: an open source software for exploring and manipulating networks. In Proceedings of the international AAAI conference on web and social media, volume 3, pages 361–362, San Jose, California, USA, 2009. AAAI.
- [34] Mathieu Jacomy, Tommaso Venturini, Sebastien Heymann, and Mathieu Bastian. Forceatlas2, a continuous graph layout algorithm for handy network visualization designed for the gephi software. PLOS ONE, 9(6):1–12, 06 2014.
- [35] A. Peer and K. Ponto. Evaluating perceived distance measures in room-scale spaces using consumer-grade head mounted displays. In 2017 IEEE Symposium on 3D User Interfaces (3DUI), pages 83–86, Los Angeles, CA, USA, March 2017. IEEE.
- [36] Douglas Maxwell, Tami Griffith, and Neal M Finkelstein. Use of virtual worlds in the military services as part of a blended learning strategy., 2014.
- [37] Scott D Roth. Ray casting for modeling solids. Computer Graphics and Image Processing, 18(2):109–144, 1982.
- [38] Mungyeong Choe, Yeongcheol Choi, Jaehyun Park, and Hyun K. Kim. Comparison of gaze cursor input methods for virtual reality devices. International Journal of Human–Computer Interaction, 35(7):620–629, 2019.
- [39] Chen Zhang. Investigation on motion sickness in virtual reality environment from the perspective of user experience. In 2020 IEEE 3rd International Conference on Information Systems and Computer Aided Education (ICISCAE), pages 393–396, Dalian, China, 2020. IEEE.
- [40] Heinrich Hey and Werner Purgathofer. Occlusion culling methods., 2001.
- [41] Jonathan Lazar, Jinjuan Heidi Feng, and Harry Hochheiser. Research Methods in human-computer interaction, 2010.
- [42] Pedro Leon, Blase Ur, Richard Shay, Yang Wang, Rebecca Balebako, and Lorrie Cranor. Why johnny can’t opt out: A usability evaluation of tools to limit online behavioral advertising. In Proceedings of the SIGCHI Conference on Human Factors in Computing Systems, CHI ’12, page 589–598, New York, NY, USA, 2012. Association for Computing Machinery.
- [43] Andrew Blake, Gem Stapleton, Peter Rodgers, and John Howse. How should we use colour in euler diagrams? In Proceedings of the 7th International Symposium on Visual Information Communication and Interaction, VINCI ’14, page 149–158, New York, NY, USA, 2014. Association for Computing Machinery.
- [44] Mohammed Al-Musawi, Andres Ledesma, Hannu Nieminen, and Ilkka Korhonen. Implementation and user testing of a system for visualizing continuous health data and events. In 2016 IEEE-EMBS International Conference on Biomedical and Health Informatics (BHI), pages 156–159, Las Vegas, 2016. IEEE.
- [45] Delfina Malandrino, Donato Pirozzi, Gianluca Zaccagnino, and Rocco Zaccagnino. A Color-Based Visualization Approach to Understand Harmonic Structures of Musical Compositions. In 19th International Conference on Information Visualisation, IV 2015, Barcelona, Spain, July 22-24, 2015, pages 56–61, Barcelona, Spain, 2015. IEEE Computer Society.
- [46] Roberto De Prisco, Nicola Lettieri, Delfina Malandrino, Donato Pirozzi, Gianluca Zaccagnino, and Rocco Zaccagnino. Visualization of Music Plagiarism: Analysis and Evaluation. In 20th International Conference Information Visualisation, IV 2016, July 19-22, 2016, pages 177–182, Lisbon, Portugal, 2016. IEEE Computer Society.
- [47] Delfina Malandrino, Ilaria Manno, Giuseppina Palmieri, Vittorio Scarano, and Giovanni Filatrella. How quiz-based tools can improve students’ engagement and participation in the classroom. In 2014 International Conference on Collaboration Technologies and Systems (CTS), pages 379–386, Minneapolis, MN, USA, 2014. IEEE.
- [48] Roberto Andreoli, Angela Corolla, Armando Faggiano, Delfina Malandrino, Donato Pirozzi, Mirta Ranaldi, Gianluca Santangelo, and Vittorio Scarano. Immersivity and Playability Evaluation of a Game Experience in Cultural Heritage. In 6th International Conference on Digital Heritage. Progress in Cultural Heritage: Documentation, Preservation, and Protection, Cyprus, volume 10058 of Lecture Notes in Computer Science, pages 814–824, Nicosia, 2016. Springer, Cham.
- [49] Bob G. Witmer and Michael J. Singer. Measuring presence in virtual environments: A presence questionnaire. Presence: Teleoper. Virtual Environ., 7(3):225–240, June 1998.
- [50] S. S. Shapiro and M. B. Wilk. An Analysis of Variance Test for Normality (Complete Samples). Biometrika, 52(3/4):pp. 591–611, 1965.
- [51] Michael J. Berry and Gordon Linoff. Data Mining Techniques: For Marketing, Sales, and Customer Support. John Wiley & Sons, Inc., USA, 1997.
- [52] Monica Gruosso, Nicola Capece, Ugo Erra, and Francesco Angiolillo. A preliminary investigation into a deep learning implementation for hand tracking on mobile devices. In 2020 IEEE International Conference on Artificial Intelligence and Virtual Reality (AIVR), pages 380–385, Utrecht, Netherlands, 2020. IEEE.
- [53] Fan Zhang, Valentin Bazarevsky, Andrey Vakunov, Andrei Tkachenka, George Sung, Chuo-Ling Chang, and Matthias Grundmann. Mediapipe hands: On-device real-time hand tracking, 2020.
- [54] Ariel Caputo, Andrea Giachetti, Simone Soso, Deborah Pintani, Andrea D’Eusanio, Stefano Pini, Guido Borghi, Alessandro Simoni, Roberto Vezzani, Rita Cucchiara, Andrea Ranieri, Franca Giannini, Katia Lupinetti, Marina Monti, Mehran Maghoumi, Joseph J. LaViola Jr, Minh-Quan Le, Hai-Dang Nguyen, and Minh-Triet Tran. Shrec 2021: Skeleton-based hand gesture recognition in the wild. Comput. Graph., 99(C):201–211, oct 2021.
Appendix A Appendix
A.1 Preliminary survey questionnaire
-
•
Q1: Do you like videogames?
Strongly disagree Strongly agree
-
•
Q2: How do you rate your experience with video games?
Inexpert Expert
-
•
Q3: How many hours per week do you spend playing video games?
Less than on hour Between one and seven hours
Between eight and fourteen hours Between fifteen and twenty hours More then twenty one hours
-
•
Q4: Which type of video games do you play with?
First-Person-Shooter Adventure Fighting Role-Playing Games Strategy/Tactics Sports
Dance/Rhythm Survival Horror None (I don’t play any video game)
Other (Add here which one)
-
•
Q5: Which type of device do you use when playing video games?
Mouse/Keyboard Kinect Joypad PlayStation None (I don’t play any video game)
Other (Add here which one)
-
•
Q6: Are you left-handed?
Yes No
-
•
Q7: Do you suffer from kinetosis or motion sickness?
Same answer options as Q6
-
•
Q8: In which of the following conditions do you feel discomfort?
Car Car (Rear seat/passenger seat) Boat Airplane Other (Add here which one)
-
•
Q9: Do you have vision deficiencies?
Same answer options as Q6
-
•
Q10: If you answered “Yes” to the previous question, Which type of deficiency do you have?
Open Question
-
•
Q11: Do you wear glasses?
Same answer options as Q6
-
•
Q12: How do you rate your IT experience?
Same answer options as Q2
-
•
Q13: Have you heard of the term “graph”?
Same answer options as Q6
-
•
Q14: How do you rate your experience with graph theory?
Same answer options as Q2
-
•
Q15: With which these natural user interfaces do you have more confidence?
Kinect LeapMotion PlayStation Move None (No familiarity with natural user interfaces)
Other (Add here which one)
-
•
Q16: Do you have familiarity with virtual reality?
Same answer options as Q1
-
•
Q17: Have you ever heard of immersive devices (i.e. HTC Vive, Oculus Rift, IVE)?
Same answer options as Q6
-
•
Q18: If you answered “Yes” to the previous question, which is your experience with immersive devices?
Same answer options as Q2
-
•
Q19: Have you ever needed to interact and visualize data on a graph?
Same answer options as Q6
-
•
Q20: Which type of problems did you encounter? (multiple choices are allowed)
Interaction problems (in terms of personal difficulties) Comprehension Information overloading
Few useful information Orientation None Other (Add here which one)
A.2 Task activities questionnaire
Task One. Given the JPLD graph, “try to find four gray nodes within a fixed amount of time, and try to read their labels.”
-
•
T1_a: How easy was the task to perform?
Very difficult Very easy
-
•
T1_b: Was the system responsive while performing the actions necessary to complete the task?
Strongly disagree Strongly agree
-
•
T1_c: Was the interaction natural when performing the actions?
Strongly disagree Strongly agree
-
•
T1_d: Have you experienced any of the following contraindications?
High sensibility Lack of the field of view of the device Movements limitations
Motor difficulties Dizzines Nausea Tiredness None Other
Task Two. Given the JPLD graph, “explore it to select as many labels as possible (mild recommendation), within a fixed amount of time”. When the user will select a node, it will assume the magenta color.
-
•
T2_a: How easy was the task to perform?
Same answer options as T1_a
-
•
T2_b: Was the system responsive while performing the actions necessary to complete the task?
Same answer options as T1_b
-
•
T2_c: Was the interaction natural when performing the actions?
Same answer options as T1_c
-
•
T2_d: Have you experienced any of the following contraindications?
Same answer options as T1_d
Task Three. Given the JPLD graph, “try to find and cluster gray nodes”. A cluster is made up of at least two nodes. When a cluster is created, the corresponding nodes will group into a red node.
-
•
T3_a: How easy was the task to perform?
Same answer options as T1_a
-
•
T3_b: Was the system responsive while performing the actions necessary to complete the task?
Same answer options as T1_b
-
•
T3_c: Was the interaction natural when performing the actions?
Same answer options as T1_c
-
•
T3_d: Have you experienced any of the following contraindications?
Same answer options as T1_d
A.3 Presence Questionnaire
Based on: Bob G. Witmer and Michael J. Singer. 1998. Measuring Presence in Virtual Environments: A Presence Questionnaire. Presence: Teleoper. Virtual Environ. 7, 3 (June 1998), 225–240
-
1.
I enjoyed the virtual experience
Strongly disagree Strongly agree
-
2.
Exploring and playing the VisGraph3D system made me happy
Same answer options as 1
-
3.
I found the appearance (aesthetics) of the VisGraph3D system to be very impressive
Same answer options as 1
-
4.
I knew how to use the immersive devices with the VisGraph3D system
Same answer options as 1
-
5.
How responsive was the environment to actions that you initiated (or performed)?
Same answer options as 1
-
6.
How natural did your interactions with the environment seem?
Same answer options as 1
-
7.
The game controller sensitivity in the virtual experience was adequate
Same answer options as 1
-
8.
I found the exploration with the immersive devices motivating
Same answer options as 1
-
9.
How involved were you in the virtual environment experience?
Same answer options as 1
-
10.
Were you involved in the experimental task to the extent that you lost track of time?
Same answer options as 1
-
11.
How proficient in moving and interacting with the virtual environment did you feel at the end of the experience?
Same answer options as 1
-
12.
How aware were you of events occurring in the real world around you?
Same answer options as 1
-
13.
How aware were you of your display and control devices?
Same answer options as 1
-
14.
To what degree did you feel confused or disoriented at the beginning of breaks or at the end of the experimental session?
Same answer options as 1
-
15.
How distracting was the control mechanism?
Same answer options as 1
-
16.
How much did the control devices interfere with the performance of assigned tasks or with other activities?
Same answer options as 1
-
17.
I will use the system on a regular basis in the future
Same answer options as 1
-
18.
I will strongly recommend others to use the system
Same answer options as 1
A.4 Post survey questionnaire
-
•
P1: Which symptoms of discomfort you felt when using immersive devices in your configuration?
General discomfort Fatigue Headache Eye strain Difficulty focusing
Salivation increasing Sweating Nausea Difficulty concentrating Fullness of the Head
Blurred vision Dizziness Vertigo Stomach awareness Burping Other
-
•
P2: For which category of users do you think the proposed system can be useful?
All people People expert of the field People with disabilities I don’t know Other
-
•
P3: Do you think the proposed system was useful to use?
Strongly disagree Strongly agree
-
•
P4: Do you think the proposed system was interesting?
Same answer options as P3
-
•
P5: Do you think the proposed system was easy to use?
Same answer options as P3