The Kruskal Wallis test can not be recommended
Abstract
Although the Kruskal-Wallis (KW) test is widely used, it should not be recommended: it is not robust to arbitrary alternatives, it is only a global test without confidence intervals for the marginal hypotheses, it is inherently defined for two-sided hypotheses, it is not very suitable for pre/post hoc test combinations and hard to modified for factorial designs or the analysis of covariance. As an alternative a double maximum test is proposed: a maximum over multiple contrasts against the grand mean (approximating global power as a linear test statistics) and a maximum over three rank scores, sensitive for location, scale and shape effects. The joint distribution of this new test is achieved by the multiple marginal models approach. Related R-code is provided.
1 The Kruskal Wallist test and three alternative proposals
The Kruskal-Wallis test [8] is among the most widely used tests for analyzing randomized one-way designs with treatment groups : as a nonparametric alternative to ANOVA F-test. Its test statistics represent a quadratic form for global ranks (in groups with replicates) for a continuous variable: KW= which is asymptotically distributed or related permutation version are available [3]. For tied data a modified variance estimator is available. The null hypothesis is against the alternative of any heterogeneity, at least , i.e. a global test only. However, in most k-sample layouts, the inference between the treatments is of interest, not just a global outcome of any heterogeneity. Its use as pre-test before post-hoc tests is a confusing concept using quite different alternatives conditionally [2]. It does not provide simultaneous confidence intervals for the interesting marginal hypotheses, is hard to generalize for factorial layouts or adjusting for covariates (ANCOVAR) and is inherently for two-sided hypotheses only.
Here, an alternative approach is proposed which based first on the similar power between ANOVA F-test and a multiple contrast test for comparisons the treatments against the grand mean (MCT-GM) [5]. Therefore, a non-parametric MCT-GM [10] is considered, as a non-parametric global-rank test for relative effect size [6] [7] and as maxT-test over three scores tests (joint double maximum test (Joint)). The maxT-test based on the multiple marginal model approach (mmm) [11]: a first maximum over the multiple contrasts, a second maximum over rank-transformed responses (RT, sensitive against location effects), Ansari-Bradly scores (AB, sensitive against scale effects) and Savage scores (SA, sensitive for Lehman-type alternatives:
. The use of these three scores tests was motivated by a related sum-test over these scores tests [9]. is -variate normal distributed with the correlation matrix between these test statistics- estimated via mmm.
2 Simulations
In a tiny simulation study, size and power of the permutative Kruskal-Wallis test (KW), the joint test (Joint Test), the global rank nonparametric MCT (NonparMCT) and the MCT-GM for most likely transformations (MLT) [4] are compared in a balanced one-way layout with k=4, for Gaussian distribution and a skewed distribution in the Fleishman system (skewness=1.5, kurtosis=3) [1]. Three particular alternatives are considered i) just location, ii) just scale and iii) location-scale:
| Distribution | location | scale | Joint Test | NonparMCT | KW-test | MLT |
|---|---|---|---|---|---|---|
| Normal | 0.065 | 0.051 | 0.046 | 0.055 | ||
| Normal | 0.851 | 0.821 | 0.825 | 0.844 | ||
| Normal | 0.765 | 0.033 | 0.109 | 0.206 | ||
| Normal | 0.853 | 0.121 | 0.245 | 0.386 | ||
| Skewed | 0.067 | 0.057 | 0.053 | 0.048 | ||
| Skewed | 0.910 | 0.975 | 0.908 | 0.888 | ||
| Skewed | 0.799 | 0.074 | 0.163 | 0.302 | ||
| Skewed | 0.975 | 0.913 | 0.647 | 0.543 |
Of course, there can be no most powerful test for these very different alternatives, but the joint test shows consistently high power in these simulations (in bold).
3 An example
As example the reaction time data of mice in a control and 3 treatments design is used [12]:
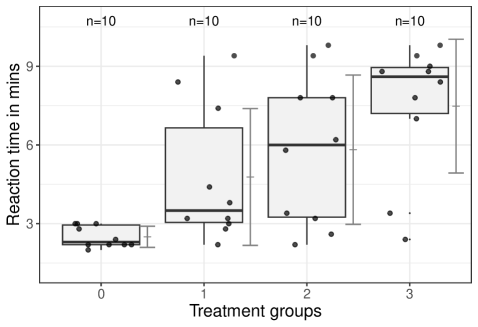
Because the design of this example is , two types of analyses are compared: i) the global test version, ii) the one-sided Dunnett-type version for comparing the treatment groups against the control only.
3.1 Global test
The p-values of the Kruskal-Wallis test (), the MLT (p=0.0015), the NonparMCT-GM () and Joint test () are all small, but the joint test provides more detailed information:
| Effect | Treatment vs. GM | test stat | p-value |
|---|---|---|---|
| location | 0 | -5.90 | 0.00001 |
| location | 1 | 0.07 | 1.00000 |
| location | 2 | 1.04 | 0.90901 |
| location | 3 | 2.99 | 0.04382 |
| scale | 0 | -1.51 | 0.65375 |
| scale | 1 | 1.57 | 0.60633 |
| scale | 2 | 0.61 | 0.99412 |
| scale | 3 | -0.81 | 0.97239 |
| shape | 0 | -4.63 | 0.00061 |
| shape | 1 | -0.40 | 0.99959 |
| shape | 2 | 0.77 | 0.97975 |
| shape | 3 | 2.17 | 0.25429 |
3.2 Dunnett-type evaluation
The one-sided Dunnett-type version for comparing the treatment groups against the control is for the above discussed test versions:
| Effect | Treatment vs. control | NonparamMCT | MLT | Joint |
|---|---|---|---|---|
| ’location’ | 1 - 0 | 0.0022 | 0.0141 | 0.01703 |
| ’location’ | 2 - 0 | 0.0012 | 0.0048 | 0.00295 |
| ’location’ | 3 - 0 | 0.000036 | 0.0004 | 0.00007 |
| scale | 1 - 0 | - | - | 0.19622 |
| scale | 2 - 0 | - | - | 0.46656 |
| scale | 3 - 0 | - | - | 0.90015 |
| shape | 1 - 0 | - | - | 0.25311 |
| shape | 2 - 0 | - | - | 0.04242 |
| shape | 3 - 0 | - | - | 0.00306 |
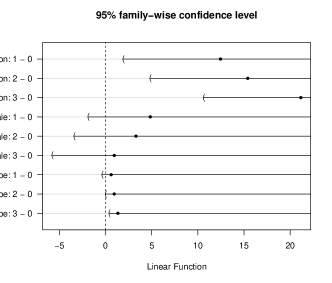
The experimental question is answered directly, that all groups cause an increase of the reaction time and the higher the dose the more significant - and this with very small p-values. The amount of location effect shows the plot with the simultaneous lower confidence limits, at the highest dose at least an increase of 10.6 min:
4 Conclusions
It is clear that even for a global test for an one-way layout for arbitrary distributions no most powerful test can exist.
The alternatives to the KW-test proposed here meet or exceed its power, but prepare additional information, namely adjusted p-values and, or simultaneous confidence intervals on the marginal hypotheses and the joint test provides even information with respect to the underlying location/scale/shape effects. The related R-code is simple and provided within a data example.
Therefore, in summary, I suggest to use one of the alternative global tests instead of the KW-test, or even better instead of a global test (alone or within a pre-test/post-hoc test system) to use a test for the marginal hypotheses of interest, e.g. for comparisons with a control.
5 R-Code
library(nparcomp)
data(reaction)
library(toxbox)
boxclust(data=reaction, outcome="Time", treatment="Group",  ylabel="Reaction time in mins",  xlabel="Treatment groups",
         option="uni", hjitter=0.3, legpos ="none", printN="FALSE", white=TRUE, psize=1.4, vlines="bg")
reaction$group<-as.factor(reaction$Group)
ni<-table(reaction$group); DF=sum(ni-4)
npc<-mctp(Time~group, data=reaction, type ="GrandMean", alternative ="two.sided",
          asy.method = "mult.t", plot.simci = FALSE, control = NULL, info = FALSE,
          correlation = FALSE)

library(coin)
kwp<-pvalue(kruskal_test(Time~group, data=reaction, distribution ="approximate"))

reaction$AB<- ansari_trafo(reaction$Time, ties.method ="mid-ranks")
reaction$SA<-savage_trafo(reaction$Time, ties.method ="mid-ranks")
reaction$Rldl<- rank(reaction$Time)
mod2<-lm(Rldl~group, data=reaction)
mod3<-lm(AB~group, data=reaction)
mod4<-lm(SA~group, data=reaction)
library(multcomp)
Joint2 <- glht(mmm(location = mod2, scale= mod3, shape=mod4), mlf(mcp(group ="GrandMean")), df=DF)

library(tram)
TO<-glht(Colr(Time~group, data=reaction), linfct = mcp(group = "GrandMean"), df=DF)
References
- [1] A.I. Fleishman. A method for simulating non-normal distributions. Psychometrika, 43(4):521–532, 1978.
- [2] L.A. Hothorn. The two-step approach-a significant ANOVA F-test before Dunnett’s comparisons against a control-is not recommended. Comm.Stat. A, 45(11):3332–3343, 2016.
- [3] T. Hothorn, K. Hornik, M. A. V. van de Wiel, and A. Zeileis. Implementing a class of permutation tests: The coin package. Journal of Statistical Software, 28(8):8, November 2008.
- [4] T. Hothorn, L. Most, and P. Buhlmann. Most likely transformations. Scandinavian Journal of Statistics, 45(1):110–134, March 2018.
- [5] F. Konietschke, S. Bosiger, E. Brunner, and L. A. Hothorn. Are multiple contrast tests superior to the ANOVA? International Journal of Biostatistics, 9(1):63–73, May 2013.
- [6] F. Konietschke and L. A. Hothorn. Rank-based multiple test procedures and simultaneous confidence intervals. Electronic Journal of Statistics, 6:738–759, 2012.
- [7] F. Konietschke, M., F. Schaarschmidt, and L.A. Hothorn. nparcomp: An R Software Package for Nonparametric Multiple Comparisons and Simultaneous Confidence Intervals. Journal of Statistical Software, 64(9), 2015.
- [8] W.H. Kruskal and W.A. Wallis. Use of ranks in one-criterion variance analysis. Journal of the American Statistical Association, 47(260):583–621, 1952.
- [9] A. Mukherjee, W. Kössler, and M. Marozzi. A distribution-free procedure for testing versatile alternative in medical multisample comparison studies. Statistics in Medicine, 41:2978-3002, 2022.
- [10] P. Pallmann and L. A. Hothorn. Analysis of means: a generalized approach using r. Journal of Applied Statistics, 43(8):1541–1560, June 2016.
- [11] C. B. Pipper, C. Ritz, and H. Bisgaard. A versatile method for confirmatory evaluation of the effects of a covariate in multiple models. Journal of the Royal Statistical Society Series C-Applied Statistics, 61:315–326, 2012.
- [12] E. Shirley. Nonparametric equivalent of Williams test for contrasting increasing dose levels of a treatment. Biometrics, 33(2):386–389, 1977.