The LuViRA Dataset: Measurement Description
Abstract
We present a dataset to evaluate localization algorithms, which utilizes vision, audio, and radio sensors: the Lund University Vision, Radio, and Audio (LuViRA) Dataset. The dataset includes RGB images, corresponding depth maps, IMU readings, channel response between a massive MIMO channel sounder and a user equipment, audio recorded by 12 microphones, and 0.5 mm accurate 6DoF pose ground truth. We synchronize these sensors to make sure that all data are recorded simultaneously. A camera, speaker, and transmit antenna are placed on top of a slowly moving service robot and 88 trajectories are recorded. Each trajectory includes 20 to 50 seconds of recorded sensor data and ground truth labels. The data from different sensors can be used separately or jointly to conduct localization tasks and a motion capture system is used to verify the results obtained by the localization algorithms. The main aim of this dataset is to enable research on fusing the most commonly used sensors for localization tasks. However, the full dataset or some parts of it can also be used for other research areas such as channel estimation, image classification, etc. Fusing sensor data can lead to increased localization accuracy and reliability, as well as decreased latency and power consumption. The created dataset will be made public at a later date.
Index Terms:
Localization, Data set, Sensor fusionI Introduction
Fully autonomous driving and human-free smart factories are expected to significantly increase life quality [1][2]. To build an autonomous smart factory, one of the most critical challenges is performing accurate localization and monitoring of autonomous service robots in real-time. The most commonly used sensors in robots and indoor environments are cameras, microphones, and radio-frequency (RF) modules. Accurately localizing the robots can be achieved using these sensors even when the global navigation satellite system’s (GNSS) signal is unavailable. These conditions usually occur in indoor environments; e.g. a service robot in a factory needs to localize itself within cm level accuracy to perform tasks such as lifting an object, placing an object, etc.
In recent years, localization algorithms using different sensors such as cameras, RF modules, and microphones have developed immensely. In vision-based localization, algorithms such as ORB-SLAM3[3] and DROID-SLAM[4] have reached centimeter-level accuracy by both localizing the sensor and mapping the environment. In radio-based localization, multiple-input and multiple-output (MIMO) antenna arrays are used to localize radio transmitters with high accuracy [5]. Audio-based localization has also become popular in recent years, enabling both the sound source and microphone localization down to centimeter-level accuracy [6][7]. Yet, all of these algorithms also require high computing capability, power consumption, and/or large training datasets.
Vision, radio, and audio-based localization have their own advantages and disadvantages in terms of accuracy, reliability, complexity, and timing performance. For example, vision-based localization algorithms can achieve very high accuracy in real-time while they cannot operate in a dark scenario. Radio and audio based localization algorithms are not affected by the lack of light in the room. On the other hand, if the audio noise level of the room is very high, audio-based localization techniques are neither accurate nor reliable. By combining information from these sensors, each system’s disadvantage can be counteracted by the advantages of the others. This can lead to reduced power consumption, high reliability, increased accuracy, and higher confidence in the estimated locations. However, to develop and evaluate algorithms that fuse data from these sensors, a dataset that includes sensor readings from each sensor is required.
Public datasets and benchmarks are key for evaluating the algorithms designed by the scientific community. EuRoC [8], KITTI[9] and TUM RGB-D [10] datasets are best-known datasets in computer vision area [11]. EuRoC dataset includes data from two cameras, an IMU, a laser tracker, motion capture, and a 3D scanner. KITTI dataset allows outdoor localization methods using LiDAR, monochrome and color cameras to be evaluated with RTK-GPS&INS data as ground truth. For RGB-D camera-based localization methods, TUM RGB-D dataset is a very popular choice. There are fewer public datasets for the evaluation of radio and audio based localization algorithms. KU Leuven [12] and StuctureFromSound [13] are examples of public datasets for radio and audio based localization methods, respectively. KU Leuven dataset contains measured channel state information (CSI) between a user and a massive MIMO testbed. StuctureFromSound dataset is collected with 12 microphones and a motion capture system is used to track ground truth labels of a sound source. However, to the best of our knowledge, there is no public dataset that includes synchronized data from vision, radio, and audio sensors.
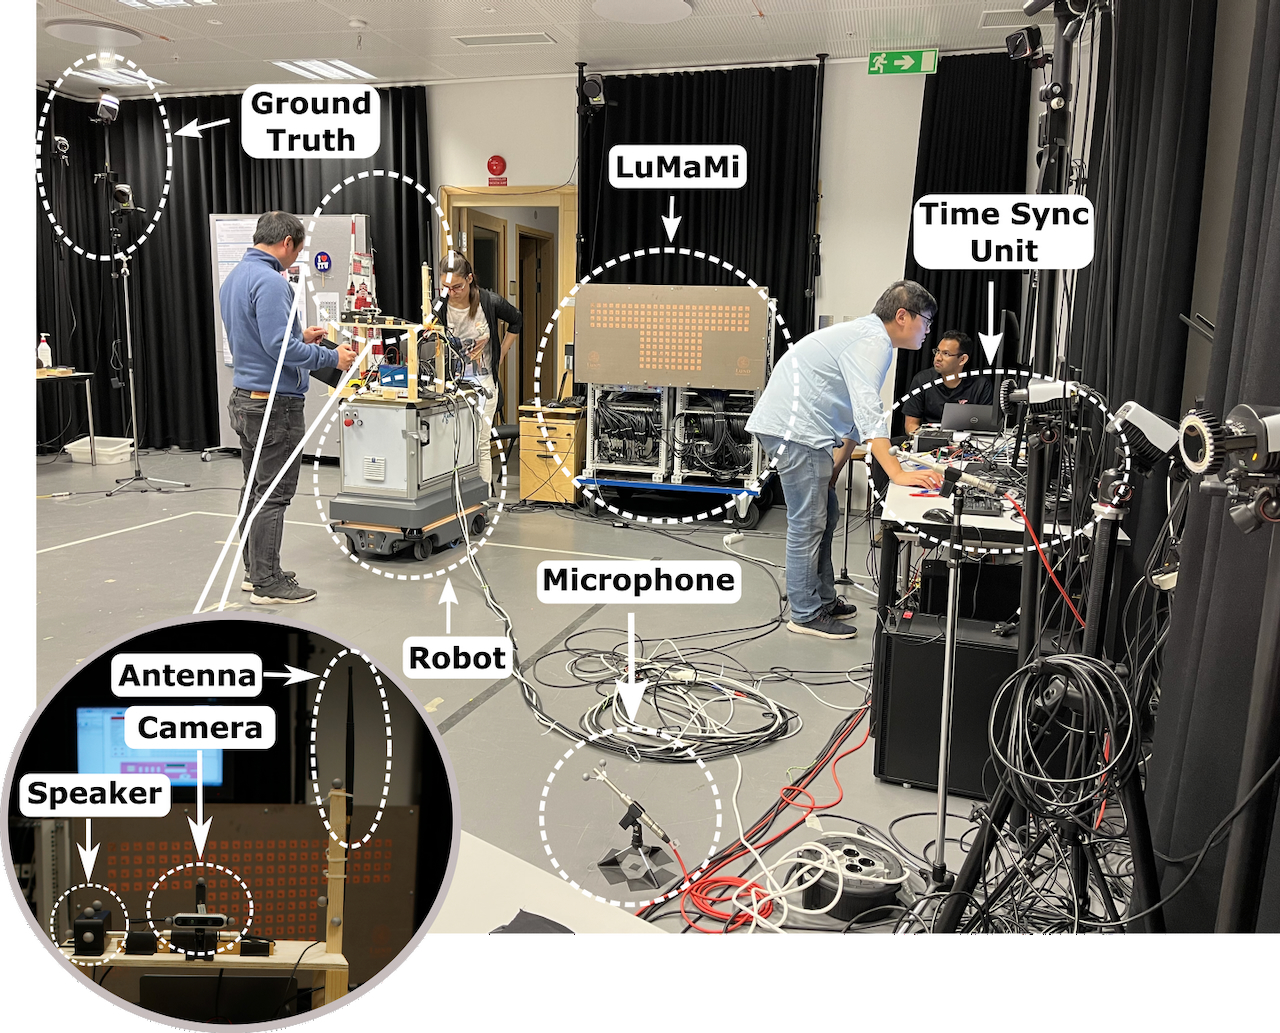
This paper presents the measurement description of a novel dataset that includes data from vision, audio, and radio sensors in an indoor environment: The Lund University Vision, Radio, and Audio (LuViRA) Dataset. Our dataset consists of 88 trajectories that are recorded in Lund University Humanities Lab’s motion capture (mocap) studio using a mobile industrialized robot (MIR200). Each trajectory contains data from four different systems, different sensors, and a ground truth system that can provide mm accuracy. These systems are synchronized using a time synchronization unit. A general overview of the systems is shown in Fig. 1. In the next section, the measurement setup which includes the environment of the measurement campaign and the ground truth system is described. The setup of different sensors will be described in the third section. The synchronization unit that combines all the sensors and the calibration of different systems will be explained in the fourth section. The different trajectories created as a result of the measurement campaign will be the main topic of the fifth section, followed by the format used to store collected data and known limitations of the dataset in the sixth and seventh sections.
II Measurement Setup
As mentioned in the introduction, the measurement campaign took place in Lund University Humanities Lab’s motion capture (mocap) studio. A top-down view of the environment and the sensor placement in the room can be seen in Fig. 2. A area in the center of the room is chosen as the effective area where the trajectories are recorded.
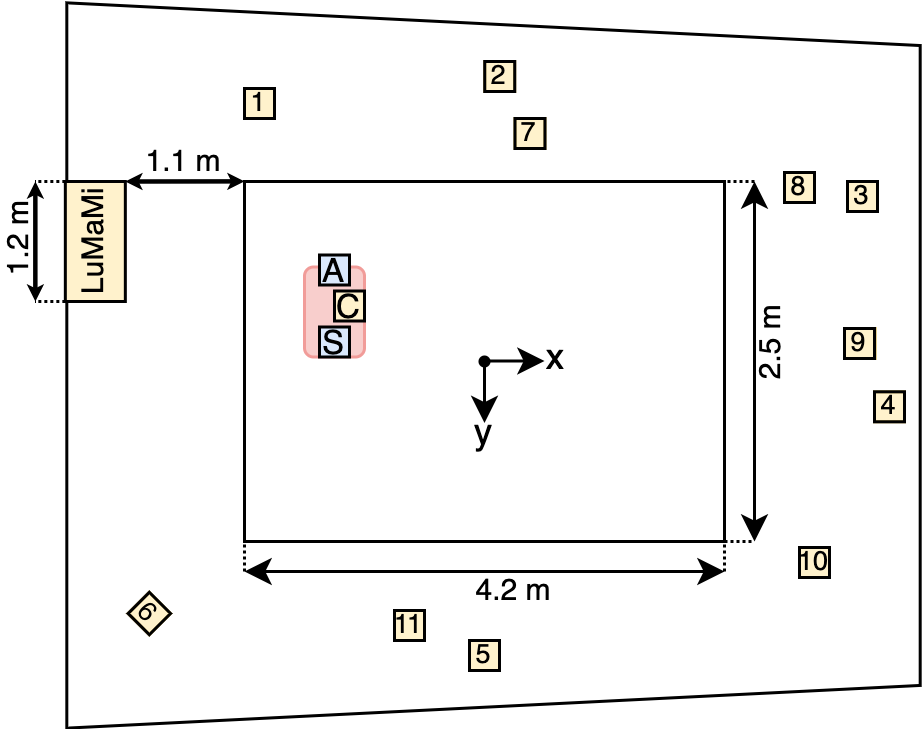
Many precautions have been taken to create a controlled environment in the mocap studio for our measurement campaign. Most importantly, a robot MIR200 is used to move a camera, a single antenna user equipment (UE), a sound source (speaker), and the equipment connected to them. The camera, antenna, and speaker are placed on a higher-level platform built for this measurement campaign which can be seen in Fig. 1. The platform ensures that the sensors have dedicated and stable locations on the robot and have an unobstructed view of the environment. The rest of the equipment is placed around this effective area. The size of the effective area is decided based on many factors but the main reason is the coverage of the ground truth system. The ground truth system is the most accurate when several cameras can see the markers. On the side of the rooms, some markers are usually blocked by other objects and the ground truth system’s localization accuracy decreases. At the beginning of the measurements, the ground truth system is calibrated. The accuracy of the ground truth system is measured as mm in the effective area, during the calibration step. Due to the achieved high accuracy, the mocap system is used as a ground truth system throughout all the measurements. The produced calibration file is provided along with the ground truth files.
During the movement of the robot, a high-precision motion capture (mocap) system is used as a ground truth/reference system to track the 3D positions of the robot and the sensors in real-time with millimeter accuracy. The networked high-speed infrared (IR) cameras of the mocap system (Qualisys) are used at Hz throughout the measurement campaign, and a dedicated tracking software (QTM app) runs on an ordinary workstation. All cameras are connected to the Qualisys Sync Unit (synchronization box) for accurate synchronization. The synchronization box is also connected to the desktop with the QTM application for controlling the cameras. The QTM application is used to record, pre-process and post-process the ground truth data. By placing reflective spherical markers on moving objects, this system calculates 3D positions and trajectories and with a rigid setup of at least markers on an object, the system provides six degrees of freedom (6DoF) data, i.e., 3D orientation plus the 3D position. The orientation is given by default both as Euler angles (yaw-pitch-roll) and the rotation matrix. The system creates two different files for the rigid objects and all the markers existing in the environment.
The local origin (center) of a rigid object is computed by calculating the mean of the position of the markers. The local origin and direction of a rigid body can be edited and 6DoF data reprocessed in the QTM application. In the same way, an extra ‘virtual’ marker can be added by defining its 3D position relative to other markers in that rigid body. Both techniques are convenient if a position of interest cannot be represented by a physical marker while being inside or outside a physical object or in the way for some reason. The antenna array of the LuMaMi testbed has real markers attached and one virtual added and defined to represent the top of the antenna and used as a baseline for the localization algorithm. The camera and the speaker have and markers respectively.
III Sensor Setup
This section gives detailed descriptions of the radio, vision, and audio systems and their setups. In addition to Fig. 1, a summary of all the recorded sensors and their features are outlined in Table I. For completeness, the ground truth system is also added to the table.
| System | Snapshot | Sensor | Source/ | File |
|---|---|---|---|---|
| Rate | Target | Format | ||
| Radio | Hz | LuMaMi testbed | UE | .txt |
| with antennas | ||||
| Vision | - fps | Intel® RealSense™ | lights | .pnga |
| depth camera | ||||
| Audio | up to | 12 | speaker | .flacb |
| kHz | microphones | |||
| Mocap | Hz | 18 high | markers | .txt |
| speed cameras | ||||
| aAlso available as rosbags. | ||||
| bAlso available as wave files (.wav). | ||||
III-A Radio system
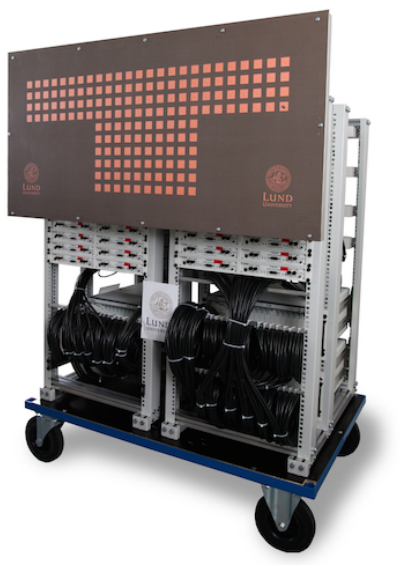
The Lund University Massive MIMO (LuMaMi) [14] testbed is shown in Fig. 3 and used in the measurement campaign as a channel sounder in the radio system. A universal software radio peripheral (NI X310) connected to a single dipole antenna is used as a UE. During the measurement campaign, the UE is moved on top of the robot, following the mentioned trajectories while LuMaMi remains static. The center frequency of LuMaMi is GHz and we utilize antennas that are connected to individual RF chains. To establish frequency synchronization between LuMaMi and the UE, cable sync is used so that carrier frequency offset is eliminated. To exploit more information from the azimuth compared to the elevation domain, a wide antenna configuration of LuMaMi is selected rather than a quadratic one.
III-B Camera system
An Intel® RealSense™ D435i camera is used as a sensor for the vision system. Each snapshot of visual data includes an RGB image, left and right images (black and white images with depth information embedded in the images), a depth map, a point cloud, and IMU data. The IMU data is collected by two sensors: an accelerometer (accel) and a gyroscope (gyro). The camera is connected to an Ubuntu 18.04, i7 laptop with only USB-2 ports available. The features are captured by using Robot Operating System (ROS) and rosbag file format. The images, depth maps, and the IMU data are extracted as .png, .png, and .csv files respectively as a part of the post-processing step. The frequency of different features is chosen based on the maximum bandwidth of the USB-2 bus. Important to note is that since the left and right images have embedded depth information (with the help of a filter), using these images as stereo-based SLAM gives lower accuracy compared to non-filtered images. The effect of the rolling shutter camera is ignored since the camera is placed on top of a relatively stable robot and at a low speed. A summary of all the features of the camera is given in Table II.
| Sensor | Snapshot | Resolution | File |
|---|---|---|---|
| Rate | Format | ||
| RGB camera | fps | x | .pnga |
| Left Imager | fps | x | .pnga |
| Right Imager | fps | x | .pnga |
| Depth map | fps | x | .pnga |
| IMU - gyro | Hz | N/A | .txt |
| IMU - accel | Hz | N/A | .txt |
| aAlso available as rosbags. | |||
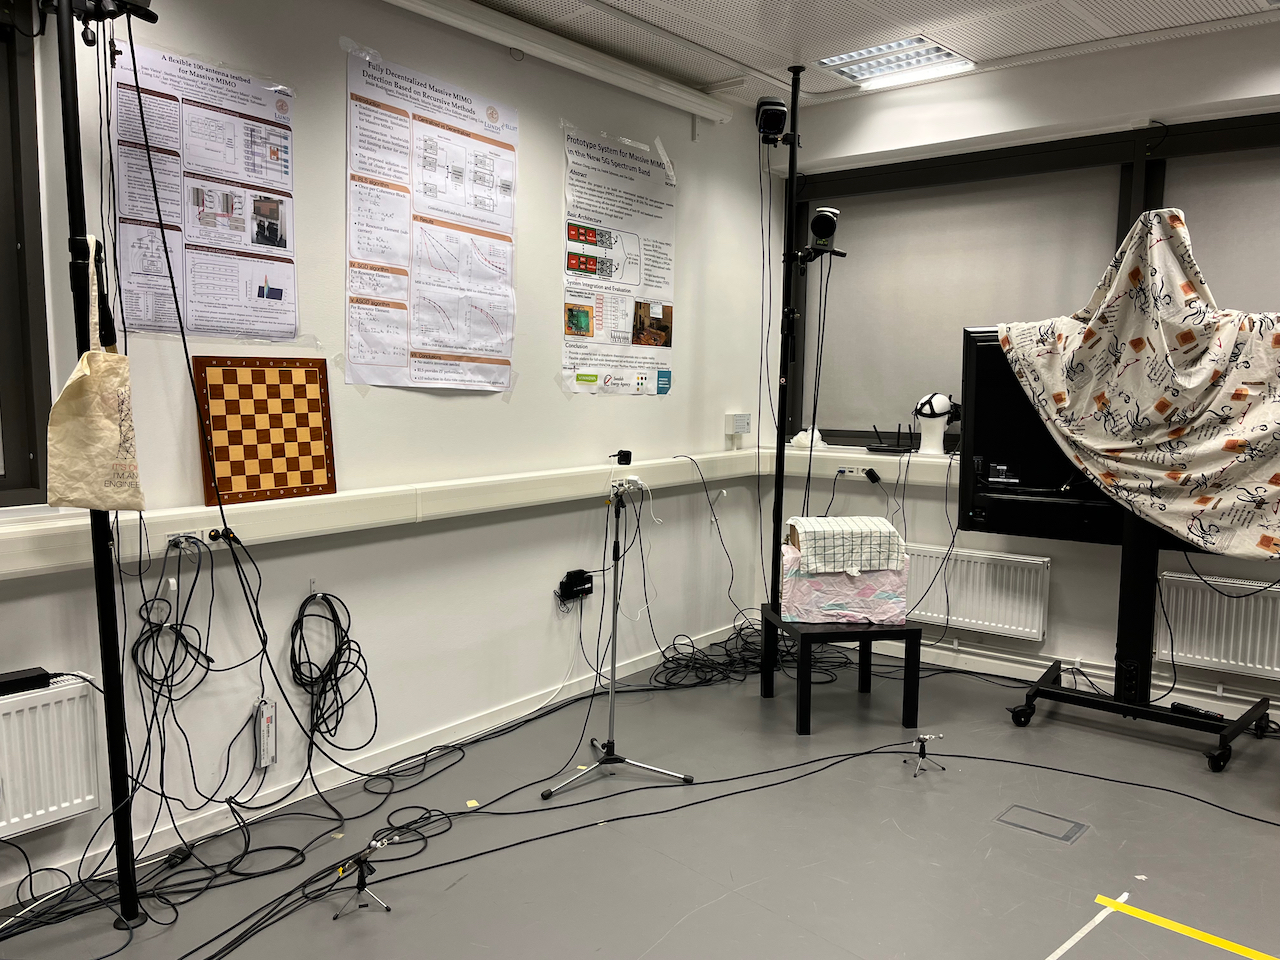
The mocap studio is decorated with posters and objects with different textures to enable feature extraction in vision-based localization. Some example decorations can be seen in Fig. 4.
As can be seen from Table II, different sensors in the camera have different snapshot rates. Thus, when these sensors will be used together, the data should be associated with each other based on their timestamps. An example code that uses the sensor with the lowest snapshot rate as a reference and maps the others using the smallest time difference between timestamps, is given with the dataset for reference. For future dataset creation, we suggest choosing the same fps for the RGB and infra cameras and depth map as well as the same frequency for accel, and gyro, if possible.
III-C Audio system
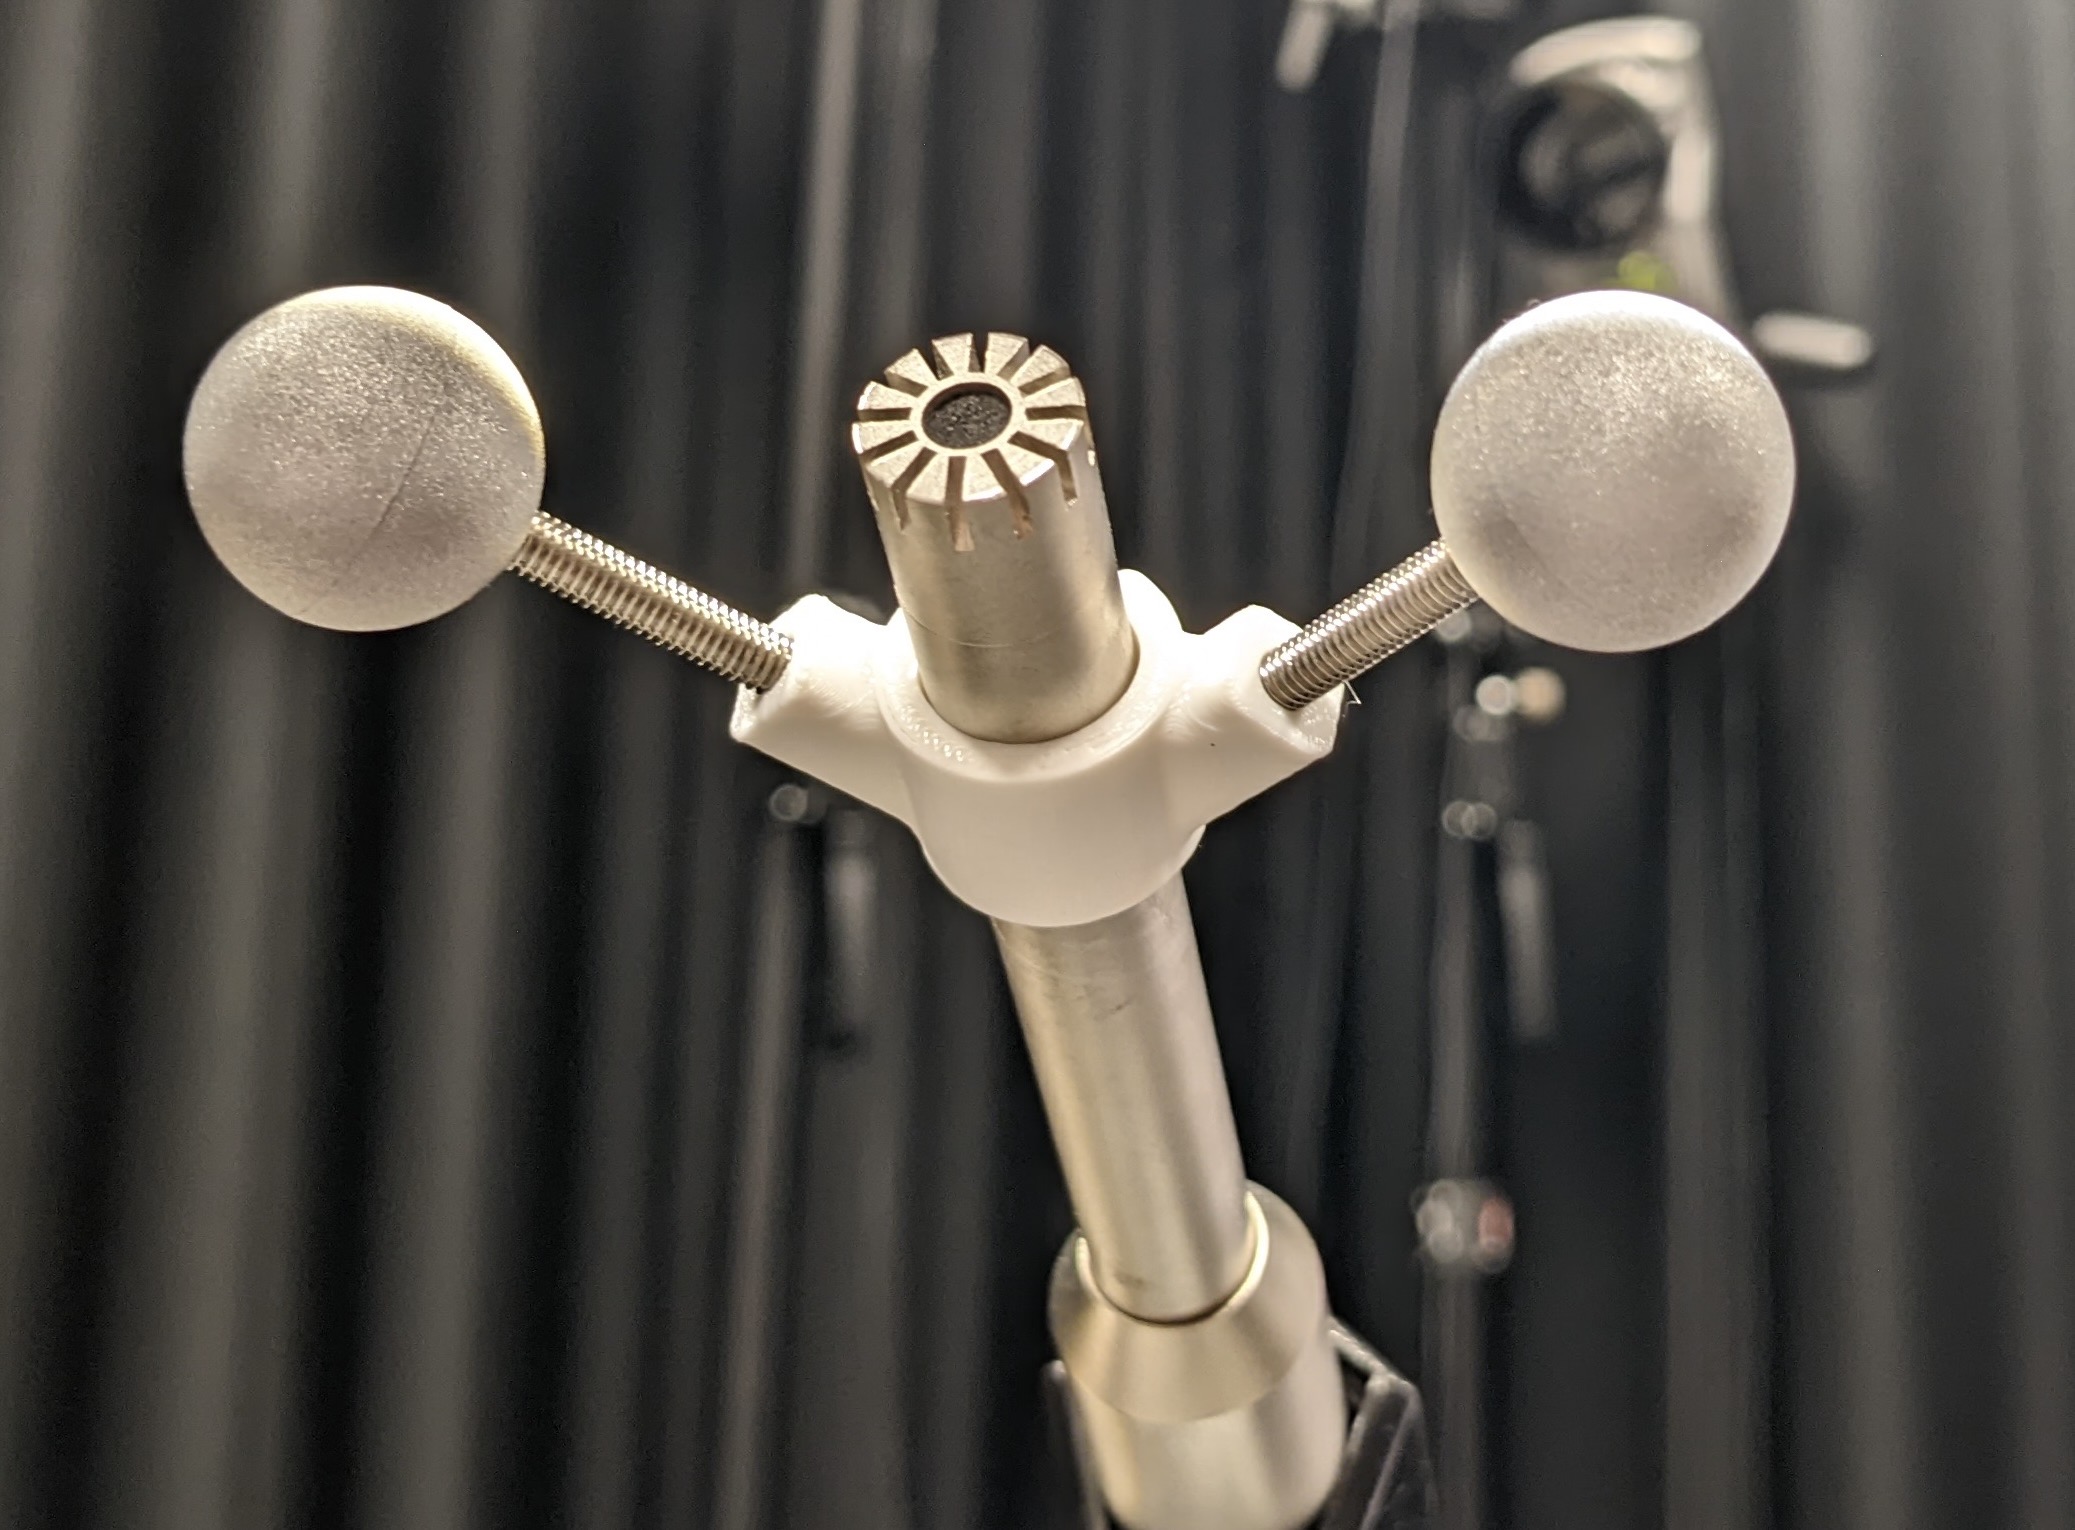
Twelve microphones (T-bone MM-1) are set up in the environment and connected to a sound card that is connected to a laptop. The sound level of every microphone is checked individually and the speaker is tested. One of the microphones is placed on the robot and the rest are spread around the effective area as depicted in Fig. 2. The microphone on the robot is placed as close as possible to the speaker (sound source) and worked as a reference, essentially synchronizing the speaker with the microphones. In addition to the audio tracks, a th track, “Sync”, recorded a synchronization pulse from the ground truth system (on start and stop). In order to make calculations easier by viewing the sound source as a point source, only one side of the speaker is enabled (playing sound) and the head of the microphone on the robot is placed directly in front of the sound source. All microphones, except the one in the robot, have two markers placed, as seen in Fig. 5.
The sampling frequency of the microphones is kHz and if required, the audio system can localize the speaker in the same frequency. However, to decrease the execution time of the localization algorithm, the samples are usually divided into windows instead of continuous localization and assume the speaker’s location is constant during that window.
Microphones on the floor are placed asymmetrically to avoid microphones being co-linear or co-planar (as this may cause degeneracies when solving for positions) and as close as possible to the effective area to get an accurate ground truth label.
IV Calibration and Synchronization
In this section, we outline the calibration and synchronization procedures of different systems in the dataset. As an overview, the camera (and the IMU) used for the vision system is calibrated internally and externally while the internal calibrations of the sensors used for radio and audio systems are not done by us. Moreover, synchronizing the timestamps of the sensor data is required to match the data recorded from different systems. We take many steps to make sure the timestamps can be matched for each sensor (and the ground truth) so the collected data can be verified with the ground truth data and used for sensor fusion. The verification of the time synchronization in different systems is also described below.
IV-A Internal and External Calibration of the sensors
For the Intel® RealSense™ Depth Camera D435i, two internal calibrations are done. For the first calibration, we follow the calibration procedure proposed by the manufacturer for the best performance. The second calibration is done via the calibration tool Kalibr [15]. With this calibration, the intrinsic and extrinsic parameters of the camera are extracted. The intrinsic parameters obtained with this method include camera centers, focal length and distortion parameters of the cameras, and noise information for the IMU. The relationship between different cameras (i.e., two infra cameras and the RGB camera) and the transformation matrix between the cameras and IMU are obtained and used as extrinsic parameters of the camera.
The relationship between sensors is also calculated as a part of the external calibration. Both antenna and speaker are considered point sources, and as a result, the orientations of the antenna and speaker are not relevant. The camera center has been chosen as the origin of the system. Thus, the translation matrices for antenna-to-camera and speaker-to-camera have been provided with the rest of the calibration files.
Obtained data is formatted as YAML files, with one file for each ORB-SLAM3 mode (Monocular, Monocular-Inertial, Stereo, Stereo-Inertial, RGB-D, etc.). However, it should be noted that there are differences in the data structure of the YAML file generated by Kalibr and the one required for ORB-SLAM3. To assist with collecting the information from various sources and performing necessary format conversion, we have created a separate script that handles the conversion automatically [16].
IV-B Time Synchronization
The time synchronization of different systems relies on the time synchronization unit in Fig. 1 which is composed of a Raspberry Pi and the Qualisys sync unit. An NTP server is established by using the Raspberry Pi to synchronize all the computers regularly except the computer used for sound recordings (even when there are other circuits to sync the different systems). The summary of all the methods used to synchronize the systems and how we verified the synchronization can be found below:
-
•
Radio: One of the Input/Output (IO) pins of the Raspberry Pi with interrupt function is connected to the Qualisys Sync Unit (synchronization box), in order to listen to the short pulse (TTL signal) sent by the ground truth system. The timestamp of the TTL signal is logged at that moment as . Another IO pin is connected to the control port of an RF switch on the robot, therefore, timestamps when UE starts and stops transmission are recorded as and . In addition, the periods of pilot signal transmission and position label update are both fixed to ms. This enables us to calculate all timestamps with respect to all transmitted pilot signals and all reported positions based on , , and . As a next step, each UE pilot as well as their corresponding received channel matrices are matched with recorded positions by finding the position label which has the smallest timestamp difference. This time difference is limited to a maximum of ms and the robot is moving at a low speed (). The time-stamp mismatch results in a maximum mm ground truth error, which is trivial and thus negligible.
-
•
Vision: The NTP server in the Raspberry Pi is used to update the clock in the laptop that is used to record all the vision data. The connection is established via an Ethernet cable and the accuracy of the system is validated up to ms (the frame rate of the camera) with the help of a LED connected to the circuit used for the radio system.
-
•
Audio: A separate circuit is built to convert the TTL signal from the synchronization box to an audio signal which is passed to the sound card as a separate channel, as described above. In the audio recordings, the th channel is the recording of the pulse which gets triggered when the mocap system started recording and when it stopped.
V Created Trajectories
There are trajectories collected in this measurement campaign. To meet all the requirements of different systems, we divide the dataset into two parts: the “grid” and “random” data. The “grid” data consists of trajectories while “random” data consists of trajectories. All the trajectories are divided into small trajectories because of the limited amount of continuous data LuMaMi can store at a time. Based on the previous experiments, we calculate the maximum amount of time that LuMaMi can keep capturing data continuously as s (which includes the time it takes to establish the synchronization between all the systems). If longer trajectories are required, the data can be used jointly instead.
V-A Grid Data
One of the main considerations for designing the trajectories is to support dense sampling for radio-based localization algorithms. Thus, the spatial sampling of the data should be less than (half wavelength) according to the Nyquist theorem. The wavelength of LuMaMi is calculated as approximately cm and as a result, the training data is created such that it consists of measurements of the channel response approximately every cm. In order to generate data that satisfies this condition, we scan the target area in the room in trajectories and called this part the “grid data”.
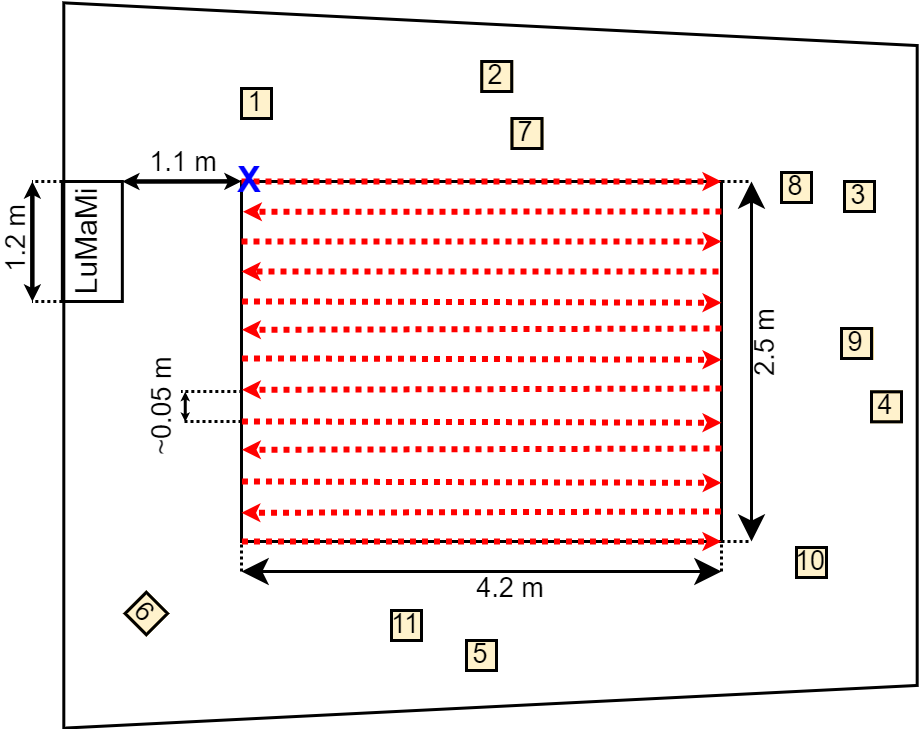
To achieve the given resolution, the robot is placed on the left-top corner of the effective area for the first grid measurement. With the help of ROS, the robot is moved m in a straight line with a speed of . Fig. 6 shows the overall summary of the environment and planned trajectory for this part. However, in the actual measurement campaign, a slight deviation from the straight line is seen for each grid trajectory. As a result of the changes in the trajectories and the limited time available in the mocap studio, area is covered with parallel trajectories for the “grid” data. For all the grid trajectories, a chirp sound is played by the speaker.
V-B Random Data
In contrast, the second measurement scenario covered several different movement trajectories that are either programmed with ROS to create trajectories that do not exist in the “grid data” or by using the interface provided by the company that manufactured the robot. Thus, compared with the first scenario, the robot orientation is not always perpendicular to the antenna array while humans act as static or dynamic scatters in several trajectories. These trajectories are called “random” data. In addition, sounding pilots are transmitted following the same pattern as the first scenario while the sampling rates of different systems remain the same. We conduct a total of measurements, which are shown in Fig. 7.

The circular trajectories are specifically designed for localization algorithms where loop closure is desirable. The diagonal trajectories are corner cases for audio-based localization algorithms since they can cause some self-calibration methods for the audio system to fail [17]. In the manual trajectories, the robot is controlled by the built-in user interface with the virtual joystick. Thus, the speed of the robot is not constant, the movements are more unstable and faster compared to the speed and movement of the robot in “grid” data. The random manual trajectories number 1, 2, and 5 include people moving around whereas number 3 and 4 do not. For the trajectories with people moving around in them, ground truth has dropped more frames due to markers not being seen by enough cameras. Moreover, for all the sensors tested, these trajectories are particularly hard to localize and map due to the very dynamic environment. All the trajectories are fully in Line-of-Sight (LoS) from the point of view of LuMaMi except for the random manual trajectories with people walking around. In some cases in these trajectories, the LoS between LuMaMi and the UE is obstructed by people and/or cables. We expect that the dynamic environment in these trajectories affects all the localization methods.
VI Format of the Data Storage
The data is cut from s before the movement starts to s after the movement ends. As mentioned above, the duration of the random manual trajectories is restricted by the amount of time LuMaMi can record the trajectory (e.g. duration of the grid trajectories is all around s since the movement of the robot is set to approximately s). For the rest of the trajectories, the movement of the robot stops before LuMaMi stops recording so their duration is limited by the robot’s movement. The ground truth data exist both as 3D and 6DoF data and the orientation of the objects is expressed as rotation matrix and Euler angles. The data provided for the radio system is formatted as (frequency, time, antenna).
As mentioned before, LuMaMi creates a high background noise throughout the measurements because of the need for a powerful cooling system. A recording of only the background noise existing in the environment is also given to enable background noise removal for the audio-based localization algorithms.
VII Known limitations and remarks
The following limitations and remarks should be considered when using the dataset:
-
•
Due to the requirements of the different systems, a bundle of cables is added to the system that connects the robot to different systems outside the effective area. For some of the trajectories, the cables are hanging from the roof to avoid complications in the scene due to the robot’s movement. For the radio system, the cables become a part of the channel which might affect the accuracy of the localization algorithm. For the vision system, the cables are seen by the camera in some frames and create a dynamic environment. Moreover, the movement of the robot is restricted by the cables that were attached to it.
-
•
The “grid” part of the dataset includes the movement facing the same direction of the studio due to the previous remark/limitation (cables). This results in the same viewing direction for the camera and the same direction between the antenna that is connected to the UE and LuMaMi. For the vision data, random trajectories can be used instead.
-
•
The temperature of the mocap studio has increased significantly throughout the measurements due to the equipment in the studio. After the change in the temperature was noticed, the room is measured almost every hour for the second and the third day of the experiments but the temperature data do not exist for the first day where the room got significantly warmer in the evening. We believe the temperature was around . The internal temperature change of the devices was not recorded. The change in the temperature affects the propagation medium of the air, which can have an impact on the audio and radio based localization algorithms. This is only important for using the “grid” data and there is no significant temperature change observed for the “random” data.
VIII Conclusion
Localization is an essential process for many different tasks and devices such as UAVs, autonomous cars, and service robots. Localization algorithms require high computation power where low power and high efficiency is the key to enabling these new technologies in battery-operated devices. In this paper, we have described a novel dataset that includes different sensor (vision, audio, and radio sensors) data in the given environment to accurately position devices (within cm) in real-time. Overall, the dataset will contribute to the creation of localization algorithms that maximize the usage of the available data for low-power devices and also provide an in-depth understanding and further development of AI/Machine learning and 6G applications.
Acknowledgment
The authors would like to thank Lund University Humanities Lab, Volker Kruger from the Department of Computer Science, Anders Robertsson from the Department of Automatic Control, and Sirvan Abdollah Poor, Jesús Rodríguez Sánchez and Sara Gunnarsson from the Department of Electrical and Information Technology in Lund University for providing resources, technical support and assistance in our measurement campaign.
References
- [1] S. Wang, J. Wan, D. Zhang, D. Li, and C. Zhang, “Towards smart factory for industry 4.0: a self-organized multi-agent system with big data based feedback and coordination,” Computer Networks, vol. 101, pp. 158–168, 2016.
- [2] E. Yurtsever, J. Lambert, A. Carballo, and K. Takeda, “A Survey of Autonomous Driving: Common Practices and Emerging Technologies,” IEEE Access, vol. 8, pp. 58443–58469, 2020.
- [3] C. Campos, R. Elvira, J. J. Gömez, J. M. M. Montiel, and J. D. Tardös, “ORB-SLAM3: An accurate open-source library for visual, visual-inertial and multi-map SLAM,” IEEE Transactions on Robotics, vol. 37, no. 6, pp. 1874–1890, 2021.
- [4] Z. Teed and J. Deng, “DROID-SLAM: Deep Visual SLAM for Monocular, Stereo, and RGB-D Cameras,” 2021.
- [5] E. Gönültaş, E. Lei, J. Langerman, H. Huang, and C. Studer, “CSI-Based Multi-Antenna and Multi-Point Indoor Positioning Using Probability Fusion,” IEEE Trans. Wireless Commun., vol. 21, no. 4, pp. 2162–2176, 2022.
- [6] S. Zhayida, F. Andersson, Y. Kuang, and K. Åström, “An automatic system for microphone self-localization using ambient sound,” in 2014 22nd European Signal Processing Conference (EUSIPCO), pp. 954–958, IEEE, 2014.
- [7] M. Larsson, G. Flood, M. Oskarsson, and K. Åström, “Fast and robust stratified self-calibration using time-difference-of-arrival measurements,” in ICASSP 2021-2021 IEEE International Conference on Acoustics, Speech and Signal Processing (ICASSP), pp. 4640–4644, IEEE, 2021.
- [8] M. Burri, J. Nikolic, P. Gohl, T. Schneider, J. Rehder, S. Omari, M. W. Achtelik, and R. Siegwart, “The EuRoC micro aerial vehicle datasets,” The International Journal of Robotics Research, 2016.
- [9] A. Geiger, P. Lenz, C. Stiller, and R. Urtasun, “Vision meets Robotics: The KITTI Dataset,” International Journal of Robotics Research (IJRR), 2013.
- [10] J. Sturm, N. Engelhard, F. Endres, W. Burgard, and D. Cremers, “A Benchmark for the Evaluation of RGB-D SLAM Systems,” in Proc. of the International Conference on Intelligent Robot Systems (IROS), Oct. 2012.
- [11] Y. Liu, Y. Fu, F. Chen, B. Goossens, W. Tao, and H. Zhao, “Simultaneous localization and mapping related datasets: A comprehensive survey,” 2021.
- [12] S. De Bast, A. P. Guevara, and S. Pollin, “CSI-based Positioning in Massive MIMO systems using Convolutional Neural Networks,” 2019.
- [13] K. Åström, M. Larsson, G. Flood, and M. Oskarsson, “Extension of Time-Difference-of-Arrival Self Calibration Solutions Using Robust Multilateration,” in 2021 29th European Signal Processing Conference (EUSIPCO), pp. 870–874, 2021.
- [14] S. Malkowsky, J. Vieira, L. Liu, P. Harris, K. Nieman, N. Kundargi, I. Wong, F. Tufvesson, V. Öwall, and O. Edfors, “The World’s First Real-Time Testbed for Massive MIMO: Design, Implementation, and Validation,” IEEE Access, pp. 9073 – 9088, 2017.
- [15] P. Furgale, J. Rehder, and R. Siegwart, “Unified temporal and spatial calibration for multi-sensor systems,” in 2013 IEEE/RSJ International Conference on Intelligent Robots and Systems, pp. 1280–1286, 2013.
- [16] N. Challa and Y. Ilayda, “ORB-SLAM3 support package,” 8 2022.
- [17] Y. Kuang, E. Ask, S. Burgess, and K. Åström, Understanding TOA and TDOA network calibration using far field approximation as initial estimate. 05 2012.