BASICS: Broad quality Assessment of Static point clouds In Compression Scenarios
Abstract
Point clouds are now commonly used to represent 3D scenes in virtual world, in addition to 3D meshes. Their ease of capture enable various applications on mobile devices, such as smartphones or other microcontrollers. Point cloud compression is now at an advanced level and being standardized. Nevertheless, quality assessment databases, which is needed to develop better objective quality metrics, are still limited. In this work, we create a broad quality assessment database for static point clouds, mainly for telepresence scenario. For the sake of completeness, the created database is analyzed using the mean opinion scores, and it is used to benchmark several state-of-the-art quality estimators. The generated database is named Broad quality Assessment of Static point clouds In Compression Scenario (BASICS). Currently, the BASICS database is used as part of the ICIP 2023 Grand Challenge on Point Cloud Quality Assessment, and therefore only a part of the database has been made publicly available at the challenge website. The rest of the database will be made available once the challenge is over.
Index Terms:
Point cloud quality, 3D models, point cloud compression, subjective quality assessment, database.I Introduction
Digital imaging technologies enable capturing the real world and recreating it in other times or other places. This has been extended to 3D scenes with the help of computer graphics and photogrammetry techniques. We can now capture 3D objects and scenes using purely RGB cameras [2] or RGB cameras with additional sensors [3]. Two representations are commonly used representation for 3D models: coloured point clouds and textured 3D meshes [4]. In this paper, we focus on point clouds which are crucial for many applications such as augmented and virtual reality.
Point clouds are typically captured via camera arrays, LiDAR sensors, and cameras. The resulting volume of data is extremely large and compression becomes essential for transmission and storage. However, evaluating compression algorithms requires assessing the quality of point clouds distorted by compression relative to the original point clouds. While research into this area has been recently expanding [5], there are still many open questions and problems. Specifically, we address the issues of enabling evaluation of learning-based compression methods and creation of learning-based quality metrics by providing a subjective dataset of sufficient scale, consistency and diversity. Existing datasets until now have been either too small, inconsistent (with respect to content normalization, rendering conditions, etc.) or too lacking in diversity (in terms of semantics or the number of source contents) for research into learning-based approaches.
The contributions of this work are threefold and can be listed as follows:
-
•
We present, and make publicly available (partly, during the ICIP 2023 Point Cloud Visual Quality Assessment Grand Challenge), a broad point cloud quality assessment database comprising 75 unique contents that are semantically meaningful for a telepresence scenario, described in Section III,
-
•
We compare the performances of various state-of-the-art methods for point cloud compression (Section V), and
-
•
We provide a complete benchmark of the state-of-the-art point cloud quality metrics, including both point-based and rendering-based assessment (Section VI).
The created BASICS database is made publicly available under Creative Commons Attribution (CC BY-NC-SA 4.0) license to support further research in the field. During the ICIP 2023 Grand Challenge, part of the dataset will be accessible to the grand challenge participants via CodaLab registration (Please see the grand challenge website [1]).
II Why is There a Need for Another Database?
In this section, we delve deeper into the following question ”Why is there a need for another point cloud quality dataset?”. First, it is important to note that learning-based point cloud compressionhas been a strong focus of recent research among researchers in the last few years. It it thus important to accurately assess the quality of point clouds distorted by such learning-based compression methods. In addition, learning-based point cloud quality assessment have also been explored recently. However, existing datasets lack several qualities in order to enable evaluation of learning-based methods and research into learning-based quality assessment approaches.
The existing datasets lack diversity, specifically they present one or more of the following issues:
-
•
Use of the same point clouds across datasets.
-
•
Lacking variety in terms of geometric complexity and semantic categories.
-
•
Use of the same compression algorithms and consequently metrics over perform on these distortions while failing on novel distortions (e.g. learning based coding distortions).
This lack of diversity combined with the small scale of the existing datasets make them unsuitable for learning-based quality assessment. In addition, the lack of learning-based compression approaches in these datasets leads to novel metrics failing for these methods.
The existing datasets also exhibit critical issues relating to data availability:
-
•
Source point clouds unavailable due to copyright issues (Table II).
-
•
Unavailable raw scores, standard deviation and/or confidence intervals (Table II).
The missing data impedes research into more sophisticated metric development methods.
In addition, the existing datasets lack strongly in consistency. Specifically:
-
•
Point clouds are not normalized which impedes analysis and rendering. In this dataset, all point clouds are voxelized with 10 bit quantization. As a result, all coordinates are integers ranging between 0 and 1023.
-
•
Point cloud rendering is inconsistent which distorts results depending on the compression method. In this dataset, all points are rendered using cubes spanning the volume of their associated voxel. This has an especially noticeable effect for octree compression (GPCC) as the resulting rendering is watertight at all compression levels.
-
•
Rendering is stable which is not the case with most other datasets. Rendering voxelized point clouds with cubes guarantees rendering without flickers as the volumes are non overlapping.
The lack of consistency in existing datasets make them unpractical for analysis and research.
| Dataset | nb SRC | nb PPC |
|
|
Display | Visualization |
|
|
Distortions | ||||||||
|---|---|---|---|---|---|---|---|---|---|---|---|---|---|---|---|---|---|
| BASICS (proposed) | 75 | 1494 | 60 | 3600 | 2D | Passive | DSIS (side-by-side) | Static | Compression: GPCC, VPCC, GeoCNN | ||||||||
| vsenseVVDB2[4] | 8 | 136 | 23 | 23 | 2D | Passive | ACR | Dynamic | Compression: GPCC, VPCC | ||||||||
| Perry et al. [6] | 6 | 90 | - | 73 | 2D | Passive | DSIS (side-by-side) | Static | Compression: GPCC, VPCC | ||||||||
| da Silva Cruz et al. [7] | 8 | 48 | - | 50 | 2D | Passive | DSIS | Static |
|
||||||||
| Yang et al. [8] | 10 | 420 | 16 | 64 | 2D | Passive | ACR | Static |
|
||||||||
| Su et al. [9] | 20 | 740 | - | 60 | 2D | Passive | DSIS (side-by-side) | Static |
|
||||||||
| NBU-PCD1.0 [10] | 10 | 160 | - | - | 2D | - | - | Static | Octree pruning | ||||||||
| SIAT-PCQD [11] | 20 | 340 | 38 | 76 | HMD | Interactive | DSIS | Static | Compression: VPCC | ||||||||
| Subramanyam et al. [12] | 8 | 64 | - | 52 | HMD | Interactive | ACR-HR | Dynamic | Compression: VPCC | ||||||||
| PointXR [13] | 5 | 40 | 20 | 40 | HMD | Interactive | DSIS | Static | Compression: GPCC |
| Dataset | Point Clouds | Subjective Annotations |
|---|---|---|
| BASICS (proposed) | ✓ | Individual Scores |
| vsenseVVDB2 [4] | ✓ | Individual Scores |
| Perry et al. [6] | Broken URL | ✗ |
| Su et al. [9] | ✓ | (D)MOS only |
| da Silva Cruz et al. [7] | ✗ | ✗ |
| Yang et al. [8] | ✓ | (D)MOS only |
| NBU-PCD1.0 [10] | ✗ | ✗ |
| SIAT-PCQD [11] | Broken URL | ✗ |
| Subramanyam et al. [12] | ✗ | Individual Scores |
| PointXR [13] | ✓ | Individual Scores |
In summary, a new dataset is required as existing datasets are lacking in one or more aspects. Namely, in terms of diversity, scale and consistency. We propose a new dataset that fulfills all of these characteristics which are essential for learning-based use cases. Specifically, this dataset enables better research into learning-based quality assessment. In addition, it also provides crucial insight on the behavior of point cloud quality metrics when applied to learning-based compression algorithms.
In particular, the proposed BASICS database is aimed to provide a foundation for research that supports the telepresence applications, in terms of compression and quality assessment.
III The BASICS Database
Imagine that you are a researcher or a developer who wishes to develop a quality metric using learning-based approaches. Or, you might be seeking to validate your quality metric. In order to provide means for both of these scenarios, and to remedy the limitations discussed in the previous section, we generate the BASICS database. In the following, we describe various stages of the database generation procedure.
III-A Material selection
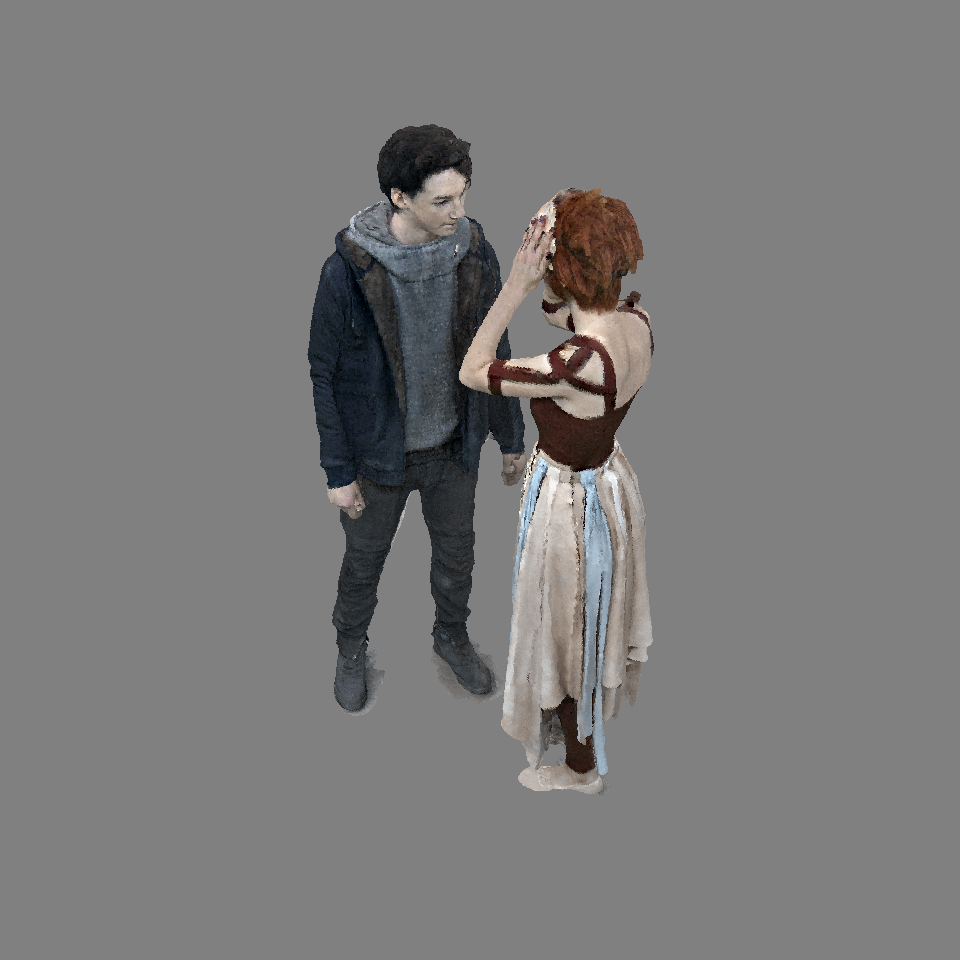
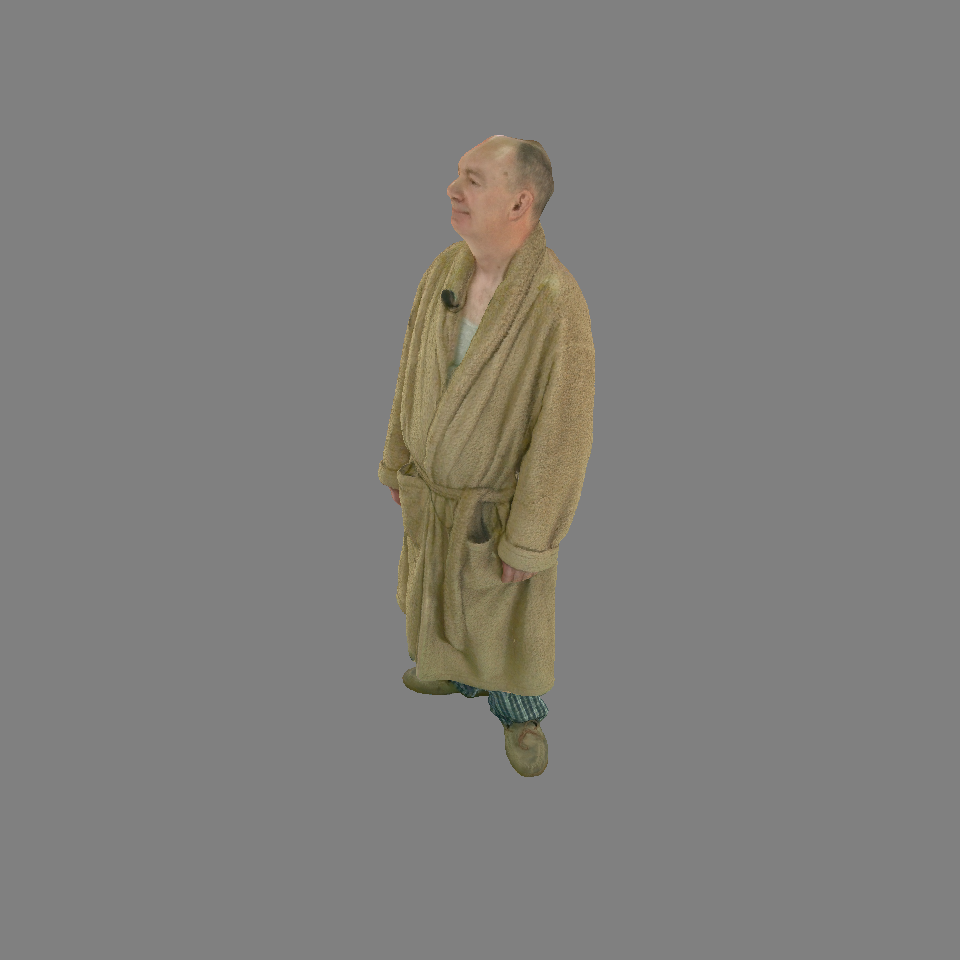
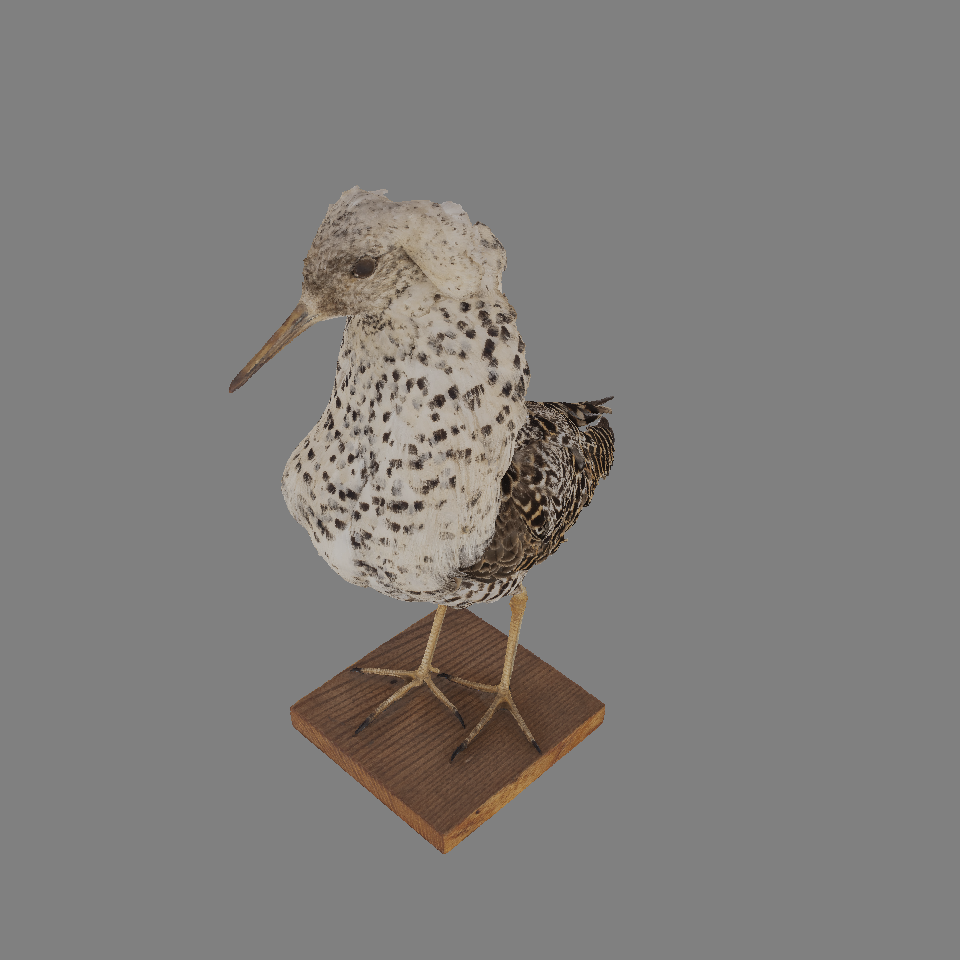
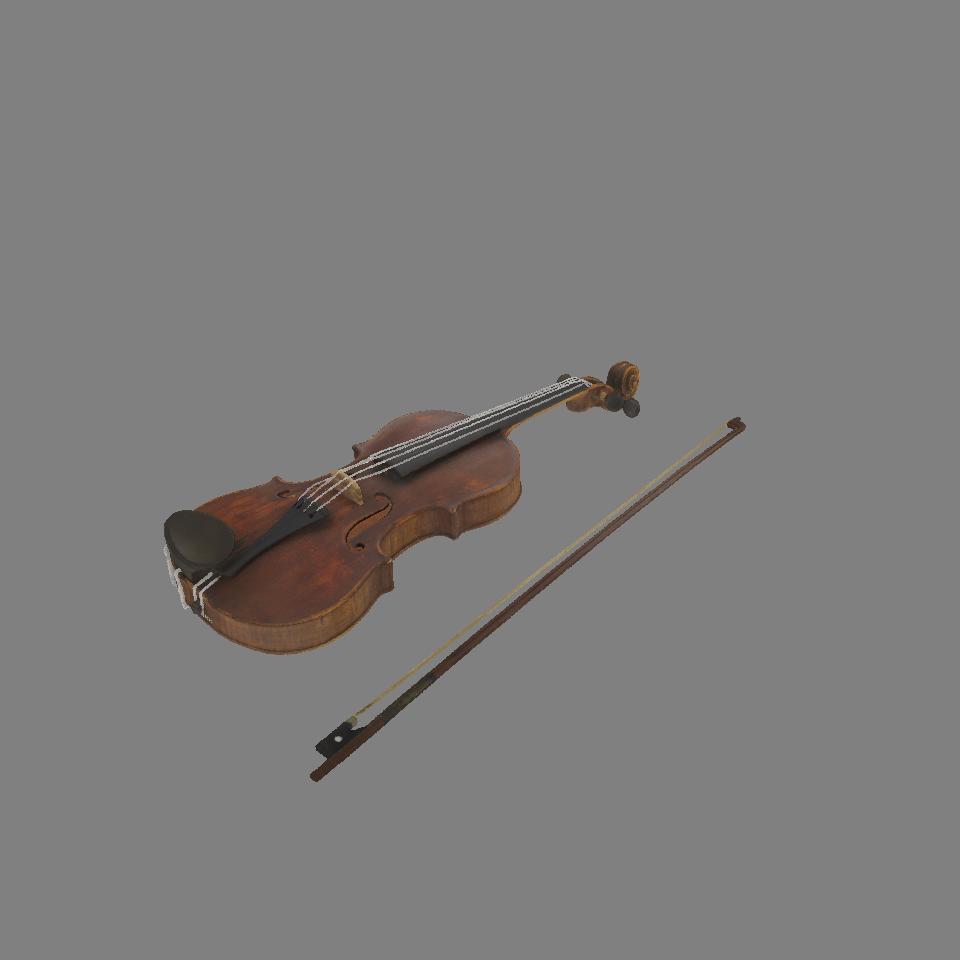
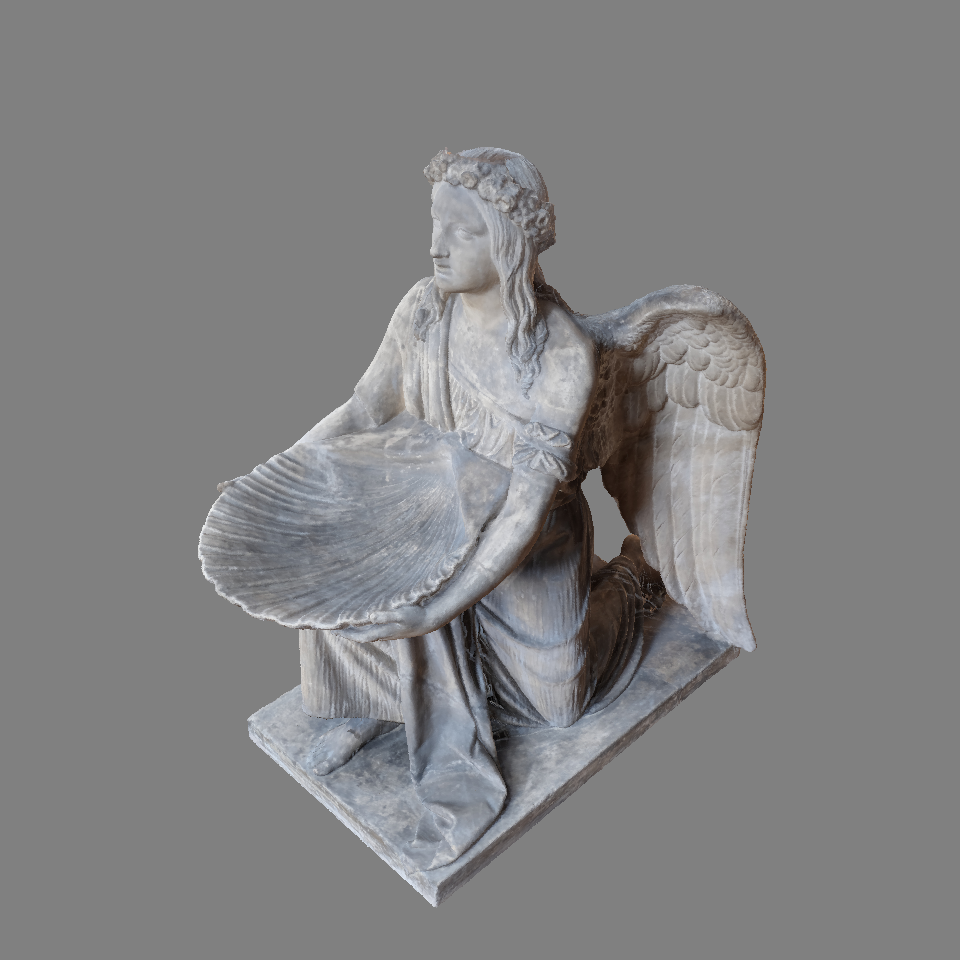
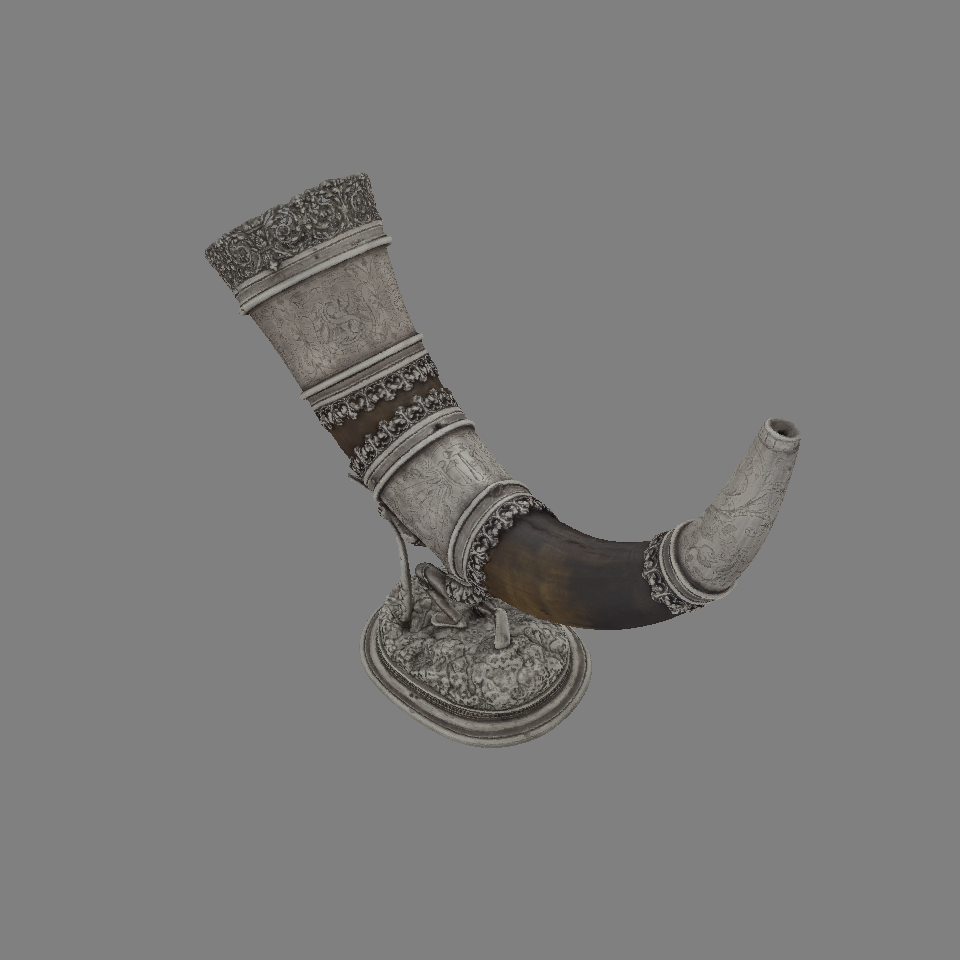
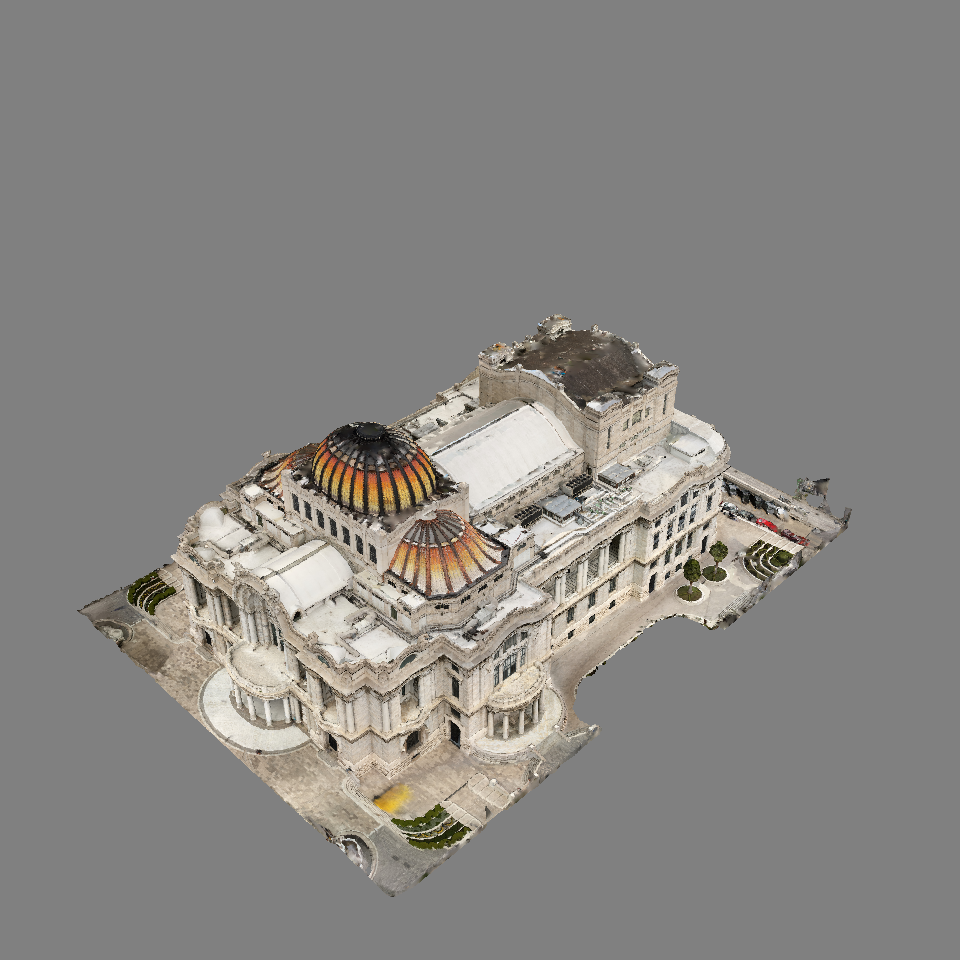
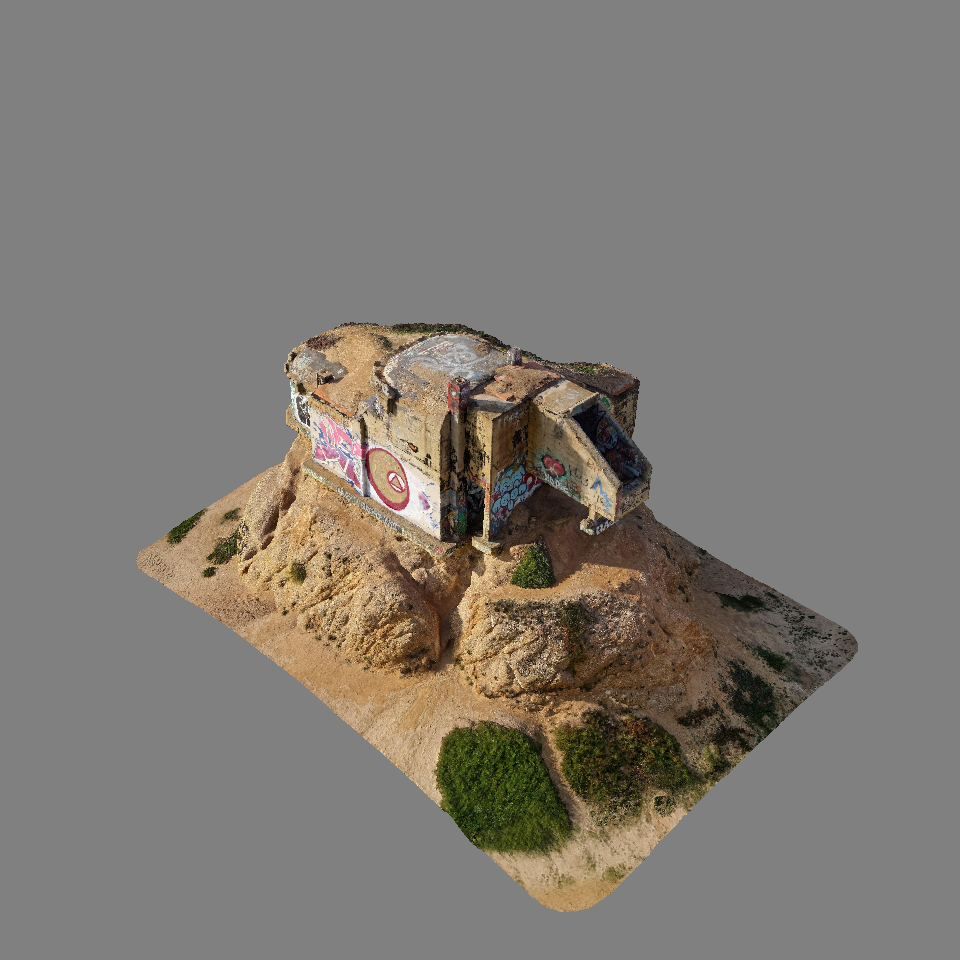
Our motivation in this work, as previously mentioned, is to develop a semantically diverse point cloud quality assessment database for a telepresence application in which a real scene is captured, compressed, transmitted, and displayed using point clouds. In almost all applications of telepresence, humans are the main subject of the communication. Therefore, it is important to capture the point clouds that represent humans. Additionally, pets or other animals can be part of the scene in some applications. Inanimate objects will be in the scene, and they can also be a topic of work meetings (e.g., designing objects) or education applications (e.g., museum artifacts). Lastly, buildings or background landscape can also be part of the contents in telepresence applications.
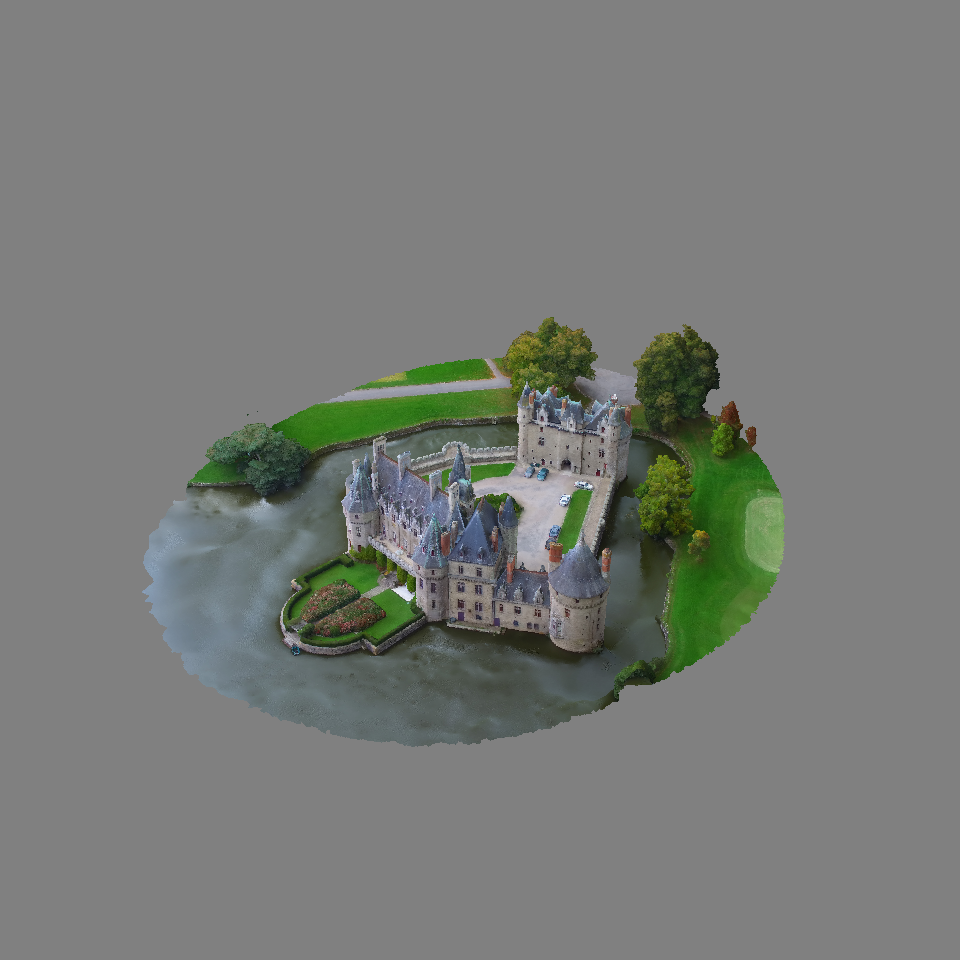
Considering the above discussion, we identify fundamental building blocks and corresponding semantic categories for point cloud contents to include in the database. Three main categories are selected for prospective 3D models for the reference content: (i) humans & animals, (ii) inanimate objects, and (iii) buildings & landscapes. Screenshots of sample figures from each category are shown in Fig. 1.
For the data collection and material selection part, we aimed to collect as many publicly available point clouds as possible, which could be redistributable. However, many data sources restrict redistribution. Therefore, we acquired the 3D models from two sources: collaborator studios (i.e., V-SENSE studio and XD Productions) and an online repository for 3D model sharing called SketchFab111https://www.sketchfab.com/. Even in this case, there were not many point cloud sources. Therefore, we gathered 3D meshes and generated point clouds via sampling the mesh surface (cf. Section III-B).
In total, 104 models were handpicked by three authors of this paper considering the semantic categories described above. After eliminating very similar materials, the models with non-ideal characteristics (e.g., highly reflective material, imperfect texturing etc.), and the least relevant semantic categories, the total number of models were dropped to 75.
III-B Pre-processing
To discount for all other possible aspects that can introduce distortions, the collected 3D models needed a pre-processing and a conversion into point clouds before any further processing, as these models were in different formats.
Models that were already in point cloud PLY format did not need too much attention, except for voxelization. 3D meshes, on the other hand, needed to go through several steps. These steps are further discussed below.
III-B1 Making 3D meshes uniform
Among collected 3D mesh models, some of them were in OBJ format and some others were in FBX format. Using Blender222https://www.blender.org/ and Meshlab333https://www.meshlab.net/, all 3D meshes were converted into OBJ format.
III-B2 Cleaning 3D meshes
Some of the 3D meshes had either parts that had transparent or reflective properties (e.g., glasses in some models). Some other meshes had parts the reconstruction of which were incomplete (e.g., trees, some of the building façades) which would decrease the users’ quality of experience and introduce other sources of distraction and distortion. To avoid such effects, these parts were removed or cleaned in Blender.
Following this, the mesh files were unified into a single OBJ file, so that the sampling process in the pipeline could be done with ease. Next, the material properties (which are described in the .mtl files) are checked to eliminate the any other reflective properties of the materials, which could not be reproduced correctly in the point cloud format. After all these operations, the 3D meshes were ready for the point cloud sampling step.
III-B3 Sampling point clouds
Using CloudCompare444https://www.cloudcompare.org/main.html, point clouds were sampled from the 3D meshes’ surfaces using … command. During this operation more than 5 million points were sampled on the surfaces of the said meshes. The sampling operation extracted the location, color, and normal attributes for each point in the PCs. At the end of this stage, all 3D models were in or converted to point cloud format.
III-B4 Point cloud voxelization
We perform point cloud voxelization using 10 bit quantization. That is, the spatial coordinates are normalized such that they are integers between 0 and 1023. This has two main advantages: first, the coordinates are in a range that is predictable for point cloud processing but also with respect to rendering and second, we use voxelized coordinates in combination with cube based rendering to improve stability, predictability and quality of renderings.
III-C Compression
As mentioned above, the main goal for the BASICS database is to provide a foundation for further point cloud compression and point cloud quality assessment research, especially for the telepresence use case. In this use case, capturing and display needs to be real-time. Therefore, compression carries a huge importance.
For preparing the processed point clouds (PPC), the following compression methods are selected: the octree-based compression method MPEG GPCC [14]555github.com/MPEGGroup/mpeg-pcc-tmc13/releases/tag/release-v14.0, the video-based compression method MPEG VPCC [14]666github.com/MPEGGroup/mpeg-pcc-tmc2/releases/tag/release-v15.0, and a learning-based compression method GeoCNN [15]777github.com/mauriceqch/pcc_geo_cnn_v2. GPCC and VPCC are selected as they are the MPEG standardization efforts which focus the main expert knowledge in the standardization field. GeoCNN was selected to include more recent learning-based algorithms, which was one of the best performing learning-based compression method at the time of dataset preparation.
Geometry-based point cloud compresison (GPCC) focuses on encoding the point cloud directly in the 3D space [14] using octree or trisoup (triangle soup) methods. The attributes (such as color) can also be coded using either Region Adaptive Hierarchical Transform (RAHT) or Predicting/Lifting (PredLift) transform. Video-based point cloud compression (VPCC) instead uses a different approach and is focused on compression of dynamic point clouds (i.e., point clouds changing in time). VPCC projects the point cloud content onto a depth map and a texture map and uses a state-of-the-art video encoder (e.g., HEVC) to compress the PCs. GeoCNN [15] compresses voxelized point clouds by first performing block partitioning. Then, each block is passed to a variational autoencoder [16] where the encoder transforms the input binary occupancy voxel grid to a latent space. The latent space is then quantized and entropy coded using a learned entropy model. After entropy decoding the bitstream, the latent space is transformed back to a voxel grid containing predicted occupancy probabilities. The probabilities are then thresholded to binary values which yields the decoded block. With the result of each block, the entire decompressed point cloud is obtained.
In this work, we used GPCC-Octree-RAHT, GPCC-Octree-Predlift, VPCC, and GeoCNN for compression of the PCs. The details regarding the compression parameters will be provided after the ICIP 2023 Grand Challenge is completed.
IV Subjective quality assessment
We conducted a large-scale subjective experiment in Prolific [17] crowdsourcing platform with more than 3000 participants. More than 1200 stimuli from 75 original point clouds were generated for the experiment wherein each processed point cloud (PPC) were evaluated by around 60 unique participants on average. This section describes the detail regarding the crowdsourcing study.
Subjective quality assessment of point cloud content can be categorized into two as interactive and passive [5]. In the interactive paradigm, observers have the freedom to inspect the point cloud from any point of view without any restriction often with an augmented reality or virtual reality application. In the passive approach, point clouds are rendered with a predefined camera trajectory as a traditional video. Although both paradigm has their own advantages and disadvantages, there is no statistically significant difference between the subjective opinions collected with each [18]. In order to minimize the variance between observer opinions and allow ourselves a more practical data collection through crowdsourcing, we adopted the passive approach [19].
IV-A Methodology
Several methodologies can be found in the literature and recommendations for subjective quality assessment of traditional image and video sequences [20]. Commonly used methodologies include, but not limited to: Absolute Category Rating (ACR), Double Stimulus Impairment Scale (DSIS) and Two-Alternative Forced Choice (2AFC) or Pairwise Comparison (PC). Several studies compared the accuracy and reliability of each methodologies for varying multimedia content. For traditional image and videos, Mantiuk et al. denote that the PC methodology tends to be more accurate due to straightforward experiment procedure and there is no statistically significant difference between ACR and DSIS methodology [21]. However, despite the simplicity of the task, PC methodology may require exponentially more comparisons and may become impractical with high number of test conditions [22]. On the other hand, the recent study by Nehme et al. [23] suggests that the DSIS method is more accurate than ACR for 3D graphical content. It is suggested that, in ACR experiments, participants who are unfamiliar with the pristine models are not able to discriminate all type of distortions. DSIS methodology leads to a more accurate evaluation by presenting the reference and the distorted model prior to rating. Therefore, we utilized DSIS methodology with a side-by-side presentation as suggested by Nehme et al. [23].
IV-B Generating Visual Stimuli
In a voxelized point cloud, points have a one-to-one mapping to a voxel as part of a voxel grid. Building on this property, each point is rendered as a cube spanning the volume of its voxel. This is different from common ”point” (OpenGL point primitive) based rendering which renders points as screen-aligned squares of a given window space size. The main issue is that the size is given in window space, thus when a zoom is performed the points become smaller and the point cloud appears sparser. In addition, point based rendering causes flicker artifacts due to spatial overlaps especially during perspective changes. Cube based rendering corrects this issue and enables watertight rendering from all perspectives.
Moreover, cube based rendering has a particular relationship with octree based compression. A typical octree compression algorithm represents the point cloud using an octree, providing a natural decomposition in level of details. Specifically, at each octree subdivision, each occupied voxel is subdivided into eight equal voxels and their occupancies are then encoded. Typically, a desired level of detail is selected and each occupied voxel at this level of detail is transformed into a point. However, this neglects that each point actually corresponds to a volume. Using this property, rendering each point as a cube spanning this volume greatly improves rendering results for octree methods. In particular, a watertight voxel point cloud remains watertight regardless of the level of detail. Compared to the previous approach, point clouds look visually ”blockier” rather than sparser which preserves visual continuity of the rendered objects.
In practice, we specify cube sizes. For octree based methods, the size of the cube is defined based on the number of removed octree levels . With bit quantization, the maximum is levels. Thus, we specify the size of the cube as : that is, a size of 1 when lossless, a size of 2 when removing one octree level, a size of 4 when removing two octree levels, etc. For other methods, the cube size is determined empirically in a pilot test by a subset of the authors manually to ensure that the output looks watertight.
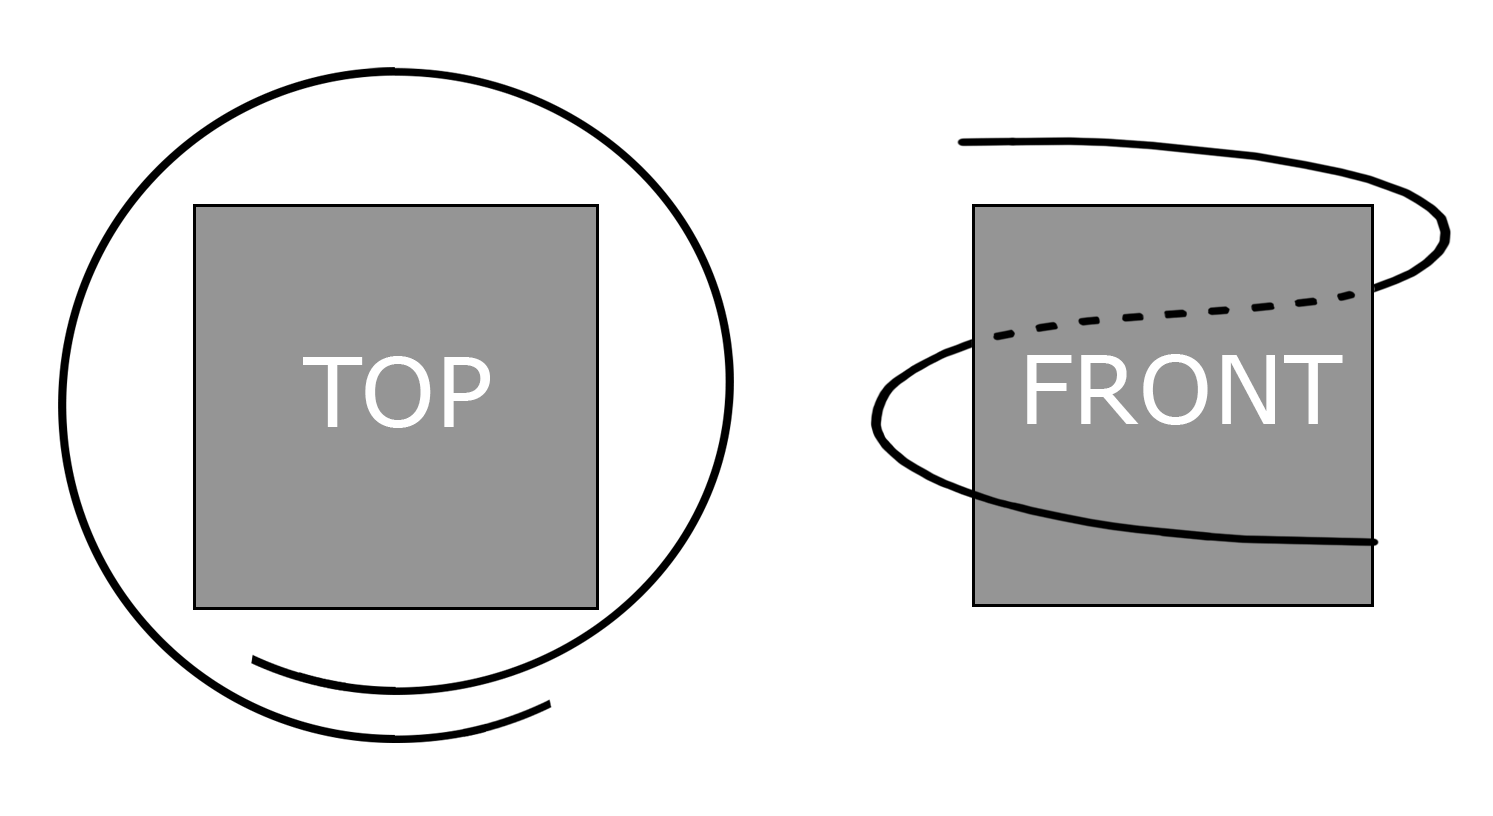
Helix-like rendering trajectory is utilized as visualized in Figure 2. Front direction of each point cloud were assigned manually and rendering trajectory is always initiated from the assigned front side. A small overlap is adopted between the start and end point of the trajectory to ensure that the front side of the point cloud is seen either at the end or at the beginning of the rendered video. Certain point clouds are unnatural to observe from lower angles(e.g., landscape, buildings). Therefore, after a pilot test, each point cloud manually assigned to one of the following categories: low, mid, high. It is used to determine the starting elevation of the rendering trajectory. While moving on the rendering trajectory, the camera is always directed towards the point cloud center.
IV-C Test Procedure
Earlier studies suggests that the crowdsourcing experiments can be as accurate as laboratory experiments for various QoE tasks and with different experiment designs [24, 19]. To benefit from the wide participant pool and faster data collection, we utilized the Prolific [17] crowdsourcing platform to recruit participants and to conduct the subjective experiment. On Prolific, the participants are clearly informed that they are being recruited as part of a research study and the requirements for the experiments are well balanced to benefit both sides; researchers and participants [25].
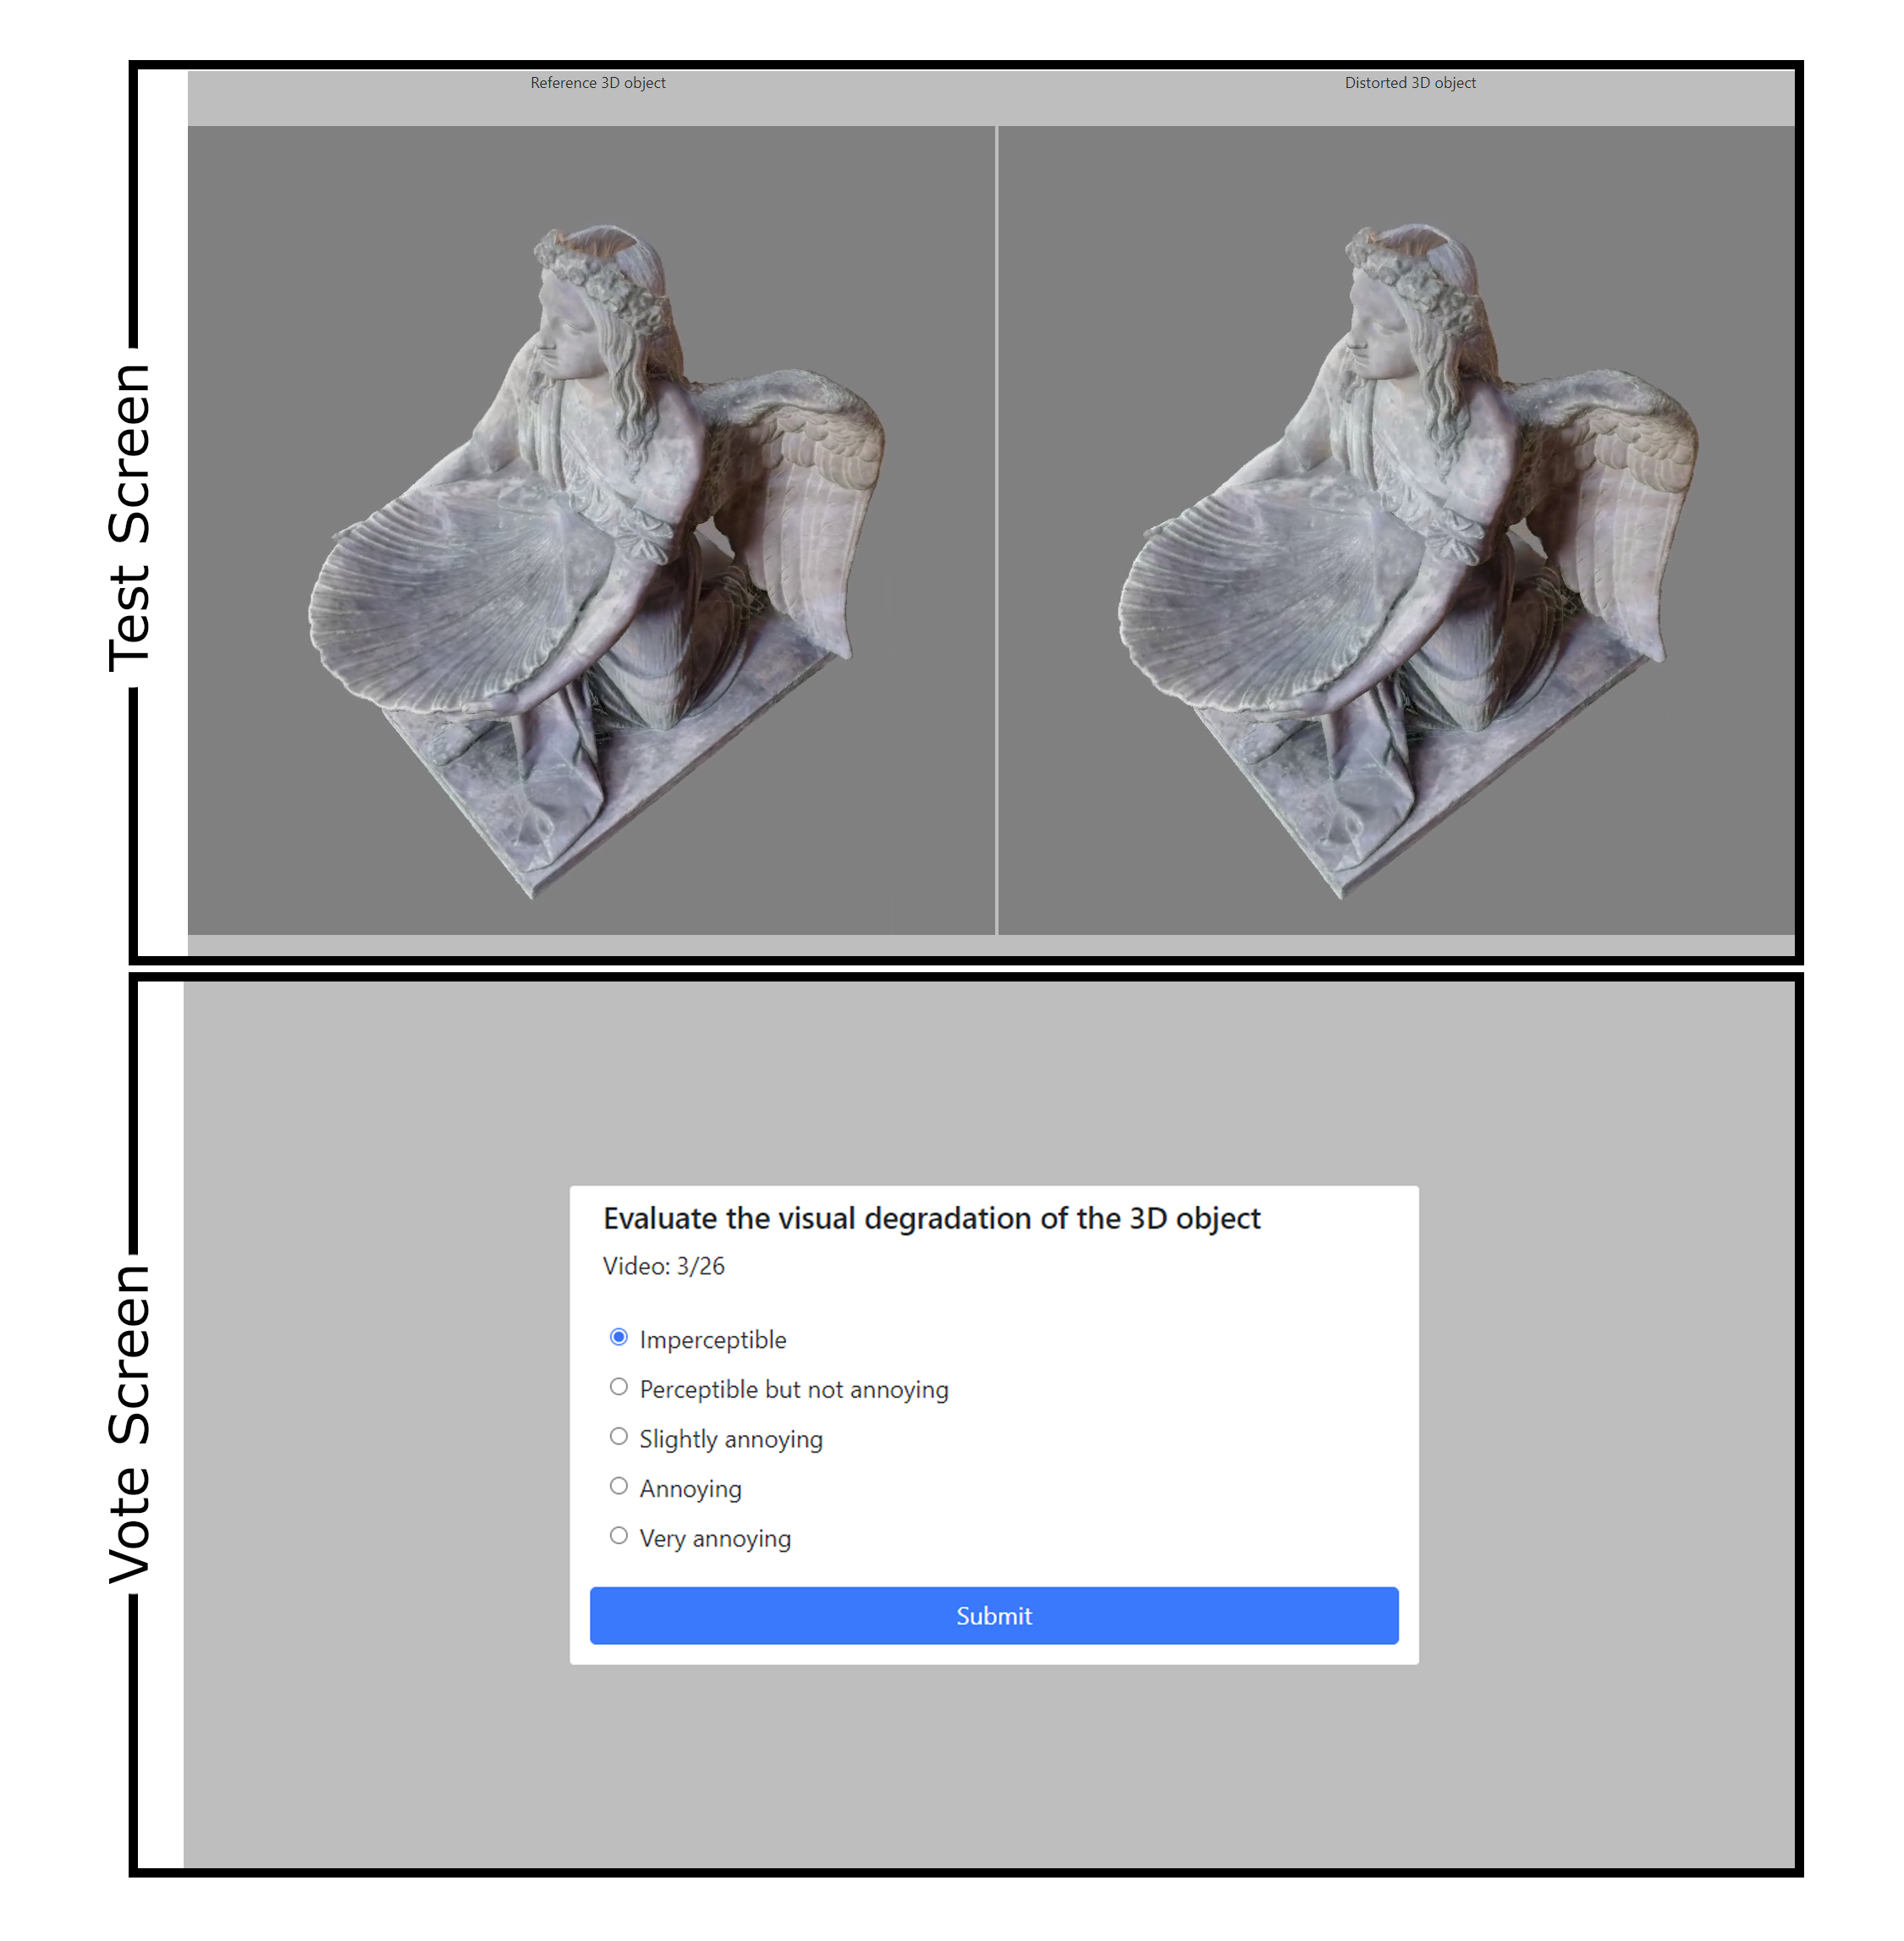
Test sessions & Duration: Due to lack of supervision on participants during the experiment, the number of stimuli and the duration of the test in crowdsourcing settings should be kept much lower than the laboratory experiments. To this end, we split the experiment into 60 sessions each containing 25 stimuli and 2 dummies. One dummy from the highly compressed stimuli and one dummy from the lowest compressed stimuli were selected to be shown to every participant to create expectations about the range of distortions. Dummy stimuli were the same for every participant and participants were not informed that these stimuli were shown for training purposes. In total, every participant rated 27 stimuli of 10 seconds video renderings. With unlimited voting time after each stimuli, test sessions lasted around 5 minutes 30 seconds on average. See a sample screenshot from the experiment in Figure 3.
Participants & Requirements: We recruited 60 participants (50% female - 50% male) on average per session, more than 3000 participants in total. Every participant was compensated for their time and the age of the participants range from 18 to 70. Moreover, to ensure all stimuli were shown as intended, participants were limited to use selected browsers on full screen with 1080p resolution. In addition, participants were required to complete at least 200 submissions with 100% approval rate on Prolific.
V Subjective Experiment Results
This section presents the result of subjective quality scores analyses. Section V-A investigates the content ambiguity for each source point cloud. Comparison of different methods to acquire MOS from individual observer opinions presented in Section V-B. Finally, performance of the compression algorithms are analyzed in Section V-C
V-A Content Ambiguity
Some contents can be more difficult to evaluate than the others. Depending on the QoE scenario, various factors can lead to more/less ambiguous contents. In order to estimate the content ambiguity of source point clouds in the dataset, we used Netflix-Sureal package[26]. We observe that the ambiguity of the point clouds are correlated with the visual quality of the source point cloud. In other words, less artefacts (due to acquisition, processing, etc.) on the source content, leads to easier evaluation of the compression distortions. This phenomenon is in fact well known in image and video quality domain.
To further explore the content ambiguity, we analyzed the correlation between number of points and content ambiguity for each semantic category in the dataset. We observe a linear correlation between number of points and content ambiguity for the point clouds in humans & animals category. However, the same conclusion cannot be drawn for the buildings & landscapes and inanimate objects categories. This can be explained by the similar geometric complexity and physical size of the source point clouds in humans & animals category. Due to low variance in geometric complexity and physical size, number of points often dictates the visual quality of the source point clouds. Therefore, we observe a greater correlation between content ambiguity and number of points in this category. In contrast, variance of geometric complexity and physical size is much higher in buildings & landscapes and inanimate objects categories. Therefore, number of points alone cannot dictate the visual quality. More details will be provided for content ambiguity after ICIP 2023 Grand Challenge is concluded.
V-B Mean Opinion Scores
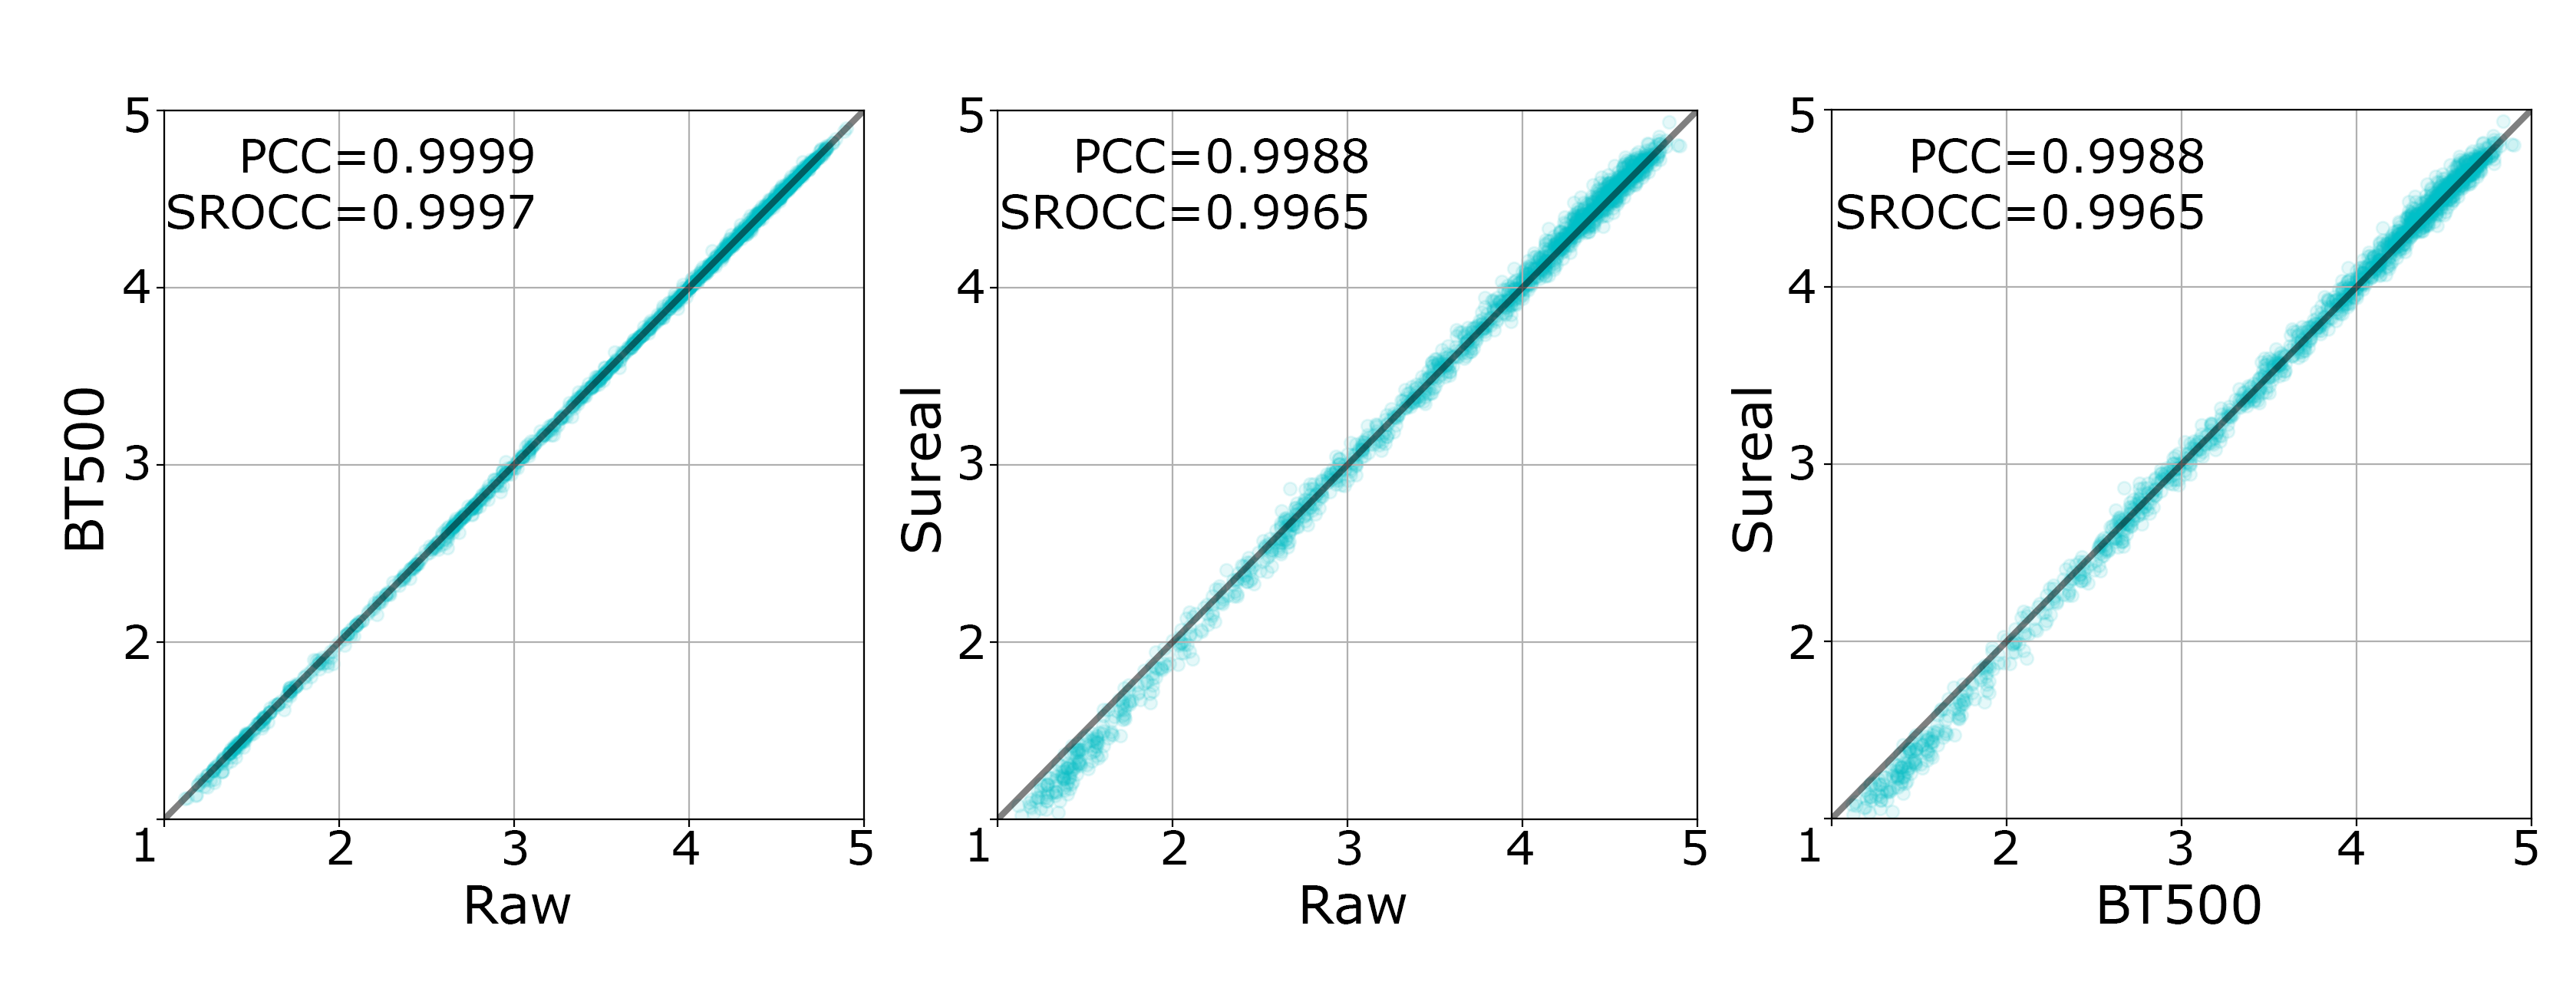
In order to analyze the validity of the collected subjective opinion scores and provide reliable MOS, we compared three methodologies to estimate MOS. First, no observer screening was applied to the collected opinion scores. Raw MOS is calculated simply averaging all opinions for each PPC. Secondly, BT500 MOS is calculated by following the recommendations in ITU-R BT.500-14 A1-2.3.1 [20]. Observer screening is applied once before calculating the MOS. Among more than 3000 total observers participated to the subjective experiment, 47 of them found as outliers and omitted from the BT500 MOS calculation. As the last method, Netflix Sureal [26] was used to estimate the MOS by taking subject inconsistency and biases into account. All participants’ opinions were included in the Sureal MOS estimation. Figure 5 presents the results as scatter plots between each pair of methodologies as well as pearson and spearman rank order correlation coefficients. Results clearly indicate that there is no significant difference between the three methodologies. This further confirms the validity of Prolific participant pool and the experiment design. In the dataset public repository, we provide the raw opinion scores and MOS acquired by following the ITU-R BT.500-14 recommendations.
Based on the MOS acquired by ITU-R BT.500-14 recommendations, the distribution of MOS for each SRC was checked, and it was observed that, for a given SRC, MOS distributions cover the whole quality range with few exceptions. Note that the experiment is conducted with DSIS methodology. Consequently, acquired MOS are content aware and equivalent to DMOS in an ACR-HR experiment methodology.
V-C Performance of compression algorithms
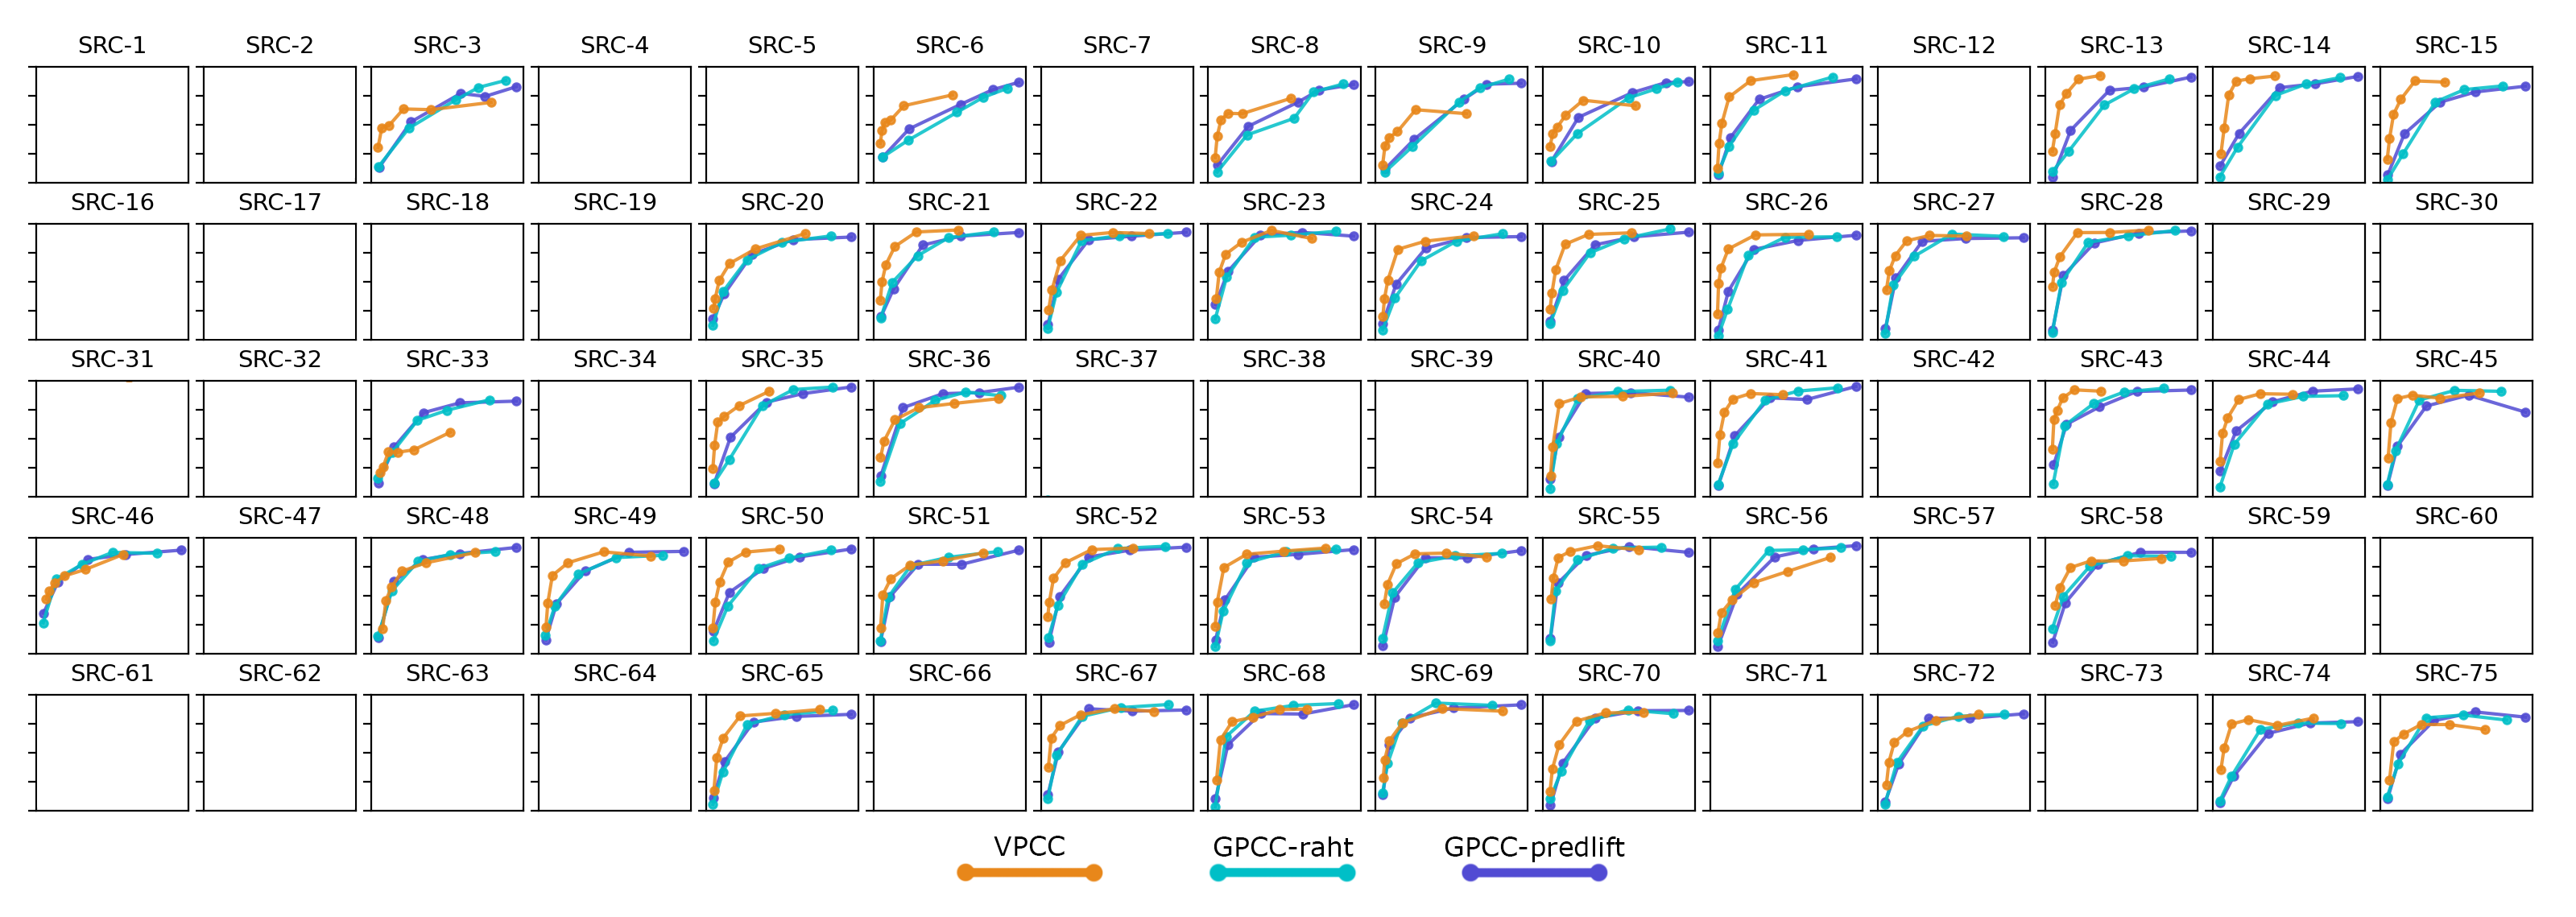
For completeness, the performance of compression algorithms were also analyzed. For this analysis, the rate-distortion curves have been plotted as shown in Figure 4. Bit-per-point is used for the rate, which is shown on the x-axes of the plots, and mean opinion scores are shown on the y-axes of the plots. For the sake of comparisons, the bitrate values were stretched to show the full extent of the bitrate range. This means that the plots are only meaningful within themselves and should not be compared to other plots.
The results show that, in general, VPCC is performing better than GPCC, which supports the findings of earlier studies [27]. Among GPCC-RAHT and GPCC-Predlift there seems to be no significant difference, considering all the different SRC contents, even though GPCC-RAHT seems to yield slightly lower bitrate for higher bitrates. As the cautious readers can identify, there is a slight decrease in the subjective quality for the highest bitrate of p45, which is caused by a hole in the final rendering, the cause of which is unknown.
VI Objective Quality Assessment
Point cloud objective quality metrics can be categorized into three, considering the type of input to the quality metrics: (i) image-based, (ii) color-based, and (iii) geometry-based. Image-based metrics take the rendered point cloud image or image sequences as input and assess the quality of the point clouds. Geometry-based metrics rely only on the geometry information (e.g., the location in 3D space) stored at each point in the point cloud, ignoring the color attribute. Color-based metrics utilizes the both geometry and color information of each point to assess the point cloud quality. Moreover, each metric can be categorized into three based on the presence of reference point cloud information as full-reference (FR), reduced-reference (RR) and no-reference (NR). FR metrics access all information from the reference point cloud in addition to the distorted point cloud. NR metrics can access only partial information (features) from the reference point clouds. NR metrics assess the quality of the point cloud without any access to the reference point cloud.
In this section, we benchmark 14 image-based, 9 color-based and 17 geometry-based metrics from the literature. Selected metrics are introduced in Section VI-A. Various methodologies were adopted to evaluate metric performances and introduced in Section VI-B. Results of these analyses are presented in Section VI-C and Section VI-D
VI-A Selected Metrics
For all image-based metrics, average pooling over 30 fps video renderings has been used to predict the final quality as recommended in [28]. Image-based metrics include simple measures such as MSE, PSNR and SSIM [29] and 11 other more sophisticated metrics. Feature similarity index (FSIM [30]) and its color-dependent variant FSIMc [30] are full reference metrics that rely on phase congruency and gradient magnitude to quantify image quality locally and uses phase congruency as a weighting function to obtain a single quality score. Gradient magnitude similarity deviation (GMSD[31]) is another full reference metric utilizing the pixel-wise gradient magnitude similarity to predict the image quality. D-JNDQ [32] is a learning-based full reference metric that is trained on first just noticeable difference (JND) points of JPEG compression artefacts. It combines a white-box optical and retinal pathway model with a Siamese neural network to predict image quality. MW-PSNR [33, 34] is based on morphological wavelet decomposition and MSE of the wavelet sub-bands. Both full reference (MW-PSNR-FR) and reduced reference (MW-PSNR-RR) versions are included in the evaluation.
The geometry-based metrics disregard the color information. The point-to-point [35] and point-to-plane [36] metrics are most commonly used in MPEG standardization activities, and they focus on distance among the nearest points or distance between the point and the projected point on the second set considering the normal, respectively. Plane-to-plane [37] measures the angular difference between the normals of the closest points. PCQM [38] focuses on finding the curvature of a predicted surface from a set of closest points with normals and estimates quality based on this curvature estimate. PointSSIM [39] calculates attributes such as geometry, normals, curvature, and colors. Once the features are calculated, they are fed into a similarity function and pooled all together. As geometry-based attributes were found second best (to the color-based attributes), PointSSIM Geom- metrics were included in this analysis.
The color-based metrics differ in nature. So far, two color-based metrics were considered. The metrics named as “Color channel name pooling” do measure the color difference between the closest points and disregard any geometrical information. The PointSSIM [39], on the other hand, have two different modes and can take either a set distance or k-nearest neighbors. As color-based attributes were found to be the highest performing among other types of attributes, PointSSIM Color- metrics were included in this analysis.
VI-B Evaluation Criteria
The whole dataset was used for the evaluation. For learning-based objective quality metrics, no training or fine-tuning is applied prior to evaluation. Evaluation of the objective quality performances were made with 2 main methods. First analysis relies on traditional measures to analyze the correlation between metric predictions and MOS. Second analysis relies on statistical significance of the differences between pairs of stimuli. It measures the metric performance based on the capability of identifying significantly different pairs.
| All | GeoCNN |
|
|
VPCC | |||||||||||
|---|---|---|---|---|---|---|---|---|---|---|---|---|---|---|---|
| Category | Metric | CC | SROCC | CC | SROCC | CC | SROCC | CC | SROCC | CC | SROCC | ||||
| Image Based | MSE | 0.2419 | 0.2274 | 0.4140 | 0.4197 | 0.3362 | 0.2614 | 0.3215 | 0.2443 | 0.0930 | 0.0731 | ||||
| PSNR | 0.2520 | 0.2318 | 0.4235 | 0.4244 | 0.3447 | 0.2657 | 0.3298 | 0.2483 | 0.1181 | 0.0775 | |||||
| SSIM[29] | 0.6219 | 0.5482 | 0.5505 | 0.5350 | 0.7508 | 0.6172 | 0.7628 | 0.6394 | 0.4115 | 0.3765 | |||||
| MS-SSIM | 0.5536 | 0.4660 | 0.4957 | 0.4797 | 0.6757 | 0.5322 | 0.6844 | 0.5501 | 0.3704 | 0.3043 | |||||
| FSIM[30] | 0.6375 | 0.5656 | 0.5748 | 0.5701 | 0.7621 | 0.6330 | 0.7700 | 0.6534 | 0.4166 | 0.3838 | |||||
| FSIMc[30] | 0.6374 | 0.5651 | 0.5750 | 0.5690 | 0.7618 | 0.6320 | 0.7697 | 0.6528 | 0.4164 | 0.3836 | |||||
| GMSD[31] | 0.6737 | 0.6143 | 0.6372 | 0.6320 | 0.8004 | 0.6730 | 0.7985 | 0.6885 | 0.4635 | 0.4463 | |||||
| D-JNDQ[32] | 0.6782 | 0.6349 | 0.7285 | 0.7204 | 0.7914 | 0.6765 | 0.8043 | 0.7045 | 0.4431 | 0.4469 | |||||
| MW-PSNR-FR[33] | 0.3504 | 0.3344 | 0.4613 | 0.4601 | 0.4509 | 0.3790 | 0.4390 | 0.3730 | 0.2071 | 0.1701 | |||||
| MW-PSNR-RR[34] | 0.5149 | 0.5015 | 0.5724 | 0.5623 | 0.6277 | 0.5611 | 0.6272 | 0.5625 | 0.3067 | 0.3170 | |||||
| ADM2 | 0.7348 | 0.6555 | 0.6457 | 0.6203 | 0.8412 | 0.6896 | 0.8369 | 0.7096 | 0.5588 | 0.5456 | |||||
| VIF-scale3 | 0.6556 | 0.5993 | 0.6000 | 0.6026 | 0.7721 | 0.6542 | 0.7791 | 0.6759 | 0.4386 | 0.4316 | |||||
| VMAF | 0.7429 | 0.6708 | 0.6573 | 0.6366 | 0.8545 | 0.7072 | 0.8537 | 0.7323 | 0.5594 | 0.5473 | |||||
| FVVDP | 0.6973 | 0.6433 | 0.6345 | 0.6427 | 0.8206 | 0.6999 | 0.8365 | 0.7287 | 0.4781 | 0.4712 | |||||
| Color Based | Color-Y-MSE | 0.5322 | 0.5283 | 0.2269 | 0.1340 | 0.7404 | 0.7004 | 0.7573 | 0.7215 | 0.4232 | 0.4371 | ||||
| Color-Y-PSNR | 0.5386 | 0.5283 | 0.1931 | 0.1494 | 0.7415 | 0.6992 | 0.7582 | 0.7213 | 0.4300 | 0.4371 | |||||
| Color-U-MSE | 0.5451 | 0.5096 | 0.2439 | 0.1365 | 0.6828 | 0.6472 | 0.6632 | 0.6303 | 0.3849 | 0.3770 | |||||
| Color-U-PSNR | 0.5430 | 0.5096 | 0.2447 | 0.1724 | 0.6812 | 0.6471 | 0.6629 | 0.6304 | 0.3845 | 0.3781 | |||||
| Color-V-MSE | 0.5731 | 0.5417 | 0.2508 | 0.1922 | 0.7006 | 0.6691 | 0.6917 | 0.6621 | 0.4450 | 0.4319 | |||||
| Color-V-PSNR | 0.5738 | 0.5403 | 0.3077 | 0.2719 | 0.7004 | 0.6721 | 0.6914 | 0.6620 | 0.4480 | 0.4327 | |||||
| PointSSIM-ColorAB[39] | 0.7291 | 0.6872 | 0.5890 | 0.4317 | 0.8019 | 0.7882 | 0.8257 | 0.8235 | 0.7383 | 0.7644 | |||||
| PointSSIM-ColorBA[39] | 0.7241 | 0.6890 | 0.6088 | 0.4564 | 0.8030 | 0.7904 | 0.8263 | 0.8246 | 0.7287 | 0.7580 | |||||
| PointSSIM-ColorSym[39] | 0.7250 | 0.6883 | 0.6059 | 0.4454 | 0.8027 | 0.7895 | 0.8260 | 0.8237 | 0.7320 | 0.7603 | |||||
| Geometry Based | p2point-PSNR[35] | 0.6884 | 0.5393 | 0.2141 | 0.2140 | 0.7756 | 0.6540 | 0.7882 | 0.6800 | 0.5426 | 0.5171 | ||||
| p2point-Haus[35] | 0.0941 | 0.3614 | 0.4861 | 0.6044 | 0.0602 | 0.8818 | 0.9027 | 0.9050 | 0.1467 | 0.4867 | |||||
| p2point-HausPSNR[35] | 0.1978 | 0.2417 | 0.4729 | 0.4343 | 0.7784 | 0.6225 | 0.7848 | 0.6510 | 0.4612 | 0.4301 | |||||
| p2plane-MSE[40] | 0.0748 | 0.8363 | 0.6962 | 0.6357 | 0.3543 | 0.8850 | 0.9584 | 0.9013 | 0.5001 | 0.8204 | |||||
| p2plane-PSNR[40] | 0.7079 | 0.5750 | 0.2535 | 0.2604 | 0.7637 | 0.6428 | 0.7773 | 0.6650 | 0.6133 | 0.5688 | |||||
| p2plane-Haus[40] | 0.1086 | 0.3938 | 0.5001 | 0.6176 | 0.0631 | 0.8844 | 0.4227 | 0.9065 | 0.1701 | 0.5558 | |||||
| p2plane-HausPSNR[40] | 0.2373 | 0.2753 | 0.4552 | 0.4228 | 0.8384 | 0.6705 | 0.8369 | 0.6912 | 0.4769 | 0.4389 | |||||
| pl2plane-Min[41] | 0.0494 | 0.0676 | 0.1009 | 0.1457 | 0.0564 | 0.0971 | 0.0590 | 0.0917 | 0.1122 | 0.0476 | |||||
| pl2plane-Mean[41] | 0.1519 | 0.1281 | 0.3420 | 0.2069 | 0.1853 | 0.1403 | 0.1944 | 0.1747 | 0.1225 | 0.1114 | |||||
| pl2plane-Median[41] | 0.1519 | 0.1281 | 0.3420 | 0.2069 | 0.1853 | 0.1403 | 0.1944 | 0.1747 | 0.1225 | 0.1114 | |||||
| pl2plane-Max[41] | 0.2123 | 0.1453 | 0.1472 | 0.0648 | 0.2907 | 0.2898 | 0.2020 | 0.2563 | 0.0392 | 0.0231 | |||||
| pl2plane-RMS[41] | 0.1341 | 0.1040 | 0.3466 | 0.2159 | 0.1625 | 0.1204 | 0.1788 | 0.1579 | 0.1150 | 0.0924 | |||||
| pl2plane-MSE[41] | 0.1281 | 0.1038 | 0.3428 | 0.2138 | 0.1603 | 0.1241 | 0.1742 | 0.1564 | 0.1025 | 0.0876 | |||||
| PCQM[38] | 0.8855 | 0.8060 | 0.4407 | 0.2923 | 0.9490 | 0.8671 | 0.9570 | 0.8924 | 0.8548 | 0.8371 | |||||
| PointSSIM-GeomAB[39] | 0.7747 | 0.7172 | 0.5494 | 0.5400 | 0.9072 | 0.8465 | 0.9100 | 0.8771 | 0.5787 | 0.5714 | |||||
| PointSSIM-GeomBA[39] | 0.7639 | 0.7118 | 0.5638 | 0.5714 | 0.9080 | 0.8427 | 0.9114 | 0.8741 | 0.5404 | 0.5470 | |||||
| PointSSIM-GeomSym[39] | 0.7720 | 0.7201 | 0.5561 | 0.5697 | 0.9098 | 0.8464 | 0.9124 | 0.8770 | 0.5755 | 0.5685 | |||||
Correlation measures: Pearson’s linear correlation coefficient (PLCC) measures the prediction accuracy of the objective metrics whereas Spearman’s rank-order correlation coefficient (SROCC) measures the strength of prediction monotonicity [42]. Following the recommendations [20, 42], a 4 parameter polynomial function was fitted prior to evaluation. Both PLCC and SROCC, the values are in the range [0, 1] and higher values indicate a better correlation.
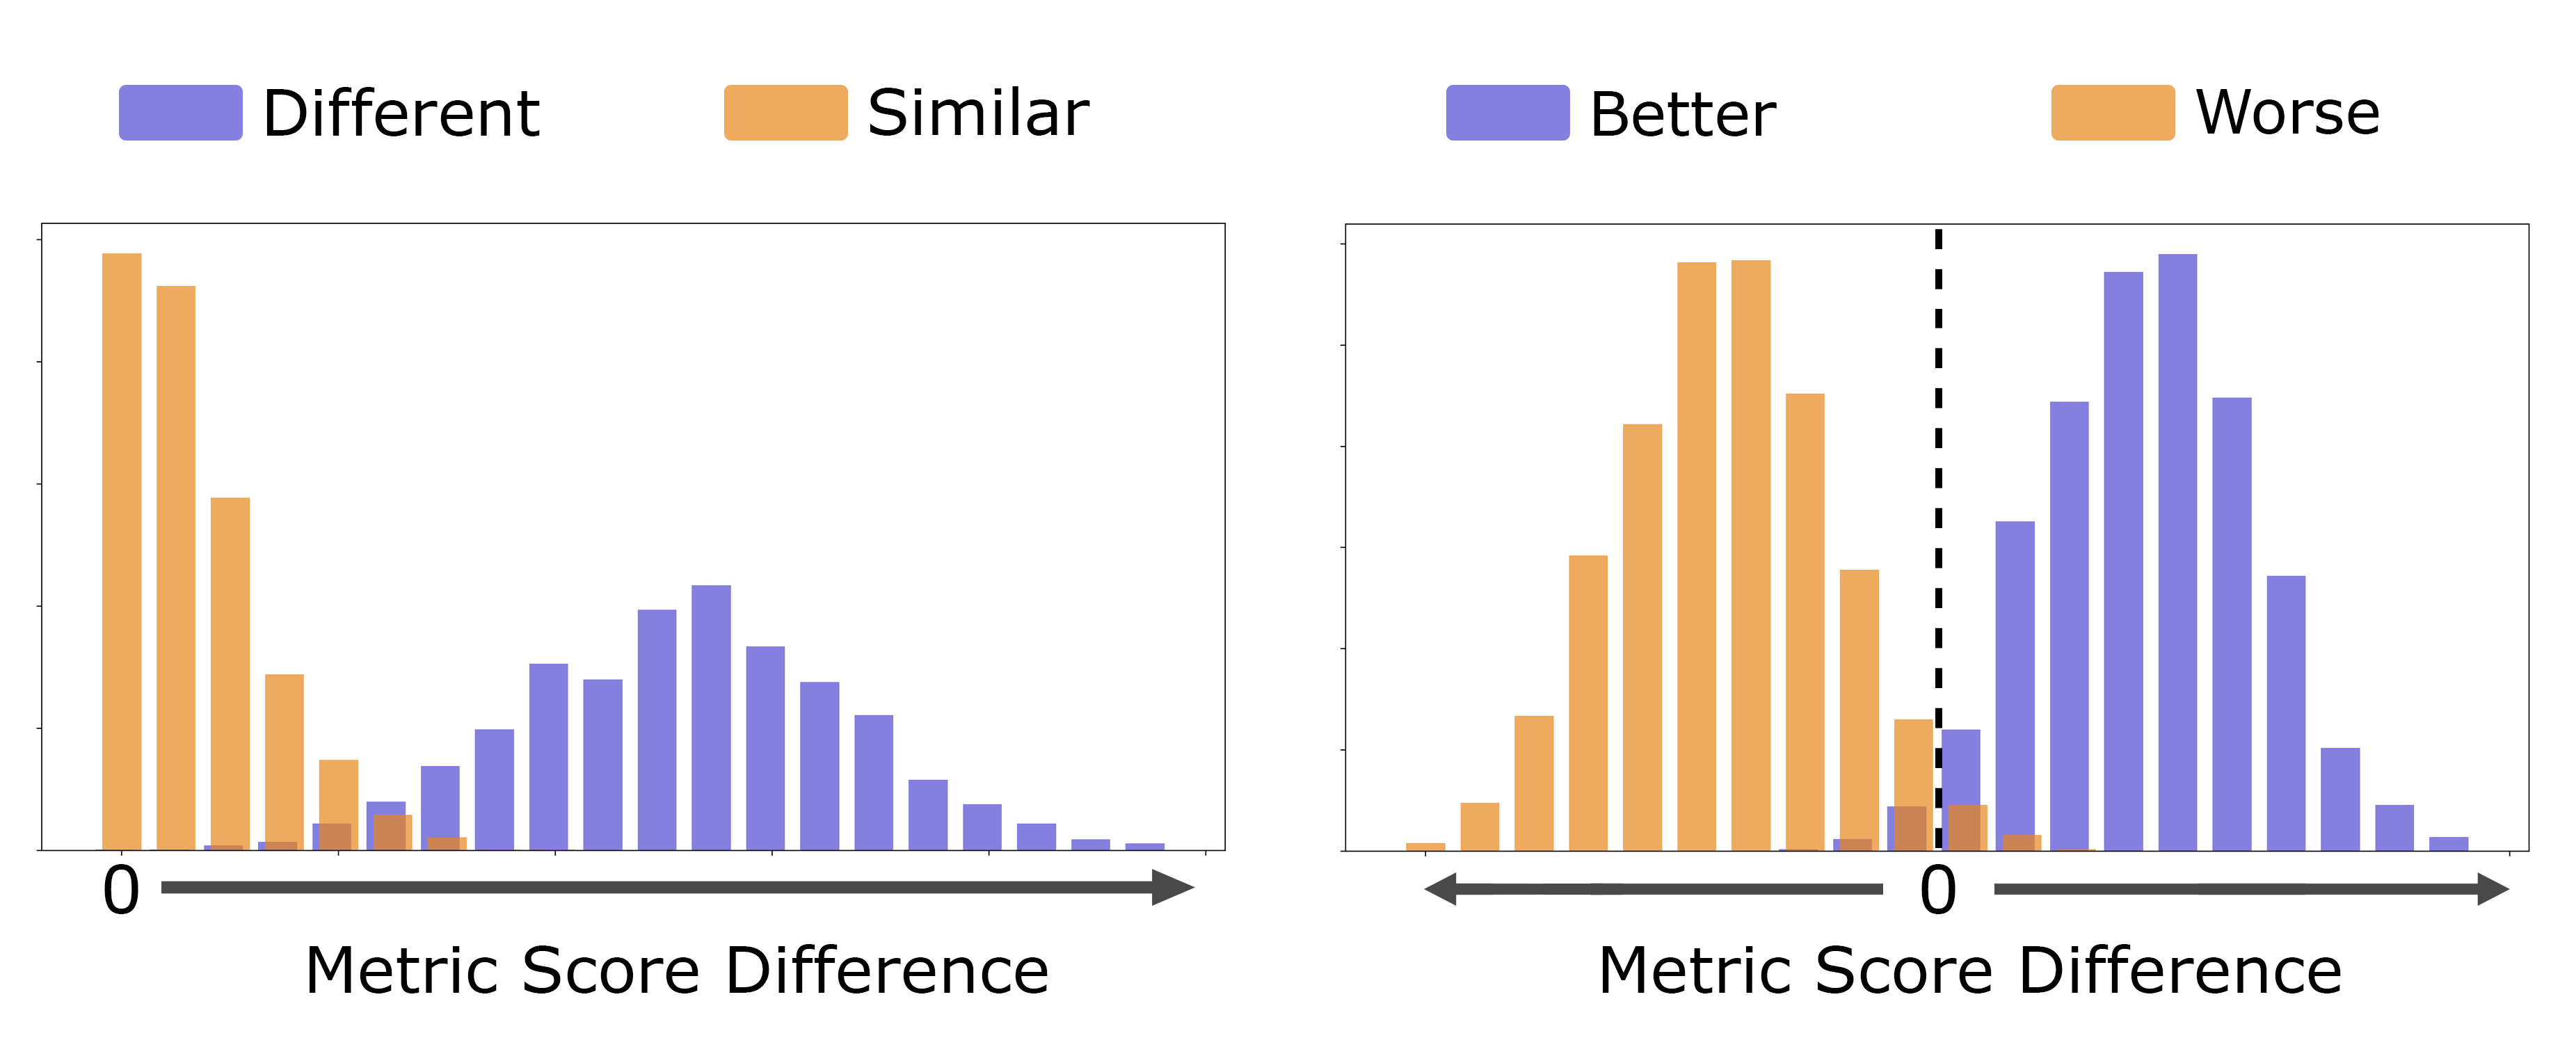
Krasula’s method: This method evaluates the objective metric performances in 2 stages, namely “Different vs Similar” and “Better vs Worse”. For “Different vs Similar” analysis, pairs of PPCs from the dataset are split into two categories as pairs with (i.e., different) and without (i.e., similar) statistically significant differences. For a given pair of PPC, one way ANOVA followed by Tukey’s honest significance difference test [43] is used to measure the statistical significance of the differences. Krasula’s method assumes that the absolute difference of metric predictions for different pairs should be larger than the similar pairs. To quantify the performance Receiver Operating Characteristic (ROC) analysis is used and the performance of the metrics are expressed as Area Under the ROC Curve (AUC). The second stage uses the pairs that are identified as different in the first stage. In the “Better vs Worse” stage, the aim is to measure the performance of metrics on identifying the better PPC in pairs with statistically significant difference. Performance of the metrics in “Better vs Worse” analysis can then be expressed as correct classification percentage as well as AUC values similar to first stage.
Figure 6 depicts the ideal distributions of the metric score differences for each stage of the analysis. In “Different vs Similar” analysis, we expect higher metric score differences for “Different” pairs and lower for “Similar” pairs. In “Better vs Worse” analysis, after fixing the order of the pairs as “Better” or “Worse”, we expect positive and negative metric score differences respectively for each category of pairs.
VI-C Correlation Analysis Results
Table III presents the PLCC and SROCC of each metric. Metrics are categorized into three as previously discussed in Section VI-A. First two column presents the metrics’ PLCC and SROCC scores on the whole dataset. Moreover, metric performances were evaluated for individual compression algorithms and the results are presented in following columns as indicated above.
PCQM [38] performs the best compared to other selected metrics in the whole dataset, despite its poor performance on prediction of GeoCNN compression distortions. Among color-based metrics, we again notice a similar pattern on the accuracy of metrics when it comes to GeoCNN compression distortions. PointSSIM variants perform relatively better than other metrics in this category.
Simple image-based metrics (e.g., MSE, PSNR, SSIM, MS-SSIM) have low accuracy across all compression categories and consequently on the whole dataset. VMAF shows the best performance among image-based metrics in the whole dataset. We also observe a general trend among image-based metrics towards a lack of accuracy on VPCC compression distortions.
VI-D Results of the Analysis by Krasula’s Method
Prior to the analysis, we pre-process the subjective scores as described in Krasula’s method[44]. First, 20 PPCs were paired within each source point cloud, generating pairs per SRC. In total, we end up with 14143 pairs. Thanks to high number of PPCs in the dataset, we kept the analysis within SRC. Afterwards, a one-way ANOVA test is applied to individual scores collected for each stimulus in each pair, followed by Tukey’s Honest test. 5019 pairs among the total 14143 were identified as “Similar” whereas 9124 contains a statistically significant different between the two PPC and thus identified as “Different”. From those “Different” pairs, we split them into two roughly equal sized groups as “Better” and “Worse” depending on the order of the pair. There are 4075 “Better” and 5049 “Worse” pairs. We report the result of the analysis on the top performing 10 metrics among the initial 40. Rest of the results can be found in the github repository, which will be added after ICIP 2023 Grand Challenge is concluded.
VI-D1 Different vs Similar Analysis
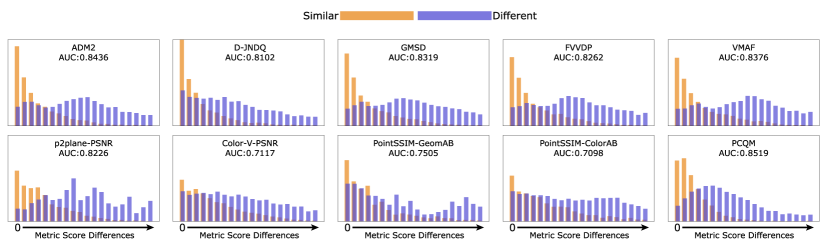
Figure 7 presents the results of the analysis as histograms of metric score differences for “Different” and “Similar” pairs. We expect better performing metrics to provide metric score distributions similar to the ideal case as depicted in Figure 6. Additionally, performance of each metric quantified with AUC values, reported under each metric name. In line with the results of the correlation analysis, we observe a better performance from PCQM, providing a higher AUC value and a very similar distribution to the ideal case. Statistical significance tests on this task also reveals that PCQM performs significantly better than all other metrics except ADM2 in “Different vs Similar” task.
VI-D2 Better vs Worse Analysis
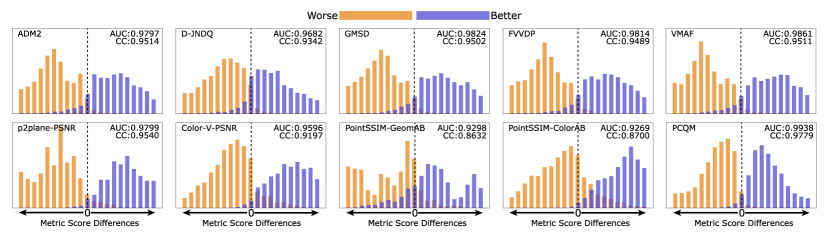
Similar to the previous stage, Figure 8 presents the results as histograms of metric score differences and quantifies the performance of each metric with AUC and CC values. We observe that most metrics perform relatively well on identifying “Better” and “Worse” pairs apart. PCQM performs significantly better than all other metrics in this task.
VII Conclusion
We conducted a large-scale crowdsourcing study on point cloud compression quality assessment. To the best of our knowledge, this is the largest publicly available point cloud quality assessment dataset containing 75 source point clouds each compressed with 4 different point cloud coding algorithms resulting in nearly 1500 processed point clouds. More than 3500 naive observers participated to do experiment.
Although most point cloud objective quality metrics accurately predicts GPCC distortions, VPCC distortions still poses a challenge to majority of the metrics. Moreover, most point cloud quality metrics fail to assess the quality of the point clouds compressed with GeoCNN. There is definitely a room for improvement for assessing learning-based coding algorithm related distortions.
We expect that the created database will provide a solid foundation for further point cloud compression and point cloud quality assessment research. This will then allow better telepresence experience in different applications and platforms.
The point cloud compression and quality assessment are both hot topics and the number of methods evolve rapidly. In the future, this database can be extended with further with more learning-based approaches to find the challenges and the limitations of the ongoing research and development on compression and quality estimation research.
Acknowledgments
This work has received funding from the European Union’s Horizon 2020 research and innovation programme under the Marie Sklodowska-Curie Grant Agreement No. 765911 (RealVision) and from Science Foundation Ireland (SFI) under the Grant Number 15/RP/27760.
[List of selected 3D models] A complete list of the selected 3D models will be provided after the ICIP 2023 challenge is concluded, including various metadata such as the PC ID (PC#), the semantic category (Cat), original 3D model format, how the 3D model is captured, number of points in the reference PC (Pt#), a brief explanation of contents, the name of the creator along with a link to the original 3D model, and the copyright licence. All of the used 3D models were licensed by a Creative Commons license .
References
- [1] A. Chetouani, G. Valenzise, A. Ak, E. Zerman, M. Quach, M. Tliba, M. A. Kerkouri, and P. Le Callet, “ICIP 2023 - Point cloud visual quality assessment grand challenge,” https://sites.google.com/view/icip2023-pcvqa-grand-challenge, 2023.
- [2] R. Pagés, K. Amplianitis, D. Monaghan, J. Ondřej, and A. Smolić, “Affordable content creation for free-viewpoint video and VR/AR applications,” Journal of Visual Communication and Image Representation, vol. 53, pp. 192–201, 2018.
- [3] A. Collet, M. Chuang, P. Sweeney, D. Gillett, D. Evseev, D. Calabrese, H. Hoppe, A. Kirk, and S. Sullivan, “High-quality streamable free-viewpoint video,” ACM Trans. Graphics, vol. 34, no. 4, Jul. 2015.
- [4] E. Zerman, C. Ozcinar, P. Gao, and A. Smolic, “Textured mesh vs coloured point cloud: A subjective study for volumetric video compression,” in 2020 Twelfth International Conference on Quality of Multimedia Experience (QoMEX), 2020, pp. 1–6.
- [5] E. Alexiou, Y. Nehmé, E. Zerman, I. Viola, G. Lavoué, A. Ak, A. Smolic, P. Le Callet, and P. Cesar, “Subjective and objective quality assessment for volumetric video,” in Immersive Video Technologies. Elsevier, 2023, pp. 501–552.
- [6] S. Perry, H. P. Cong, L. A. da Silva Cruz, J. Prazeres, M. Pereira, A. Pinheiro, E. Dumic, E. Alexiou, and T. Ebrahimi, “Quality evaluation of static point clouds encoded using mpeg codecs,” in 2020 IEEE International Conference on Image Processing (ICIP), 2020, pp. 3428–3432.
- [7] L. A. da Silva Cruz, E. Dumić, E. Alexiou, J. Prazeres, R. Duarte, M. Pereira, A. Pinheiro, and T. Ebrahimi, “Point cloud quality evaluation: Towards a definition for test conditions,” in 2019 Eleventh International Conference on Quality of Multimedia Experience (QoMEX), 2019, pp. 1–6.
- [8] Q. Yang, H. Chen, Z. Ma, Y. Xu, R. Tang, and J. Sun, “Predicting the perceptual quality of point cloud: A 3d-to-2d projection-based exploration,” IEEE Transactions on Multimedia, vol. 23, pp. 3877–3891, 2021.
- [9] H. Su, Z. Duanmu, W. Liu, Q. Liu, and Z. Wang, “Perceptual quality assessment of 3d point clouds,” in 2019 IEEE International Conference on Image Processing (ICIP), 2019, pp. 3182–3186.
- [10] L. Hua, M. Yu, G. yi Jiang, Z. He, and Y. Lin, “Vqa-cpc: a novel visual quality assessment metric of color point clouds,” in SPIE/COS Photonics Asia, 2020.
- [11] X. Wu, Y. Zhang, C. Fan, J. Hou, and S. Kwong, “Siat-pcqd: Subjective point cloud quality database with 6dof head-mounted display,” 2021. [Online]. Available: https://dx.doi.org/10.21227/ad8d-7r28
- [12] S. Subramanyam, J. Li, I. Viola, and P. Cesar, “Comparing the quality of highly realistic digital humans in 3dof and 6dof: A volumetric video case study,” in 2020 IEEE Conference on Virtual Reality and 3D User Interfaces (VR), 2020, pp. 127–136.
- [13] E. Alexiou, N. Yang, and T. Ebrahimi, “PointXR: A toolbox for visualization and subjective evaluation of point clouds in virtual reality,” in 12th International Conference on Quality of Multimedia Experience (QoMEX), 2020.
- [14] D. B. Graziosi, O. Nakagami, S. Kuma, A. Zaghetto, T. Suzuki, and A. Tabatabai, “An overview of ongoing point cloud compression standardization activities: video-based (V-PCC) and geometry-based (G-PCC),” APSIPA Transactions on Signal and Information Processing, vol. 9, 2020.
- [15] M. Quach, G. Valenzise, and F. Dufaux, “Improved deep point cloud geometry compression,” in 2020 IEEE 22nd International Workshop on Multimedia Signal Processing (MMSP). IEEE, 2020, pp. 1–6.
- [16] ——, “Learning convolutional transforms for lossy point cloud geometry compression,” in 2019 IEEE international conference on image processing (ICIP). IEEE, 2019, pp. 4320–4324.
- [17] “Prolific,” https://www.prolific.com/, accessed: Nov. 2022. [Online].
- [18] I. Viola, S. Subramanyam, J. Li, and P. Cesar, “On the impact of vr assessment on the quality of experience of highly realistic digital humans: A volumetric video case study,” Quality and User Experience, vol. 7, 05 2022.
- [19] Y. Nehmé, P. L. Callet, F. Dupont, J.-P. Farrugia, and G. Lavoué, “Exploring crowdsourcing for subjective quality assessment of 3d graphics,” in 2021 IEEE 23rd International Workshop on Multimedia Signal Processing (MMSP), 2021, pp. 1–6.
- [20] ITU-R, “Methodology for the subjective assessment of the quality of television pictures,” ITU-R Recommendation BT.500-14, 2019.
- [21] R. K. Mantiuk, A. Tomaszewska, and R. Mantiuk, “Comparison of four subjective methods for image quality assessment,” Comput. Graph. Forum, vol. 31, no. 8, p. 2478–2491, dec 2012. [Online]. Available: https://doi.org/10.1111/j.1467-8659.2012.03188.x
- [22] E. Zerman, V. Hulusic, G. Valenzise, R. Mantiuk, and F. Dufaux, “The relation between MOS and pairwise comparisons and the importance of cross-content comparisons,” in Human Vision and Electronic Imaging Conference, IS&T International Symposium on Electronic Imaging (EI 2018), Burlingame, United States, Jan. 2018. [Online]. Available: https://hal.archives-ouvertes.fr/hal-01654133
- [23] Y. Nehmé, J.-P. Farrugia, F. Dupont, P. LeCallet, and G. Lavoué, “Comparison of subjective methods, with and without explicit reference, for quality assessment of 3d graphics,” in ACM Symposium on Applied Perception 2019, ser. SAP ’19. New York, NY, USA: Association for Computing Machinery, 2019. [Online]. Available: https://doi.org/10.1145/3343036.3352493
- [24] A. Goswami, A. Ak, W. Hauser, P. L. Callet, and F. Dufaux, “Reliability of crowdsourcing for subjective quality evaluation of tone mapping operators,” in 2021 IEEE 23rd International Workshop on Multimedia Signal Processing (MMSP), 2021, pp. 1–6.
- [25] S. Palan and C. Schitter, “Prolific.ac—a subject pool for online experiments,” Journal of Behavioral and Experimental Finance, vol. 17, pp. 22–27, 2018.
- [26] Z. Li and C. G. Bampis, “Recover subjective quality scores from noisy measurements,” in 2017 Data compression conference (DCC). IEEE, 2017, pp. 52–61.
- [27] E. Zerman, C. Ozcinar, P. Gao, and A. Smolic, “Textured mesh vs coloured point cloud: A subjective study for volumetric video compression,” in 12th International Conference on Quality of Multimedia Experience (QoMEX). IEEE, May 2020.
- [28] A. Ak, E. Zerman, S. Ling, P. L. Callet, and A. Smolic, “The effect of temporal sub-sampling on the accuracy of volumetric video quality assessment,” in 2021 Picture Coding Symposium (PCS), 2021, pp. 1–5.
- [29] Z. Wang, A. Bovik, H. Sheikh, and E. Simoncelli, “Image quality assessment: from error visibility to structural similarity,” IEEE Transactions on Image Processing, vol. 13, no. 4, pp. 600–612, 2004.
- [30] L. Zhang, L. Zhang, X. Mou, and D. Zhang, “Fsim: A feature similarity index for image quality assessment,” IEEE Transactions on Image Processing, vol. 20, no. 8, pp. 2378–2386, 2011.
- [31] W. Xue, L. Zhang, X. Mou, and A. C. Bovik, “Gradient magnitude similarity deviation: A highly efficient perceptual image quality index,” IEEE Transactions on Image Processing, vol. 23, no. 2, pp. 684–695, 2014.
- [32] A. Ak, A. Pastor, and P. Le Callet, “From just noticeable differences to image quality,” in Proceedings of the 2nd Workshop on Quality of Experience in Visual Multimedia Applications, ser. QoEVMA ’22. New York, NY, USA: Association for Computing Machinery, 2022, p. 23–28. [Online]. Available: https://doi.org/10.1145/3552469.3555712
- [33] D. Sandić-Stanković, D. Kukolj, and P. Le Callet, “DIBR synthesized image quality assessment based on morphological wavelets,” in 2015 Seventh International Workshop on Quality of Multimedia Experience (QoMEX), 2015, pp. 1–6.
- [34] D. Sandić-Stanković, D. Kukolj, and P. Le Callet, “DIBR-synthesized image quality assessment based on morphological multi-scale approach,” EURASIP Journal on Image and Video Processing, vol. 2017, 07 2016.
- [35] R. Mekuria, Z. Li, C. Tulvan, and P. Chou, “Evaluation criteria for PCC (Point Cloud Compression),” ISO/IEC JTC 1/SC29/WG11 Doc. N16332, 2016.
- [36] D. Tian, H. Ochimizu, C. Feng, R. Cohen, and A. Vetro, “Evaluation metrics for point cloud compression,” ISO/IEC JTC 1/SC29/WG11 Doc. M39966, 2017.
- [37] E. Alexiou and T. Ebrahimi, “Point cloud quality assessment metric based on angular similarity,” in International Conference on Multimedia & Expo (ICME), 2018.
- [38] G. Meynet, Y. Nehmé, J. Digne, and G. Lavoué, “PCQM: A full-reference quality metric for colored 3D point clouds,” in 12th International Conference on Quality of Multimedia Experience (QoMEX), 2020.
- [39] E. Alexiou and T. Ebrahimi, “Towards a point cloud structural similarity metric,” in 2020 IEEE International Conference on Multimedia & Expo Workshops (ICMEW), 2020, pp. 1–6.
- [40] D. Tian, H. Ochimizu, C. Feng, R. Cohen, and A. Vetro, “Geometric distortion metrics for point cloud compression,” in IEEE International Conference on Image Processing (ICIP), Sept 2017, pp. 3460–3464.
- [41] E. Alexiou and T. Ebrahimi, “Point cloud quality assessment metric based on angular similarity,” in International Conference on Multimedia & Expo (ICME), 2018.
- [42] ITU-R, “Methods, metrics and procedures for statistical evaluation, qualification and comparison of objective quality prediction models,” ITU-R Recommendation P.1401, 2020.
- [43] J. W. Tukey, “Comparing individual means in the analysis of variance.” Biometrics, vol. 5 2, pp. 99–114, 1949.
- [44] L. Krasula, K. Fliegel, P. Le Callet, and M. Klíma, “On the accuracy of objective image and video quality models: New methodology for performance evaluation,” in 2016 Eighth International Conference on Quality of Multimedia Experience (QoMEX), 2016, pp. 1–6.