Superconductivity and magnetic and transport properties of single-crystalline CaK(Fe1-xCrx)4As4
Abstract
Members of the CaK(Fe1-xCrx)4As4 series have been synthesized by high-temperature solution growth in single crystalline form and characterized by X-ray diffraction, elemental analysis, magnetic and transport measurements. The effects of Cr substitution on the superconducting and magnetic ground states of CaKFe4As4 ( = 35 K) have been studied. These measurements show that the superconducting transition temperature decreases monotonically and is finally suppressed below 1.8 K as is increased from 0 to 0.038. For -values greater than 0.012, signatures of a magnetic transition can be detected in magnetic measurements with the associated features in the transport measurements becoming detectable for 0.038. The magnetic transition temperature increases in a roughly linear manner as Cr substitution increases. A temperature-composition (T-x) phase diagram is constructed, revealing a half-dome of superconductivity with the magnetic transition temperature, , appearing near 22 K for 0.017 and rising slowly up to 60 K for 0.077. The - phase diagrams for CaK(Fe1-xx)4As4 for = Cr and Mn are essentially the same despite the nominally different band filling; this is in marked contrast to = Co and Ni series for which the - diagrams scale by a factor of two, consistent with the different changes in band filling Co and Ni would produce when replacing Fe. Superconductivity of CaK(Fe1-xCrx)4As4 is also studied as a function of magnetic field. A clear change in ()/, where () is d()/d, at 0.012 is observed and probably is related to change of the Fermi surface due to magnetic order. Coherence length and the London penetration depths are also calculated based on and data. Coherence lengths as the function of also shows changes near = 0.012, again consistent with Fermi surfaces changes associated with the magnetic ordering seen for higher -values.
I introduction
The study of Fe-based superconductors has lead to extensive experimental interest and their variety offers the opportunity of understanding unconventional superconductivity in a broader sense. Fe-based superconductors families share similar crystal structures [1, 2, 3, 4, 5, 6, 7, 8, 9, 10] and phase diagrams [11, 12, 13, 14, 15, 16, 17, 18, 19], which suggests a relationship between, or proximity of, superconducting and magnetic and/or nematic ordering or fluctuations. These relationships between superconductivity and magnetic as well as structural transitions and fluctuations are believed to be key to understand unconventional superconductivity [20].
Though Fe-based superconductors have a moderate degree of structural diversity, three, main structural classes: Fe2As2 (=Alkaline Earth) (122) families [11, 12, 13, 2, 3, 14, 15, 4], Fe4As4 (A=Alkaline Metal) (1144) family [5, 6, 7, 16, 9, 10] and FeSe [8, 17] provide a microcosm of many key questions at hand. Compared with the interplay between stripe-like antiferromagnetic order, nematicity, and superconductivity in the doped 122-systems at ambient pressure [14, 3], the electron-doped CaK(Fe)4As4, = Ni and Co system has hedgehog-spin-vortex-crystal (h-SVC) type antiferromagnetic (AFM) order and superconductivity interacting with each other without any structural phase transition[16, 21].
On one hand, since the phase diagrams of Co and Ni substitutions of CaKFe4As4 scaled almost exactly as a function of band filling change, the comparison between CaKFe4As4 and Ba0.5K0.5Fe2As2 based on their similar, nominal electron counts, seems justified. One the other hand, given that CaK(Fe)4As4 allows for the study of how nominal hole-doping with Mn and Cr can affect the superconducting and magnetic properties of this system, it is very important to see how their - phase diagrams compare with each other as well as those for = Co and Ni.
We have recently found that for CaK(Fe)4As4, = Mn, Mn is a far more local-moment-like impurity than = Co or Ni are. We also found that the substitution level of CaK(Fe1-xMnx)4As4 can only go to up to = 0.036. Beyond that level, 1144 phase is not stabilized with the similar synthesis condition. This limited the exploration of hole -doped 1144 phase diagram and the evolution of h-SVC type antiferromagnetic transition. Cr offers twice the amount of nominal hole-doping per and, like Mn, can sometimes manifest local-moment-like properties in intermetallic samples. As such, Cr substitution offers a great of opportunity to further our understanding of the behavior of h-SVC type antiferromagnetism in the 1144 system.
In this paper, we detail the synthesis and characterization of CaK(Fe1-xCrx)4As4 single crystals. A temperature-composition (-) phase diagram is constructed by elemental analysis, magnetic and transport measurements. In addition to creating the - phase diagram, coherence lengths and the London penetration depths are also calculated based on and data obtained from measurements. The data for Cr-substituted 1144 are added on the versus plot and compared with the Mn substitution. Finally, temperature vs change of electron count, ||, phase diagram for CaK(Fe)4As4 single crystals, = Cr, Mn, Ni and Co, is also presented and discussed. By comparing all four = Cr, Mn, Ni and Co substitutions we find that whereas for = Ni and Co CaK(Fe)4As4 the temperature -substitution phase diagrams scale with additional electrons (in much the same way that the Ba(Fe)2As2 phase diagrams do for = Ni and Co), for = Cr and Mn the temperature substitution phase diagrams are essentially identical when plotted more simply as - diagrams, suggesting that for Cr and Mn there may be other variables or mechanisms at play.
II Crystal Growth and Experimental Method
Single crystalline CaK(Fe1-xCrx)4As4 samples were grown by high-temperature solution growth [22] out of FeAs flux in the manner similar to CaK(Fe1-xMnx)4As4 [19]. Lumps of potassium metal (Alfa Aesar 99.95%), distilled calcium metal pieces (Ames Laboratory, Materials Preparation Center (MPC 99.9%) and Fe0.512As0.488 and Cr0.512As0.488 precursor powders were loaded into a 1.7 ml fritted alumina Canfield Crucible Set [23] (LSP Industrial Ceramics, Inc.) in an argon filled glove-box. The ratio of K:Ca:Fe0.512As0.488 and Cr0.512As0.488 was 1.2:0.8:20. A 1.3 cm outer diameter and 6.4 cm long tantalum tube which was used to protect the silica ampoule from reactive vapors was welded with the crucible set in partial argon atmosphere inside. The sealed Ta tube was then itself sealed into a silica ampoule and the ampoule was placed inside a box furnace. The furnace was held for 2 hours at 650 ℃ before increasing to 1180 ℃ and held there for 5 hours to make sure the precursor was fully melted. The furnace was then fast cooled from 1180 ℃ to 980 ℃ in 1.5 hours. Crystals were grown during a slow cool-down from 980 ℃ to 915 ℃ over 100-150 hours dependent on substitution level. After 1-2 hours at 915 ℃ the ampoule was inverted into a centrifuge and spun to separate the remaining liquid from the grown crystals. Metallic, plate-like, crystals were obtained. The average size and thickness decreased by factor 2-4 as is increased. The largest crystal is about centimeter size as shown in figure 1
Single crystals of CaK(Fe1-xCrx)4As4 are soft and malleable as CaKFe4As4 and are difficult to grind for powder X-ray diffraction measurements. Diffraction measurements were carried out on single crystal samples, which were cleaved along the (001) plane, using a Rigaku MiniFlex II powder diffactometer in Bragg-Brentano geometry with Cu K radiation ( = 1.5406 Å) [24].
The Cr substitution levels () of the CaK(Fe1-xCrx)4As4 crystals were determined by energy dispersive spectroscopy (EDS) quantitative chemical analysis using an EDS detector (Thermo NORAN Microanalysis System, model C10001) attached to a JEOL scanning-electron microscope. The compositions of platelike crystals were measured at three separate positions on each crystal’s face (parallel to the crystallographic ab-plane) after cleaving them. An acceleration voltage of 16 kV, working distance of 10 mm and take off angle of 35∘ were used for measuring all standards and crystals with unknown composition. Pure CaKFe4As4 was used as a standard for Ca, K, Fe and As quantification. LaCrGe3 and YCr6Ge6 were used as standards for Cr, both leading to consistent results without significant difference within the experimental error ( 0.001). The spectra were fitted using NIST-DTSA II Microscopium 2020-06-26 software[25]. Different measurements on the same sample reveal good homogeneity in each crystal and the average compositions and error bars were obtained from these data, accounting for both inhomogeneity and goodness of fit of each spectra.
Temperature- and magnetic-field-dependent magnetization and resistance measurements were carried out by using Quantum Design (QD), Magnetic Property Measurement Systems (MPMS and MPMS3) and Physical Property Measurement Systems (PPMS). Temperature- and magnetic-field-dependent magnetization measurements were taken for Hab by placing the plate-like sample between two collapsed plastic straws with the third, uncollapsed, straw providing support as a sheath on the outside or by using of a quartz sample holder. The single crystal samples of CaK(Fe1-xCrx)4As4 measured in the MPMS and MPMS3 have plate-like morphology with length and width from 3 mm to 10 mm and thickness (c axis) 50 - 200 m. The approximate effective demagnetizing factor ranges from 0.007 to 0.077 with magnetic field applied parallel to the crystallographic ab plane[26]. AC electrical resistance measurements were performed in a standard four-contact geometry using the ACT option of the PPMS, with a 3 mA excitation and a frequency of 17 Hz. 50m diameter Pt wires were bonded to the samples with silver paint (DuPont 4929N) with contact resistance values of about 2-3 Ohms. The magnetic field, up to 90 kOe, was applied along c or ab directions, perpendicular to the current, with the current flowing in the ab plane in both cases.
Contacts for inter-plane resistivity measurements were soldered using tin. The top and bottom surfaces of the samples were covered with Sn solder [27, 28] and 50 m silver wires were attached to enable measurements in a pseudo-four-probe configuration. Soldering produced contacts with resistance typically in the 10 range. Inter-plane resistivity was measured using a two-probe technique with currents in 1 to 10 mA range (depending on sample resistance which is typically 1 m). A four-probe scheme was used down to the sample to measure series connected sample, , and contact, resistance. Taking into account that , contact resistance represents a minor correction of the order of 1 to 5%. The details of the measurement procedure can be found in Refs. [29, 30, 31]. The results of the measurements are in good agreement with similar measurements on pure CaKFe4As4 [6].
Measurements with current along the axis suffer strongly from inter-layer connectivity due to the micacious nature of single crystals. To ascertain reproducibility, we performed measurements of on two to five samples and obtained qualitatively similar temperature dependencies of the electrical resistivity, as represented by the ratio of resistivities at room and low temperatures, . The resistivity was in the range 1- 2 m, corresponding to an anisotropy ratio 3 to 6 at 300 K.
III CaK(Fe1-xCrx)4As4 Structure and Composition
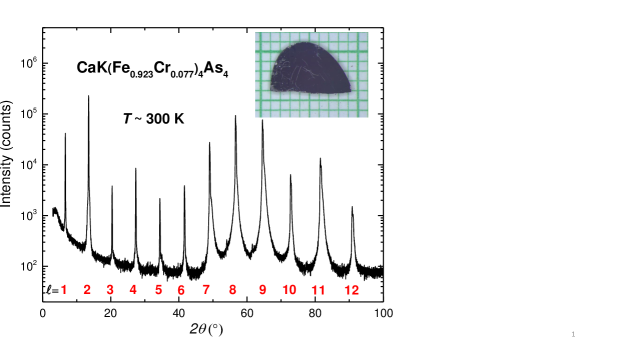
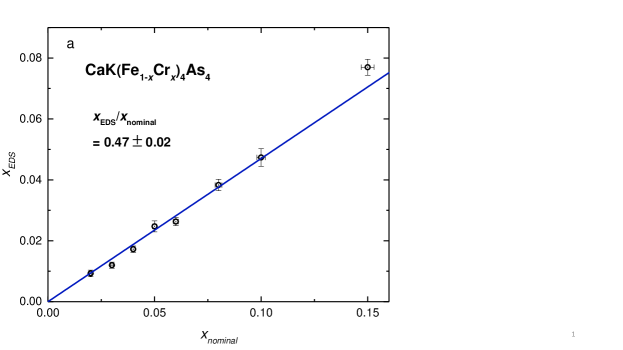
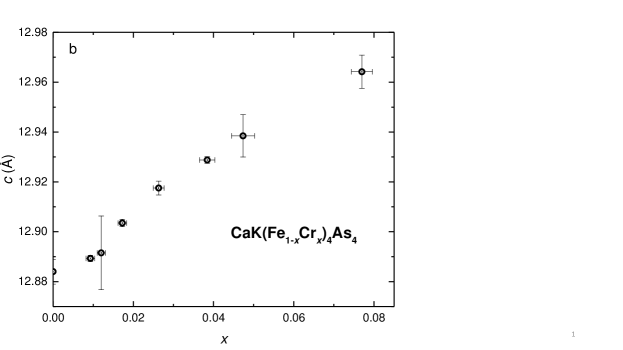
Figure 1 presents single crystal diffraction data of CaK(Fe1-xCrx)4As4 with which is the largest substitution level obtained. Attempts to grow crystals with > 0.077 failed to yield mm-sized or larger samples that could be identified as Cr-doped 1144. From the figure, we can see that all (), , are detected. The = odd peaks which are forbidden for the I4/mmm structure [5] can be clearly found. This indicates that sample has the anticipated P4/mmm structure associated with the CaKFe4As4 structure [5, 16, 6].
The Cr substitution, EDS, determined by EDS is shown in figure 2a for different crystals as a function of the nominal Cr fraction, nominal, that was originally used for the growth. Error bars account for both possible inhomogeneity of substitution and goodness of fit of each EDS spectra. A clear correlation can be seen between the nominal and the measured substitution levels, with a proportionality factor of 0.47 0.02. For comparison, the ratio of measured to nominal Mn, Ni and Co fraction in the corresponding CaK(Fe1-xTx)4As4 are 0.60, 0.64 and 0.79 respectively [16, 19]. From this point onward, when substitution level is referred to, it will be the EDS value of . Figure 2b presents lattice parameters as the function of . lattice parameter monotonically increases as Cr substitution level increase, which is consist with the larger radius of Cr than Fe. lattice parameter values are calculated by the single-crystalline plate X-ray diffraction plot [24]. In Mn-1144 (CaK(Fe1-xMnx)4As4), the evolution of the lattice parameter is difficult to determine due to the small difference of radius between Fe and Mn and low substitution levels. The highest is 0.036 in Mn-1144 and it’s smaller than, 0.039, lowest substitution of Co-1144.
IV Data analysis and Phase Diagram
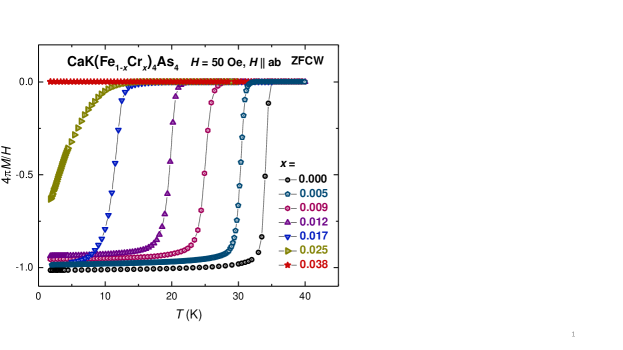
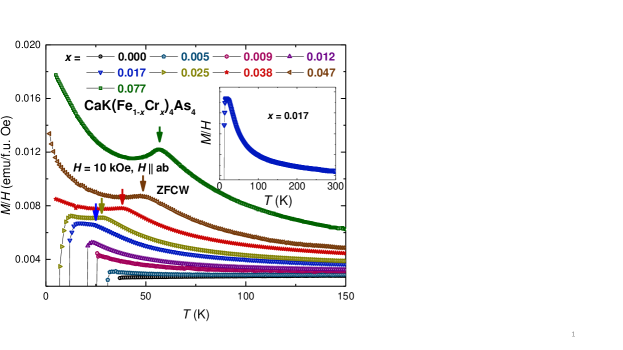
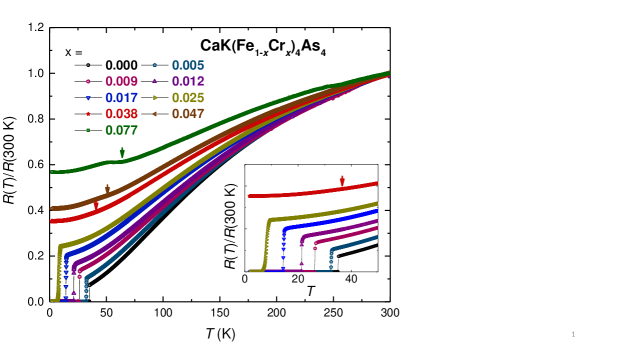
Figure 3 shows the low temperature (1.8 K - 45 K), zero-field-cooled-warming (ZFCW) magnetization for CaK(Fe1-xCrx)4As4 single crystals for = 50 Oe (ZFCW magnetization and field-cooled (FC) data for an = 0.017 sample can be found in figure 19 in the Appendix). is the volumetric magnetization in this figure and is calculated by using the density of CaKFe4As4, which is determined to be 5.22 g/cm3 from the lattice parameters at room temperature [5]. A magnetic field of 50 Oe was applied parallel to ab plane (i.e. parallel to the surface of the plate-like crystal). The superconducting transitions () are clearly seen in this graph except for the substitution value x = 0.038. As the value of the Cr substitution, , increases, the superconducting transition temperature decreases. For , a full magnetic shielding is not reached by 1.8 K.
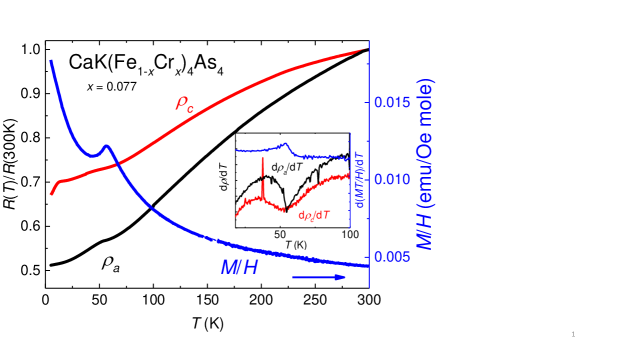
Figure 4 shows the low temperature (5 K - 150 K) ()/ data for CaK(Fe1-xCrx)4As4 single crystals with 10 kOe field applied parallel to the crystallographic ab plane. The appearance of first a Curie-Weiss tail and later a kink-like feature after adding Cr is similar to Mn substituted 1144. Kink-like features are found above 20 K for , which very likely indicate antiferromagnetic transition. Similar kink-like features were correlated with AFM order in CaK(Fe1-xMnx)4As4 [19, 32]. The inset shows ()/ of a CaK(Fe0.983Cr0.017)4As4 single crystal over a wider temperature range. As Cr is added the Curie-tail-like feature grows. The () data above transitions can be fitted by a C/(+) + function as long as Cr doping levels is larger than 0.005 ( > 0.005). The effective moment versus data is shown in figure 18 in the Appendix; calculated per Cr, is found to be 4 B. For > 0.012, a kink-like feature can be seen at a temperature . As increases from 0.017 to 0.077, the temperature increases from 20 K to 60 K. The criterion for determining and more discussion about the Curie-tail are shown in the Appendix.
Figure 5 presents the temperature dependent, normalized, electrical resistance of CaK(Fe1-xCrx)4As4 single crystals. RRR (the ratio of 300 K and low temperature resistance just above ) decreases as Cr substitution increases, which is consistent with the disorder increasing. The superconducting transition temperatures decrease as Cr is added to the system. When x = 0.038, there is no signature of a superconducting transition detectable above 1.8 K. With increasing Cr content, a kink appears for > 0.025 and rises to about 60 K for = 0.077 and features become more clearly resolved with increasing substitution. A similar feature also appeared in Mn, Ni and Co-substituted CaKFe4As4 electrical resistance measurements [16, 19]. The criterion for determining the transition temperature, , associated with this kink is shown in the Appendix in figure 21c where and d/d are both shown.
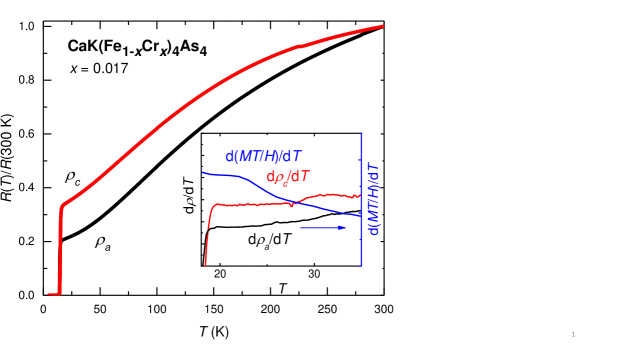
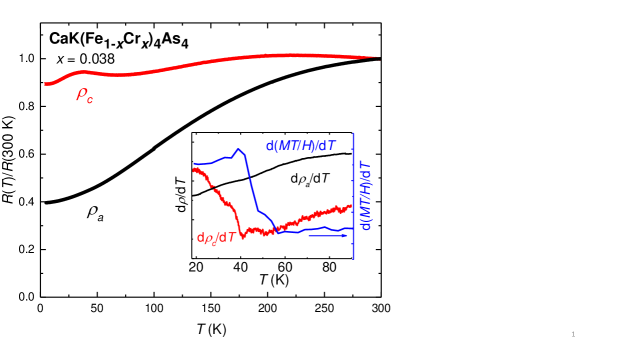
Figures 6 and 7 compare the normalized electrical resistivity of CaK(Fe1-xCrx)4As4 single crystals for electrical currents along -axis in the tetragonal plane (black lines in the main panels) with those along the tetragonal -axis (red curves in the main panels). Samples with = 0.017, figure 6, are in the range of SC and AFM coexistence; samples with = 0.038, figure 7, are in the range where superconductivity is suppressed (see figure 8, below). The inter-plane resistivity of the samples with = 0.017 shows a broad cross-over close to room temperature, much milder feature is found in in-plane transport. This is very similar to the results on the parent compound = 0 [6]. For samples with = 0.038, figure 7, the inter-plane resistivity (red curve, main panel) reveals clearly non-monotonic dependence. The cross-over transforms into a clear maximum above 200 K, followed by a second maximum centered at about 35 K, close to the temperature of long-range magnetic ordering.
Insets in the figures compare the derivatives of the normalised resistivities for two current directions with d(/)/d (blue lines, right scale) [33]. For sample = 0.017 in figure 6, no clear features are observed in the resistivity derivatives, however some flattening is observed for -axis resistivity. For samples with = 0.038, the peak in d(/)/d at 42 K is in good agreement with the feature in the derivative of inter-plane resistivity. A feature in the derivative of in-plane resistivity is notably less pronounced (black curve in inset in figure 7).
In some cases the features associated with magnetic ordering in the FeAs-based superconductors are clearer for current flow along the -axis as opposed to current flow in the basal -plane [31]. This is believed to be due to an anternating arrangements of the magnetic moments along the -axis direction, providing partial gapping of the Fermi surface affecting more strongly inter-plane transport. The clarity of features increases with in CaK(Fe1-xCrx)4As4, making then clearly visible in the raw resistivity data for 0.077 (see Appendix figure 23).
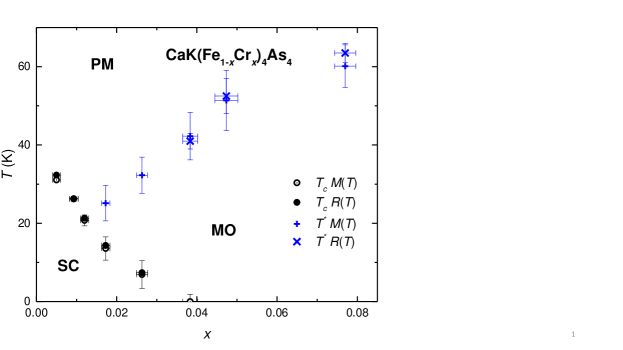
Figure 8 summarizes the transition temperature results inferred from magnetization and resistance measurements, plots the superconducting and magnetic transitions as a function of substitution and constructs the - phase diagram for the CaK(Fe1-xCrx)4As4 system. As depicted in this phase diagram, increasing Cr substitution (i) suppresses monotonically with it extrapolating to 0 K by 0.03 and (ii) stabilizes a new transition, presumably an antiferromagnetic one, for 0.017 with the transition temperature rising from 20 K for = 0.017 to 60 K for = 0.077. Each phase line is made out of data points inferred from R(T) and M(T) measurements, illustrating the good agreement between our criteria for inferring and from magnetization and resistivity data. The CaK(Fe1-xx)4As4 series, = Mn, Co and Ni, have qualitatively similar phase diagrams, with the quantitative differences being associated with the substitution levels necessary to induce the magnetic phase and to suppress superconductivity. We were not able to infer the behavior of once it drops below , but if it is similar to other substitution[34, 32], should be suppressed very fast in the superconductivity state. Further comparison of the CaK(Fe1-xCrx)4As4 phase diagram to the phase diagrams of the CaK(Fe1-xx)4As4 series will be made in the discussion section below.
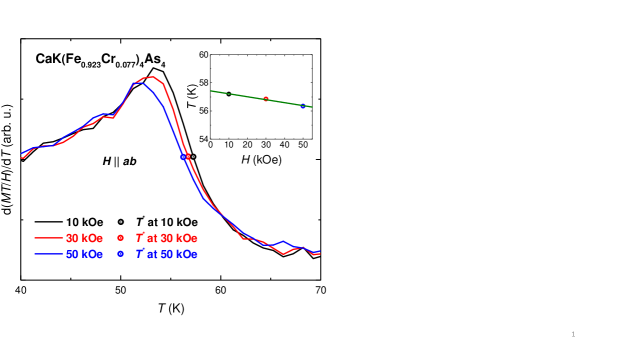
Given that the () data were taken in zero applied field whereas the () data shown in figure 4 were taken in 10 kOe, it is prudent to examine the field dependence of transition associated with . In figure 9 we show the d()/d data [35] for the = 0.077 sample for || ab = 10, 30 and 50 kOe. As is commonly seen for antiferromagnetic phase transition, increasing a magnetic field leads to a monotonic suppression of . The inset to figure 9 shows that the extrapolated, = 0, value would be 57.4 K as compared to the value of 57.2 K for 10 kOe. This further confirms that there should be (and is) good agreement between the values inferred from 10 kOe magnetization data and the values inferred from and resistance data in figure 8. In addition these data suggest that magnetic field could be used to fine tune the value of , if needed.
V Superconducting critical fields and anisotropy
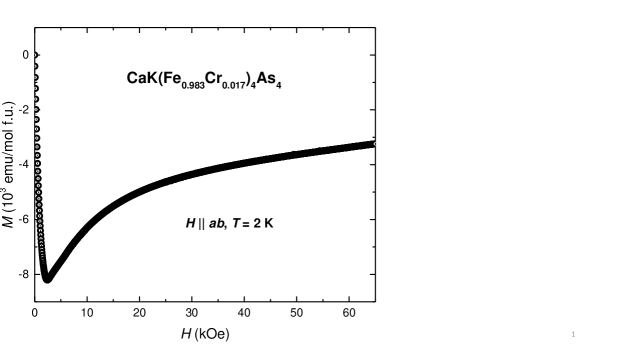
Superconductivity can be studied as a function of field (in addition to temperature and doping). Before we present our c2() results, based on () data, it is useful to check the () data. We start with M(H) data for = 0.012, = 21.3 K, taken over a wide field range. The 2 K M(H) data for shown in figure 10 is classically non-linear, showing a local minimum near 2.5 kOe. For = 2 K < the value is clearly higher than the 65 kOe maximum field we applied (see discussion and figures below). can be inferred from the lower field M(H) data.
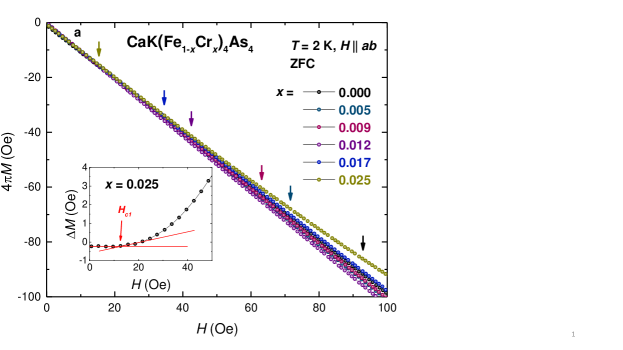
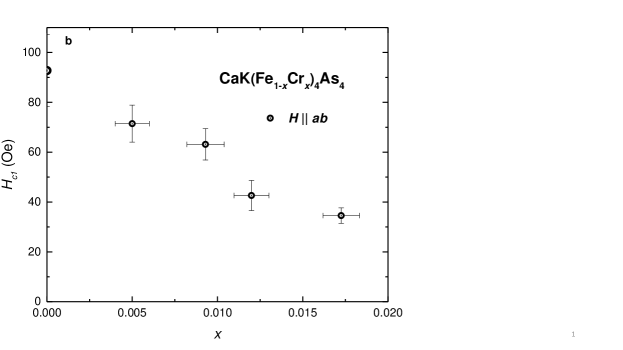
In order to better estimate values we performed low field, sweeps at base temperature. In figure 11a we show the M(H) data for 0 0.025 for 100 Oe. As increases the deviation from the fully shielded, linear behavior, that occurs at , appears at lower and lower fields. As shown in the inset of figure 11a, is determined by subtracting the linear, lowest field behavior of from . Given the finite thickness of samples and field direction applied in plane, there is a small demagnetizing factor ( < 0.077), therefore, is taken as the vortices start to enter the sample and determined as the point when the () data deviates from the linear, lowest field behavior. The non-zero value is due to remnant field of MPMS. The standard error of comes from at least 4 different samples’ measurements. Figure 11b shows at 2 K with different substitution. = 0.025 is not shown in this plot since 7 K is close to 2 K. The data shown in figure 11b are roughly linear in , but there may be a hint of a change in behavior near 0.01, where drops below in figure 8. This will be discussed further when examine the London penetration depth below.
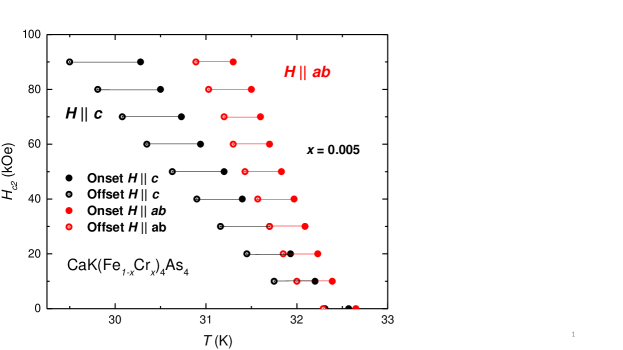
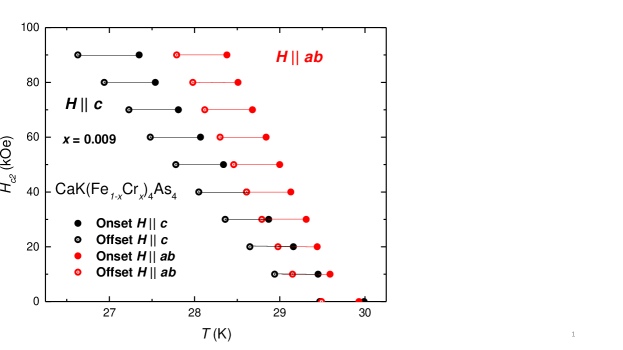
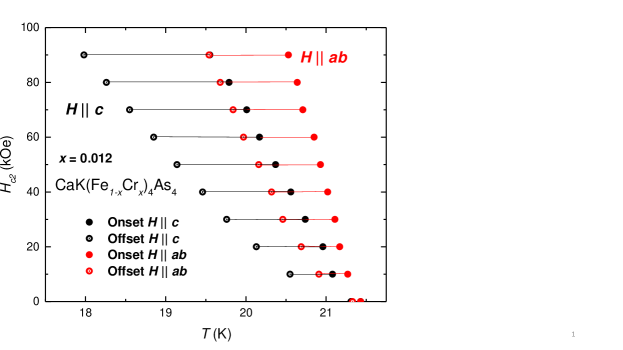
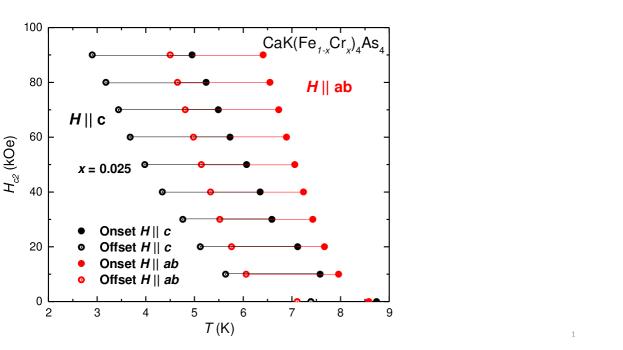
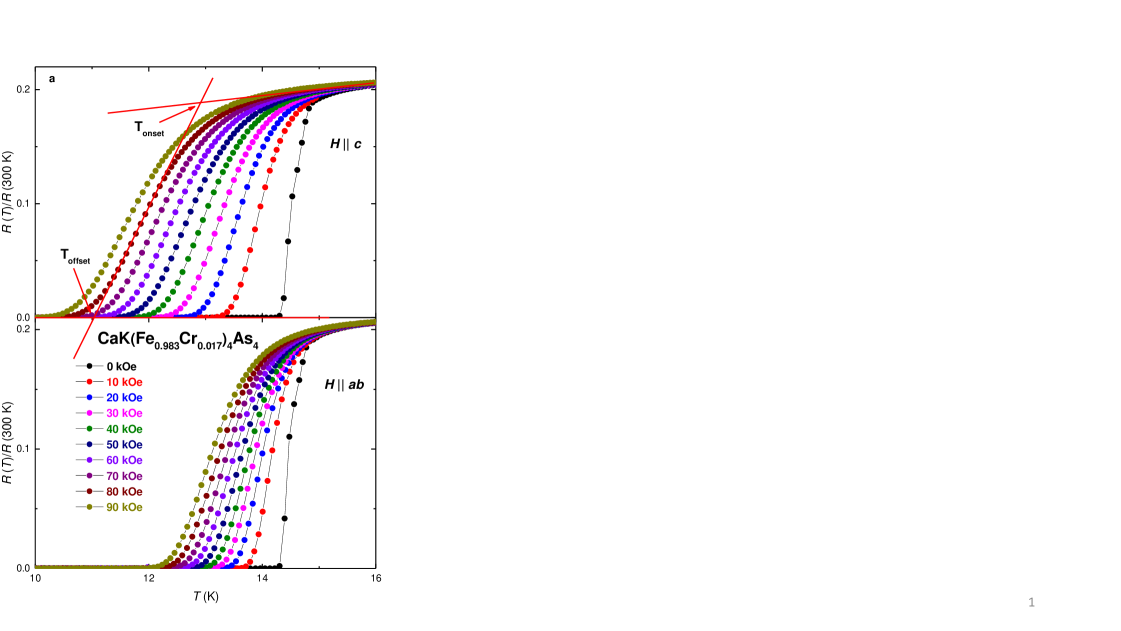
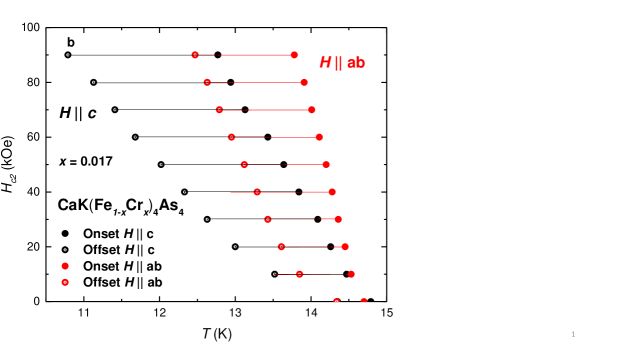
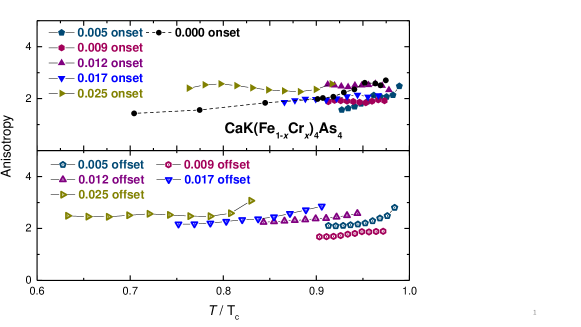
In order to further study the effects of Cr substitution on the superconducting state, anisotropic data for temperatures near were determined for the substitution levels that have superconductivity. Figure 12a shows a representative set of () data taken for fixed applied magnetic fields, axis and plane 90 kOe for = 0.017. Figure 12a also shows an example of the onset and offset criteria used for the evaluation of . Figure 12b presents the anisotropic curves for CaK(Fe0.983Cr0.017)4As4 single crystals with both || and || , showing both the onset (Tonset) and offset (Toffset) temperatures. For = 0.005, 0.009, 0.012 and 0.025, curves are shown in Appendix figures 24 - 27. From plots, we can see that is only suppressed by about 4 K when 90 kOe magnetic field is applied, so the complete plots of the CaK(Fe1-xCrx)4As4 compounds cannot be fully determined, however we still can observe several trends in these data.
Figure 13 shows the temperature dependent anisotropy ratio, , is around 2.5 for these samples over the 0.6 < / < 1.0 range. This value is similar to other 122 and 1144 materials [13, 6, 19, 31]. 2.5 is also qualitatively consistent with the estimated resistivity anisotropy ratio at 300 K, increasing to at = 0 K, with [36]. Black circles and dashed line present the data for pure CaKFe4As4 [6]. The anisotropies of coherence length and penetration depth are expected to be the same close to , but can have opposite temperature dependence upon cooling below that [37]. However, almost no temperature dependence of is seen in the temperature range measured. Based on that, the average values of gamma can be taken as a good estimate of both anisotropies at low temperature as well.
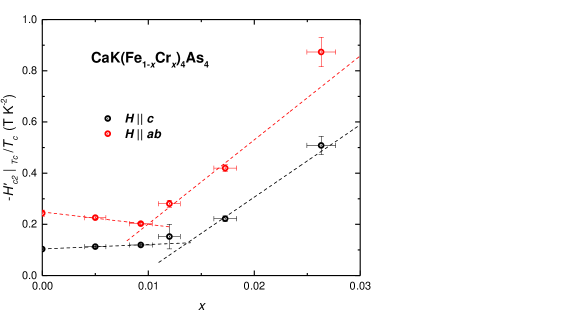
Given that we have determined () for temperatures close to , we can evaluate the ()/ close to , where () is d()/d, specifically seeing how it changes as drops below with increasing x. Error of ()/ comes from linear fit of () near the . In the case of other Fe-based systems [38, 39, 40, 41, 19] clear changes in ()/ were associated with changes in the magnetic sublattice coexisting with superconductivity (i.e. ordered or disordered). In figure 14 we can see that there is a change in the x-dependence of ()/ for 0.012, beyond which substitution level suppresses below . Comparison with the slope change of in the pressure-temperature phase diagram of CaK(Fe1-xNix)4As4 [38], further suggest that this is probably related to changes in the Fermi surface, caused by the onset of the new periodicity associated with the AFM order.
VI discussion and summary
The - phase diagram for CaK(Fe1-xCrx)4As4 (Figure 8) is qualitatively similar to those found for Co-, Ni- and Mn- substituted CaKFe4As4, there is a clear suppression of with increasing Cr substitution as well as an onset of what is likely to be a AFM ordering for > 0.012.
In figures 11 and 14 we presented measurements and analysis of and data. Whereas we see only subtle, if any effect of the onset of AFM ordering on (figure 11b), there is a clear effect on (figure 14). Using our and data we can extract information about the superconducting coherence length and London penetration depth as well.
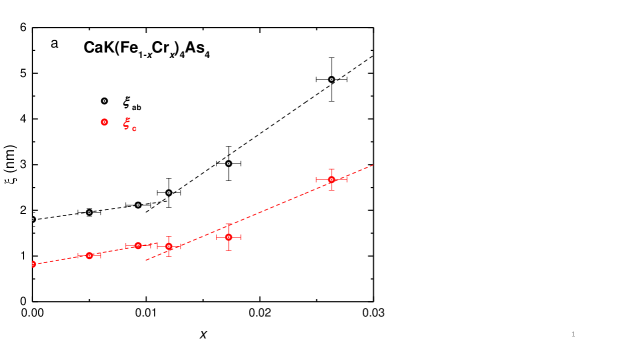
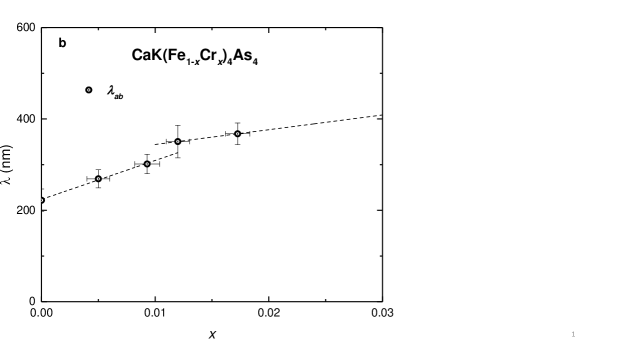
Figure 15a shows coherence length, , of CaK(Fe1-xCrx)4As4 as a function of . is estimated by using the anisotropic scaling relations 0.69|d/d| = /2 and 0.69|d/d| = /2 [6]. We estimate with dd = 0.69 [42]. Figure 15b shows the London penetration depth, , as a function of . Since, according to figure 13, of does not change much as the temperature decreases below Tc, the anisotropy of the penetration depth is estimated as the average of the anisotropy of at low temperature. is obtained by using,
| (1) | ||||
| (2) |
= = = = with being the angle-dependent anisotropy parameter and = [43, 44, 45]. Coherence lengths and penetration depths increase as substitution levels increase, and, given that depends on d/d and penetration depths depends on and . Both figure 15a and b show breaks in behavior near 0.01, the substitution level at which emerges from below .
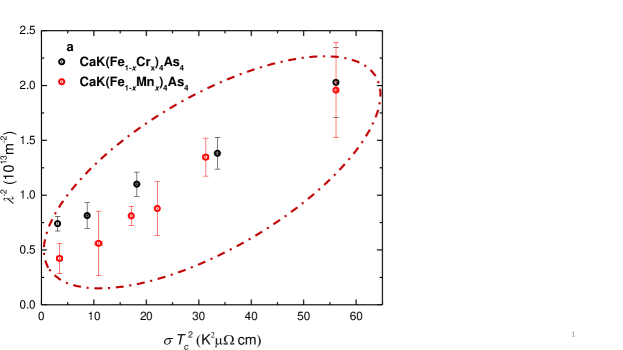
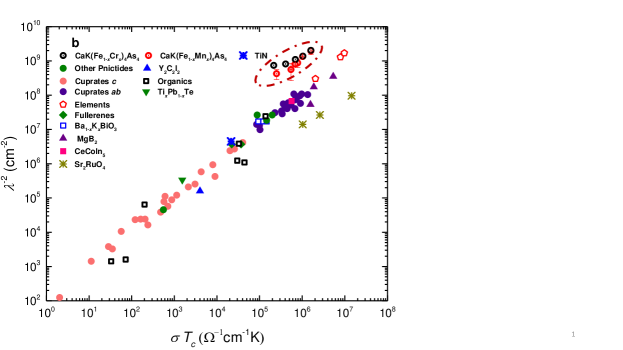
Figure 16a shows versus in Cr and Mn substitution of CaKFe4As4, where is normal state conductivity which was measured just before (Resistivity plot is shown in appendix figure 20). Whereas the CaK(Fe1-xMnx)4As4 data roughly follow the behavior associated with the Homes type scaling in the presence of pair breaking [46, 47, 48]. The CaK(Fe1-xCrx)4As4 data also follows the Homes scaling with slightly different slope. Figure 16b shows the Homes’ scaling of superconductors on a log-log scale [46]. Other pnictides are: Ba(Fe0.92Co0.08)4As4 and Ba(Fe0.95Ni0.05)4As4. Cuprates are YBa2Cu3O6+y. On this log-log scale, both the CaK(Fe1-xCrx)4As4 and CaK(Fe1-xCrx)4As4 data sets agree rather well with other data, although being shifted up somewhat. It should be noted that the other data were determined from optical measurements [46] and differences in criteria as well as measurement techniques may be responsible for the offset.
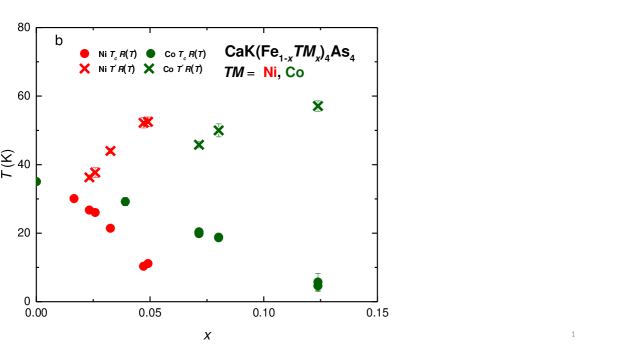
The - phase diagrams of = Co and Ni substitutions in CaK(Fe1-xx)4As4 scaled almost exactly as a function of band filling change (i.e. when each Ni atom brings two extra electrons and each Co atom brings only one extra electron) [16, 21]. This led to the conclusion that for electron doping of CaKFe4As4 the number of electrons added was the control parameter for both the stabilization of magnetic ordering as well as for the suppression of superconductivity. This scaling did not seem to work for the case of Mn substitution [19], but with only one "hole-like" transition metal substitution, it was hard to make clear conclusions.
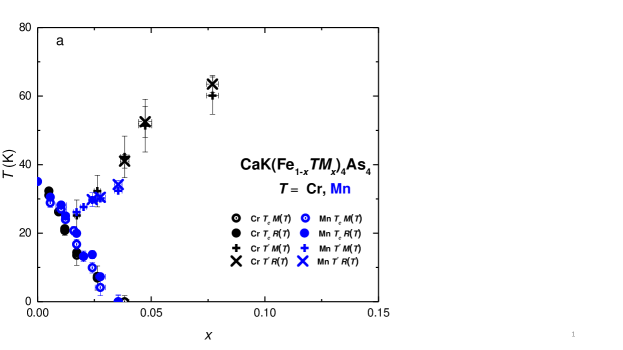
When Cr is substituted into CaKFe4As4, though, there is a qualitatively similar suppression of superconductivity as well as the stabilization of magnetic order, as was found for = Mn, Co and Ni. However there is a clear and important difference on a quantitative level, as shown in figure 17a. The - phase diagram of CaK(Fe1-xCrx)4As4 is essentially identical to that of CaK(Fe1-xMnx)4As4. This is very different behavior from, figure 17b, that seen for electron doped 1144 where electron count seemed to be the key variable.
In figure 17c the CaK(Fe)4As4 phase diagrams for = Cr, Mn, Co and Ni are plotted on the same and e- axes. Comparison of figures 17a, b and c reveal a clear and striking difference between the hole and electron doped CaK(Fe)4As4 systems. Whereas for the electron doped ( = Co, Ni) there is very clear scaling with number of added electrons, for hole doped ( = Mn, Cr) there is clear scaling with the number of substituted atoms, . These striking differences in the phase diagrams beg the question of what is different between the two types of substitution. When there was only data on Mn substitution to compare with the Co and Ni substitutions, one possible explanation could be based on an asymmetric density of electronic states on either side of F. Given that the Cr- and Mn- substituted phase diagrams scale with rather than , this is no longer a possibility.
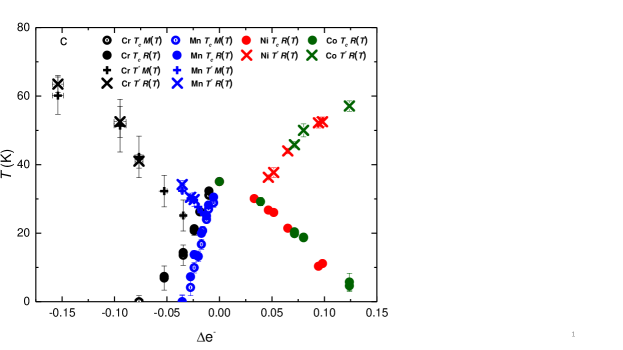
A different approach to these data is to note that there is one other clear difference between the Mn and Cr substitutions as compared to the Co and Ni ones. Mn and Cr clearly bring local-moment-like behavior as manifest by their conspicuous, high temperature, Curie tails that grow with increasing . This is absent for the Co and Ni substitutions. The effective moments coming from the Mn and Cr Curie tails ( 5 [19] and 4 respectively) are consistent with Mn3+ and Cr3+ valencies. The Cr and Mn appear to behave like local moment impurities. As such it is not surprising that they lead to a stronger suppression of (via Abrikosov - Gor’kov pair breaking [49]). In a similar manner, it is not surprising that the addition of relatively large, local moment impurities to an itinerant, relatively small moment system helps to stabilize magnetic order. Given that the size of the local moments are similar, it is not surprising that we find that the - phase diagrams scale well. The fact that CaKFe4As4 manifests rather bi-modal responses to substitution for = Co and Ni versus = Mn and Cr is consistent with the growing understanding of many of the Fe-based superconductors[13, 50] families as manifesting properties in between those of a wide band metal (which would support rigid band shifting) and a more ionic- or Zintl-like compound (that would support valence-counting-like behavior).
In summary, we have been able to grow and study the CaK(Fe1-xCrx)4As4 system. Based on magnetic and transport measurements, we assemble a - phase diagram that clearly shows the suppression of the superconducting with the addition of Cr, with dropping from 35 K for = 0 to zero for 0.03, as well as the stabilization of magnetic order for > 0.012, with 22 K 60 K. As becomes greater than 0.012 and becomes less than , a clear change in the behavior of ()/ and the associated superconducting coherence length, , can be seen. These are associated with the probable changes in the Fermi surface that accompany the AFM ordering at . Comparable features in or the London penetration depth are not clearly resolvable.
The - phase diagram for CaK(Fe1-xCrx)4As4 is qualitatively identical to CaK(Fe1-xMnx)4As4 phase diagram due to the effect of local moment of Cr and Mn. Similarity of phase diagrams also indicate importance of the local moment impurity on hole doped 1144, which is different from the electron doped 1144. On the other hand, both hole and electron doping in 1144 stabilize antiferromagnetic ordering with increasing substitution level and the suppression of in CaK(Fe1-xCrx)4As4 is faster than Ni- and Co-1144.
Acknowledgements.
We thank B. Kuthanazhi for useful discussions. Work at the Ames National Laboratory was supported by the U.S. Department of Energy, Office of Science, Basic Energy Sciences, Materials Sciences and Engineering Division. The Ames National Laboratory is operated for the U.S. Department of Energy by Iowa State University under Contract No. DE-AC02-07CH11358.[References]
- Kamihara et al. [2008] Y. Kamihara, T. Watanabe, M. Hirano, and H. Hosono, Journal of the American Chemical Society 130, 3296 (2008).
- Johnston [2010] D. C. Johnston, Advances in Physics 59, 803 (2010).
- Paglione and Greene [2010] J. Paglione and R. L. Greene, Nature Physics 6, 645 (2010).
- Hosono and Kuroki [2015] H. Hosono and K. Kuroki, Physica C: Superconductivity and its Applications 514, 399 (2015).
- Iyo et al. [2016] A. Iyo, K. Kawashima, T. Kinjo, T. Nishio, S. Ishida, H. Fujihisa, Y. Gotoh, K. Kihou, H. Eisaki, and Y. Yoshida, Journal of the American Chemical Society 138, 3410 (2016).
- Meier et al. [2016] W. R. Meier, T. Kong, U. S. Kaluarachchi, V. Taufour, N. H. Jo, G. Drachuck, A. E. Böhmer, S. M. Saunders, A. Sapkota, A. Kreyssig, et al., Physical Review B 94, 064501(R) (2016).
- Meier et al. [2017] W. R. Meier, T. Kong, S. L. Bud’ko, and P. C. Canfield, Physical Review Materials 1, 013401 (2017).
- Hsu et al. [2008] F.-C. Hsu, J.-Y. Luo, K.-W. Yeh, T.-K. Chen, T.-W. Huang, P. M. Wu, Y.-C. Lee, Y.-L. Huang, Y.-Y. Chu, D.-C. Yan, et al., Proceedings of the National Academy of Sciences 105, 14262 (2008).
- Kawashima et al. [2016] K. Kawashima, T. Kinjo, T. Nishio, S. Ishida, H. Fujihisa, Y. Gotoh, K. Kihou, H. Eisaki, Y. Yoshida, and A. Iyo, Journal of the Physical Society of Japan 85, 64710 (2016).
- Bao et al. [2018] J.-K. Bao, K. Willa, M. P. Smylie, H. Chen, U. Welp, D. Y. Chung, and M. G. Kanatzidis, Crystal Growth & Design 18, 3517 (2018).
- Canfield et al. [2009] P. C. Canfield, S. L. Bud’ko, N. Ni, J. Q. Yan, and A. Kracher, Physical Review B 80, 060501(R) (2009).
- Ni et al. [2009] N. Ni, A. Thaler, A. Kracher, J. Q. Yan, S. L. Bud’ko, and P. C. Canfield, Physical Review B 80, 024511(R) (2009).
- Ni et al. [2010] N. Ni, A. Thaler, J. Q. Yan, A. Kracher, E. Colombier, S. L. Bud’ko, P. C. Canfield, and S. T. Hannahs, Physical Review B 82, 024519(R) (2010).
- Canfield and Bud’ko [2010] P. C. Canfield and S. L. Bud’ko, Annual Review of Condensed Matter Physics 1, 27 (2010).
- Stewart [2011] G. R. Stewart, Reviews of Modern Physics 83, 1589 (2011).
- Meier et al. [2018] W. R. Meier, Q.-P. Ding, A. Kreyssig, S. L. Bud’ko, A. Sapkota, K. Kothapalli, V. Borisov, R. Valentí, C. D. Batista, P. P. Orth, et al., npj Quantum Materials 3, 5 (2018).
- Böhmer and Kreisel [2018] A. E. Böhmer and A. Kreisel, Journal of Physics: Condensed Matter 30, 23001 (2018).
- Gati et al. [2020] E. Gati, L. Xiang, S. L. Bud’ko, and P. C. Canfield, Annalen der Physik 532, 2000248 (2020).
- Xu et al. [2022] M. Xu, J. Schmidt, E. Gati, L. Xiang, W. R. Meier, V. G. Kogan, S. L. Bud’ko, and P. C. Canfield, Physical Review B 105, 214526 (2022).
- Mazin [2010] I. I. Mazin, Nature 464, 183 (2010).
- Meier [2018] W. Meier, Thesis (2018), URL https://lib.dr.iastate.edu/etd/16856/.
- Canfield [2020] P. C. Canfield, Reports on Progress in Physics 83, 16501 (2020).
- Canfield et al. [2016] P. C. Canfield, T. Kong, U. S. Kaluarachchi, and N. H. Jo, Philosophical Magazine 96, 84 (2016).
- Jesche et al. [2016] A. Jesche, M. Fix, A. Kreyssig, W. R. Meier, and P. C. Canfield, Philosophical Magazine 96, 2115 (2016).
- Newbury and Ritchie [2014] D. E. Newbury and N. W. M. Ritchie, in Scanning Microscopies 2014, edited by M. T. Postek, D. E. Newbury, S. F. Platek, and T. K. Maugel (2014), vol. 9236, p. 92360H.
- Prozorov and Kogan [2018] R. Prozorov and V. G. Kogan, Physical Review Applied 10, 014030 (2018).
- Tanatar et al. [2010a] M. A. Tanatar, N. Ni, S. L. Bud’ko, P. C. Canfield, and R. Prozorov, Superconductor Science and Technology 23, 054002 (2010a).
- Tanatar et al. [2013] M. Tanatar, R. Prozorov, N. Ni, S. L. Bud’ko, and P. C. Canfield, U.S. Patent (2013), URL https://patents.google.com/patent/US8450246B2.
- Tanatar et al. [2009a] M. A. Tanatar, N. Ni, C. Martin, R. T. Gordon, H. Kim, V. G. Kogan, G. D. Samolyuk, S. L. Bud’ko, P. C. Canfield, and R. Prozorov, Physical Review B 79, 094507 (2009a).
- Tanatar et al. [2009b] M. A. Tanatar, N. Ni, G. D. Samolyuk, S. L. Bud’ko, P. C. Canfield, and R. Prozorov, Physical Review B 79, 134528 (2009b).
- Tanatar et al. [2010b] M. A. Tanatar, N. Ni, A. Thaler, S. L. Bud’ko, P. C. Canfield, and R. Prozorov, Physical Review B 82, 134528 (2010b).
- Wilde et al. [2023] J. M. Wilde, A. Sapkota, Q. P. Ding, M. Xu, W. Tian, S. L. Bud’ko, Y. Furukawa, A. Kreyssig, and P. C. Canfield (2023), eprint 2301.06336.
- Fisher [1962a] M. E. Fisher, Philosophical Magazine 7, 1731 (1962a).
- Bud’ko et al. [2018] S. L. Bud’ko, V. G. Kogan, R. Prozorov, W. R. Meier, M. Xu, and P. C. Canfield, Physical Review B 98, 144520(R) (2018).
- Fisher [1962b] M. E. Fisher, Philosophical Magazine 7, 1731 (1962b).
- Murphy et al. [2013] J. Murphy, M. A. Tanatar, D. Graf, J. S. Brooks, S. L. Bud’ko, P. C. Canfield, V. G. Kogan, and R. Prozorov, Physical Review B 87, 094505(R) (2013).
- Kogan et al. [2019] V. G. Kogan, R. Prozorov, and A. E. Koshelev, Physical Review B 100, 014518(R) (2019).
- Xiang et al. [2018] L. Xiang, W. R. Meier, M. Xu, U. S. Kaluarachchi, S. L. Bud’ko, and P. C. Canfield, Physical Review B 97, 174517(R) (2018).
- Kaluarachchi et al. [2016] U. S. Kaluarachchi, V. Taufour, A. E. Böhmer, M. A. Tanatar, S. L. Bud’ko, V. G. Kogan, R. Prozorov, and P. C. Canfield, Physical Review B 93, 064503(R) (2016).
- Xiang et al. [2017] L. Xiang, U. S. Kaluarachchi, A. E. Böhmer, V. Taufour, M. A. Tanatar, R. Prozorov, S. L. Bud’ko, and P. C. Canfield, Physical Review B 96, 024511 (2017).
- Taufour et al. [2014] V. Taufour, N. Foroozani, M. A. Tanatar, J. Lim, U. Kaluarachchi, S. K. Kim, Y. Liu, T. A. Lograsso, V. G. Kogan, R. Prozorov, et al., Physical Review B 89, 220509(R) (2014).
- Kogan and Prozorov [2013] V. G. Kogan and R. Prozorov, Physical Review B 88, 024503(R) (2013).
- Hu [1972] C.-R. Hu, Physical Review B 6, 1756 (1972).
- Song et al. [2011] Y. J. Song, J. S. Ghim, J. H. Yoon, K. J. Lee, M. H. Jung, H.-S. Ji, J. H. Shim, Y. Bang, and Y. S. Kwon, EPL (Europhysics Letters) 94, 57008 (2011), eprint 1007.4906.
- Blatter et al. [1994] G. Blatter, M. V. Feigel’man, V. B. Geshkenbein, A. I. Larkin, and V. M. Vinokur, Reviews of Modern Physics 66, 1125 (1994).
- Dordevic et al. [2013] S. V. Dordevic, D. N. Basov, and C. C. Homes, Scientific Reports 3, 1713 (2013).
- Kogan [2013] V. G. Kogan, Physical Review B 87, 220507(R) (2013).
- Kogan et al. [2013] V. G. Kogan, R. Prozorov, and V. Mishra, Physical Review B 88, 224508(R) (2013).
- A. A. Abrikosov and L. P. Gor’kov [1961] A. A. Abrikosov and L. P. Gor’kov, Sov. Phys. JETP 12, 1243 (1961).
- Thaler [2012] A. N. Thaler, Ph.D. thesis, Iowa State University, Digital Repository, Ames (2012), URL https://lib.dr.iastate.edu/etd/12970/.
- Tomioka et al. [1993] Y. Tomioka, M. Naito, and K. Kitazawa, Physica C: Superconductivity 215, 297 (1993).
VII Appendix
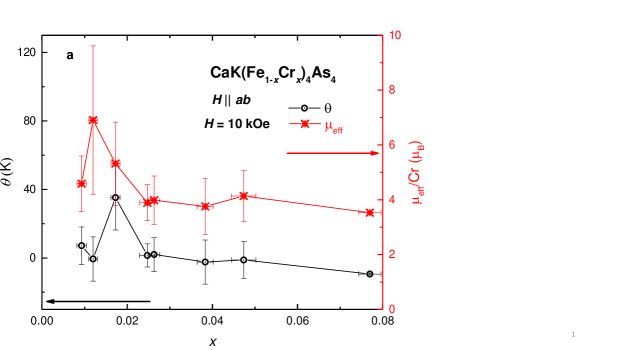
The magnetization plots shown in figure 4 have the appearance of Curie-Weiss tails potentially associated with the Cr-substitution. We fit the magnetization difference () between CaK(Fe1-xCrx)4As4 and CaKFe4As4 single crystals as a function of temperature from 20 K above to 250 K with a field of 10 kOe applied parallel to the crystallographic ab plane by a C/(+) + function assuming that tail behavior is only due to Cr. Figure 18 shows the result of fitting. The value of is around 4 . The fitting results comes from at least 4 different samples () measurements. The values of , and become more stable after = 0.17. Instability for small substitution levels may come from difficulty of fitting small tail-like contribution and when = 0.005, there is no clear tail shown.
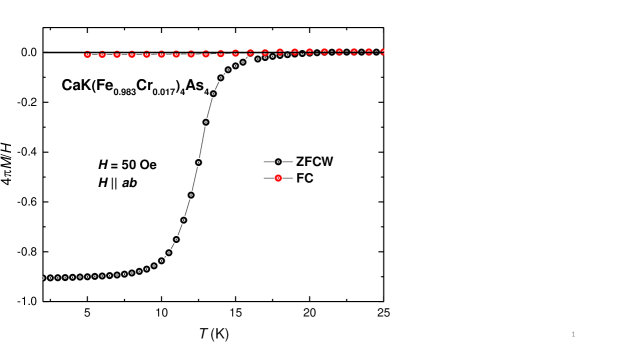
Figure 19 shows Zero-field-cooled-warming (ZFCW) and Field-cooled-warming (FC) low temperature magnetization as a function of temperature for CaK(Fe0.983Cr0.017)4As4 single crystals with a field of 50 Oe applied parallel to ab plane. The large difference between ZFCW and FCW is consistent with the large pinning found even in pure CaKFe4As4[51].
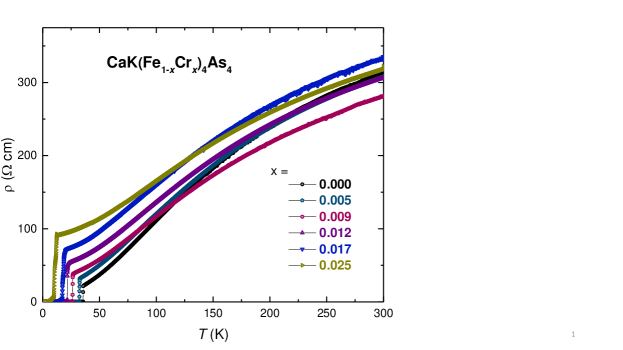
Figure 20 shows temperature dependence of resistivity, , of CaK(Fe1-xCrx)4As4 single crystals with < 0.38. Thickness is estimated by the density of pure CaKFe4As4, the mass and area of plate-like samples. The superconducting transition temperature is suppressed and resistivity before is increased by increasing substitution. Given the inevitably large geometric errors associated with the precised determination of length between voltage contacts as well as the sample thickness we consider the uncertainty in our resistivity values to be on the order of 20 and, as such we plot the data as R(T)/R(300 K) in the main text.
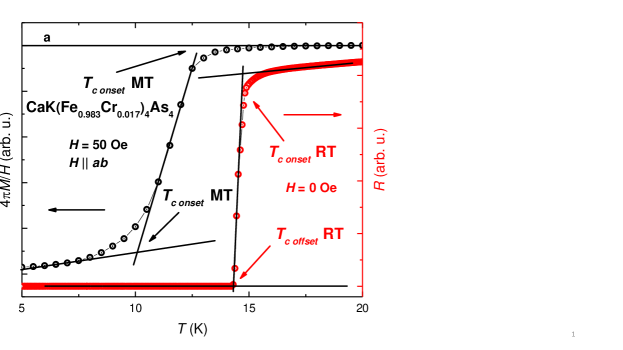
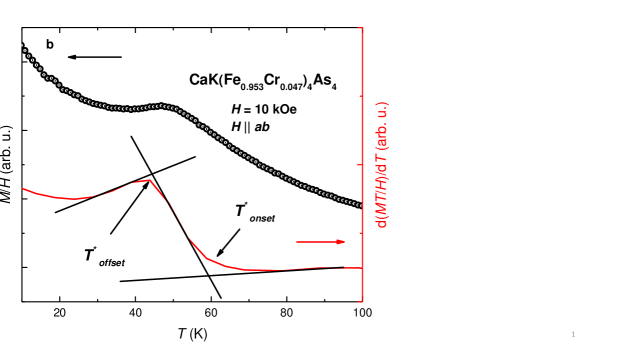
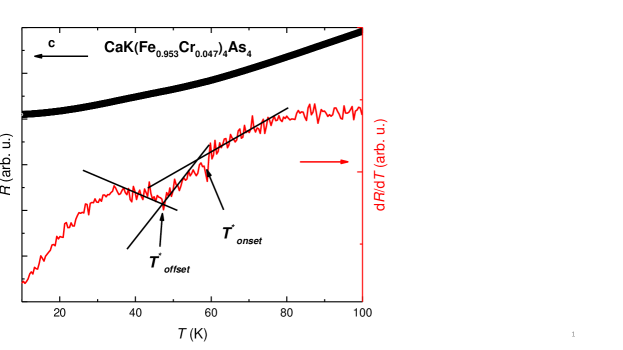
Criteria for inferring and are shown in figure 21. For (figure 21a) we use an onset criterion for M(T) data and an offset criterion for R(T) data. As is often the case, these criteria agree well, especially in the low field limit. The error bar of is determined by the half of difference between onset and offset. Since according to the [33], d()/d, d()/dT behave like which gives transition temperature between onset and offset points, we use average of onset and offset value of d()/d and d()/dT as . For , although the feature is much clearer for Cr substitution than it was for Mn, Ni or Co substitutions [16, 19], the features in M(T) and R(T) are still somewhat subtle in low substitution level. We infer as the average of onset and offset value and use the half of the difference between onset and offset as the error.
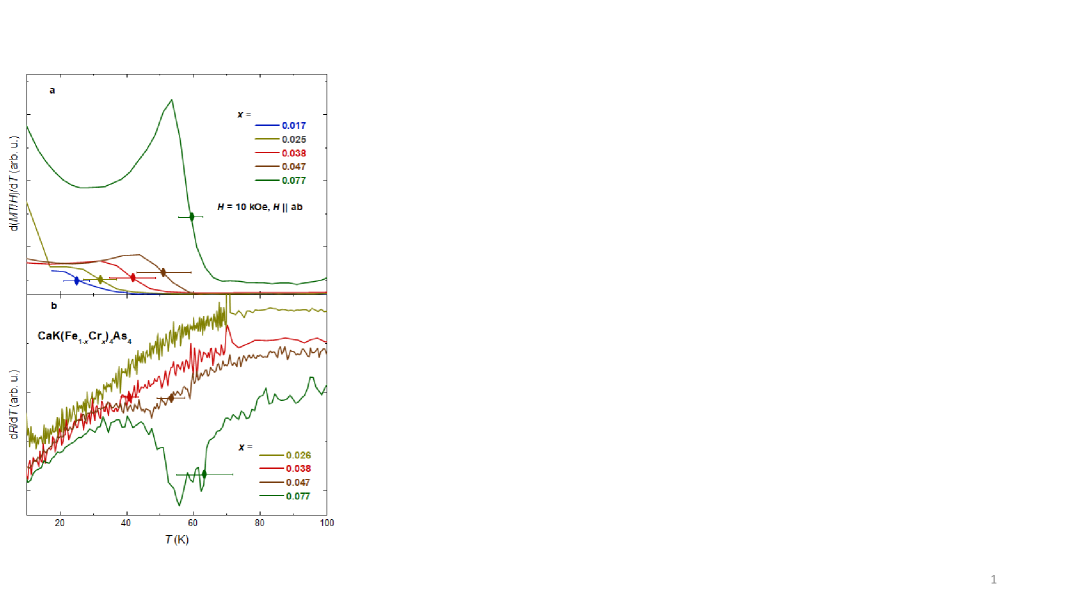
dR(T)/dT and dM(T)/dT data for several different x-values are shown in figure 22, showing good agreement between the position of the features.