9 February 2023
Atlas of photometric and spectroscopic daily monitoring
of the very slow
Nova Cas 2021 (=V1405 Cas) during the first 660 days of its outburst
P. Valisa1, U. Munari2, S. Dallaporta1, A. Maitan1, and A. Vagnozzi1
1: ANS Collaboration, c/o Astronomical Observatory, 36012 Asiago, Italy
2: INAF Astronomical Observatory of Padova, 36012 Asiago, Italy
Abstract. Nova Cas 2021 erupted on 18 March 2021, reaching naked-eye brightness when passing through photometric maximum 53 days later. The fact that the nova has been declining very slowly and it is circumpolar from our observing locations, allowed us to monitor its evolution at daily temporal cadence and without seasonal gaps, covering the first 660 days since discovery. In all we obtained 574 highly accurate photometric runs simultaneously in the bands, which were distributed over 313 different nights, and 110 Echelle high-resolution, high S/N spectra were recorded over 107 individual nights.
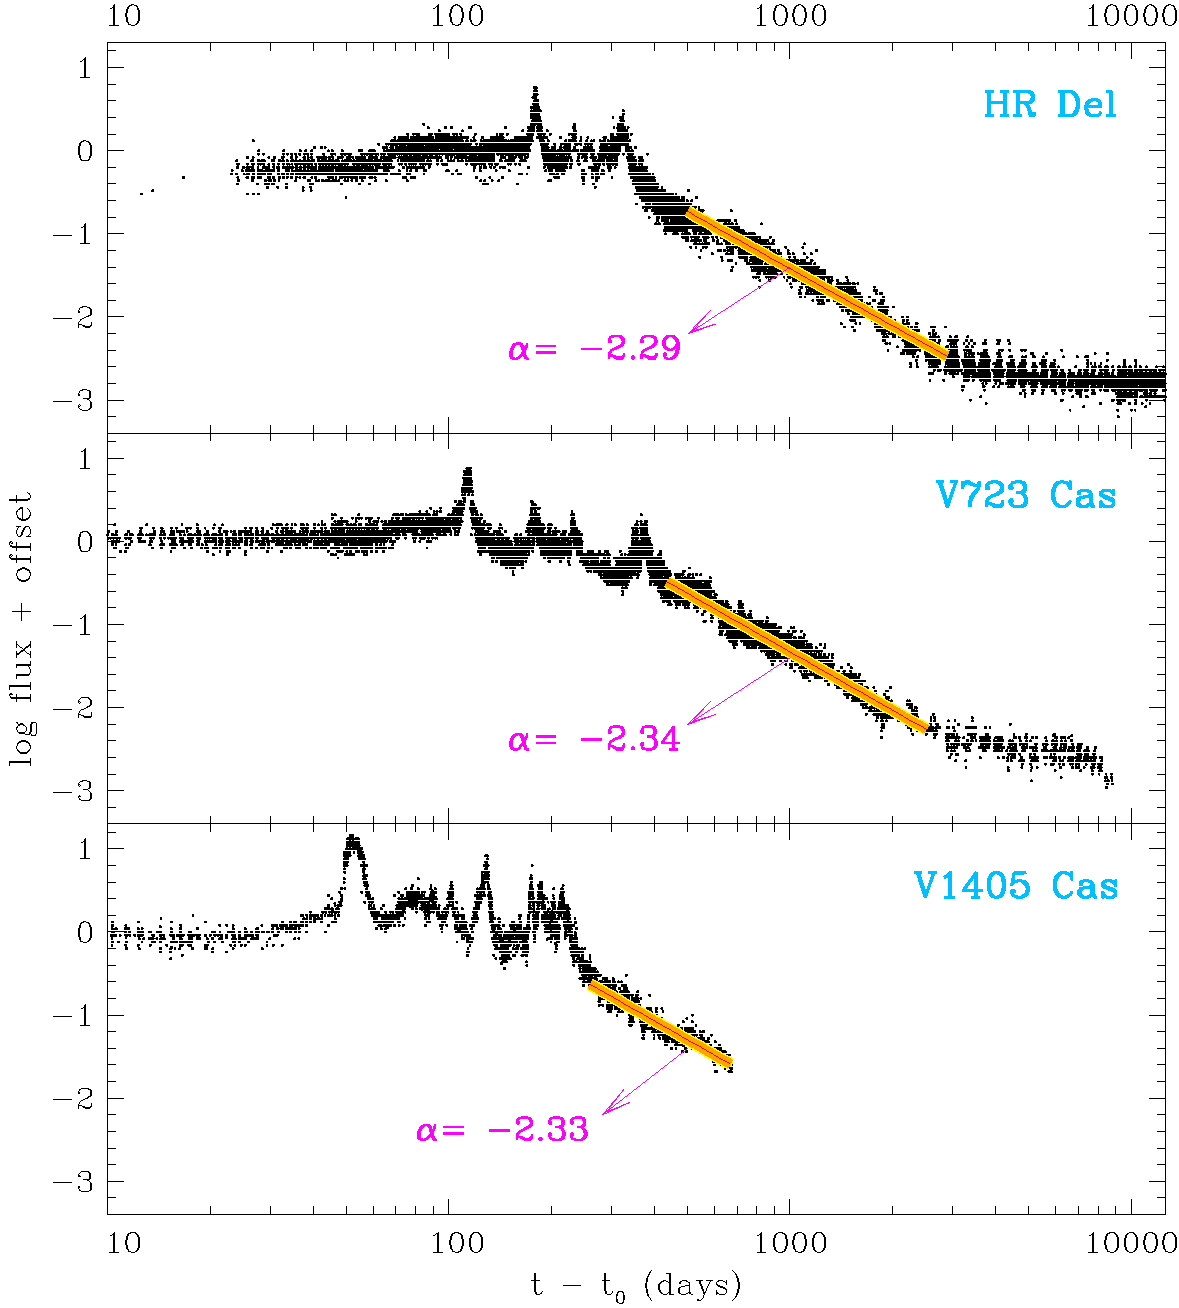
The multi-band photometric evolution is mapped in detail, and the strict similarities to the proto-type very-slow novae HR Del and V723 Cas are discussed. In addition to an initial extended plateau, lasting for several months, all three novae displayed multiple and short-lasting superimposed maxima, the first being invariably the brightest, and the last the widest and leading directly into the decline and the nebular phase, which progressed along an increasing ionization degree up to the appearance of coronal lines years past maximum. The decline proceeded quite smoothly for all three novae, with an identical exponential decline of the -band flux: , with =2.33, 2.34, and 2.29 for Nova Cas 2021, V723 Cas, and HR Del, respectively. At the current decline rate, Nova Cas 2021 will return to within 10% of the pre-outburst brightness level only by the spring of 2029.
Nova Cas 2021 belongs to the spectroscopic FeII-class, with continuous changes of line intensity and profiles in response to the reckless photometric activity during the plateau, which lasted for the initial seven months following the nova discovery. The immense amount of information stored in our high-resolution Echelle spectra covering the whole optical range up to OI 8446 and the CaI triplet, suggested us to develop 2D-dynamic presentations of the most sensitive spectral ranges, to highlight the temporal evolution of the multi-component P-Cyg profiles, the intensity and profile of the many emission lines, and the ionization/excitation response to the photometric changes.
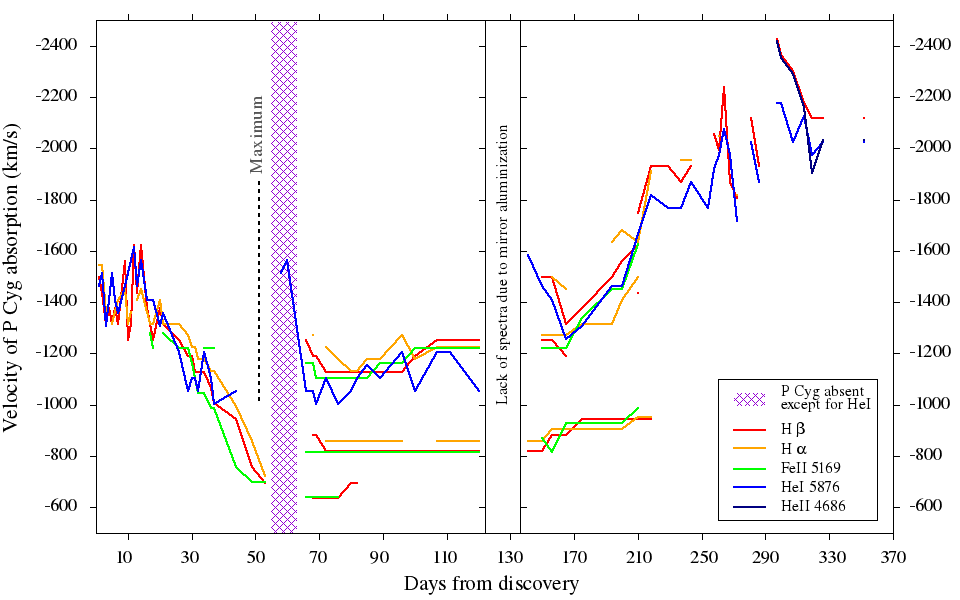
P-Cyg absorptions decelerated (from 1500 to 800 km/s) during the initial 53-days leading up to the primary maximum, remained stable although multi-component during the main part of the plateau phase (days +65 to +140), and then progressively accelerated up to 2200 km/s during early decline from plateau, finally disappearing completely by day +330. Upon leaving the plateau, nebular lines appeared and the ionization degree quickly increased, passing from FeII/Balmer/HeI through HeII/Bowen and then to [CaV]/[NeV]/[FeVII]. At day +662 [FeX] has not yet appeared, but this could happen soon considering the continuing growth in intensity of [FeVII], which on day +662 is second in intensity only to [NeV] and H.
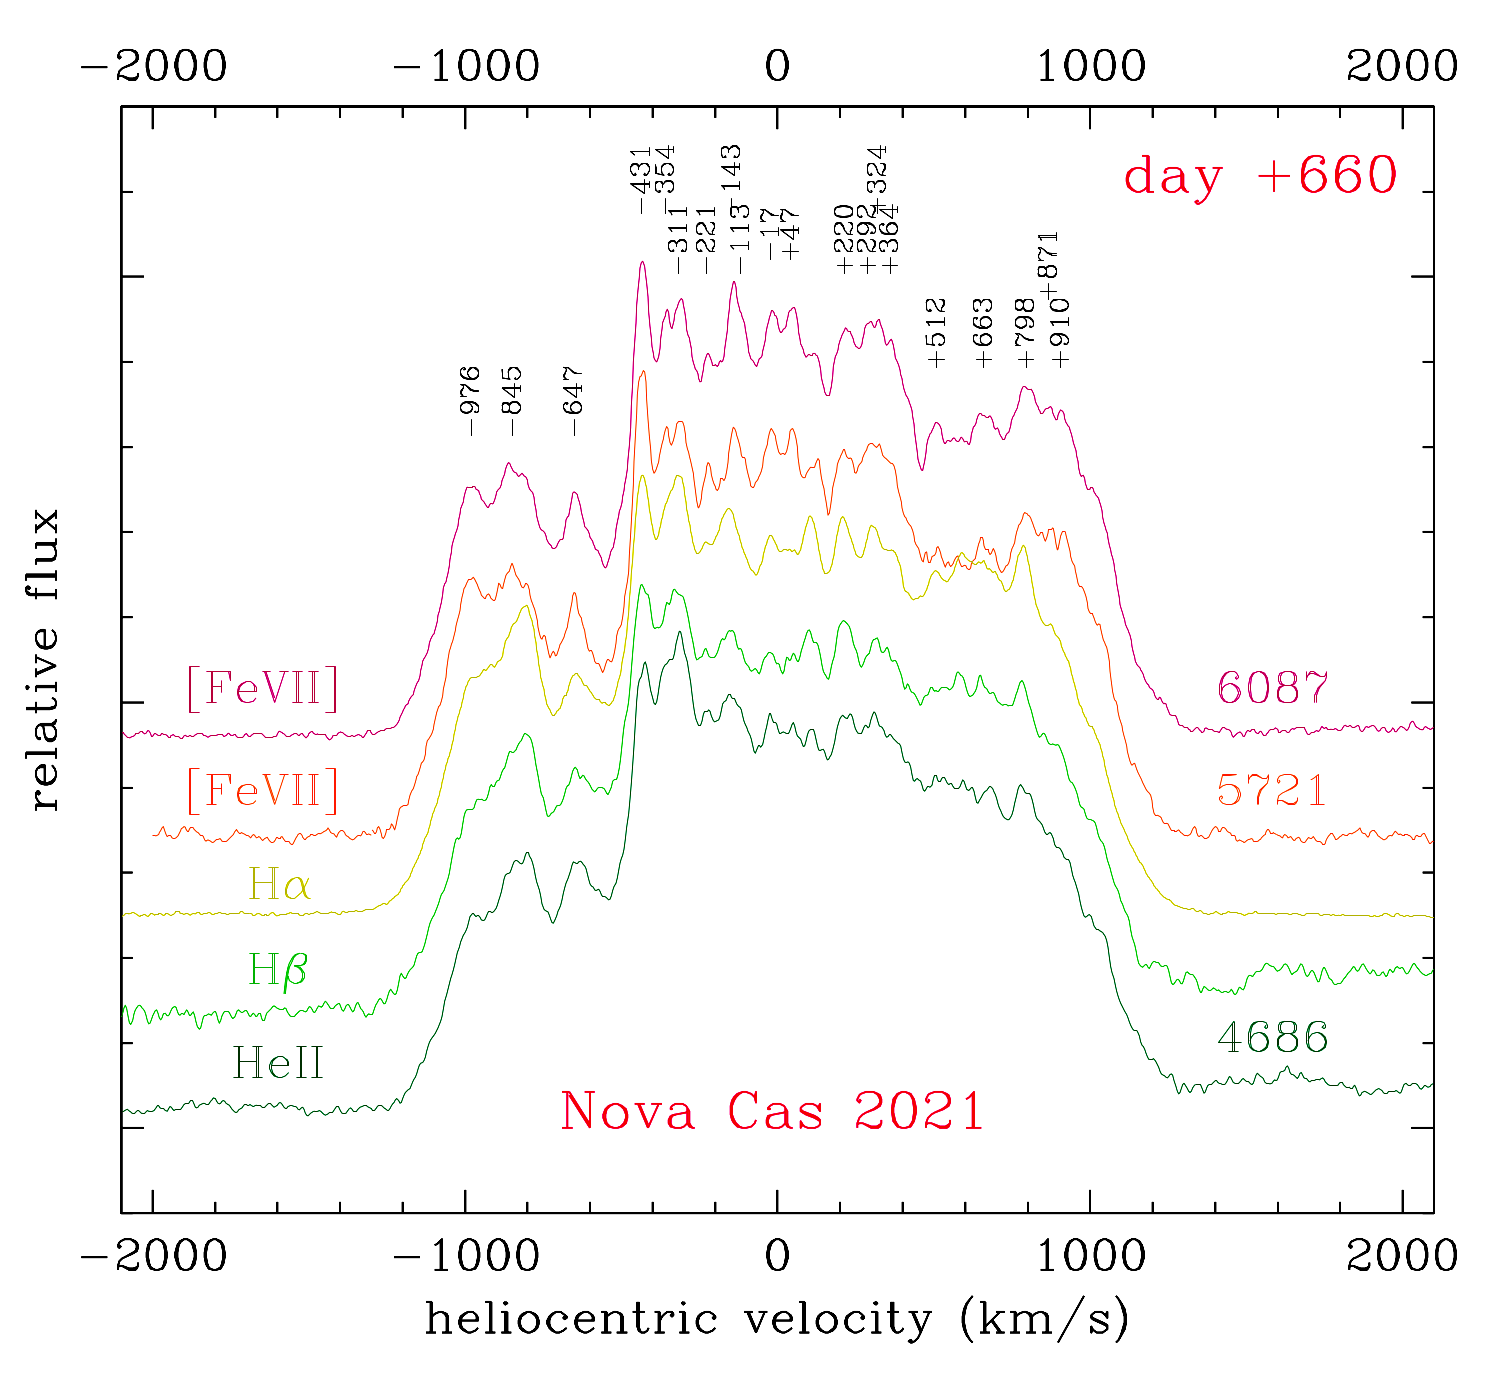
Prior to primary maximum, the emission lines were characterized by a slim Voigt profile, afterward their width flared-up with a reckless variability at all velocity scales in response to the ever changing brightness of the nova during the plateau and the secondary maxima. After about day +550, the profiles stopped to evolve, freezing their configuration best described as a trapezoidal pedestal, 2620 km/s wide at the base and 1930 km/s at the top, with superimposed a central core 930 km/s wide at the base and 800 km/s at the top (values for [FeVII] on day +662). At later epochs, the profiles of all emission lines turned densely castellated: no change larger than 1 km/s has been measured for any dent presented by [FeVII] during the last recorded 110 days.
The passage at photometric maximum on day +53 changed irreversibly the structure of emission lines: with the return to plateau brightness of the nova on day +62, all lines became much wider, developing a broad pedestal and a superimposed wide central core, indicative of separated and fast velocity outflows. It is catching that this happened simultaneous with the detection of shock-induced -rays from Nova Cas 2021, which lasted for five days until day +66.
1 Introduction
Nova Cas 2021 (= V1405 Cas; NCas21 for short) was discovered at unfiltered 9.6mag on 2021 March 18.424 UT by Yuji Nakamura (Japan) on CCD frames taken through a 135mm/F4.0 lens, and was logged by CBAT as transient PNV J23244760+6111140. The object was soon classified as a classical nova by Maehara et al. (2021) based on an optical spectrum obtained within a few hours of discovery on March 18.820 UT.
Preliminary reports on the photometric and spectroscopic appearance of NCas21 at optical and IR wavelengths during the 7-months long plateau around maximum brightness were issued by Taguchi et al. (2021a,b), Munari et al. (2021a,b), Gehrz et al. (2021), Rudy et al. (2021), Shore et al. (2021a,b), and Woodward et al. (2021), with Munari et al. (2021c) finally reporting in early December 2021 the start of the photometric decline and the simultaneous turn toward high ionization conditions of the optical spectra. The latter prompted new Swift observations by Page et al. (2021) that revealed the emergence of a faint super-soft emission component at X-rays, which was absent in earlier NuSTAR and Swift observations that detected only weak and much harder X-rays from NCas21 (Sokolovsky et al. 2021a).
Radio observations of NCas21 with VLA by Sokolovsky et al. (2021b, 2022a) revealed strong emission at the time the nova begun the photometric decline in December 2021, with a spectral index =+1.860.02 indicative of thermal and optically thick emission, as later confirmed by the uGMRT observations of Nayana et al. (2022). The radio emission of the nova was then spatially resolved on VLA observations obtained in July 2022 by Sokolovsky et al. (2022b), in the form of an elliptical edge-brightened shell extending about 220 mas in the north-east to south-west direction crossed by a bright band of emission extending about 120 mas along the minor axis of the shell.
NCas21 has been recently classified among the exceedingly rare class of neon novae by Munari & Valisa (2022), based on the exceptional intensity reached by [NeV] 3346, 3427 Å on their spectra for day +618, by far at that time the strongest emission lines over the whole near-UV/optical range.
In this paper we present a quick overview of the BVRI photometric and Echelle spectroscopic results we gathered during our daily monitoring of NCas21 that covers - with no seasonal gap - the first 660 days of the outburst.
2 BVRI Photometry
2.1 Observations
optical photometry of NCas21 on the Landolt (2009) photometric system has been collected daily by ANS Collaboration, primarily with telescopes ID 0310, 1301, and 2203, all adopting Astrodon photometric filters of a recent generation correcting for the red-leak affecting older -filter versions. In all 574 runs spread over 313 different nights were collected. The fact that all telescopes adopt the same set of filters helps in suppressing the unavoidable scatter of the measurements induced by differences in the actual pass-bands, when dealing with objects characterized by the presence of very strong emission lines in their spectra.
Technical details and operational procedures of the ANS Collaboration network of telescopes running since 2005, are presented by Munari et al. (2012). Detailed analysis of the photometric performances and multi-epoch measurements of the actual transmission profiles for all the photometric filter sets in use at all telescopes is presented by Munari & Moretti (2012), and updated in Munari et al. (2015). The same local photometric sequence, extracted from APASS DR8 (cf. Henden & Munari 2014, Munari et al. 2014) and spanning a wide color range, has been used at all telescopes on all observing epochs, ensuing a high consistency of the data which have been transformed from the local instantaneous to the standard Landolt system via color-equations. All measurements were carried out with aperture photometry, with the radius of the aperture generally about 1.0 FWHM and optimized on each observations so to minimize the dispersion of the comparison sequence around the transformation color relations. Colors and magnitudes are obtained separately during the reduction process, and are not derived one from the other. The total error budget, which quadratically combines the measurement error on the variable with the error associated to the transformation from the local instantaneous to the standard photometric system (as defined by the photometric comparison sequence), are 0.01 mag for all NCas21 observations in all bands.
2.2 Photometric evolution
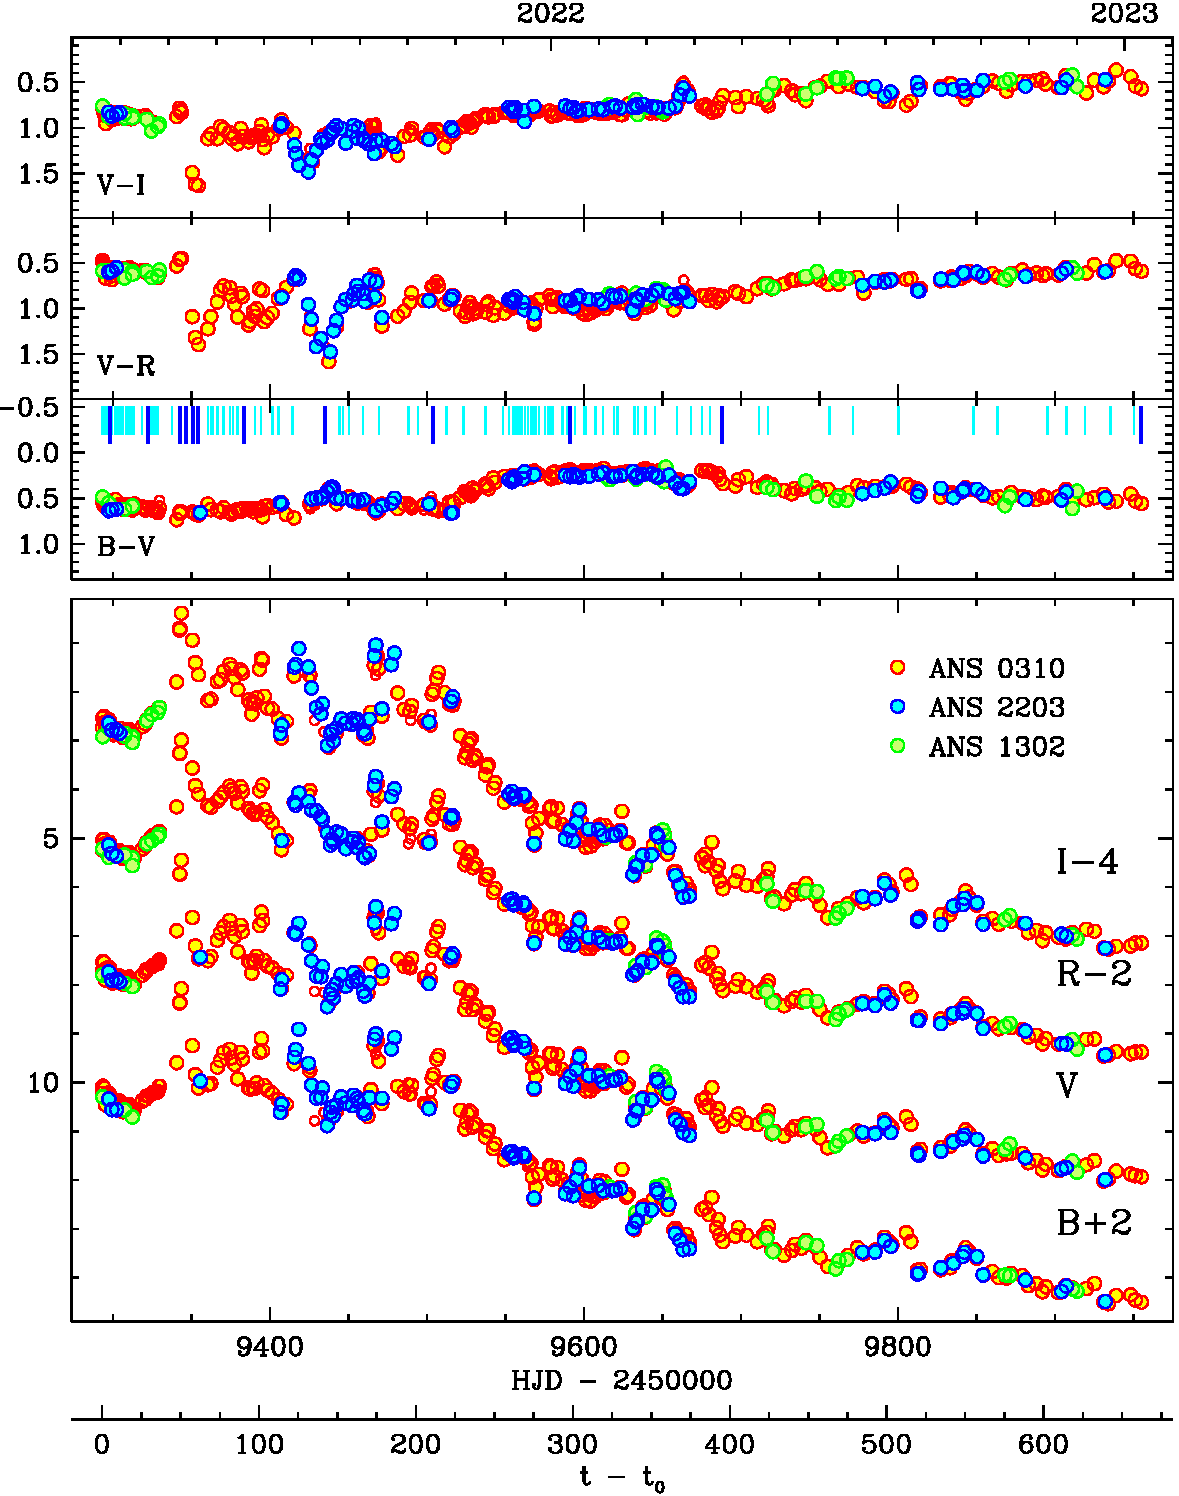
The ANS Collaboration light- and color-curves covering the first 660 days of NCas21 are presented in Figure 1. In this figure and in the rest of this paper, the reference epoch is taken to coincide with the discovery of the nova on:
| (1) |
The nova spent the first 7 months lingering around a bright plateau, characterized by a series of isolated maxima of varied height and width. The epoch, width, and peak brightness of the five main maxima are listed in Table 2. The median values during the 7-months plateau have been:
| (2) |
The end of the plateau is taken to be 5 Nov 2021, day +230, when the nova crossed these median values while declining from the last re-brightening (N.5 in Table 2) and embracing the final, steady decline. The maximum brightness (N.1 in Table 2) occurred on:
| (3) |
and has been characterized by
| (4) |
The MMRD relation (magnitude at maximum vs. rated of decline) is frequently used to estimated the distance to a nova. Its most recent formulation by Selvelli & Gilmozzi (2019), based on Gaia DR2 parallaxes, makes use of as the time the nova takes to decline by 3.0 mag below the peak -band brightness. Unfortunately, a light-curve as complex as that of NCas21, exhibits multiple crossing of the =3.0mag threshold, with different resulting absolute magnitudes and derived distances. These different possible value of for NCas21 are listed in Table 2, which also reports the corresponding absolute magnitude following Selvelli & Gilmozzi (2019), and the distances resulting from adopting the reddening =0.50 derived below in Sect. 3.3.
As noted by Taguchi et al. (2021a), NCas21 is coincident with the astrometric position of the faint and blue variable CzeV3217, characterized by pre-outburst PanSTARRS PS1 mean magnitudes of =15.72, =15.54, =15.50, =15.36, =15.43 and having a photometric period of 0.1883907 days = 4h 31min. The outburst amplitude of mag10.5 is in excellent agreement with the Warner (1995, his Figure 5.4) relation between amplitude and time to decline from maximum, supporting CzeV3217 as the true progenitor of NCas21. Gaia DR3 provides a robust parallax of 0.57760.0254 mas for CzeV3217, corresponding to a distance of 1.73 (range 1.661.81) kpc, which is in reasonable agreement with the distance to NCas21 derived for =90 days in Table 2. At this distance, the ellipsoidal radio structure resolved by Sokolovsky et al. (2022b) with VLA is expanding on the plane of the sky along its major axis at an averaged velocity of:
| (5) |
Table 1: Epoch, width, and peak -band brightness of the five highest maxima displayed by Nova Cas 2021 during the plateau. N. HJD FWHM (-2450000) (days) (days) (mag) 1 9345.9 53.0 6.8 5.35 2 9420.2 127.3 10.5 6.09 3 9467.8 174.8 3.1 6.40 4 9478.8 185.9 5.9 6.55 5 9508.0 215.0 12.3 6.80 Table 2: Epochs past primary maximum (the N.1 in Table 2) when Nova Cas 2021 crossed the =3.0mag threshold below the peak brightness (), and the corresponding and distances. dist (days) (mag) (kpc) 90 6.9 1.4 154 6.4 1.1 180 6.3 1.0 266 5.9 0.85
The evolution of NCas21 during the plateau is markedly different among different optical colors. It has been characterized by a flat behavior in , passing basically unchanged through all the various re-brightening, while and varied in anti-phase by more than one magnitude, and much less for , which points to the band as main culprit for the observed changes in color. When NCas21 left the plateau and begun the steady decline, all colors reacted by changing their trend and smoothing out any short-term variability, a fact that is most evident for in Figure 1.
The post-plateau flux radiated by NCas21 through the -band is reducing exponentially as
| (6) |
At this rate, NCas21 will have declined within 10% of the pre-outburst level by the spring of 2029.
2.3 Periodic and rapid variability during the decline
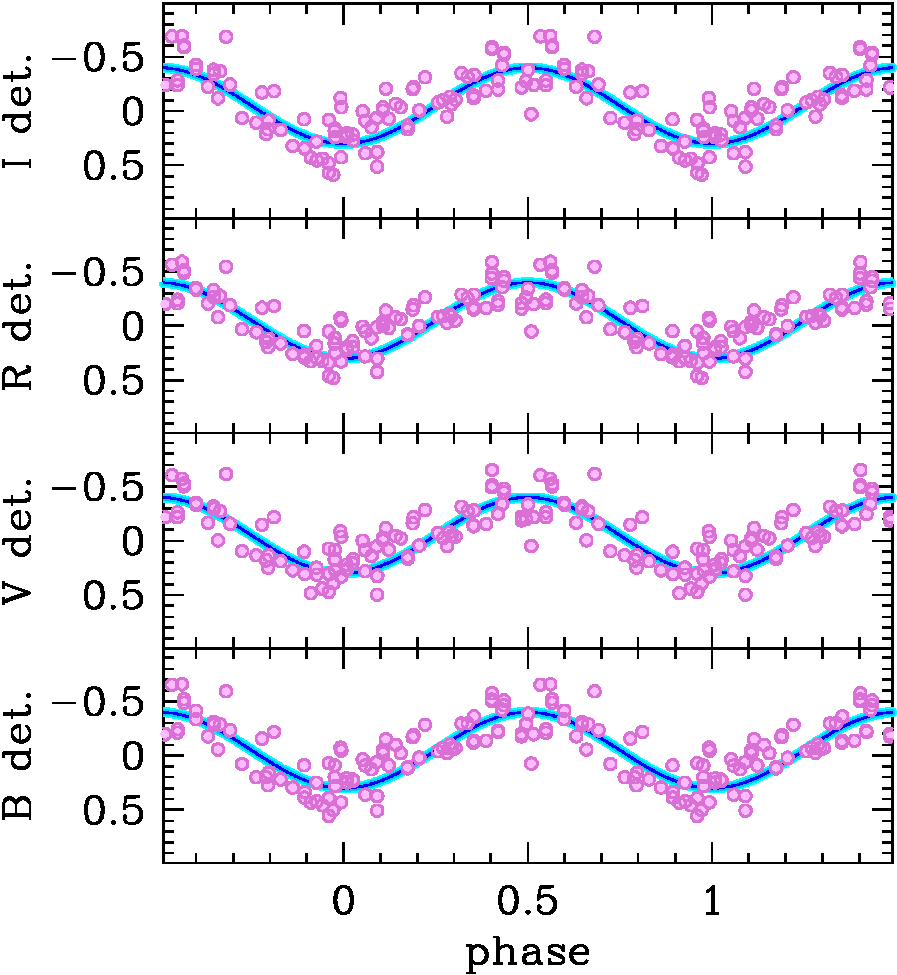
During the otherwise rather smooth exponential decline, NCas21 exhibited a periodic variability lasting a few consecutive cycles between about days +300 and +400, in the form of a sinusoidal wave of 0.7mag total amplitude and the ephemeris for minima given by:
| (7) |
The corresponding phased light-curve of NCas21 is presented in Figure 3, after removing the underlying exponential trend of the decline. All bands behaved rather similarly, and an equivalent plot for the photometric colors confirms that the large amplitude sinusoidal variability was not accompanied by significant changes in the spectral energy distribution of NCas21.
A Fourier analysis of the de-trended photometry of NCas21 during the decline phase does not reveal any significant periodicity in addition to P=30.5 days, the latter being confined to the day +300 to +400 time interval and not present before or after.
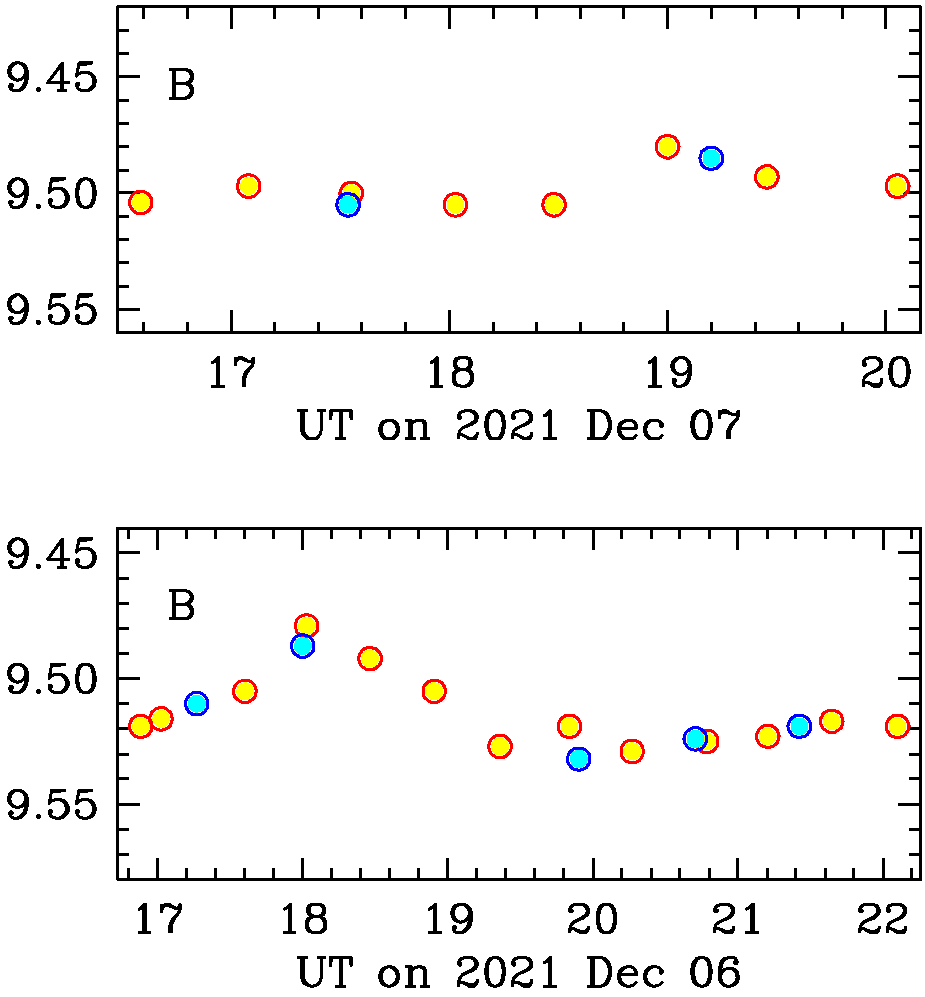
In particular no significant Fourier peak appears associated with the P=0.1883907 days variability exhibited by the progenitor of the nova. There is a lot of intra-night variability, as for ex. plotted in Fig 3 for 2021 Dec 6, but such variability looks rather chaotic. In fact, similar data for the next night looked rather flat.
2.4 Comparison with the prototype very-slow novae HR Del and V723 Cas
The extended plateau at maximum, the several superimposed re-brightening, and the very slow decline exhibited so far by NCas21 are the hallmarks of the prototype slow-novae HR Del (1967) and V723 Cas (1995), which main properties have been discussed - among others - by Rafanelli & Rosino (1978), Bruch (1982), Munari et al. (1996), Harman & O’Brien (2003), Heywood et al. (2005), Iijima (2006), Goranskij et al. (2007), Lyke & Campbell (2009), Schwarz et al. (2011), Ochner et al. (2015), and Chomiuk et al. (2021).
The light-curves of the three novae are compared in Figure 4, a log-log plot between the time since discovery and the flux radiated through the band normalized to the median value during the plateau. To compare the three novae on similar grounds, we selected to plot in Figure 4 the visual estimates collected by the AAVSO observers, the naked eye being the only type of detector and photometric band in common among the three novae.
The similarity of the three light-curves in Figure 4 is striking, especially the identical slope through the decline . All three novae:
-
•
lingered initially for many months around maximum brightness, with persisting low-ionization conditions in their spectra,
-
•
went through various re-brightening during the plateau, the first of them being invariably the brightest one,
-
•
ended their plateau with a final brightening, the one showing the widest FWHM,
-
•
experienced a rapid rise in the ionization degree upon embracing the steady decline from the plateau, with concomitant disappearance of the absorption lines and appearance of nebular [OIII] 5007, which was soon
-
•
followed by appearance of [FeVII] and later by coronal [FeX].
The [FeX] is not yet present in the spectra of NCas21 for day +660, but given () the strict similarity to HR Del and V723 Cas, and () the monotonic increase in flux of [FeVII], we expect [FeX] to appear at some later epoch in NCas21 too.
3 Spectroscopy
3.1 Observations
All the NCas21 spectra considered in this paper are high-resolution ones, obtained with Echelle spectrographs. A log-book of the spectroscopic observations is presented in Table 3. We collected a total of 110 Echelle spectra distributed over 107 individual nights during the time interval going from discovery to day +662 of the outburst of NCas21.
The vast majority of the Echelle spectra here considered have been obtained with the Varese Schiaparelli Observatory 0.84m telescope, which is operated by ANS Collaboration and it is equipped with an Astrolight Inst. mk.III Multi-Mode carbon-fiber spectrograph, that in the Echelle configuration covers the 4250-8900 Å range (see Munari & Valisa (2014) for a description of the optical train and a performance evaluation of early models of these multi-mode spectrographs). Cross-dispersion is achieved with a N-SF11 prism, and the detector is a SBIG ST10XME CCD camera (2192x1472 array, 6.8m pixel, KAF-3200ME chip with micro-lenses to boost the quantum efficiency). The spectral resolution obtained with a R2 79 l/mm grating is 20,000 for a 1-arcsec slit and CCD binning=1, lowering to 15,000 for a 2-arcsec slit, and to 12,000 for CCD binning=2. Only the two reddest orders are affected by limited inter-order gaps (between 8239-8243 Å and 8554-8574 Å).
Additional spectra, particularly when NCas21 turned fainter at later epochs, where collected with the 1.82m telescope + REOSC Echelle spectrograph which is operated in Asiago by INAF (Italian National Institute of Astrophysics). The 3500-7350 Å interval is covered on 32 orders without inter-order gaps by an Andor DW436-BV camera (housing a 2048x2048 array, 13.5 m pixel size, E2V CCD42-40 AIMO model CCD). The resolving power is 22,000 for the standard 1.8-arcsec slit-width.
A few further Echelle spectra were secured with the Stroncone 0.50m telescope operated by ANS Collaboration, which is equipped with an Astrolight Inst. mk.III Multi-Mode spectrograph similar to that used in Varese. The detector is an ASI 1600MM CMOS camera (4656x3520 array, 3.8m pixel, with a Panasonic MN34230 chip used in binning 2 mode).
All observations at all telescopes were conducted with the slit oriented along the parallactic angle, for optimal sky-subtraction and flux-calibration. Data reduction for all telescopes has been performed in IRAF and has included all usual steps for bias, dark, flat, sky subtraction, wavelength calibration, heliocentric correction, and flux calibration. The latter has been achieved via nightly observations of spectrophotometric standards, located on the sky close to NCas21. This allowed to join all Echelle orders into a single 1D-fluxed spectrum covering the whole recorded wavelength range. The zero-point of the each 1D-fluxed spectrum has been checked against the data for the same night as described in sect. 2 above.
| date | HJD | t-t0 | expt | tel. | date | HJD | t-t0 | expt | tel. | |
|---|---|---|---|---|---|---|---|---|---|---|
| (sec) | (sec) | |||||||||
| 2021-03-19 | 2459293.29 | 0.37 | 1800 | 0.84m | 2021-10-16 | 2459504.24 | 211.32 | 3150 | 0.84m | |
| 2021-03-20 | 2459294.28 | 1.35 | 2700 | 0.84m | 2021-10-24 | 2459512.25 | 219.33 | 4500 | 0.84m | |
| 2021-03-21 | 2459295.28 | 2.35 | 2700 | 0.84m | 2021-11-04 | 2459523.38 | 230.46 | 3600 | 0.84m | |
| 2021-03-22 | 2459296.29 | 3.37 | 2700 | 0.84m | 2021-11-12 | 2459351.34 | 238.42 | 2400 | 0.84m | |
| 2021-03-23 | 2459297.41 | 4.49 | 1800 | 0.84m | 2021-11-18 | 2459537.28 | 244.35 | 3600 | 0.84m | |
| 2021-03-24 | 2459298.29 | 5.37 | 2700 | 0.84m | 2021-11-29 | 2459548.35 | 255.43 | 3600 | 0.84m | |
| 2021-03-24 | 2459298.26 | 5.34 | 900 | 1.82m | 2021-12-03 | 2459552.21 | 259.29 | 3600 | 0.84m | |
| 2021-03-25 | 2459299.33 | 6.41 | 3600 | 0.84m | 2021-12-06 | 2459555.21 | 262.29 | 4050 | 0.84m | |
| 2021-03-27 | 2459301.31 | 8.38 | 4800 | 0.84m | 2021-12-07 | 2459556.22 | 263.29 | 4800 | 0.84m | |
| 2021-03-28 | 2459302.31 | 9.38 | 2700 | 0.84m | 2021-12-09 | 2459558.27 | 265.35 | 4800 | 0.84m | |
| 2021-03-29 | 2459303.29 | 10.37 | 1800 | 0.84m | 2021-12-11 | 2459560.14 | 267.32 | 6300 | 0.84m | |
| 2021-03-30 | 2459304.29 | 11.36 | 2700 | 0.84m | 2021-12-13 | 2459562.39 | 269.46 | 3600 | 0.84m | |
| 2021-03-31 | 2459305.29 | 12.36 | 2700 | 0.84m | 2021-12-15 | 2459564.29 | 271.37 | 3600 | 0.84m | |
| 2021-04-01 | 2459306.29 | 13.36 | 2700 | 0.84m | 2021-12-17 | 2459566.26 | 273.34 | 3600 | 0.84m | |
| 2021-04-03 | 2459308.29 | 15.37 | 2700 | 0.84m | 2021-12-18 | 2459567.25 | 274.33 | 600 | 1.82m | |
| 2021-04-04 | 2459309.29 | 16.37 | 2700 | 0.84m | 2021-12-20 | 2459569.22 | 276.30 | 5400 | 0.84m | |
| 2021-04-05 | 2459310.29 | 17.37 | 2700 | 0.84m | 2021-12-22 | 2459571.29 | 278.33 | 600 | 1.82m | |
| 2021-04-07 | 2459312.29 | 19.37 | 2700 | 0.84m | 2021-12-22 | 2459571.35 | 278.39 | 5400 | 0.84m | |
| 2021-04-08 | 2459313.29 | 20.37 | 2700 | 0.84m | 2021-12-26 | 2459575.31 | 282.39 | 5400 | 0.84m | |
| 2021-04-13 | 2459318.31 | 25.39 | 1800 | 0.84m | 2021-12-28 | 2459577.35 | 284.43 | 6300 | 0.84m | |
| 2021-04-17 | 2459321.66 | 26.74 | 900 | 0.84m | 2021-12-30 | 2459579.22 | 286.29 | 4500 | 0.84m | |
| 2021-04-17 | 2459322.30 | 29.38 | 2400 | 0.84m | 2021-12-31 | 2459580.23 | 287.31 | 4500 | 0.84m | |
| 2021-04-18 | 2459323.30 | 30.38 | 2400 | 0.84m | 2022-01-06 | 2459586.24 | 293.31 | 5400 | 0.84m | |
| 2021-04-19 | 2459324.31 | 31.39 | 1500 | 0.84m | 2022-01-09 | 2459589.25 | 296.33 | 5400 | 0.84m | |
| 2021-04-21 | 2459326.32 | 33.40 | 2250 | 0.84m | 2022-01-11 | 2459591.26 | 298.33 | 5400 | 0.84m | |
| 2021-04-22 | 2459327.31 | 34.38 | 2250 | 0.84m | 2022-01-14 | 2459594.26 | 301.33 | 5400 | 0.84m | |
| 2021-04-23 | 2459327.64 | 34.72 | 2250 | 0.84m | 2022-01-20 | 2459600.25 | 307.33 | 5400 | 0.84m | |
| 2021-04-24 | 2459328.31 | 35.38 | 2400 | 0.84m | 2022-01-21 | 2459601.22 | 308.30 | 600 | 1.82m | |
| 2021-05-03 | 2459337.62 | 44.69 | 1500 | 0.84m | 2022-01-27 | 2459607.26 | 314.34 | 5400 | 0.84m | |
| 2021-05-08 | 2459342.58 | 49.66 | 1200 | 0.84m | 2022-02-01 | 2459612.26 | 319.34 | 5400 | 0.84m | |
| 2021-05-12 | 2459346.64 | 53.72 | 1380 | 0.84m | 2022-02-08 | 2459619.29 | 326.36 | 5400 | 0.84m | |
| 2021-05-17 | 2459351.62 | 58.70 | 900 | 0.84m | 2022-02-11 | 2459621.29 | 328.36 | 600 | 1.82m | |
| 2021-05-19 | 2459354.39 | 61.47 | 1500 | 0.84m | 2022-02-21 | 2459632.28 | 339.36 | 5400 | 0.84m | |
| 2021-05-25 | 2459360.36 | 67.43 | 2100 | 0.84m | 2022-02-23 | 2459634.28 | 341.36 | 5400 | 0.84m | |
| 2021-05-27 | 2459362.35 | 69.42 | 2400 | 0.84m | 2022-02-28 | 2459639.28 | 346.36 | 5400 | 0.84m | |
| 2021-05-28 | 2459363.36 | 70.43 | 1500 | 0.84m | 2022-03-06 | 2459645.28 | 352.36 | 5400 | 0.84m | |
| 2021-05-31 | 2459366.38 | 73.46 | 1500 | 0.84m | 2022-03-20 | 2459659.30 | 366.38 | 5400 | 0.84m | |
| 2021-06-04 | 2459370.36 | 77.44 | 2100 | 0.84m | 2022-03-29 | 2459668.32 | 375.39 | 6300 | 0.84m | |
| 2021-06-08 | 2459374.37 | 81.45 | 900 | 0.84m | 2022-04-05 | 2459675.32 | 382.40 | 5400 | 0.84m | |
| 2021-06-10 | 2459376.39 | 83.47 | 900 | 0.84m | 2022-04-10 | 2459680.32 | 387.40 | 4500 | 0.84m | |
| 2021-06-13 | 2459379.38 | 86.46 | 630 | 0.84m | 2022-04-18 | 2459688.33 | 395.41 | 5400 | 0.84m | |
| 2021-06-17 | 2459383.38 | 90.46 | 1200 | 0.84m | 2022-05-11 | 2459711.38 | 418.44 | 2700 | 0.84m | |
| 2021-06-24 | 2459390.44 | 97.51 | 1200 | 0.84m | 2022-05-17 | 2459717.42 | 424.50 | 5400 | 0.84m | |
| 2021-06-28 | 2459394.35 | 101.43 | 1260 | 0.50m | 2022-06-25 | 2459756.40 | 463.48 | 4500 | 0.84m | |
| 2021-07-05 | 2459401.38 | 108.46 | 840 | 0.50m | 2022-07-10 | 2459771.40 | 478.48 | 5400 | 0.84m | |
| 2021-07-09 | 2459405.42 | 113.50 | 900 | 0.50m | 2022-08-08 | 2459800.36 | 507.43 | 5400 | 0.84m | |
| 2021-07-18 | 2459414.38 | 122.46 | 360 | 1.82m | 2022-09-25 | 2459848.34 | 555.42 | 7200 | 0.84m | |
| 2021-08-08 | 2459435.33 | 142.40 | 1200 | 0.84m | 2022-10-10 | 2459863.39 | 570.47 | 900 | 1.82m | |
| 2021-08-17 | 2459444.35 | 151.43 | 900 | 0.84m | 2022-10-28 | 2459866.35 | 588.43 | 6300 | 0.84m | |
| 2021-08-19 | 2459446.39 | 153.47 | 180 | 1.82m | 2022-11-11 | 2459895.37 | 602.45 | 900 | 1.82m | |
| 2021-08-23 | 2459450.35 | 157.43 | 2700 | 0.84m | 2022-11-23 | 2459907.37 | 614.45 | 7200 | 0.84m | |
| 2021-09-01 | 2459459.35 | 166.42 | 3600 | 0.84m | 2022-12-05 | 2459919.33 | 626.41 | 1200 | 1.82m | |
| 2021-09-11 | 2459469.37 | 176.45 | 1800 | 0.84m | 2022-12-21 | 2459935.35 | 642.43 | 6300 | 0.84m | |
| 2021-09-30 | 2459488.27 | 195.34 | 3150 | 0.84m | 2023-01-05 | 2459950.39 | 657.47 | 7200 | 0.84m | |
| 2021-10-06 | 2459494.33 | 201.40 | 3600 | 0.84m | 2023-01-10 | 2459955.40 | 662.50 | 5400 | 1.82m |
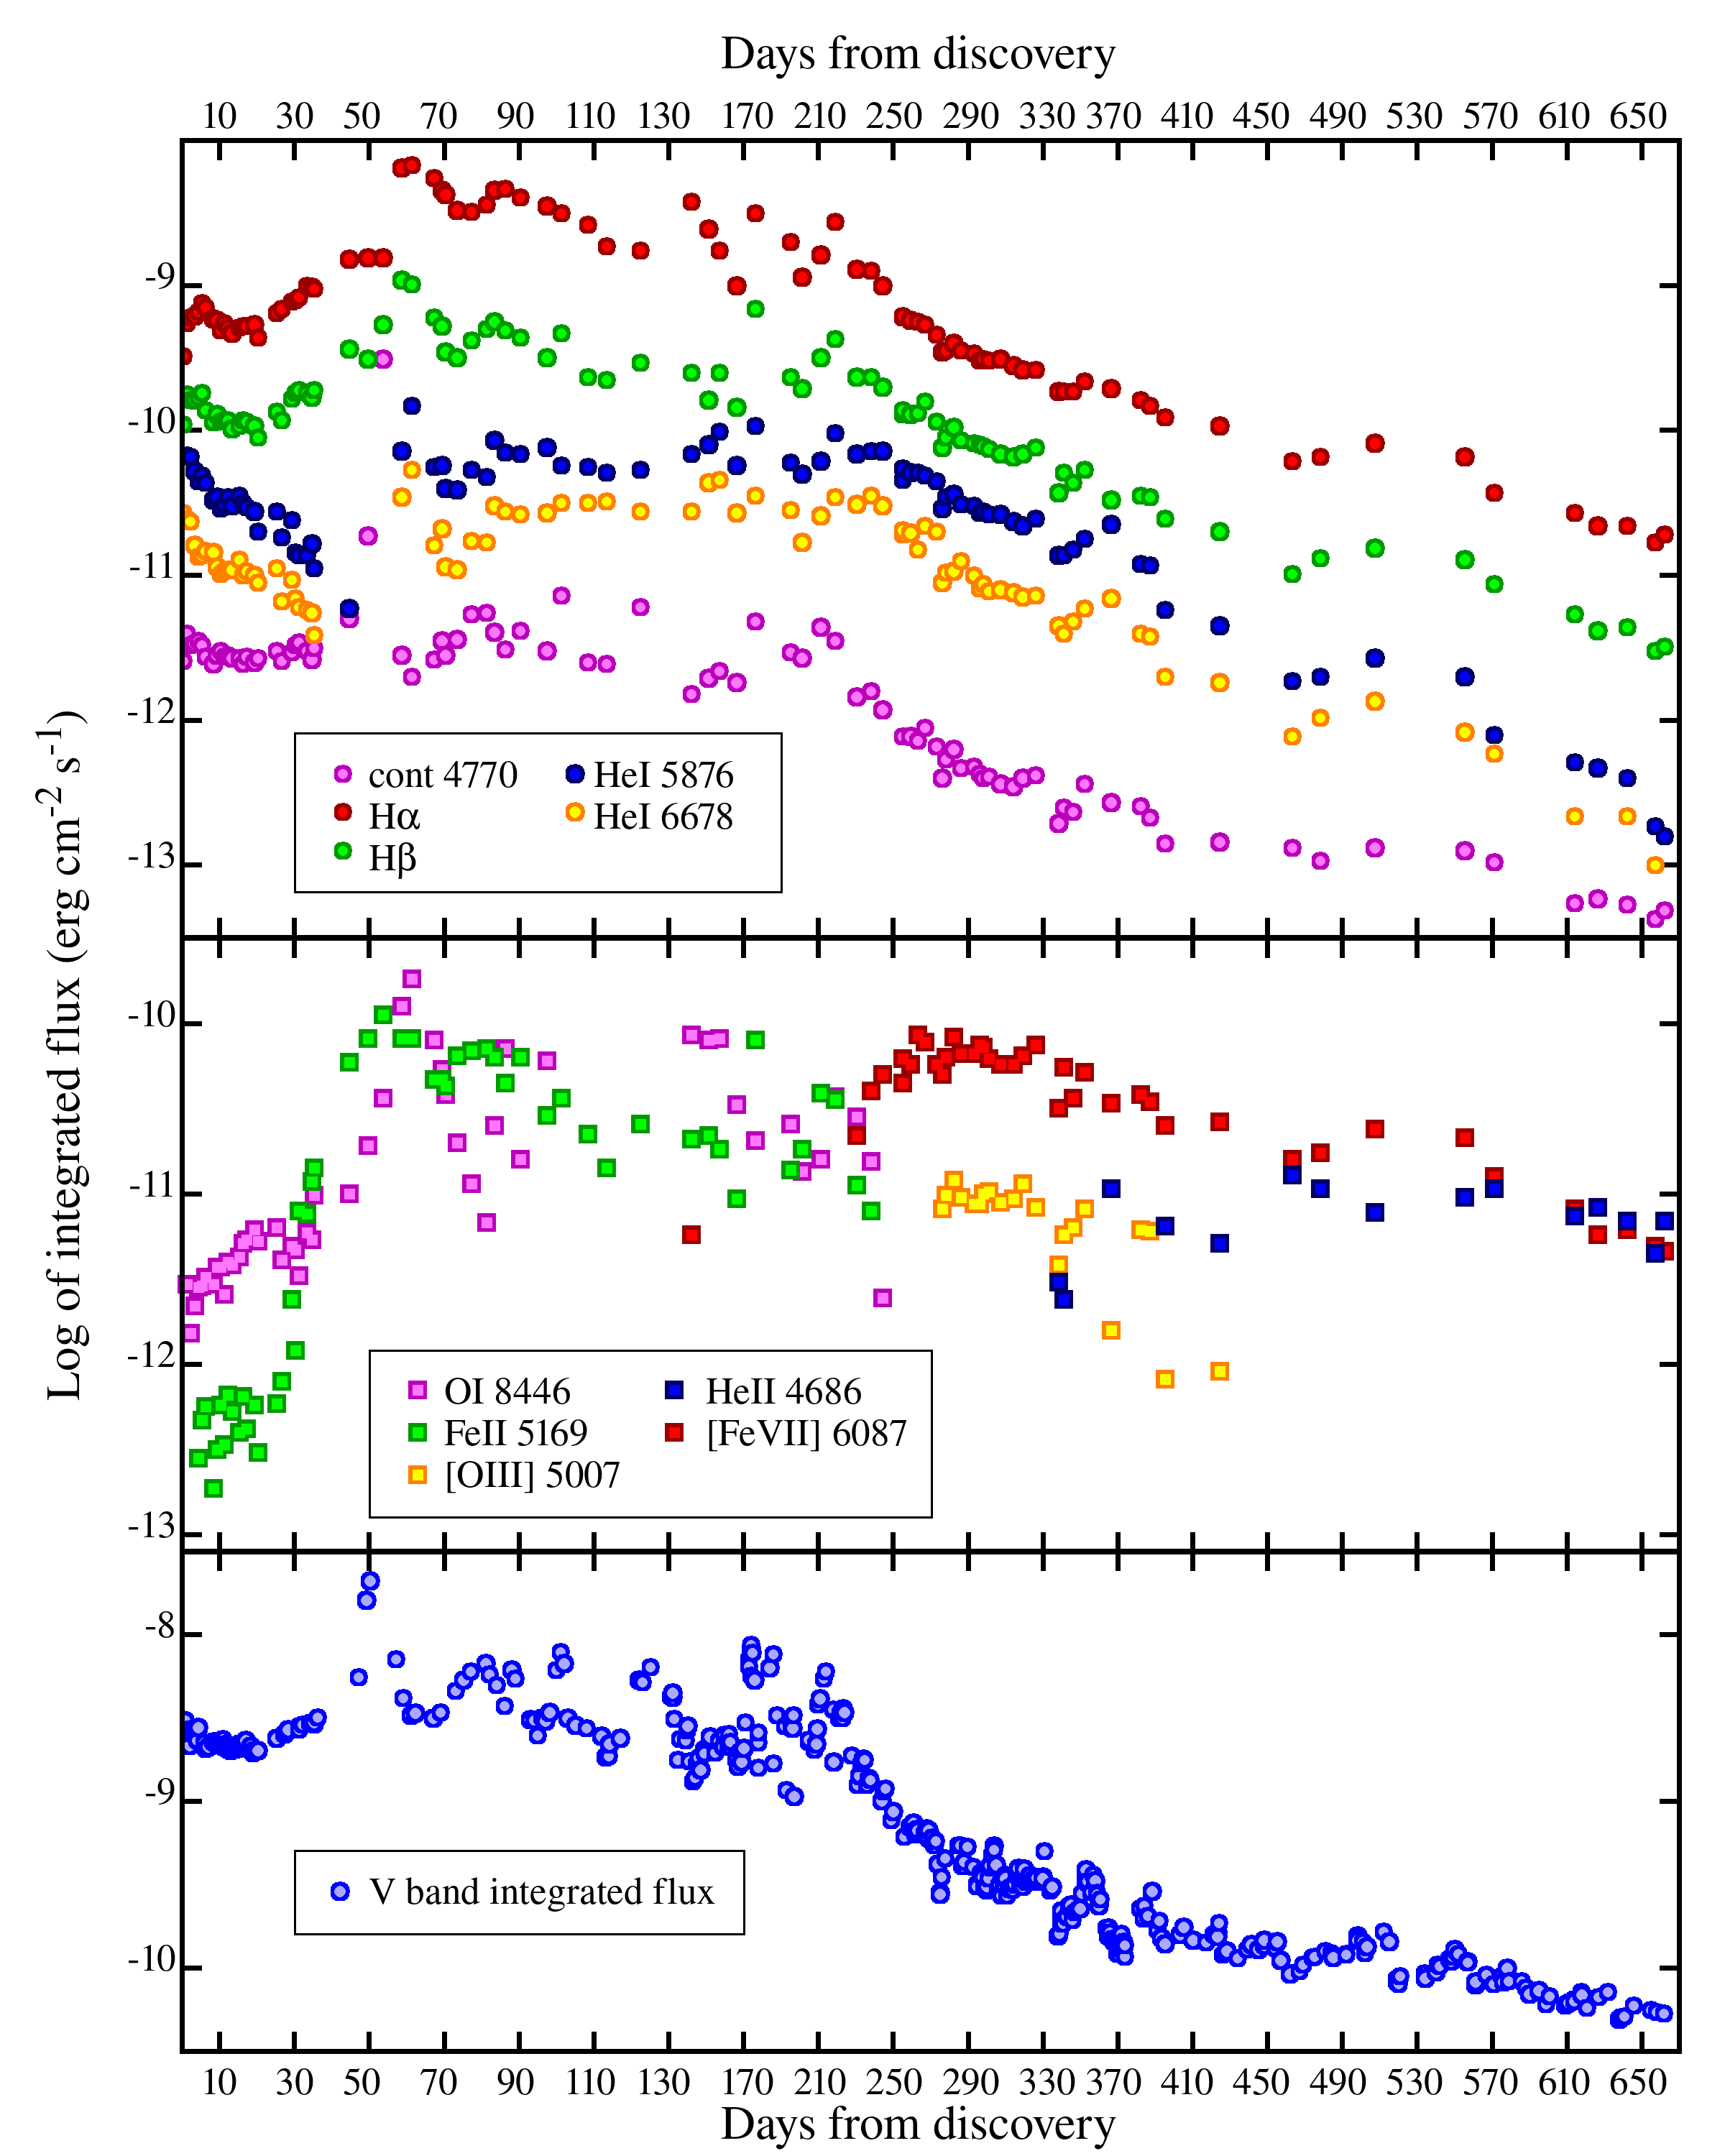
While the integrated flux of emission lines and of the in-between continuum has been measured on the 1D-fluxed spectra, a continuum-normalized version of the same 1D-spectra has been used instead to prepare the pictures that in this papers illustrate the overall spectral evolution. The emission lines of NCas21 are so wide to cover a significant fraction of a single Echelle order or are split among two adjacent ones, and our effort to continuum-normalize the spectra has been made much easier and far more objective by the availability of their 1D-fluxed version.
3.2 Dynamic-plots of the spectral evolution
Dynamic-plots offer a practical way to present at a glance the information stored in a long series of spectra which are part of a temporal sequence. We have used this technique in Figures 5 7 to illustrate, respectively, the evolution of NCas21 over the HeII/H/FeII-42, [FeVII]/H/HeI, and OI/Paschen-head/CaII-triplet regions, and in Figure 8 to zoom in the behavior of P-Cyg absorptions to H/FeII/HeI.

Such plots are prepared from the continuum-normalized version of the 1D-fluxed spectra, where the flat continuum is colored white, the absorptions in shades of blue and the emission in shades of pink and red, as illustrated by the color-bar at the bottom of each figure.
The time-scale of the dynamic-plots in Figures 5 8 is itself dynamic. The temporal cadence is 1-day for the first 130 days, to both reflect the daily pace of our observations of NCas21 as well as to better map the rapid changes exhibited by the spectral features during the initial plateau. The cadence turns to 2-days for the time-interval from day +130 to +400, and slows to 5-days for day +400 to day +662, following the slower nova evolution and the lower S/N of the spectra that benefit from averaging them together over 5-day bins.
3.3 Measuring the reddening from the spectra
The spectra of NCas21 present strong interstellar features which allow to estimate the amount of reddening affecting the nova. We carried out already this exercise (Munari et al. 2021a) on the first Echelle spectrum we secured within hours of the nova announcement (day +0.37), deriving E(B-V)=0.53. Here we refine the reddening estimates by repeating the measurements on the best available spectra and averaging the results, which indeed do little differ from the initial ones.
The atomic interstellar lines presents two distinct components, at heliocentric velocities 55.3 0.7 and 14.4 0.8 km/s. For the NaI D1 line, their equivalent widths are respectively 0.173 and 0.740 Å, with the latter appearing clearly saturated. Adopting the Munari & Zwitter (1997) calibration, the reddening from the unsaturated NaI D1 component at 55.3 km/s is E(B-V)=0.055, and E(B-V)=0.45 is obtained from the unsaturated KI component at -14.4 km/s showing an equivalent width of 0.118 Å, for a total reddening of E(B-V)=0.51. The diffuse interstellar band at 6614.5 Å is characterized by an equivalent width of 0.112 Å, which translates to E(B-V)=0.49 following the calibration by Munari (2014). By averaging them, we adopt in this paper
| (8) |
as the interstellar reddening affecting NCas21.
This value of the reddening compares well with the =+0.662 0.010 (Eq.4 above) displayed by NCas21 at maximum. Van den Bergh & Younger (1987) have compiled and analyzed UBV photometry of classical novae in eruption, deriving an intrinsic =0.23 0.06 at maximum brightness, which translates into E(B-V)=0.43 0.06 for NCas21.
3.4 Evolution during pre-maximum
NCas21 has presented a smooth evolution during the flat phase leading up to the maximum on day +53. The emission spectrum, up to day +20 from discovery, was dominated by Balmer lines and weakening of HeI lines, with a velocity around 1500 km/s for the single-component P-Cyg absorptions. The fading of HeI lines was accompanied by the appearance of FeII emission lines, with the earliest detection for multiplet 42 on day +8.4, while the first appearance of the corresponding FeII P-Cyg absorptions occurring much later on day +26.7***all dates hereafter refer to the corresponding spectrum in Table 3.. During this phase the FeII emission lines remained weak and very narrow (Figure 8, central panel) with FWHM160 km/s, concomitant with the presence of HeI emission lines declining in intensity. The FeII P-Cyg absorptions were centered at 1180 km/s and characterized by FWHM190 km/s, well detached from the corresponding emission component positioned close to the laboratory wavelength. From day +31.4 until the passage at maximum brightness on day +53, the FeII emission experienced a 5-fold increase, with all the usual multiplets 27, 29, 37, 38, 41, 42, 46, 49, 55, 73, 74 present and complete.
As illustrated by Figure 8 and Figure 10, the ejecta maintained turbulent fluctuations in velocity and density on a daily pace up to day +16.4, when the overall velocity of the P-Cyg absorption of all lines (cf. Figure 5) begun a smooth decline from 1500 km/s to 700 km/s, which was reached at the time of maximum brightness (day +53). In parallel, also the edge-velocity kept declining, from 2500 km/s on day +5.4, to 1700, 1300, and 1000 km/sec on day 16.4, +35.4, and +49.7, respectively.
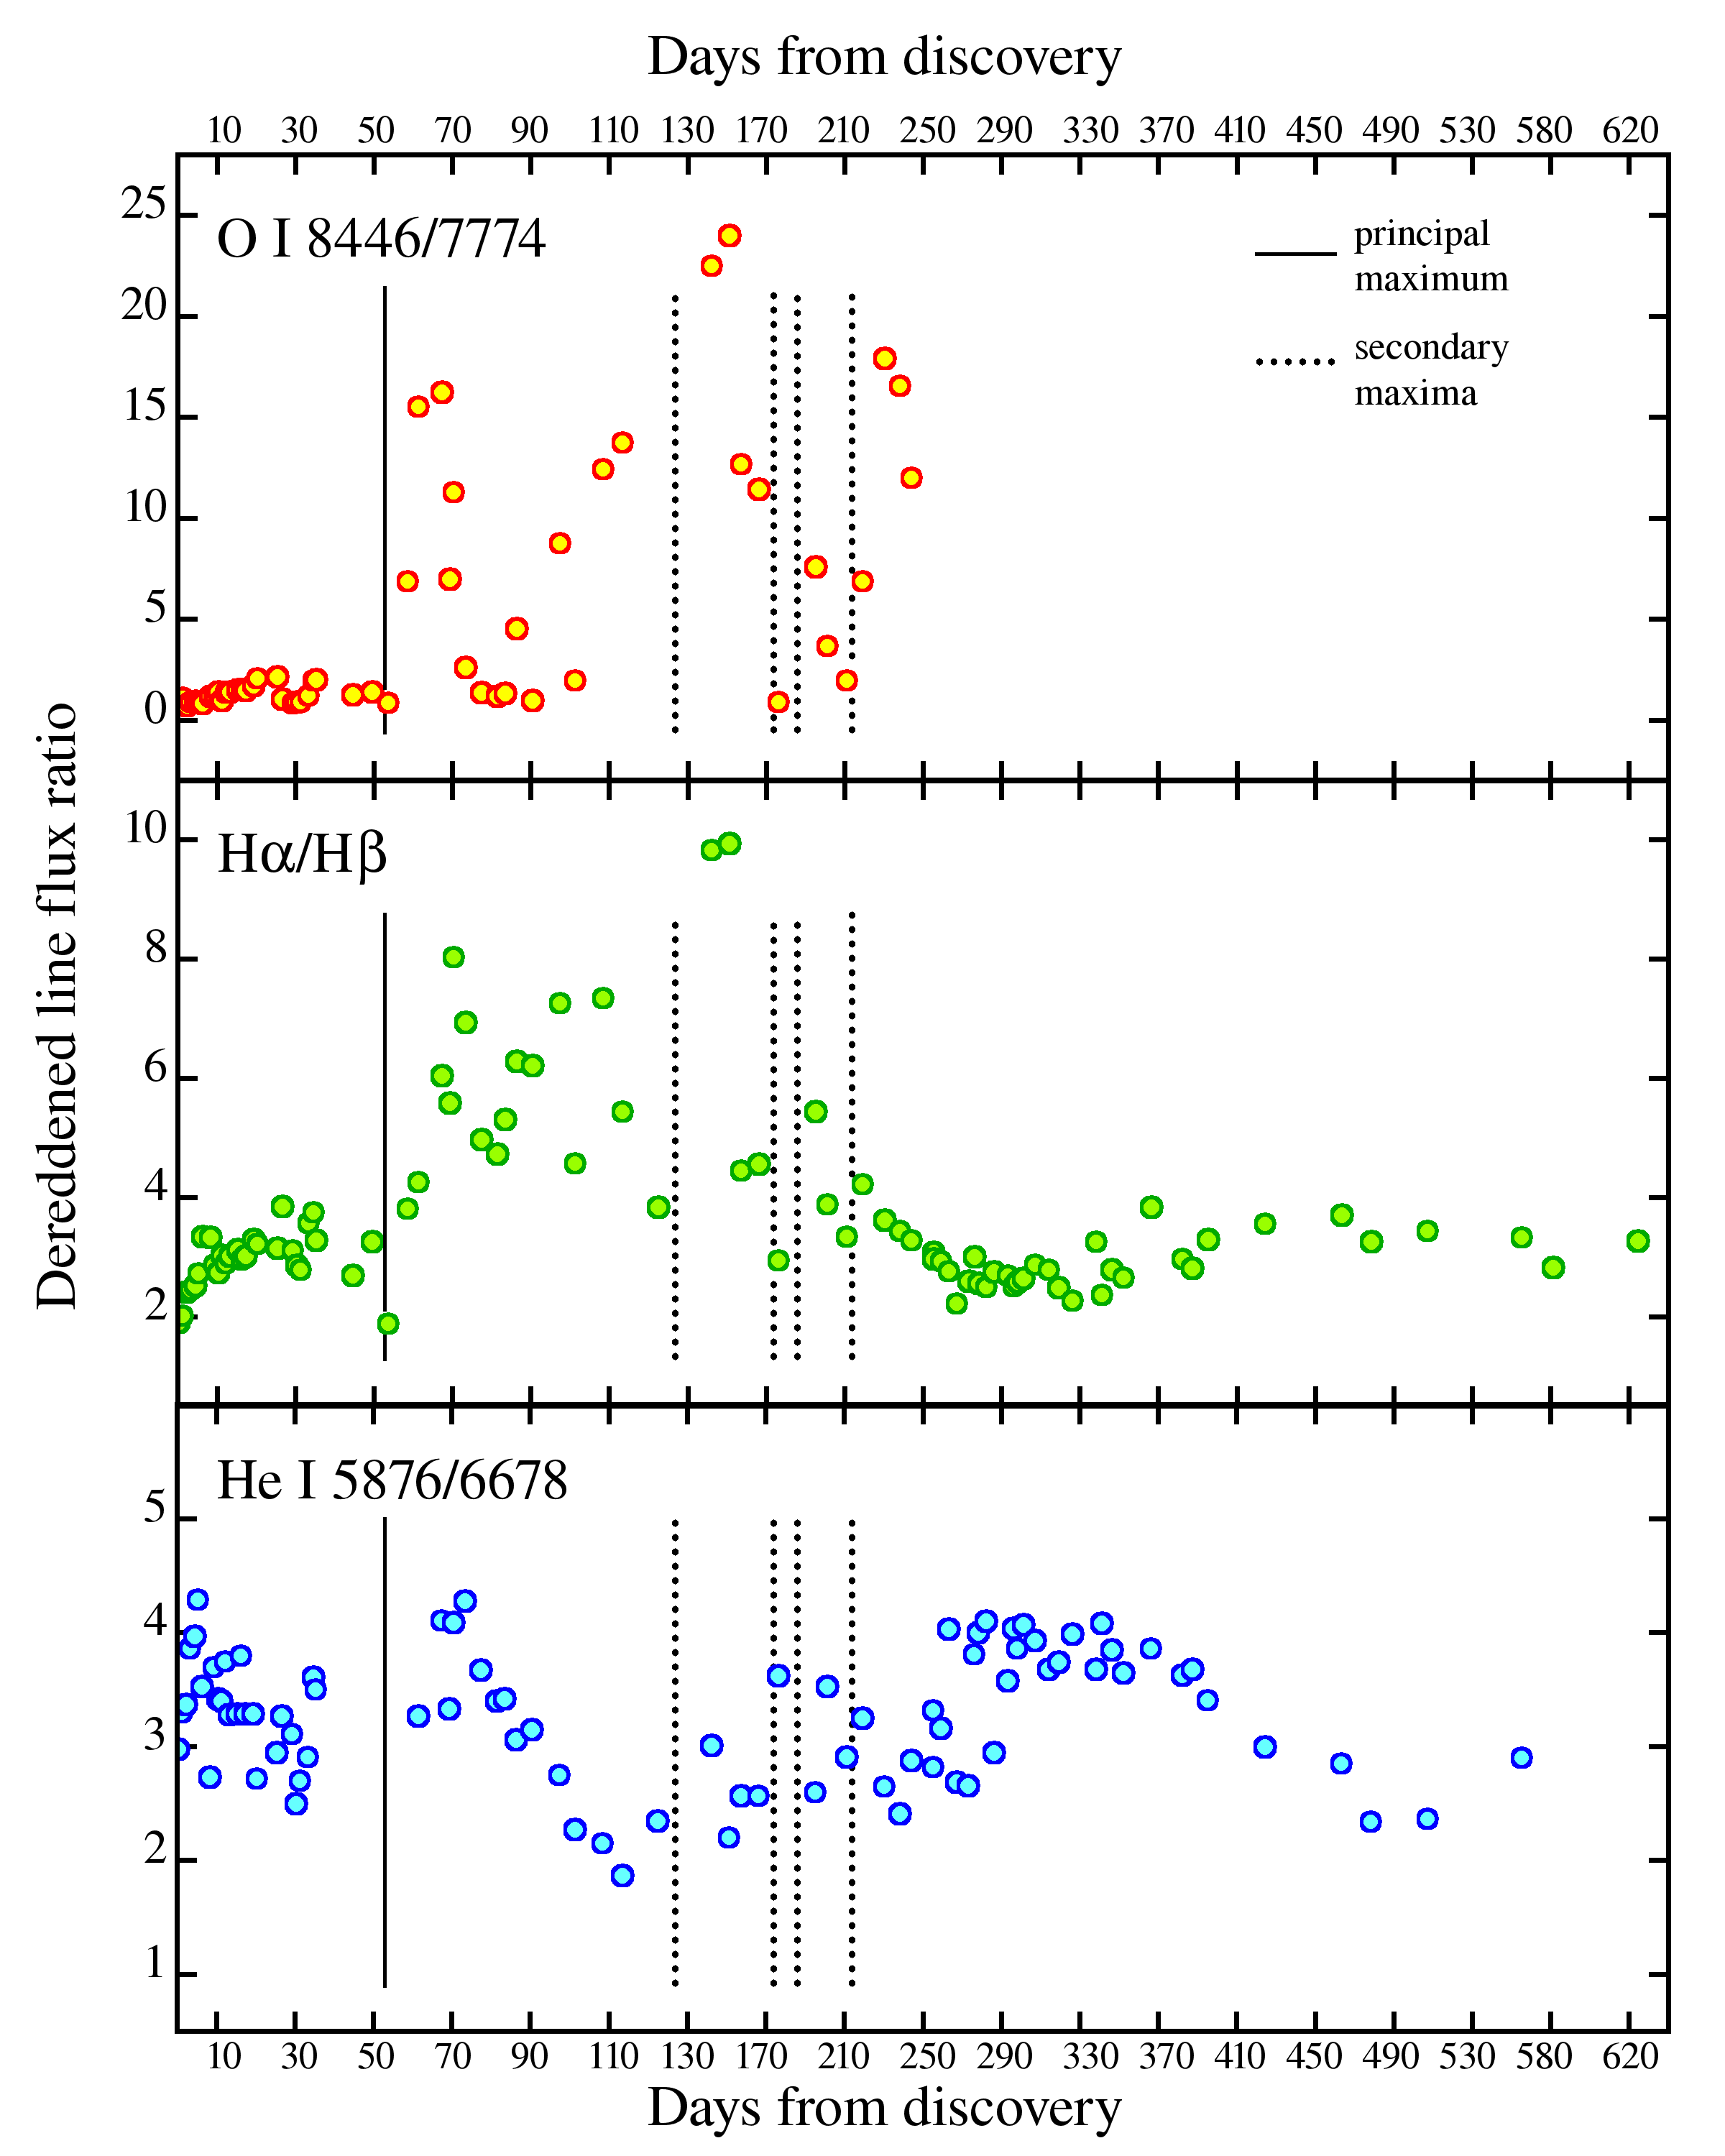
The profile of a few representative emission lines for days +5.4 and +29.5 are presented in the first two panels of Figure 9, with the shape of the P-Cyg absorption suggesting the presence of a large velocity gradient in a diluted medium. It is also worth noticing the different line profile between HeI triplet and singlet lines, because of the collisional excitation of meta-stable 2S3 state in the dense ejecta environment, with much larger wings for triplet lines: on day +5.4 the FWHM of triplet HeI 5876 is 630 km/s, almost three times that of singlet HeI 5016 that reaches only 230 km/s. The evolution of the reddening-corrected 5876/6078 flux ratio for NCas21 is plotted in the bottom panel of Figure 15.
The evolution of OI 8446 line is presented in Figure 7: the line, located next to Paschen 18, is missing on day +0.37, appears on day +1.35, and then remains rather stable through the whole pre-maximum. The evolution of the reddening-corrected OI 8446/7774 flux ratio is presented on the top panel of Figure 15, and it is clearly characterized by two distinct phases: during pre-maximum, the ratio evolved slowly and smoothly, remaining between 0.7 and 2.1, but soon after maximum brightness, the ratio started to jump up-and-down widely, up to 8446/777425 around day +150, a value indicating a dominant role played by Lyman- fluorescence in pumping the 8446 line (Bhatia & Kastner (1995)). Nebular [OI] 6300, 6364 and auroral 5577 lines have never turned visible on NCas21 spectra during the monitoring period.
3.5 Passage at primary maximum
From the photometric point of view, and similarly to HR Del and V723 Cas in Figure 4, also in the case of NCas21 the rise to, passage at, and decline from maximum appears as an isolated and quickly-evolving event, superimposed on a protracted plateau. For NCas21, the rise begun on day +45, with maximum was reached a week later on day +53, and the decline commencing immediately and the nova returning to the flat plateau brightness by day +62.
| t-t0 | HeII | 4770 Å | H | [O III] | Fe II | [NII] | HeI 5876 | [Fe VII] | H | HeI 6678 | OI 8846 |
|---|---|---|---|---|---|---|---|---|---|---|---|
| 0.37 | -11.59 | -9.96 | -10.18 | -9.49 | -10.57 | ||||||
| 1.35 | -11.40 | -9.75 | -10.17 | -9.26 | -10.61 | -11.53 | |||||
| 2.35 | -11.48 | -9.79 | -10.18 | -9.22 | -10.63 | -11.82 | |||||
| 3.37 | -11.47 | -9.79 | -10.28 | -9.21 | -10.79 | -11.66 | |||||
| 4.49 | -11.45 | -9.77 | -12.55 | -10.35 | -9.18 | -10.87 | -11.55 | ||||
| 5.37 | -11.48 | -9.74 | -12.33 | -10.31 | -9.12 | -10.86 | -11.54 | ||||
| 6.41 | -11.56 | -9.86 | -12.25 | -10.36 | -9.15 | -10.86 | -11.49 | ||||
| 8.38 | -11.61 | -9.94 | -12.73 | -10.48 | -9.23 | -10.84 | -11.53 | ||||
| 9.38 | -11.55 | -9.89 | -12.50 | -10.46 | -9.24 | -10.94 | -11.43 | ||||
| 10.37 | -11.52 | -9.94 | -12.24 | -10.54 | -9.31 | -10.99 | -11.43 | ||||
| 11.36 | -11.56 | -9.93 | -12.47 | -10.51 | -9.26 | -10.97 | -11.59 | ||||
| 12.36 | -11.55 | -9.93 | -12.18 | -10.46 | -9.29 | -10.96 | -11.40 | ||||
| 13.36 | -11.57 | -9.99 | -12.28 | -10.52 | -9.33 | -10.96 | -11.42 | ||||
| 15.37 | -11.57 | -9.97 | -12.40 | -10.45 | -9.29 | -10.89 | -11.37 | ||||
| 16.37 | -11.61 | -9.93 | -12.19 | -10.50 | -9.28 | -11.00 | -11.29 | ||||
| 17.37 | -11.56 | -9.94 | -12.38 | -10.53 | -9.28 | -10.97 | -11.27 | ||||
| 19.37 | -11.60 | -9.97 | -12.24 | -10.56 | -9.27 | -11.00 | -11.21 | ||||
| 20.37 | -11.57 | -10.05 | -12.52 | -10.70 | -9.36 | -11.05 | -11.28 | ||||
| 25.39 | -11.52 | -9.87 | -12.23 | -10.56 | -9.19 | -10.95 | -11.20 | ||||
| 26.74 | -11.59 | -9.93 | -12.10 | -10.74 | -9.16 | -11.18 | -11.39 | ||||
| 29.38 | -11.53 | -9.78 | -11.62 | -10.62 | -9.11 | -11.03 | -11.31 | ||||
| 30.38 | -11.48 | -9.74 | -11.92 | -10.81 | -9.10 | -11.16 | -11.33 | ||||
| 31.39 | -11.46 | -9.72 | -11.10 | -10.86 | -9.08 | -11.19 | -11.48 | ||||
| 33.40 | -11.52 | -9.74 | -11.12 | -10.86 | -9.00 | -11.24 | -11.23 | ||||
| 34.72 | -11.58 | -9.77 | -10.93 | -10.78 | -9.01 | -11.26 | -11.27 | ||||
| 35.38 | -11.50 | -9.72 | -10.85 | -10.95 | -9.02 | -11.41 | -11.01 | ||||
| 44.69 | -11.30 | -9.44 | -10.23 | -11.22 | -8.82 | -11.00 | |||||
| 49.66 | -10.73 | -9.51 | -10.09 | -8.81 | -10.72 | ||||||
| 53.72 | -9.51 | -9.27 | -9.95 | -8.81 | -10.44 | ||||||
| 58.70 | -11.55 | -8.96 | -10.09 | -10.14 | -8.19 | -10.46 | -9.90 | ||||
| 61.47 | -11.70 | -8.99 | -10.09 | -9.83 | -8.17 | -10.27 | -9.74 | ||||
| 67.43 | -11.58 | -9.22 | -10.33 | -10.25 | -8.26 | -10.79 | -10.10 | ||||
| 69.42 | -11.45 | -9.28 | -10.33 | -10.24 | -8.34 | -10.68 | -10.27 | ||||
| 70.43 | -11.55 | -9.46 | -10.37 | -10.40 | -8.37 | -10.94 | -10.42 | ||||
| 73.46 | -11.44 | -9.50 | -10.19 | -10.41 | -8.48 | -10.96 | -10.70 | ||||
| 77.44 | -11.27 | -9.38 | -10.16 | -10.27 | -8.49 | -10.76 | -10.94 | ||||
| 81.45 | -11.26 | -9.30 | -10.15 | -10.32 | -8.44 | -10.77 | -11.17 | ||||
| 83.47 | -11.39 | -9.25 | -10.20 | -10.07 | -8.34 | -10.52 | -10.60 | ||||
| 86.46 | -11.51 | -9.31 | -10.35 | -10.15 | -8.33 | -10.51 | -10.15 | ||||
| 90.46 | -11.38 | -9.36 | -10.20 | -10.16 | -8.39 | -10.58 | -10.80 | ||||
| 97.51 | -11.52 | -9.50 | -10.54 | -10.90 | -10.12 | -8.45 | -10.48 | -10.22 | |||
| 101.4 | -11.14 | -9.33 | -10.44 | -10.24 | -8.62 | -10.51 | |||||
| 108.5 | -11.60 | -9.63 | -10.65 | -11.04 | -10.25 | -8.58 | -10.50 | ||||
| 113.5 | -11.61 | -9.65 | -10.85 | -11.07 | -10.29 | -8.73 | -10.49 | ||||
| 122.5 | -11.22 | -9.53 | -10.59 | -10.27 | -8.76 | -10.56 | |||||
| 142.4 | -11.24 | -11.82 | -9.60 | -10.68 | -10.82 | -10.16 | -8.42 | -10.56 | -10.07 | ||
| 151.4 | -11.71 | -9.79 | -10.66 | -10.90 | -10.10 | -8.61 | -10.36 | -10.10 | |||
| 157.4 | -11.66 | -9.60 | -10.74 | -10.85 | -10.01 | -8.76 | -10.34 | -10.09 | |||
| 166.4 | -11.74 | -9.84 | -11.03 | -10.87 | -10.24 | -9.00 | -10.57 | -10.48 | |||
| 176.5 | -11.32 | -9.16 | -10.10 | -9.97 | -8.50 | -10.45 | -10.69 | ||||
| 195.3 | -11.53 | -9.63 | -10.86 | -10.22 | -8.70 | -10.55 | -10.59 | ||||
| 201.4 | -11.57 | -9.71 | -10.74 | -10.30 | -8.94 | -10.77 | -10.87 | ||||
| 211.3 | -11.36 | -9.50 | -10.41 | -10.21 | -8.79 | -10.59 | -10.80 | ||||
| 219.3 | -11.45 | -9.37 | -10.45 | -11.15 | -10.02 | -8.56 | -10.46 | -10.43 | |||
| 230.5 | -10.66 | -11.84 | -9.63 | -10.95 | -10.75 | -10.16 | -8.89 | -10.49 | -10.55 | ||
| 238.4 | -10.40 | -11.80 | -9.63 | -11.10 | -10.52 | -10.14 | -8.90 | -10.41 | -10.81 | ||
| 244.3 | -10.30 | -11.93 | -9.70 | -10.59 | -10.14 | -9.00 | -10.52 | -11.61 | |||
| 255.4 | -10.35 | -12.11 | -9.89 | -10.84 | -10.34 | -9.22 | -10.72 | ||||
| 255.4 | -10.21 | -12.11 | -9.86 | -11.17 | -10.26 | -9.21 | -10.70 | ||||
| 259.3 | -10.24 | -12.11 | -9.89 | -11.10 | -10.29 | -9.24 | -10.71 | ||||
| 263.3 | -10.07 | -12.14 | -9.88 | -11.23 | -10.29 | -9.25 | -10.82 | ||||
| 267.3 | -10.11 | -12.05 | -9.80 | -11.07 | -10.31 | -9.27 | -10.66 |
| t-t0 | HeII | 4770 Å | H | [O III] | Fe II | [NII] | HeI 5876 | [Fe VII] | H | HeI 6678 | OI 8846 |
|---|---|---|---|---|---|---|---|---|---|---|---|
| 273.3 | -10.24 | -12.18 | -9.94 | -11.38 | -10.35 | -9.34 | -10.70 | ||||
| 276.3 | -10.30 | -12.40 | -10.12 | -11.09 | -10.54 | -9.46 | -11.05 | ||||
| 278.4 | -10.20 | -12.27 | -10.05 | -11.01 | -10.46 | -9.45 | -10.98 | ||||
| 282.4 | -10.08 | -12.20 | -9.98 | -10.92 | -10.44 | -9.40 | -10.97 | ||||
| 286.3 | -10.18 | -12.33 | -10.07 | -11.02 | -10.51 | -9.45 | -10.90 | ||||
| 293.3 | -10.18 | -12.32 | -10.09 | -11.06 | -10.52 | -9.47 | -11.00 | ||||
| 296.3 | -10.13 | -12.37 | -10.10 | -11.06 | -10.57 | -9.52 | -11.09 | ||||
| 298.3 | -10.14 | -12.40 | -10.11 | -11.00 | -10.56 | -9.51 | -11.06 | ||||
| 301.3 | -10.21 | -12.39 | -10.13 | -10.99 | -10.58 | -9.52 | -11.11 | ||||
| 307.3 | -10.24 | -12.44 | -10.16 | -11.05 | -10.58 | -9.51 | -11.10 | ||||
| 314.3 | -10.24 | -12.46 | -10.18 | -11.03 | -10.63 | -9.55 | -11.12 | ||||
| 319.3 | -10.19 | -12.40 | -10.16 | -10.94 | -10.66 | -9.58 | -11.15 | ||||
| 326.3 | -10.13 | -12.38 | -10.12 | -11.08 | -10.61 | -9.58 | -11.14 | ||||
| 338.4 | -10.50 | -12.71 | -10.43 | -11.42 | -10.86 | -11.52 | -9.73 | -11.35 | |||
| 341.4 | -10.26 | -12.60 | -10.29 | -11.24 | -10.86 | -11.62 | -9.73 | -11.40 | |||
| 346.4 | -10.44 | -12.63 | -10.36 | -11.20 | -10.82 | -9.73 | -11.32 | ||||
| 352.4 | -10.29 | -12.44 | -10.27 | -11.09 | -10.75 | -9.66 | -11.22 | ||||
| 366.4 | -10.47 | -12.57 | -10.48 | -11.80 | -11.65 | -10.97 | -9.71 | -11.16 | |||
| 382.4 | -10.42 | -12.59 | -10.45 | -11.21 | -10.92 | -9.79 | -11.40 | ||||
| 387.4 | -10.46 | -12.67 | -10.46 | -11.22 | -10.93 | -9.83 | -11.42 | ||||
| 395.4 | -10.60 | -12.85 | -10.61 | -12.09 | -11.24 | -11.19 | -9.91 | -11.69 | |||
| 424.5 | -10.58 | -12.84 | -10.70 | -12.04 | -11.35 | -11.29 | -9.97 | -11.74 | |||
| 463.5 | -10.89 | -12.88 | -10.96 | -11.73 | -10.89 | -10.21 | -12.11 | ||||
| 478.5 | -10.76 | -12.97 | -10.88 | -11.70 | -10.97 | -10.18 | -11.98 | ||||
| 507.4 | -10.62 | -12.88 | -10.81 | -11.57 | -11.11 | -10.09 | -11.87 | ||||
| 555.4 | -10.67 | -12.90 | -10.89 | -11.70 | -11.20 | -10.18 | -12.08 | ||||
| 588.4 | -10.90 | -12.98 | -11.06 | -12.25 | -10.97 | -10.43 | -12.23 | ||||
| 614.4 | -11.09 | -13.26 | -11.27 | -12.29 | -11.10 | -10.57 | -12.66 | ||||
| 626.5 | -11.24 | -13.23 | -11.38 | -12.35 | -11.08 | -10.66 | |||||
| 642.5 | -11.21 | -13.27 | -11.36 | -12.40 | -11.16 | -10.66 | -12.56 | ||||
| 657.5 | -11.31 | -13.37 | -11.52 | -12.73 | -11.35 | -10.97 | |||||
| 662.5 | -11.34 | -13.31 | -11.49 | -12.80 | -11.16 | -10.72 | -12.46 |
The rise to maximum brightness was primarily due to a tenfold increase in the continuum, which can be reasonably fitted over the optical wavelength range by an A-type pseudo photosphere passing in radius from R35 R⊙ to R100 R⊙. The passage at maximum brightness was characterized by FeII becoming prominent, together with reinforcement of HI Balmer and Paschen series, while all HeI lines briefly vanished (cf. Figure 6), well matching the Williams (1992) requirements for a classification of NCas21 as a FeII-type nova.
From the spectroscopic point of view, the passage at primary maximum changed irreversibly the profiles of emission lines: as illustrated in Figure 9, prior to maximum the emission component displayed a slim, symmetric Voigt profile, afterward the emission profile turned much wider with rounded tops and a multi-component structure (a broad core superimposed on an even broader pedestal), more than doubling the overall width. So, while from a photometric point of view the passage at maximum has been just an isolated episode, with brightness and colors returning in a week to pre-max values, it marked instead an irreversible change for the spectra and the emersion of high-velocity components. A sample of the emission line profiles during the rise to maximum (day +49.7), passage at (day +53.7), and return to pre-maximum brightness (day +61.5) are presented in the 3rd, 4th, and 5th panels of Figure 9.
It was at this stage, when the high-velocity flow appeared in the spectra, that for a 5-days interval following the return to pre-max brightness (days +62 to +66), -rays from NCas21 were observed for the first time by Fermi-LAT, as reported by Buson et al. (2021). The -rays detection was preceded by persistent non-detections (Gong & Li 2021), with an upper limit of 1.5e34 erg/s for a 1.7kpc distance to NCas21. It is worth noticing that shock-powered -rays emerged simultaneous with the drastic transformation of the emission line profiles: the broad core superimposed on an even broader pedestal indicates distinct large masses of gas moving at greatly different velocities, conducive to powerful collisions and shocks. The -rays detection triggered radio observations with VLA, looking for synchrotron signatures of particle-accelerating shocks, but none was found in June, and only thermal emission from the nova was recorded by Sokolovsky et al. (2021b).
The quick decline from maximum was characterized by the disappearance of all absorptions components, the only weak absorptions remaining on day +61.5 being those of NaI D1,D2 doublet; on the same date, emission lines had red and blue peaks at 650 and 815 km/sec, flanking asymmetrically a brighter central component. The FWZI of the emission lines was on this date 2000 km/s.
Once the decline from maximum was completed, and the brightness had returned to the plateau level, P-Cyg absorptions resumed for H, Fe II and He I lines, this time with the noticeable characteristics of being multiple-component instead of single-component as before the primary maximum. A broad P-Cyg component at 1050 km/sec appeared after maximum for HeI, FeII and H, resembling the diffuse enhanced absorption system described by McLaughlin (1942), while the principal absorption system characterized by a 700 km/sec just before maximum, splitted into two sharp components at 600 and 800 km/sec and re-appeared only for H and FeII but not for HeI (cf. Figures 6 and 9). The principal absorptions maintained a rather constant velocity along the transition phase. A summary of the evolution of P-Cyg absorptions is presented in Figure 10 and is qualitatively consistent with the time-behavior described by McLaughlin (1942), with pre-maximum speed decreasing before maximum and diffuse enhanced speed increasing after maximum, and reaching higher velocities than principal absorptions.
The empirical relation found by McLaughlin (1960) between the velocity of principal absorption system and decline time
| (9) |
provides days for the average km/sec presented by NCas21, which is much shorter than any value of returned by photometry as listed in Table 2. Rather interestingly, however, inserting such spectroscopic into the MMRD relation by Selvelli & Gilmozzi (2019), results in an absolute magnitude at maximum of NCas21 of which leads to a distance of 1.8 kpc, in perfect agreement with the 1.73 (range 1.661.81) kpc value inferred from the Gaia DR3 parallax.
3.6 The plateau phase and secondary maxima
During the 7-month photometric plateau, the spectrum showed prominent Balmer, HeI and weaker FeII lines, with varying intensities, flanked by variable and multiple P-Cyg absorptions due to principal and diffuse enhanced systems. Superimposed on the photometric plateau, various rebrightenings have been observed, the brightest five being listed in Table 2. Thanks to the fast pace of our monitoring campaign, we have recorded spectra covering all maxima and the in-between returns to plateau brightness.
The spectra obtained around secondary maxima display some common spectroscopic features. Comparing for ex. the spectra for day +142 (plateau) and +176 (N.3 maximum) in Figure 9, shows that at maxima the spectra presented () lower ionization conditions with FeII reinforcing and HeI weakening, () stronger P-Cyg absorptions and a reduced velocity for them, () narrower emission components, () a reinforced continuum, and () a dramatic reduction of OI 8446 pumped by Lyman- fluorescence.
Aside from secondary maxima, the general trend exhibited instead by NCas21 along the underlying plateau has been characterized by: (a) stable ionization conditions, higher than during maxima; (b) weakening of principal system of P-Cyg absorptions with a constant velocity for FeII and Balmer lines around 800 km/s, while a principal system of absorptions never developed for HeI; (c) the velocity of the diffuse enhanced system of P-Cyg absorptions increased from about 1100 to 1500 km/s; and (d) a weak auroral [NII] 5755 line was present from day +97 to +166 with a temporary maximum intensity reached on day +142.
The spectrum for day +142 is remarkable because it shows a temporary and almost complete disappearance of diffuse enhanced P-Cyg absorptions for FeII and Balmer lines whose emission profiles widened well beyond the principal absorptions. For HeI lines diffuse enhanced P-Cyg absorption temporarily increased to 1590 km/s velocity.
Also on this date, the H/H and OI 8446/7774 ratio reached the highest values for NCas21 (cf Figure 15) and the high ionization HeII 4686 and Bowen 4640 blend turned briefly visible, to quickly disappear within a couple of weeks and then wait for the start of the decline in early November 2021 to return and remain there permanently visible.
3.7 The nebular phase and photometric decline
The photometric plateau of NCas21 ended around day +230, the rebrightenings stopped altogether, and the nova finally embraced the steady decline it is still following at the time of writing.
During the final decline from the plateau, the ionization increased as illustrated by the appearance and steady growth in intensity of HeII and of the 4640 Bowen blend, while low-ionization features like FeII disappeared. The auroral [NII] 5755 soon appeared as the decline commenced. Among other slow novae, nebular stage was reported after 8 months for HR Del (Naito et al. 2012), 18 months for V723 Cas (Iijima 2006), and 50 months for V1280 Sco (Naito et al. 2022).
The [NII] emission line in NCas21 displayed a boxy shape of FWZI1900 km/s, with continuously varying blue and red edges; it reached maximum intensity around day +255, and then disappeared by day +278 (see Figure 6). With the start of the nebular phase, the P-Cyg absorptions of Balmer and FeII lines rapidly declined while remaining strong only for HeI up to day +320, the last time P-Cyg absorptions were visible for any of the emission lines of NCas21. From day +244 to +330 the velocity of P-Cyg absorptions, although characterized by a steady overall increase in velocity, displayed shorter term variability of a great amplitude (see Figure 10).
By day +274, [OIII] lines turned visible, in coincidence with the emergence of super-soft X-rays emission (Page et al. 2021), and the rise in the ionization conditions led to the disappearance of OI 7774 and 8446 lines. The last spectrum showing OI 8446 in emission is that for day +244.
Higher ionization lines [FeVI], [FeVII] and [CaV] begun to appear on day +320, initially with an intermittent intensity, anti-correlating with the strength of [OIII] lines. Both variations in the temperature of the ionizing radiation field and in the electron density of the medium may have contributed to such a behavior. The measured [OIII] 5007/4959 ratio has consistently remained above the theoretical value of 3, probably driven by the blending of [OIII] 5007 with HeI 5016 line. [OIII] 5007 finally disappeared altogether around day +450; it was never very strong though, peaking in intensity on day +319 when it reached only 1/8 of the H integrated flux (cf. Table 4). Since about day +250 (cf. Figure 9), the Balmer and He I lines developed a nested/multi-component profile, with a box-shaped central core (FWHM800 km/s), superimposed onto a trapezoidal FWHM2000 km/s base, and a final wide pedestal of FWZI4200 km/s. The latter, on later dates and for H reached a FWZI5300 km/s. The nested/multi-component boxy profile was successively developed also by [FeVI], [FeVII], and [CaV] lines.
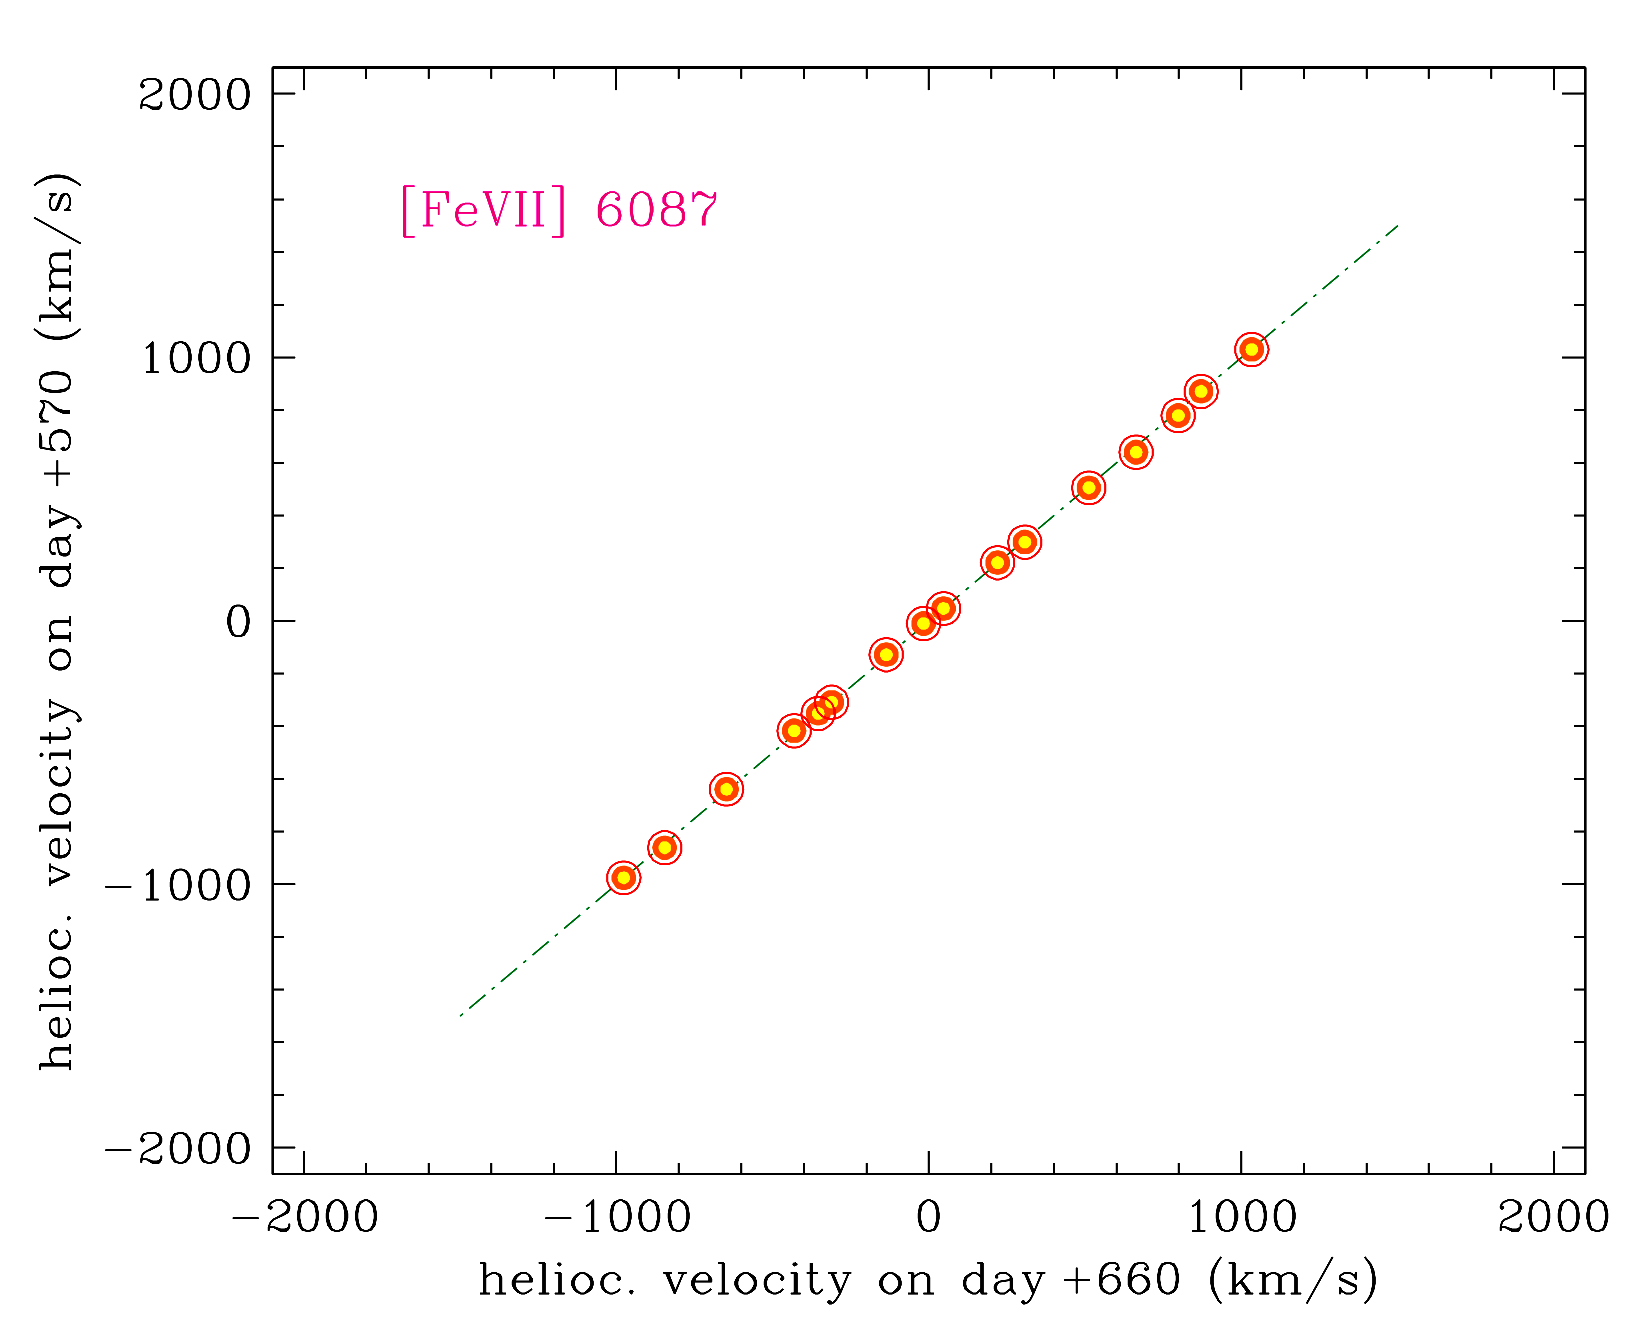
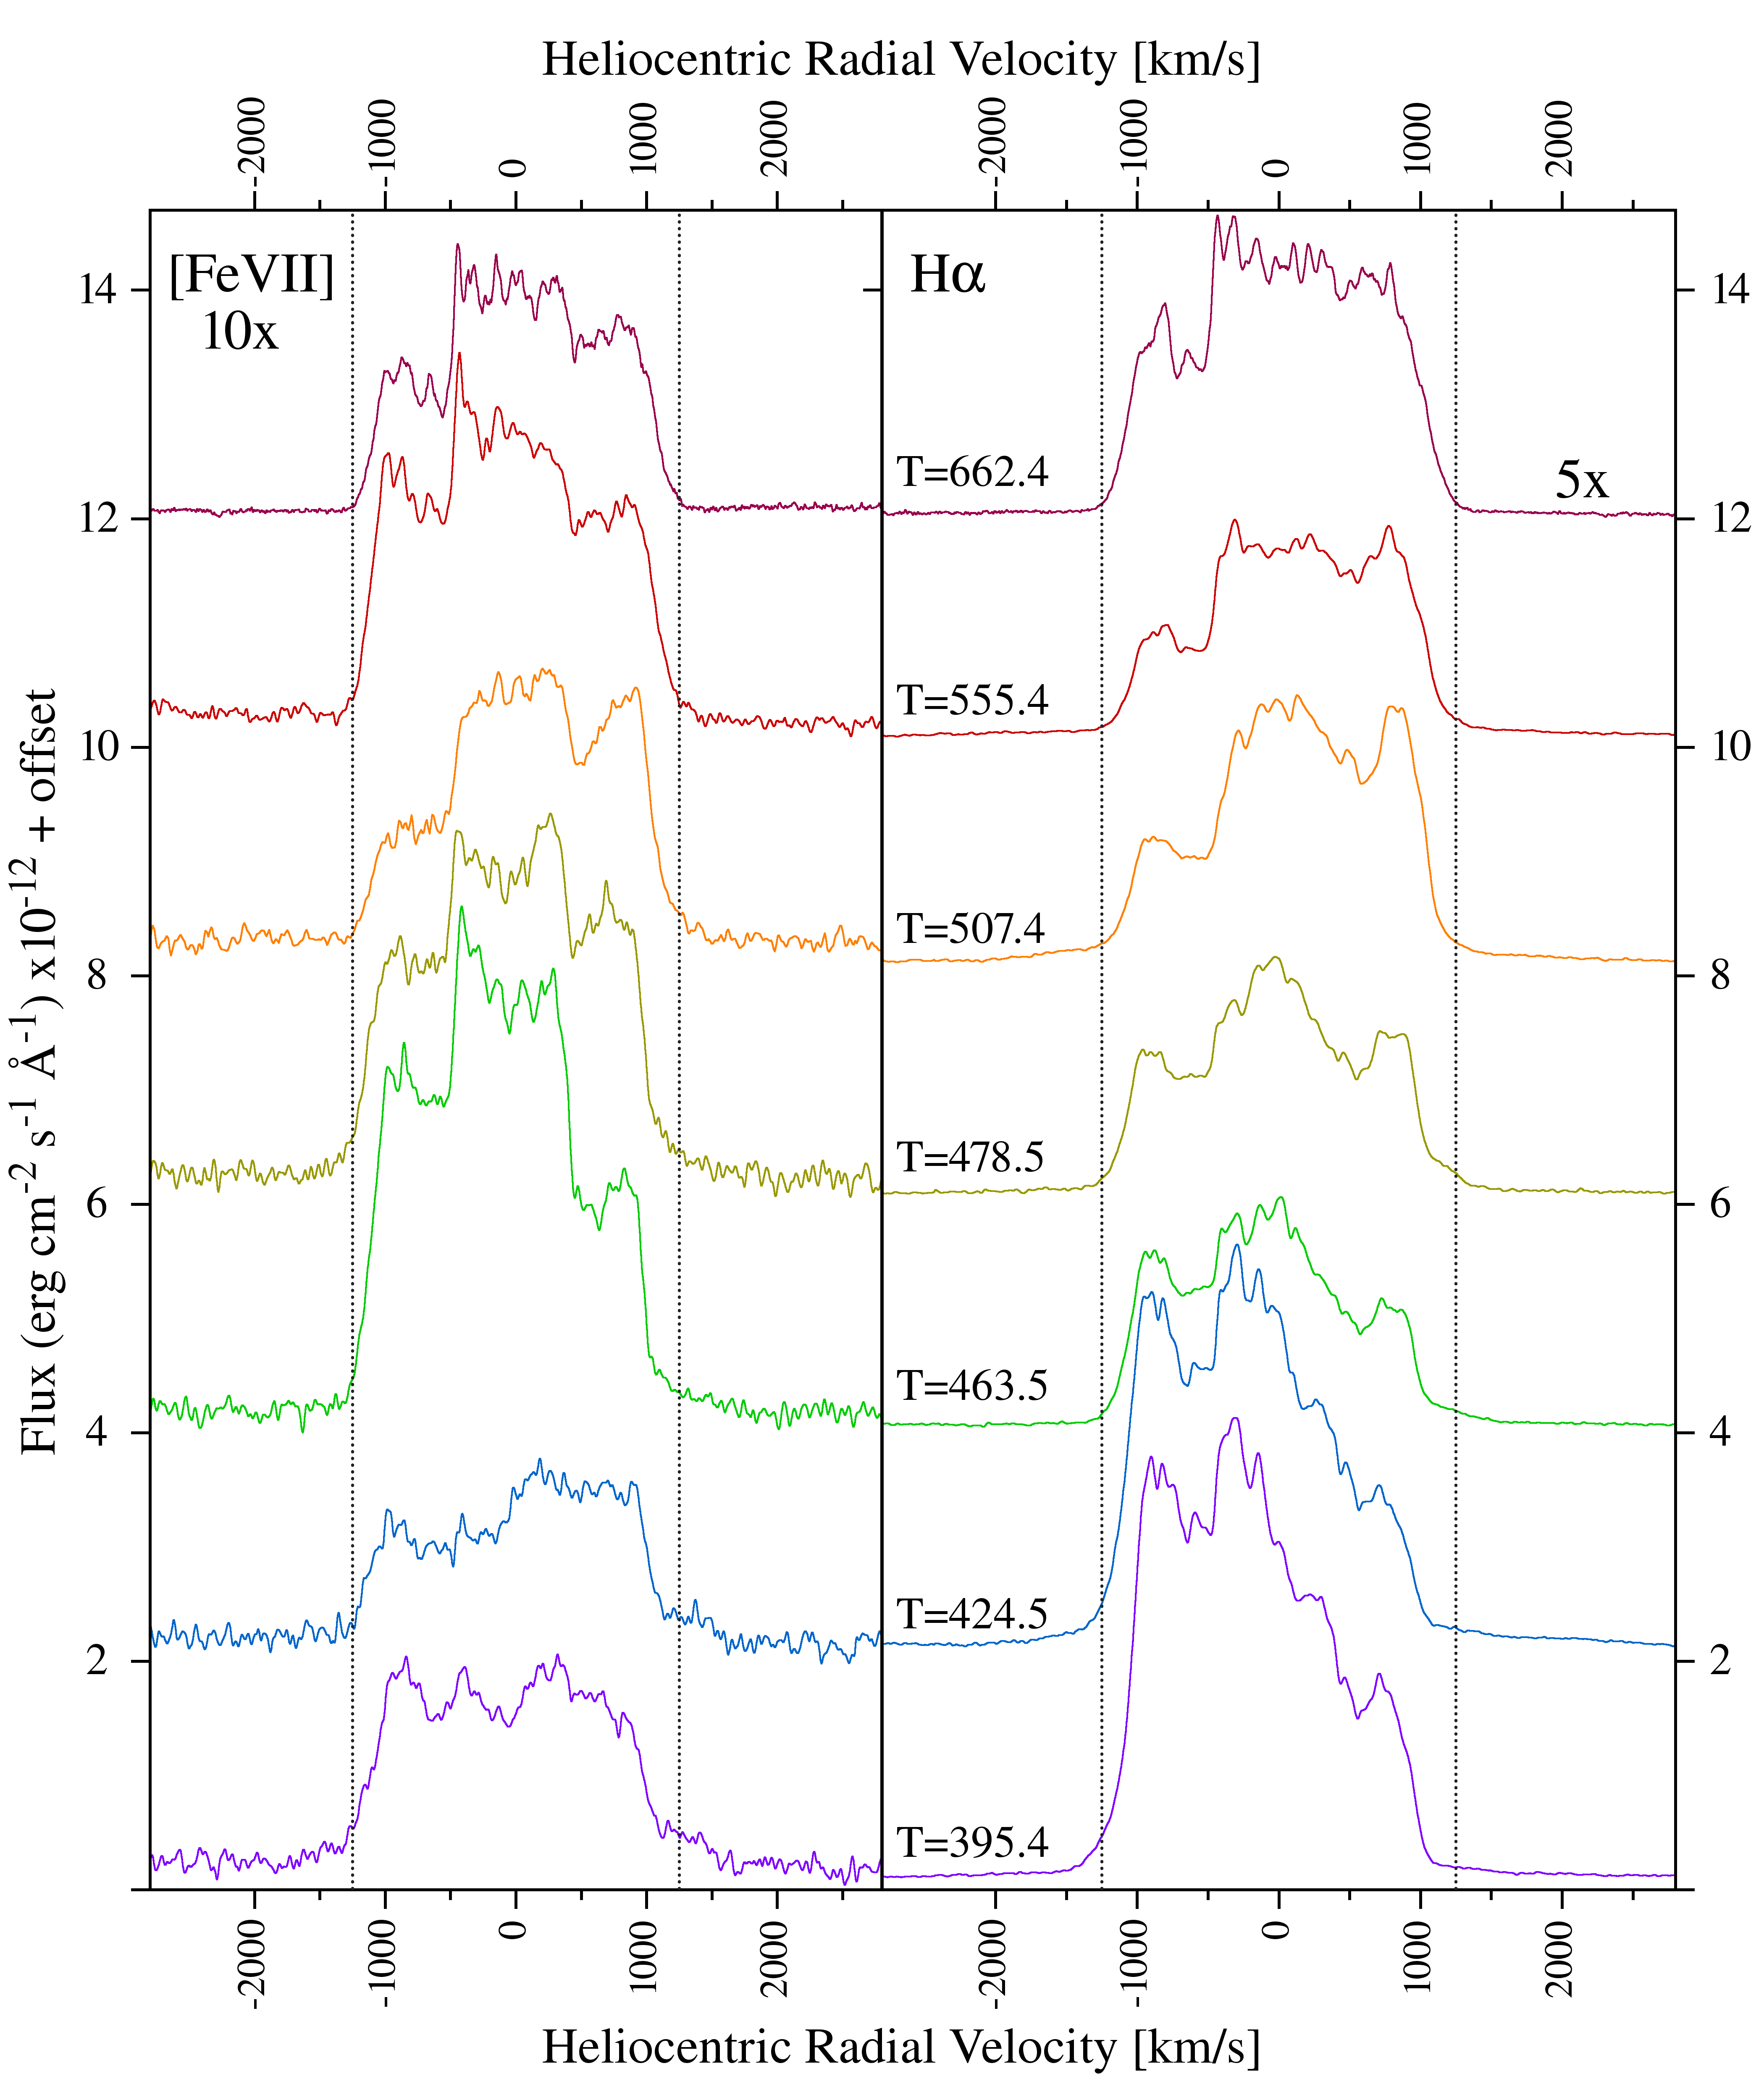
A spatially resolved radio map of the ejecta was obtained with VLA on 2022-07-04 (day +472) by Sokolovsky et al. (2022b). Their 31.1 and 34.9 GHz images show an elliptical edge-brightened shell extending about 220 mas in the north-east to south-west direction, crossed by a bright band of emission which extends along the minor axis of the shell. The Figure 13 illustrates the evolution of the profile of H and [FeVII] 6087 of NCas21 around the epoch of VLA imaging of the resolved ejecta, from 77-days before to 83-days after; they are representative of permitted and forbidden emission lines. At day +507 (35 days past the VLA epoch) the line profiles of both H and [FeVII] were still changing with the red and the blue wing of the pedestal alternating as the stronger of the two. It is only with day +555 (83 days past the VLA epoch) that the emission line profiles stopped evolving and remained freezed in their appearance. This is well illustrated in Figure 12, where the densely castellated profiles of emission lines for day +570 are plotted (left panel), and the velocity of each dent compared to that measured on our last spectrum for day +662 (right panel): the velocities at the two epochs are identical within the measurement error (about 1 km/s), proving the ejecta had finally reached the stage of free-expansion into the void surrounding the central nova.
Acknowledgements We express our gratitude to L. Buzzi, A. Frigo, S. Moretti, F. Castellani, V. Andreoli, and A. Bergamini for their various help and support to this project.
4 References
Bhatia, A. K., Kastner, S. O., 1995, ApJS, 96, 325
Bruch, A., 1982, PASP, 94, 916
Buson, S., Cheung, C. C., Jean, P., 2021, ATel, 14658
Chomiuk, L., Linford, J. D., Aydi, E., et al., 2021, ApJS, 257, 49
Gehrz, R. D., Banerjee, D. P. K., Evans, A., et a., 2021, ATel 14794
Gong, Y.-H., Li, K.-L., 2021, ATel, 14620
Goranskij, V. P., Katysheva, N. A., Kusakin, A. V., et al., 2007, AstBu, 62, 125
Harman, D. J., O’Brien, T. J., 2003, MNRAS, 344, 1219
Henden, A., Munari, U., 2014, CoSka, 43, 518
Heywood, I., O’Brien, T. J., Eyres, S. P. S., et al., 2005, MNRAS, 362, 469
Iijima, T., 2006, A&A, 451, 563
Landolt, A. U., 2009, AJ, 137, 4186
Lyke, J. E., Campbell, R. D., 2009, AJ, 138, 1090
Maehara, H., Taguchi, K., Tampo, Y., et al., 2021, ATel, 14471
McLaughlin, D. B., 1942, ApJ, 95, 428
McLaughlin, D. B., 1960, in Stellar Atmospheres, ed J.L. Greenstein (U. of Chicago Press), p.585
Munari, U., 2014, ASPCS, 490, 183
Munari, U., Moretti, S., 2012, BaltA, 21, 22
Munari, U., Valisa, P., 2014, CoSka, 43, 174
Munari, U., Valisa, P., 2022, ATel, 15796
Munari, U., Zwitter, T., 1997, A&A, 318, 269
Munari, U., Goranskij, V. P., Popova, A. A., et al., 1996, A&A, 315, 166
Munari, U., Bacci, S., Baldinelli, L., et al., 2012, BaltA, 21, 13
Munari, U., Henden, A., Frigo, A., et al., 2014, AJ 148, 81
Munari, U., Maitan, A., Moretti, S., et al., 2015, NewA, 40, 28
Munari, U., Valisa, P., Dallaporta, S., 2021a, ATel, 14476
Munari, U., Valisa, P., Dallaporta, S., 2021b, ATel, 15614
Munari, U., Valisa, P., Dallaporta, S., et al., 2021c, ATel, 15093
Naito, H., Mizoguchi, S., Arai, A., et al., 2012, A&A, 543, A86
Naito, H., Tajitsu, A. , Ribeiro, V. A. R. M., et al., 2022, ApJ, 932, 39
Nayana, A. J., Anupama, G. C., Banerjee, D. P. K., et al., 2022, ATel, 15383
Ochner, P., Moschini, F., Munari, U., et al., 2015, MNRAS, 454, 123
Page, K. L., Starrfield, S., Munari, U., et al., 2021, ATel, 15111
Rafanelli, P., Rosino, L., 1978, A&AS, 31, 337
Rudy, R., Subasavage, J., Bayless, A., et al., 2021, ATel, 14482
Schwarz, G. J., Ness, J.-U., Osborne, J. P., et al., 2011, ApJS, 197, 31
Selvelli, P., Gilmozzi, R., 2019, A&A, 622, A186
Shore, S. N., Teyssier, F., Garde, O., et al., 2021a, ATel, 14622
Shore, S. N., Buil, C., Dubovsky, P., et al., 2021b, ATel, 15577
Sokolovsky, K. V., Aydi, E., Chomiuk, L., et al., 2021a, ATel, 14530
Sokolovsky, K. V., Aydi, E., Chomiuk, L., et al., 2021b, ATel, 14731
Sokolovsky, K. V., Aydi, E., Chomiuk, L., et al., 2022a, ATel, 15150
Sokolovsky, K. V., Aydi, E., Chomiuk, L., et al., 2022b, ATel, 15518
Taguchi, K., Maehara, H., Isogai, K., et al., 2021a, ATel, 14472
Taguchi, K., Isogai, K., Shibata, M., et al., 2021b, ATel, 14478
Van den Bergh, S., Younger, P. F., 1987, A&AS, 70, 125
Warner, B., 1995, Cataclysmic Variable Stars, Cambridge Univ. Press.
Williams, R. E., 1992, ApJ, 104, 2
Woodward, C. E., Banerjee, D. P. K., Evans, A., 2021, ATel, 14665