boxgray
\TPMargin5pt
{textblock}0.8(0.1,0.02)
If you cite this paper, please use the Euro S&P reference:
M. Nawrocki, J. Kristoff, R. Hiesgen, C. Kanich, T. C. Schmidt, and M. Wählisch.
2023.
SoK: A Data-driven View on Methods to Detect Reflective Amplification DDoS Attacks Using Honeypots.
In Proceedings of Euro S&P ’23. IEEE, Piscataway, NJ, USA.
SoK: A Data-driven View on Methods to
Detect Reflective Amplification DDoS Attacks Using Honeypots
Abstract
In this paper, we revisit the use of honeypots for detecting reflective amplification attacks. These measurement tools require careful design of both data collection and data analysis including cautious threshold inference. We survey common amplification honeypot platforms as well as the underlying methods to infer attack detection thresholds and to extract knowledge from the data. By systematically exploring the threshold space, we find most honeypot platforms produce comparable results despite their different configurations. Moreover, by applying data from a large-scale honeypot deployment, network telescopes, and a real-world baseline obtained from a leading DDoS mitigation provider, we question the fundamental assumption of honeypot research that convergence of observations can imply their completeness. Conclusively we derive guidance on precise, reproducible honeypot research, and present open challenges.
Index Terms:
Honeypot, DDoS, Amplification Attacks, Systemization of Knowledge1 Introduction
Distributed Denial of Service (DDoS) attacks are a serious threat to the Internet infrastructure. Reflective amplification attacks [1, 2], a specific DDoS type, are a unique burden since they allow an attacker to trigger large traffic volumes from third parties by exploiting protocol mechanics rather than hijacking hosts. Over the last many years, amplification attacks have been responsible for a significant number of attacks [3].
A common approach to detect amplification attacks in the wild is the deployment of honeypots [4]. They mimic application protocols such as DNS and NTP that are susceptible to amplification attacks, wait for attackers to interact, and then log attack traffic attempting to abuse them as amplifiers. Amplification honeypots may be able to infer the size of attacks based on traffic patterns as well as identify the victims they are instructed to reflect toward.
Research on amplification honeypots is usually guided by three questions to evaluate whether honeypots are a viable tool. First, which heuristics identify packets that correspond to an attack in a train of packets captured by honeypots (attack detection)? Second, how many honeypot sensors are necessary to capture a stable amount of events (honeypot convergence)? Third, do sensors capture a representative view of Internet-wide attacks (completeness)? These aspects should be considered separately. Attack detection, for example, might be accurate on a given data set, while the data set does not include all attacks.
Surprisingly, our community mixes detection, convergence, and completeness. For more than ten years, we have been holding the common belief “[t]he more honeypots we deploy, the more likely one of them is contacted” [5]. Even with the advent of amplification honeypots we still believe that we can nearly achieve completeness: “This shows that—per mode—we had enough honeypots to cover most attacks out there.”[6], “[…] as many as 150 honeypots are needed to capture 99% of actor behavior” [7], “[…] our reflectors can see between 85.1% and 96.6% of UDP reflection attacks” [8]. A key insight of this paper is that reality is different.
In this paper, we revisit the long-held beliefs about the visibility and attack detection precision of honeypots. We combine two different methods by (i) systematizing and contextualizing existing knowledge and (ii) implementing a data-driven approach, which clearly shows that common beliefs do not hold.
Based on an extensive literature study, we select six amplification honeypots and compare them. The six honeypot platforms were used in security studies when analyzing reflective-amplification attacks based on honeypot data. They have been published, cited recently, and had a notable impact on security research. We implement three steps. (i) We survey the honeypot deployment configurations that enable observations, e.g., the number of honeypot sensors deployed and the geographical and topological distribution of the platform, (ii) we describe the attack definitions that are used to understand the observations, and (iii) we assess the rationale behind the argument that the deployed honeypot achieves completeness.
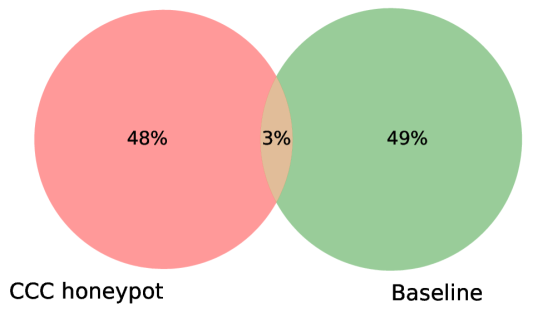
To bolster our arguments, we conduct a data-driven approach. Our data corpus covers three months and includes measurements from a large-scale honeypot, four network telescopes distributed in the US and Europe, and baseline real-world alerts from a leading DDoS mitigation provider. Figure 1 motivates this approach. It shows the overlap of victims under attack monitored by a well-known research honeypot project and a baseline of attacks against customers of a leading DDoS mitigation provider. The overlap is small, and most importantly the honeypots do not capture a significant portion of attacks targeting real-world networks, even though a honeypot could capture those incidents in principle.
Contributions
In a nutshell, our systematization of knowledge stresses that the research community could benefit from a framework that allows for algorithmic assessment of honeypot deployments and, to assemble packets captured by honeypots to malicious flows, from attack detection heuristics that adaptively incorporate deployment properties. Our key contributions are:
-
1.
We explore the comparability of the attack detection thresholds used by six honeypot platforms, and place them in the complete threshold space. All thresholds but one produce similar results.
-
2.
We present a systematic approach to analyze data collected by honeypots. We identify the key properties that should be considered and documented to improve reproducibility of future honeypot research.
-
3.
We show that honeypot convergence, a frequently used measure, is a poor indicator for the completeness of observations. This metric is statistically unstable. Sizable honeypot platforms only observe up to 11% of baseline attacks.
-
4.
We find that current honeypot deployments do not significantly benefit from better attack detection thresholds because attackers simply do not interact with honeypots. This may help to improve the placement of honeypot sensors in the future.
-
5.
We discuss how amplification features of protocols can influence honeypot observations and analysis.
Outline
The remainder of this paper is guided by our research questions, see Table I. We present basic background in § 2, introduce our method in § 3, and survey common honeypot platforms in § 4. In § 5, we present the data sets that we use for our data-driven analysis, We revisit attack detection, convergence, and completeness in § 6 to § 8. In § 9, we present further deployment dimensions of honeypots. We discuss our findings comprehensively and provide further guidance in § 10, and conclude in § 11.
| SoK | Research Question | Section |
| Introduce | Which kinds of attacks and monitoring exist? | 2 |
| Compare | How are amplification honeypots deployed? | 4 |
| Compare | How are attacks inferred? | 6,6.1 |
| Compare | How are comprehensive measurements justified? | 6.3,7 ,7.1 |
| Evaluate | Do different attack thresholds skew the results? | 6.2 |
| Evaluate | Do honeypots observe all attacks? | 7.2,7.3,7.4,8.1 |
| Evaluate | Do we need more precise attack thresholds? | 8.2,8.3 |
| Discuss | What makes measurements prone to errors? | 9 |
| Discuss | What do we recommend for future work? | 10 |
2 Problem Statement and Background
2.1 Distributed Denial of Service (DDoS) Attacks
Denial of Service (DoS) attacks impair the network availability of their victims. This is achieved by resource exhaustion caused by overloading the infrastructure with excessive traffic volume or connection state at the victim. Attackers either set up genuine communication channels with the victims or spoof IP source addresses to obfuscate their attacks. Both methods are typically conducted using a distributed botnet. Two attack types exist, each of which take advantage of the first round-trip time when a server responds to client requests.
(i) State-building, randomly-spoofed attacks such as TCP SYN or QUIC Initial floods. Each spoofed request can trick the server into setting up a new connection context for non-existent clients. The network stack will maintain all currently active connections, including those from spoofed sources, which fill up the connection queues and cause legitimate requests to fail. Since the server tries to respond to each connection request, it will send backscatter, e.g., TCP SYN/ACK or QUIC (server-) Initial packets, to the spoofed addresses. TCP SYN cookies and QUIC RETRYs may mitigate those attacks [9, 10].
(ii) Distributed Reflective amplification attacks (DRDoS) combine targeted address spoofing and protocol mechanics of public services such as DNS and NTP to amplify response traffic to the victim. In a DRDoS attack, request packets with the spoofed source address of the victim are sent to public third-party servers. These servers act as amplifiers since responses to the victim can be be many times larger than the original request [1]. For example, a typical DNS query packet is about 100 bytes, but a response to an IN ANY query can often exceed 2000 bytes in practice. Attackers seek to minimize the request volume towards amplifiers whilst maximizing the response volume reflected to the victim. This may congest network links along the path to the victim.
Attack Popularity over Time
Conceptually, DRDoS was already utilized in 1997 with ICMP smurf attacks. However, direct-path SYN-floods remained the most popular DDoS attack vector from 1996 to 2018 and were then overtaken by DNS reflection-amplification in 2018. This popularity was due to (i) the commercialization of this attack type by booter services, making it available to the non-tech-savvy public, and (ii) easier and faster detection of amplifiers based on ready-to-use tools implementing state-less, Internet-wide scans.
2.2 Honeypots and Network Telescopes
Honeypots
Honeypots are decoy computer resources whose value lies in being probed, inciting interaction with attackers, and possibly getting compromised [5]. They are not a preventive countermeasure such as firewalls but a way to detect the presence of actions that harm a system. Since honeypots do not offer production-critical services, all connections to the honeypot are inherently suspicious. This enables easy detection of an unauthorized probe, scan, or attack, because malicious actions are not buried in the vast amount of legitimate production activities.
Honeypots can be classified along two dimensions, based on the level and type of interaction they offer. First, based on the level of interaction the delineation is (i) low-interaction honeypots, (ii) medium-interaction honeypots and (iii) high-interaction honeypots. Low-interaction honeypots offer only a minimal response-behavior, e.g., they only perform transport-layer handshakes. Medium-interaction honeypots extend this behavior by emulating vulnerable services or partially exposing vulnerable components, i.e., they produce valid replies for specific applications. Given the reduced interaction capabilities in low- and medium-interaction honeypots, the chances of compromise are minimal, which eases deployment. High-interaction honeypots offer unrestricted, real operating system environments. They are more complex to implement, deploy, and maintain. They enable, however, forensics to fully observe the behavior of malware, e.g., bots, or ransomware.
Second, based on the type of interaction they offer, honeypots are classified into (i) server and (ii) client honeypots. Server honeypots wait for an incoming connection. They may not advertise services explicitly, more likely they are discovered before the attack, usually using lightweight scanning or probing that involves higher layer protocols. In contrast, client honeypots actively search for suspicious entities and solicit interaction with them, such as web crawlers visiting malicious websites.
Honeypot classification is largely academic. Since many honeypot variants exist, a distinction is not always possible, nor practical. In practice, the terms for low- and medium-interaction honeypots are often used interchangeably.
Methods to distinguish attacks from other types of traffic collected at honeypots have been proposed. With the advent of reflective amplification attacks, server honeypots for the the sole purpose of capturing DRDoS attacks have been designed, implemented, and deployed. We discuss amplification honeypot platforms in detail in § 4.
Network telescopes
Network telescopes [11, 12, 13, 14, 15, 16] are an unsolicited traffic measurement approach that captures incoming traffic to otherwise unused address space within a larger network segment. These typically cover between a /8 and /24 of IPv4 address space. Originally, network telescopes were fully passive and the network segments were never used to originate any traffic. They capture both backscatter traffic (i.e., replies to spoofed addresses of the telescope) and scan traffic. With the increased deployment of malicious two-phase scanners [17], i.e., attackers that first check whether a TCP service is available before they initiate application requests, reactive telescopes have been proposed [18]. Reactive network telescopes implement the TCP connection handshake to gain additional knowledge about the attacker, since the attacker will proceed with an application layer request.
2.3 Monitoring Spoofed DDoS Attacks
When monitoring traffic two crucial questions arise. (i) Where should network probes be deployed? (ii) Which packets belong to which type of event (e.g., scan, attack)?
Non-spoofed traffic, or direct-path attacks, can only be observed by systems that are deployed between the attack source, the destination target, or at the endpoints. For example, an appliance to mirror traffic might be located alongside a victim service, at a network ingress port, or within an Internet exchange point. Collecting on-path observations is a challenge for most researchers and the ability to capture related but distinct direct-path attacks can be difficult. In contrast, reflective attacks allow for broader observations because they involve triangular packet flows with the host sending a spoofed packet, a reflector (e.g., honeypot) of the spoofed packet, and the victim host receiving the response to a spoofed request.
Many reflective amplification attacks rely on amplifier lists to quickly and successfully conduct attacks. The lists are commonly curated by third parties and sold to attackers. These lists may contain a subset of all known and currently active amplifiers. When monitoring amplification attacks, an amplification honeypot should emulate amplifier behavior to be appealing to attackers. To minimize harm, amplification honeypots typically apply a rate limit to satisfy amplifier discovery, while avoiding the reflection of meaningful attack traffic to a victim.
3 Methodology
We now describe our methodology to systematize, contextualize, and evaluate research about amplification honeypots.
3.1 Systematization and Contextualization
Our systematization of knowledge aims for an overview and systematic comparison of amplification honeypot research. This systematization is based solely on previously published work, describing presented methods, data sources, and deployments. Our framework includes the following parts.
Selecting honeypot research
We select six honeypot platforms by conducting a systematic literature review searching venues dedicated to security (i.e., Oakland, EuroS&P, Usenix Sec, CCS, NDSS) and measurement (i.e., IMC, PAM, TMA) research, as well as broader networking venues (e.g., SIGCOMM), covering the last ten years. The six honeypot platforms and configurations discussed in this paper are seminal for research on amplification attacks.
Comparing honeypot deployments
We compare honeypot deployments by their setup configuration, i.e., number of sensors, duration of deployment, and the geographical as well as topological distribution. Moreover, we describe which protocols are supported by the honeypots.
Comparing attack inference
We introduce precise language for describing heuristics that infer attacks from a sequence of packets captured by honeypots. Then, we show the attack definitions applied by the various honeypot deployments, i.e., what are the exact attack thresholds and how are these conveyed in each publication.
Comparing completeness claims
By considering a realistic attack volume and protocol properties as well as public knowledge about the number of deployed amplifiers, we deduce that attackers can easily impede detection by honeypots. We show how honeypot research still collectively claims nearly complete attack visibility, despite the lack of ground-truth attack data and the possibility that attackers may hide.
3.2 Data-driven Evaluation
We extend our SoK by conducting a data-driven evaluation. This is necessary because key methods and assumptions in honeypot research cannot be validated without external observations. Based on results derived by our contextualization (see § 3.1), we identify further research questions and explore them. In detail, (i) we analyze whether different attack thresholds used in prior work have a significant effect, (ii) we verify whether honeypots observe all Internet-wide attacks, and (iii) we explore the possibilities to improve thresholds.
Evaluating attack thresholds
We assess the comparability across honeypot projects by describing and analyzing the effects of various flow identifiers and attack thresholds. To this end, we apply both flow identifier types used in honeypot research. We then explore the effects of the complete threshold configuration spectrum w.r.t. temporal (i.e., timeouts) and volumetric (i.e., packet number) properties. We do this on the dataset obtained by the CCC honeypot platform.
Evaluating attack completeness
The stability of observations (honeypot convergence) is used to justify that honeypot sensors capture a representative view of all Internet-wide attacks (completeness). To validate this, we first review the convergence metric by an optimal, best-case analysis and then proceed with a randomized approach. Following this, we check whether the (converging) CCC honeypot platform observes a set of baseline attacks against customers of a leading DDoS mitigation provider.
Evaluating detection potentials
We evaluate whether attack detection thresholds can be improved. We do so by correlating honeypot, telescope, and our baseline data sets. First, we use the DDoS baseline and try to optimize towards this data set, i.e., we improve the honeypot attack detection (but risk over-training towards this specific baseline). By adopting very permissive thresholds, we infer the upper bound of attack detection. Second, we use telescope baseline data to infer whether attack detection thresholds for honeypots already effectively remove baseline scan events.
4 Amplification Honeypot Platforms
We now describe some of the best known honeypot deployments as originally presented in their publications. They implement attack detection mechanisms to identify reflective amplification attacks based on the packets they receive. These detection mechanisms, see § 6, can be applied on any data but were presented alongside the data collection platforms described here.
AmpPot
AmpPot [6] deploys 21 sensors supporting nine protocols. The sensors are primarily deployed in ISP environments with half located in Japan and the others spread globally. These sensors are usually configured with static IP addresses, but a quarter receive dynamic addresses with lease times of up to 51 days. An AmpPot sensor can operate in three modes: (i) emulated runs a partial, internal implementation of the protocol, (ii) proxy forwards to a separately deployed service, or (iii) agnostic amplifies with random data independent of the protocol.
AmpPotMod
AmpPotMod [19] uses a subset of the original AmpPot deployment: eight sensors running in proxy mode (except for SSDP) deployed at ISPs in Japan. The sensors support up to six amplification protocols and use dynamically assigned IP addresses.
CCC
The Cambridge Cybercrime Center (CCC) [8] platform is a distributed honeypot platform that supports eight protocols. For NTP and DNS, the sensors proxy to real services. In other cases they respond with a limited, emulated answer. The number of sensors fluctuates over time with a median of 65 active sensors (currently 50). Sensors are spread across 10 countries in academic and cloud networks, located in 31 IP prefixes in 8 ASes. 16 sensors are deployed in their own /28 subnet. The remaining sensors are deployed at low-cost cloud providers and in a handful of consumer ISPs.
NewKid
The NewKid platform [20] deploys a single sensor supporting 9 protocols in a university network. The sensor operates in proxy mode for Memcached and DNS, and emulates responses for other services.
HPI
The HPI platform [7] deploys a total of 549 honeypots distributed over five cloud providers and across four continents. The sensors support six protocols (emulated and proxied) in four different modes that signify the protocol correctness and the amplification factor: (i) real-small (ii) real-large (iii) fake-small and (iv) fake-large.
It is worth noting that all platforms deploy a form of rate limiting to minimize adverse effects. Table III summarizes the setup properties of the different honeypot platforms.
Impact on other research areas
The groundwork on amplification honeypots was published in three consecutive years, AmpPot [6] in 2015, AmpPot Mod [19] in 2016, and CCC [8] in 2017, followed by HPI [7] in 2021. According to Google Scholar, the oldest honeypot, AmpPot, has been cited the most, reaching nearly three times the citation count of the others. With a few exceptions, all papers are cited in security-related research but have had influence in multiple, related areas. The most impactful citations of AmpPot relate to research on technical aspects of DoS, while AmpPotMod and CCC receive more attention from adjacent areas such as CRIME-related research. Measurement research has more commonly cited AmpPot and CCC compared to AmpPotMod.
5 Data Sets for Data-driven Evaluation
We now introduce our data sets, which are summarized in Table II.
| Data Source | Attack Thresholds | Convergence | Completeness |
| (§ 6.2) | (§ 7) | (§ 8) | |
| CCC Honeypot Events | ✓ | ✓ | ✓ |
| DoS Mitigation Provider | ✓ | ||
| US & EU Telescopes | ✓ |
5.1 Honeypot Data
We use data from the CCC honeypot platform. CCC supplies two types of log formats. First, a list of victims inferred by applying the default CCC thresholds. Second, a list of all event summaries per sensor. We analyze the second list for testing various thresholds and validate our scripts with the first list by applying the default CCC thresholds and inferring the same victims as CCC did.
We also check whether the CCC platform operated without interruptions. This eliminates a possibly skewed convergence behavior due to external reasons, i.e., a honeypot sensor running only during a fraction of the measurement period would always observe different attacks than a second sensor running at different times.
5.2 Telescope Data
Scanning observations vary between telescopes that differ by topological and geographical properties [18]. This is why we use a /24 telescope from the US and three /24 telescopes from the EU. In total, 85% of the CCC honeypot sensors are deployed in these regions, which enables a fair comparison.
Our analysis is based on the assumption that telescopes primarily observe scan traffic for UDP. Because network telescopes are fully passive, scanners do not detect open amplifiers in these networks, which could be misused in a subsequent attack event. This means we do not expect spoofed traffic arriving at the telescope. Moreover, attackers sending spoofed queries to a telescope would effectively waste their resources because there is neither reflection nor amplification possible. This makes telescopes a suitable vantage point to identify UDP scanners.
In addition to amplification attacks, other UDP (non-scanning) traffic can be monitored at network telescopes. In 2015, a total of 134 DNS-based amplification attacks have been inferred during a period of 6 months [21]. However, only a handful of these attacks have been verified and most attacks exhibit properties of aggressive scanning rather than attacks, i.e., the number of targeted unique dark addresses equals the number of total packets sent. These observations might be due to the early stage of detection methods of amplification attacks, which, at that time, did not account for fast scanning methods [22].
The deployment of the protocol QUIC [23] recently changed UDP traffic properties at telescopes. Although QUIC runs on top of UDP, it requires a handshake to initiate connections, making it susceptible to state-overflow attacks [10]. This means that we observe DoS backscatter targeting UDP in addition to TCP services. Identifying QUIC backscatter is easy, however, because attacks originate from the default QUIC port and a specific group of content servers. Furthermore, they contain fingerprintable data [10]. Overall, QUIC backscatter does not interfere with our measurements.
Lastly, accidental misconfigurations might lead to UDP traffic at the telescope. We argue that such events are rare and unlikely to reach the ports associated with amplification attacks. However, we cannot completely exclude them.
5.3 DDoS Baseline Data Set
We collaborate with the world’s largest DDoS mitigation equipment provider with a reported global market share of over 20% in 2020. We receive partially anonymized attack information under a non-disclosure agreement for popular amplification protocols during our main measurement period. In total, we are able to observe all reported attacks for the protocols supported by the CCC honeypots.
The data provided by the mitigation company is based on a DDoS appliance deployed on the direct links between customers and their upstream providers, i.e., they are able to observe all external attacks targeting end hosts in the customer networks. Attack detection is based on observing volumetric peaks and well-known attack vectors to identify anomalous traffic changes. It involves customer feedback, which is important for mitigation (traffic scrubbing), since scrubbing could lead to unwanted packet loss in case of false positives.
Our data set includes start and stop time of an alert, attack type, and flow selection criteria. For each attack event, we obtain the list of protocols misused, destination prefixes receiving traffic as observed by the sensor, but without a detailed breakdown of traffic volumes by target. Although inferring the specific targets and the impact from attack from this list is usually not possible it can be utilized for longitudinal validation. For each attack inferred at the honeypot, we can check whether it is covered by a mitigation provider attack event and one of its prefixes. More specifically, the victim is visible as the source of requests at the honeypot and the destination of attack traffic at the DoS mitigation sensor.
Quality of the baseline
To evaluate the precision of thresholds that are used to detect amplification attacks at honeypots, ground truth data is necessary. Such data has to be created independent of the honeypots since choosing one honeypot as a point of reference for multiple honeypot platforms will lead to ambiguity for two reasons. First, each honeypot platform depends on thresholds. Second, no single configuration can be selected as the better reference point without attack event verification. Unfortunately, there is no public source of ground truth data for DoS-victims and attack events. Such information is often considered private and may inflict unexpected cascading effects, e.g., a victim might experience a loss of customers due to a decreased trust in its systems, or other attackers might be encouraged to launch follow-up attacks on weakened systems. Furthermore, a complete view of DoS attacks is difficult to obtain, because even with large honeypots, attacks often only use a very small subset of reflection-capable systems. So although research-based methods to observe DoS attacks are documented publicly, their inferred list of victims often remains private or limited due to vantage point bias.
Companies, such as our data provider, offering DoS traffic mitigation services and equipment are in a unique position to identify DoS victims. These mitigation providers typically operate on the aggregates of traffic paths and relay points (i.e., routers), observing traffic en route rather than having to reside in an endpoint that may or may not be involved in an attack. These aggregate observation points have the advantage of scale, with the ability to observe and correlate attack events across an array of covered systems and networks. Mitigation providers typically have aggregate traffic sensors deployed at a variety of customer sites. Anomalous traffic that is detected can be reported, and may eventually trigger automatic mitigation such as blackholing [24] or traffic scrubbing [25]. Although such mechanisms are also based on heuristics in practice, operational data based on such mechanisms produces a confirmed set of victims due to its immediate mitigation actions. In practice, a detected attack (i) triggers a report that alerts the customer and optionally (ii) activates an automatic countermeasure to protect the target from the attack. False-positives would lead to unhappy and fewer customers, especially because some mitigation services charge by the volume of traffic sanitized. Also, false-negatives would be reported by the customer (since its service still experiences quality degradation because of DoS traffic), which ultimately leads to fine-tuning of thresholds and better detection.
We call our data baseline for two reasons. First, during our measurement period, no customer complained about false positives, so we believe that the detection accuracy is very high. Second, we also believe that this data set provides a representative visibility into attacks because the DDoS mitigation company has a 22% market share, and its customers are internationally and topologically (small, medium, large networks) distributed.
Given that the events included in our baseline data set are attacks, honeypot platforms claiming complete coverage should be able to detect these events (and maybe more).
6 Detecting Attacks
Attackers unwittingly use amplification honeypots as reflectors to conduct attacks. This helps honeypot operators to observe and quantify attacks. To distinguish attack packets from scanning and general Internet background radiation (IBR), honeypots group packets into ”flows” using a flow identifier (id). Attack thresholds then identify flows that likely belong to an attack.
Flow ids can be created using commonalities among packets such as the combination of source/destination address and source/destination port pairs. Traditional Internet applications minimally use a five-tuple flow id (IP protocol, address pair, port pair) to group flows, but all fields in the IP header, UDP header, and abused protocol could be used. Minimizing the number of flow id fields while correctly classifying all packets in a group maximizes efficiency.
In a reflective attack, the request packets an attacker sends will contain a spoofed source address. The spoofed address becomes the destination (victim) for amplified response packets. This is achieved by handcrafting packets, which requires the attacker to set all fields to protocol-conforming values. Attackers may randomize field values that may vary by operating system or at run-time, such as the IP ID field or UDP source port, in order to complicate packet classification at the honeypots.
Among packets to a honeypot the flow-id of a typical UDP-based amplification attack requires, (i) a spoofed source address associated with a victim, (ii) a destination IP address of the amplifier (or honeypot), (iii) the destination port that maps to the abused protocol on the amplifier, and finally (iv) the source port, which can be chosen freely by the attacker. Note, carpet bombing attacks, which target IP prefixes as opposed to a single victim address, may spoof some portion of the most-significant-bits in a source address in order to randomize additional bits in the flow-id.
Other fields, such as the IPv4 ID or TTL can similarly be chosen at random or set to commonly used values to avoid raising suspicion. Research shows that some botnets use recognizable values for the source port, TTL, or DNS values [19]. For example, the ports 80 and 123 are often found paired with NTP (port 123) attacks [26, 6, 19] and make up more than 50% of the attacks together. Protocol specific observations show that source port selection differs among protocols [7]: attacks using CharGen, QOTD, RIP, and SSDP exhibit a hard-coded, stable paired port almost exclusively while NTP and DNS attacks show a larger range of randomized ports (about 50%). Overall, the selected source port in the request packets of an attack may be useful to track a specific pattern belonging to an attack entity, but is otherwise unsuitable as a more generic traffic classifier.
| Honeypot Project | Setup | Flow Identifier | Attack Thresholds | ||||||||
| Sensors | Distributed | IP Prefix | IP Address | Port | Idle Timeout | Packet Load | |||||
| [#] | Geo | Topo | Src | Dst | Src | Dst | Src | Dst | [minutes] | [packets] | |
| AmpPot [6] | 21 | ✓ | ✓ | ✘ | ✘ | ✓ | ✘ | ✘ | ✓ | 60 | |
| AmpPotMod [19] | 8 | ✘ | ✓ | ✘ | ✘ | ✓ | ✘ | ✘ | ✓ | 10 | |
| CCC [8] | 65 | ✓ | ✓ | ✘ | ✘ | ✓ | ✓ | ✘ | ✓ | 15 | |
| NewKid Mono [20] | 1 | ✘ | ✘ | ✓ | ✘ | ✘ | ✓ | ✘ | ✓ | 1 | |
| NewKid Multi [20] | 1 | ✘ | ✘ | ✓ | ✘ | ✘ | ✓ | ✘ | ✘ | 1 | ports & |
| HPI [7] | 549 | ✓ | ✓ | ✘ | ✘ | ✓ | ✓ | ✘ | ✓ | 1 | honeypots & |
| Attack Configuration | Attack Detected | |||||||||
| UDP Port | Protocol | Request Size | Ampl. Factor | # Amplifiers | Reqs/Attack | Reqs/Amplifier | AmpPot(Mod) | CCC | NewKid | HPI |
| 17 | QOTD | 15 Bytes | 140 | 31k | 17.9M | 576 | ✓ | ✓ | ✓ | ✓ |
| 19 | CharGen | 15 Bytes | 356 | 30k | 7.0M | 234 | ✓ | ✓ | ✓ | ✓ |
| 53 | DNS | 37 Bytes | 41 | 1.9M | 24.7M | 13 | ✓ | ✓ | ✓ | ✘ |
| 123 | NTP | 13 Bytes | 557 | 2.3M | 5.2M | 2 | ✘ | ✘ | ✘ | ✘ |
| 389 | LDAP | 52 Bytes | 63 | 8k | 11.4M | 1430 | ✓ | ✓ | ✓ | ✓ |
| 1900 | SSDP | 90 Bytes | 31 | 1.9M | 13.4M | 7 | ✘ | ✓ | ✓ | ✘ |
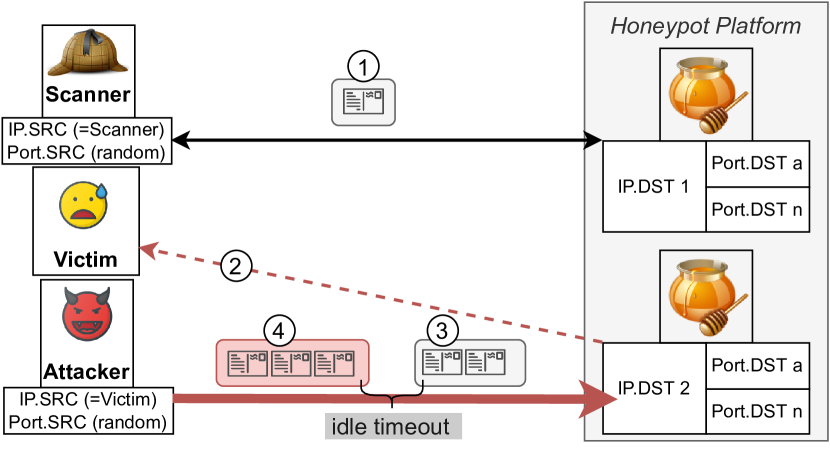
Figure 2 puts the flow identifier into context. A honeypot platform is built from multiple sensors that receive packets from a variety of sources such as scanners . The goal is to identify packets that are not just information gathering but used to attack victims via reflection attacks. Packets in the same flow-id can then be grouped together based on an idle timeout, which determines the maximum interval between two packets belonging to the same flow or to a different flow . Finally, only flows that contain a minimum packet load are considered attack flows .
We now introduce the various attack definitions from related work. See Attack Thresholds in Table III. Note, attack definitions are independent from the deployments described in § 4. Data from any deployment can be combined with any attack-detection method. However, we use the names of the original publications to distinguish them.
6.1 Current Methods
CCC considers a flow as an attack flow if it contains at least five packets per sensor within an idle timeout period of 900 seconds. This is in contrast to AmpPot, which defines higher thresholds: An attack flow must contain at least 100 packets with an idle timeout of 3600 seconds or 600 seconds when observed across all sensors. CCC and AmpPot use the source address and the destination port to assign a flow id to multiple packets. CCC also considers the destination address, i.e., the sensor, as an additional restriction to classify packets into an attack flow.
NewKid describes two types of attacks, monoprotocol and multiprotocol attacks. We use the labels NewKid Mono and NewKid Multi to distinguish them. Mono requires five packets in an attack flow with an idle timeout of 60 seconds. The Multi variant extends this definition to include packets that have at least two different destination ports within the idle timeout period. To account for carpet bombing attacks, i.e., attacks hitting multiple addresses in the same IP prefix, the flow id uses the source IP prefix, instead of the address, combined with the destination IP address and, for Mono, the destination port. CCC is also able to infer carpet bombing attacks but only if 16 individual attack flows target victims in the same /24 prefix.
HPI applies an idle timeout of one minute, a packet load of at least 20 packets, and requires activity observed by at least two sensors. Although their flow id is defined per-sensor, they require at least two overlapping flows.
How to (not) present thresholds
We find a recurring pattern that attack thresholds are insufficiently justified. We acknowledge that rigorous thresholds are hard to identify without ground truth. Unfortunately, there is little to no discussion on the effects of the chosen thresholds. Documenting its effects is possible without ground truth and certainly would help the reader in future research.
The AmpPot paper includes a definition paragraph, specifying the minimum flow filter threshold, stating sources [must send] at least 100 consecutive requests to our honeypots [6]. The authors claim that this is a conservative threshold but do not provide further details on the reasoning or the number of events this configuration excludes. We believe it is based on their analysis of telescope traffic and the behavior of large-scale scanners contacting at least 64 dark addresses on the same port. They find that roughly 94% of the scanners send less than two packets per IP address on average.

In AmpPotMod, the authors reduced the idle timeout to analyze attack duration with a more fine-grained approach [19]. It remains unclear how this change affected their results, e.g., the number of detected attacks.
CCC [8] selected their idle timeout to loosely correspond with the availability of short lived attacks (under an hour) from booter systems. However, they do not provide an analysis to validate their choice of threshold.
The NewKid paper illustrates that thresholds were established empirically [20] by manually analyzing three weeks of traffic. The authors infer three traffic classes (slow, fast, bursty) and try to classify the first class as scanner and the remaining classes as attacks. The description lacks detail on this inference and the automatic classification in particular. It remains unclear how the victim CIDR blocks are selected.
The HPI team states that they experimentally derived that actors use up to 20 packets from the same source IP address [7], but no further explanation is given about the experiment setup.
All papers include basic reasoning of the chosen attack thresholds. While the adjustable parameters are similar, the reasoning for different choices of flow id, packet load, and idle timeout remain unclear in practice. We highly encourage future work to use appendices to provide a more detailed analysis. This will enable the community to reproduce data selection processes and inferences.
6.2 Comparability of Attack Thresholds
We now systematically analyze the effects of various flow identifiers and attack thresholds to assess the comparability across research projects. We distinguish between sensor-based and platform-based flow-identifiers. Although we include all threshold configurations from related work, we will focus on the CCC and AmpPotMod configurations. Their publications have a wide reach and they differ in a key aspect: the CCC flow identifier is applied per-sensor whereas AmpPotMod is applied per-platform. Please note that we do not use ground truth data but rather explore the effects of the configuration spectrum. The dataset contains packets obtained by the CCC honeypot platform.
Counting attack flows misleads
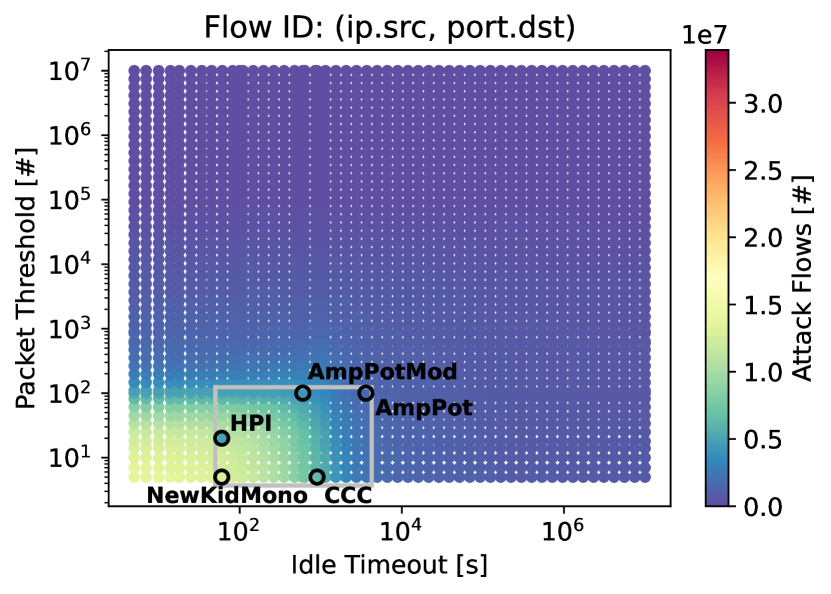
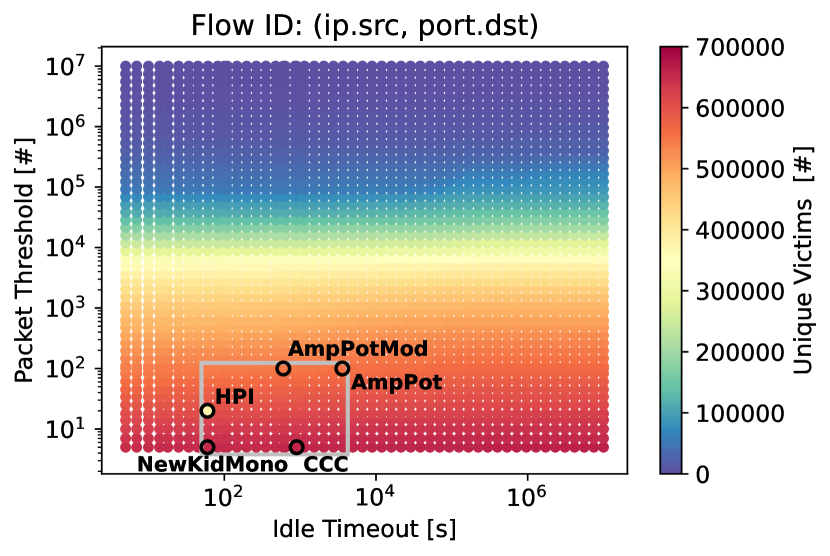
First, we show the number of attack flows for different thresholds, see Figure 3. The heat map shows the number of identified flows on the z-axis as a function of the idle timeout in seconds (x-axis) and the packet threshold (y-axis). The maximum x-axis value is around which correlates to the complete measurement period of the dataset. A grey square marks the area for the thresholds listed in Table III. The left figure uses the CCC flow identifier, i.e., source address, destination address, and the destination port applied per sensor, whereas the right figure uses the AmpPot flow identifier, i.e., source address and destination port applied across the whole platform. For NewKid, we only show the Mono variant because it was predominantly used in the paper. The value for the HPI thresholds is visually striking, because we additionally include the requirement of at least 2 honeypots sensors for this data point.
We infer two findings: (i) The platform-based flow identifier counts less attack flows because it groups packets across different sensors into the same flow instead of counting the flows per sensor – provided attacks utilize multiple sensors. We find 12.9M attack flows with AmpPotMod thresholds and 30.3M with CCC thresholds when applied to the per-sensor flow ids (3(a)), and 4.4M and 6.4M attack flows when applied to the per-platform flow ids, respectively (3(b)). (ii) Longer idle timeouts only affect the attack flow count up to seconds (3 hours), but have negligible effect thereafter. At that point short consecutive attacks are likely grouped into a single flow. The idle timeout has a stronger effect on the per-sensor flow identifier because it is less likely to observe packets at the same sensor.
Detected victims uncover high similarity
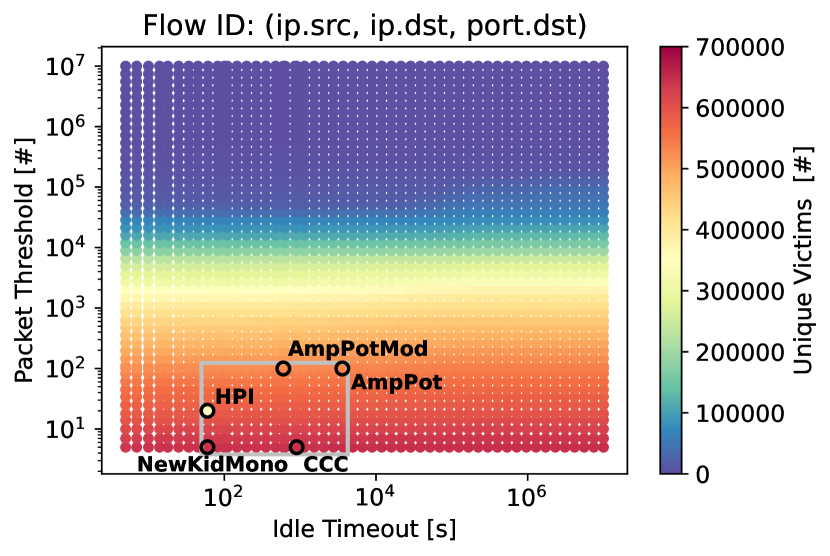
We now analyze the number of detected victims, see Figure 4. The figure uses the same and -axis as Figure 3 but shows the unique victim count on the -axis (the maximum is two orders of magnitude lower). Instead of counting attacks or attack flows—which are heavily influenced by the choice of flow identifier: per-sensor vs per-platform—we count the number of victims. Since both approaches are run on the same data, measurements are comparable. Note, that the number of victims should be a lower bound of the attack numbers. The idle timeout still affects results as a long idle timeout might group packets from low volume scanners into attack events, thus potentially generating victim artifacts.
For the per-sensor flow identifier, we find 644k victims using the CCC threshold and 531k victims using the AmpPotMod threshold. For the per-platform flow identifier, we find 654k and 549k victims, respectively. By comparing the respective configurations (CCC flow identifier and CCC thresholds versus AmpPotMod flow identifier and AmpPotMod thresholds) we find only a difference of 15%. Visually, both configurations are present in the same cluster and gradient. Reassuringly, this means that the results of the various honeypot platforms are indeed comparable. An exception to this finding are the HPI thresholds, which require at least two sensors to observe attacks. This leads to a 45% smaller victim set.
6.3 Evading Threshold-based Detection
Current studies (see § 4) apply a single threshold configuration that is independent of the misused protocol. The CCC honeypot detects NTP (60%), LDAP (31%), and DNS (4%) as the most popular amplification protocols in 2022. This observation confirms common expectations, which assume attackers choose protocols that allow for high amplification and provide a rich amplifier infrastructure. NTP, for example, does not only provide the highest amplification factor and many amplifiers but also mega-amplifiers [26], i.e., hosts that exhibit a significantly larger amplification factor due to their configuration, making this protocol most appealing to attackers.
The use of a protocol-independent threshold is surprising, though, since each protocol exhibits features (i.e., amplification) and deployment (i.e., instances in the wild) that may be leveraged by attackers in different ways. We now analyze the attacker potentials to impede detection by honeypots. We do not use honeypot measurements but model a realistic attack volume and utilize protocol properties as well as public knowledge about the number of deployed amplifiers—similar to what attackers can do.
We assume a simple attacker model: attackers try to minimize exposure by reducing the load per amplifier while still achieving a desired traffic load. Given a set of amplifiers and a target attack load, an attacker uniformly distributes connection requests among all amplifiers. Based on this model, we infer the number of expected packets per amplifier for an attack load of 1 Gbit/s lasting 5 minutes. This attack scenario is realistic and produces more traffic than the majority of attacks: (i) Although new attack traffic peaks are reached yearly, the majority of attacks (98%) do not exceed 1 Gbit/s, even in the year 2021 [27, 3, 28]. (ii) A recent honeypot platform observes that 50%–80% of amplification attacks are shorter than 5 minutes [7], depending on the protocol. Triggering high volume attacks by requesting relatively little from a large number of amplifiers is doable given current amplification factors and deployment of amplifiers (see, e.g., NTP or SSDP). We adopt amplification factors from related work [1], the numbers of open amplifiers from publicly accessible scan projects [29, 30], and then apply common attack detection thresholds.
Table IV lists the calculated attack configurations and compares them against the attack thresholds presented in the AmpPotMod, CCC, NewKid, and HPI papers. Depending on the amplification protocol each honeypot sensor would experience different packet loads, ranging from 2 (NTP) to 1430 (LDAP) packets during the attack time. Attacks that require fewer requests per amplifier tend to remain unnoticed by current detection methods. This result highlights that current detection methods may miss smartly tailored attacks and that thresholds can best detect attacks when the packet load per amplifier is high. Overall, this suggests that the honeypot observations are incomplete.
We conclude that honeypot observations cannot be simply explained in situ but have to be embedded into the protocol ecosystem and the decision-making that determines amplifier lists used by attackers.
7 Honeypot Convergence
In this section, we revisit accuracy estimations for observations from a distributed honeypot platform. We explore the notion of honeypot convergence, a completeness measure of the detections that is influenced by the number of honeypots deployed and their configuration. We evaluate the impact of varying deployment scenarios based on the CCC platform.
7.1 Current Methods
Honeypot convergence is based on the assumption that the observed event set stabilizes (i.e., converges) as the set of honeypot probes varies. It is considered a key property of a honeypot platform, because it provides a comparative measure for attacks observed by different honeypot deployments. Convergence supposedly occurs when a set of honeypot probes provide a complete view of all attack events.
In the AmpPot paper [6], the authors order all the honeypot probes by name and then compute the running sum of new attacks contributed by each probe in turn. They conclude that AmpPot probes identify 90% of all attacks and that additional probes add only very few new attacks.
In the CCC paper [8], the authors apply a capture-recapture analysis, a statistical method known from ecology, which derives the number of estimated attacks by random sampling of the honeypot probes. They conclude that the CCC platform captures 85.1%–96.6% of all attacks. Other work derives that already 5 CCC sensors converge and monitor 99.5% of the DNS victims [31].
Although the number of sensors is significantly higher (150), the authors of the HPI deployment claim to have a complete view also on the basis of convergence behavior.
The stabilization of attack events (i.e., convergence) when adding more probes is a common justification for specific honeypot settings. It remains premature, though, to conclude from convergence that a complete set of attack events has been observed. Convergence also occurs if a large set of attack events never enters the honeypot platform. Recent research observes this for different honeypot deployments, which show very diverging event sets with incomplete pictures of attacks. Two independent studies show small overlaps of only 4% [31] and 8.18% [32] between UDP amplification attacks observed at common honeypots and different vantage points (i.e., other honeypot platforms and IXPs), challenging previous assumptions and claims of convergence. Furthermore, analyses based on the large HPI platform show that convergence differs by protocol and that a general approach to high attack visibility (i.e., 99%) is hard to achieve, e.g., RIP measurements require 60 sensors and other protocols 150 sensors [7].
Reviewing the implications of honeypot convergence is important because this measure has been used as a fundamental building block for the justification of honeypot results. Given the visibility of a honeypot platform, researchers had no other means but to test for the convergence of their results. We argue, however, that honeypot convergence should be re-interpreted, as it is only a fair measure of the limits of visibility, i.e., a test whether the horizon of the platform has stabilized.
7.2 Reproducing Convergence
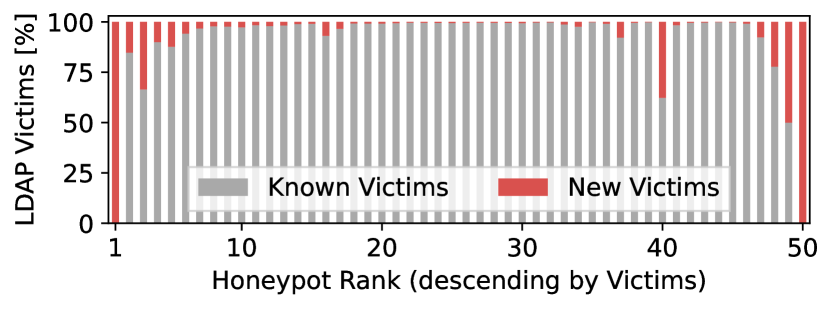
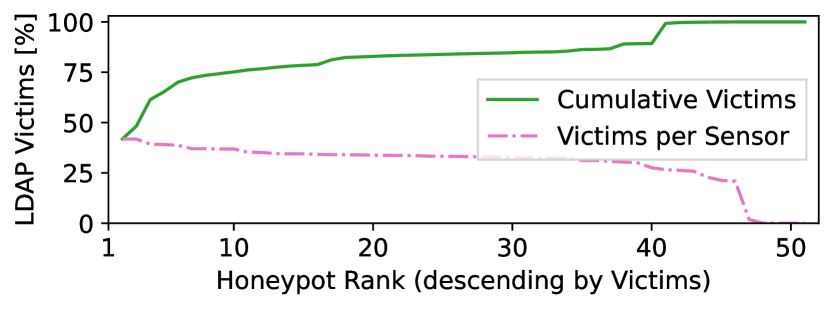
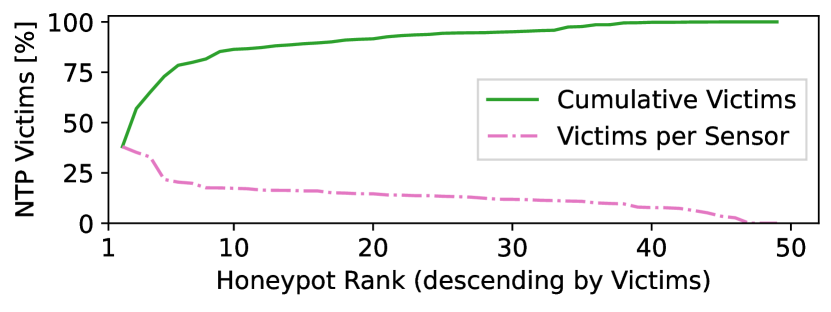
We use data from the CCC honeypots (see § 6) to illustrate that the strategy of selecting probes has a significant impact on convergence results. Using the default CCC thresholds, we learn about 1.4M attacks towards 644k victims during our measurement period spanning 3 months. The most common protocols for amplifications are NTP (60%), LDAP (31%), and DNS (4%). We observe continuous scans or attacks for all but one faulty sensor for NTP and LDAP, why we conclude that these services were run throughout the whole measurement period.
We now reproduce the honeypot convergence based on a near-optimal sensor selection, analogous to prior work [6, 31]. We sort the sensors by the number of victims and perform a greedy selection, i.e., we select the sensors with the most unique victims first. Figure 5 exhibits the results for NTP, for LDAP we refer to Appendix A. The share of new victims, which an individual sensor contributes, decreases quickly until rank 10. For NTP at rank 10, 87% of victims have been already observed and the subsequent sensors do not significantly increase the cumulative count although each sensor observes 16.5% of all victims. For LDAP at rank 10, we observe slightly fewer victims (76%). Each additional sensor observes 35% of all victims but increases the cumulative share only by %. In summary, we successfully reproduced the honeypot convergence for the given platform and measurement period.
7.3 A Fair Convergence Introspection
This convergence measure, which we just reproduced, follows a probe sampling that prefers sensors with a large number of common victims. As such, it is biased towards fast convergence. We now want to analyze the general convergence behavior and answer the question whether this bias leads to missing relevant data from the result set.
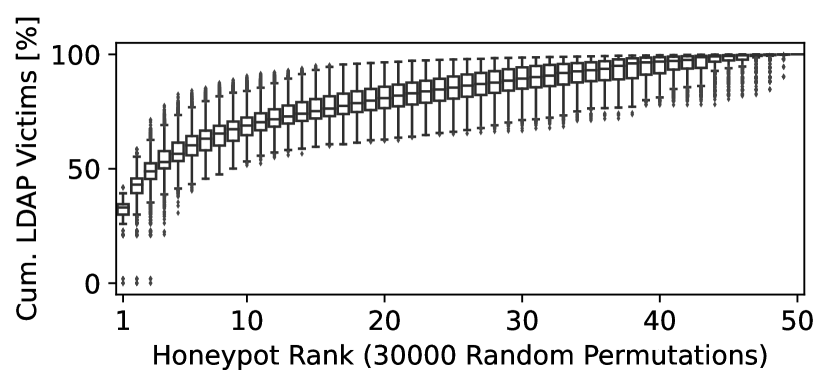
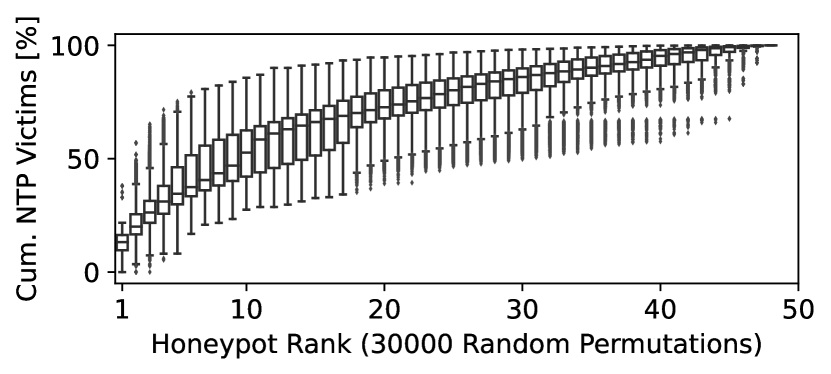
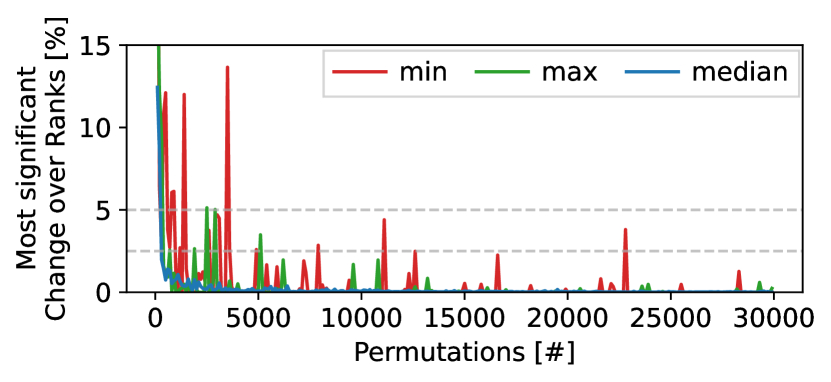
In general, the convergence behavior depends on the number and the order of considered sensors. To eliminate order bias, we create 30k random permutations of all CCC sensors and re-inspect convergence for NTP, see 6(a). This analysis differs from related work [7] by exploring further statistical details instead of only averages. Each box includes the median (bar), up to of the interquartile range (whiskers), and all minimal and maximum values (outliers). This plot clearly visualizes the large variances across convergence results, depending on the combination of probes. Considering the best (upper outliers) and worst (lower outliers) case scenarios of 20 sensors (rank 20), we find 39%–95% of NTP victims. Furthermore, the upper outliers resemble very closely the cumulative ratio of victims in 5(b). These observations lead to two insights. Fist, they confirm our previous observation that probes with higher weight (i.e., more attacks) introduce a bias towards fast convergence. Second, they emphasize that convergence measures should be utilized with great caution when justifying the completeness captured by honeypot deployments.
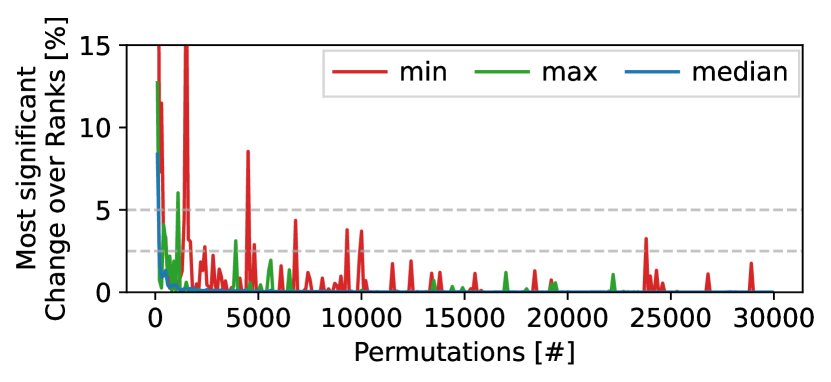
We still want to justify that we do not compute all permutations of currently 50 CCC sensors due to numerical complexity ( permutations). Limiting to 30k permutations already shows stable results. To assess the stability, we iteratively create 100 new permutations and add them to the total set of permutations. For each set of permutations, we determine the largest differences of the minima, median, and maxima of detected victims across all ranks. The results are shown in 6(b). After an initial phase of significant changes, the median becomes very stable using at least 25k permutations. Occasionally, minima can change up to 2%, cf. Appendix A for LDAP.
It is noteworthy that the capture-recapture method can be inadequate for estimating an unknown population. Related work finds that (i) accuracy depends on capturing a large proportion of the population [33], i.e., the majority of attacks, and (ii) it looses accuracy for transient populations [34], i.e., when attackers cease or move between measurement areas due to new amplifier lists. All this makes it very likely that the estimated number of attacks accounts only for a subset of total attacks.
7.4 Convergence versus Completeness Metrics
In the previous sections, we have shown that convergence is not a stable metric but (if cautiously applied) can shed light on the horizon of visibility for a honeypot platform deployment. The completeness of the observation (i.e., the detection of all ongoing attacks), however, strongly depends on how an attacker selects the amplifiers. Consider two corner cases and one likely scenario.
-
1.
An attacker may not select at all but send spoofed requests to arbitrary IP addresses. In this case, the probability of observing the attacker is extremely low for any given honeypot platform.
-
2.
An attacker may—after scanning—use all amplifiers of a given protocol. In this case, a single sensor suffices for detecting the attack.
-
3.
An attacker may use a limited subset of amplifiers, e.g., an amplifier hit list. This list may have been collected according to efficiency (i.e., amplification factors), (geographic or topological) locality, or other means. In this case, the probability of detecting the attack strongly correlates with the honeypots conforming to the selection criteria.
Amplifier hit lists may be static, in which case the attack remains invisible if no honeypot is on the list, or dynamic. In the latter case, honeypots may observe scanning and respond accordingly. Honeypots typically expose a low amplification factor due to legal reasons, which makes them less attractive in many attacks.
Finding a good completeness metric
Often, honeypot platforms have a limited diversity in geography or network topology. A valid metric for estimating the completeness of honeypot observations needs to infer global knowledge from local observations, which is the more challenging the smaller and less diverse local observatories are. Preferably, such metric can at least provide a rough estimator of the error inherent to the measurement system. As we have seen in the previous discussions, such an indicator cannot be extracted from the pure measurement set alone. Instead, orthogonal sensors and correlating analyses are needed to capture and quantify the invisible attack data.
An obvious source of control is to compare with alternate measurements such as flow data, network telescopes, or public attack reports. For research that needs to exclusively base on the honeypot platform, we conjecture that additionally observing and analyzing explorative scanning (possibly with varying reply behavior) as well as correlating initial scanning with subsequent attack detection (or not), may open a new angle of view on the completeness of the honeypot attack data.
8 Completeness
Using additional data sources, we find that honeypots are unable to observe anywhere near a complete view of real-world attacks, but are quite good at detecting scanning activity.
8.1 The Honeypot View is Mostly Incomplete
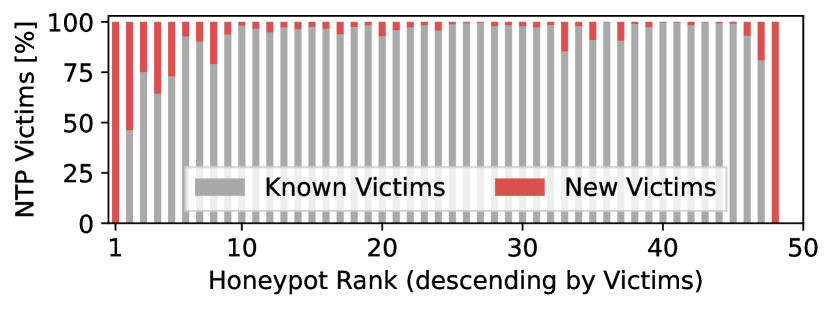
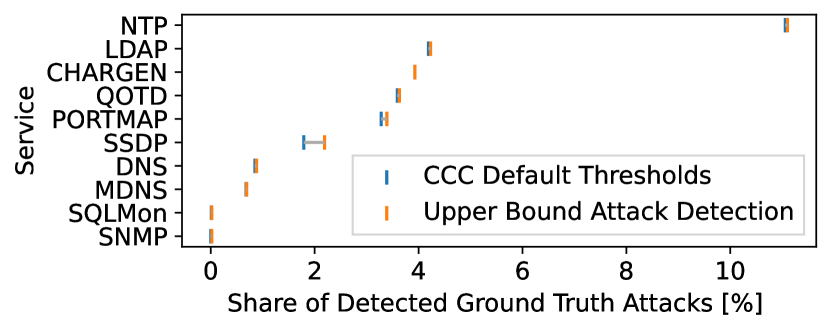
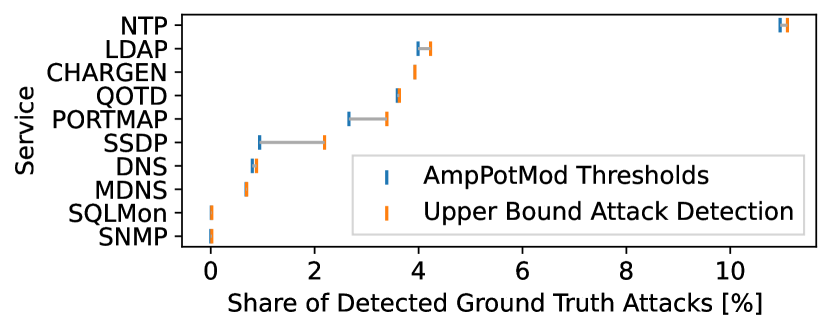
Similar to honeypots, our DDoS provider data shows that DNS (60%), NTP (23%), and LDAP (8%) are the most popular protocols misused for amplification. Leveraging this real-world baseline data, we can now independently assess whether the honeypots grant a reasonably complete view on attacks. To this end, we detect attacks using the honeypot data and the default CCC or AmpPotMod thresholds. Then, we calculate the share of overlapping attack events in the DDoS provider baseline data for each protocol. The results are visualized in Figure 7. We find very limited overlap, i.e., honeypot views on amplification attacks are mostly incomplete. For the best performing protocols, for which we confirmed uninterrupted operations and convergence in the previous sections, we only observe 11% (NTP) and 4% (LDAP) of attacks. This is in stark contrast to current convergence measurements [7], which suggest that we should observe at least 90% of NTP attacks with 50 sensors. Our results, however, comply with recent findings (4% [31] or 8.18% [32]), which examine the overlap between honeypots and IXPs, but based on baseline data. We acknowledge that our baseline data is limited to those networks that share attack alerts with the DoS provider. Nevertheless, we want to stress two important details. (i) our data represents a fairly large share of the market (up to 22%) and (ii) for a complete coverage of all attacks, honeypots should at least observe most if not all of our baseline attacks.
Notably, the relative popularity of DNS differs between honeypots (see paragraph above) and other vantage points such as IXP-based measurements (DNS 43%, NTP 25%, LDAP 20% [32]) and our baseline data (DNS 60%, NTP 23% and LDAP 8%). We argue that honeypots miss a substantial portion of DNS attacks for two reasons: (i) DNS amplifiers have the highest churn rates [35, 36], which makes it necessary for attackers to rescan frequently. Hence, attackers can easily rotate between amplifiers and prefer new amplifiers [31]. (ii) Although the DNS ecosystem consists of various amplifiers [37], the driving factor for amplification are queries for names with large zones. This means that the attackers can utilize most amplifiers if they select such a name, which makes the honeypots less attractive or at least less likely to be used. This is supported by the fact that DNS has the slowest convergence [7].
8.2 No Potential for Better Attack Thresholds
We ask whether we can fine-tune the thresholds to improve results. For this, we infer the upper bound of attack detection. We use the most permissive thresholds, i.e., every event is classified as an attack. This potentially leads to many false positives because even scanners sending just one packet to the honeypot platform will be interpreted as an attack.
We visualize the results in Figure 7. The grey horizontal lines indicate the potentials for improvements. We find that we cannot significantly fine-tune the thresholds because the honeypots simply do not observe any event for the victims in our baseline data, i.e., there is no packet that relates to any of the IP addresses under attack.
This limited potential suggests that optimizing the thresholds would lead to overfitting with respect to our baseline data set. Also, such thresholds would only be optimal for a particular point in time and probably lose the acquired precision in the long term.
8.3 Misclassification of Scans
We now utilize network telescopes to assess whether attack detection thresholds for honeypots successfully eliminate scan events.
Telescopes and honeypots observe the same scanners
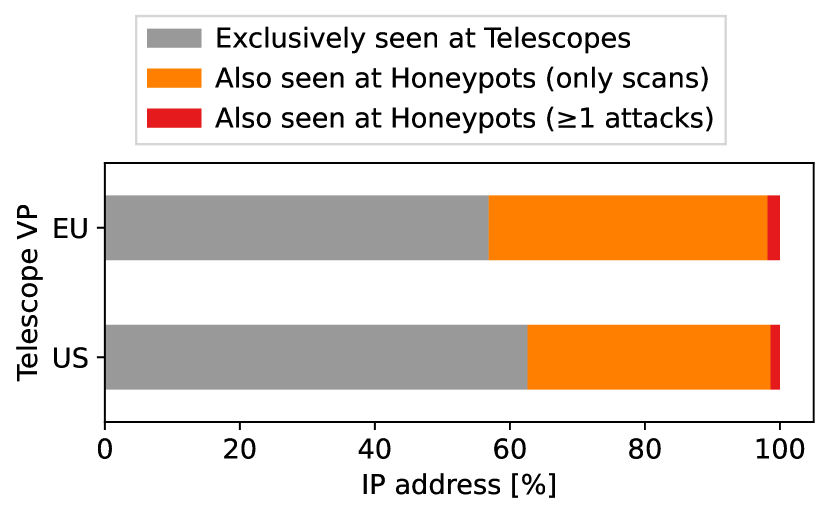
At our telescopes, we identify all scanners contacting service ports supported by the CCC honeypots. During our main measurement period, we find 27k unique scanner addresses in the US and 16k in the EU. We now check whether these addresses have been observed at the CCC platform. The CCC honeypots observe 37.4% of the US scanners and 43.1% of the EU scanners. Not all scanners are observed since not every scanner performs a complete address space scan, e.g., it is part of a botnet or pool which splits the address space, or operates very locally [18].
Telescopes and honeypots agree on scanners
We now apply the default CCC thresholds, inspect the events caused by scanners, and compare the results by region in Figure 8. Strikingly, 36% of US scanners only triggers scan events at the honeypots. Likewise, the honeypots infer attacks only for 1.4% of the scanners. At the EU, we observe similar trends with 41.3% of the sources performing scans only and 1.8% triggering attacks. We repeat this analysis using the AmpPotMod thresholds and find comparable results (not visualized). However, AmpPotMod thresholds detect slightly fewer attacks. The share of addresses performing attacks decreased for both vantage points, the US () and EU ().
Please note that the detected attacks are not necessarily misclassifications. Upon receiving a response, a scanner might start testing the capabilities of a honeypot, which triggers an attack event. But such behavior is rather unlikely because scanners try to remain under the radar in order to avoid being blacklisted and to help discover as many victims as possible. Overall, we find that both threshold configurations are successful in exposing scan events as such.
9 Network Access, Economic Considerations
9.1 Network Types and Service Proximity
Honeypots can be deployed in any type of network with public reachability. Similar to the various threshold configurations, the effect of different network access types is little understood. For the large amplification honeypot platforms, we typically see sensors placed on eyeball, hosting, and academic networks. Still, we miss discussion on how the observations differ across network types.
Quantitative and qualitative differences have been shown for non-amplifying honeypots placed in mobile network service providers, darknets, and academic networks [38], e.g., only a few topological Internet-domains have started to place dedicated focus on attacking mobile networks. For example, malware and scanners have been shown to limit their operations geographically and topologically [18]. Such differences observed across network types must also be anticipated for amplification honeypots.
Since many open services disappear because of IP churn [35] and not because they were taken down, it is beneficial to periodically rescan the network to update the service-to-address-mappings. According to [39], scan traffic can be reduced by 25-90% while missing only 1-10% of the population. This means that attackers utilizing such optimization will more likely discover and misuse honeypots that are in proximity to other amplifiers.
Cloud providers share their physical infrastructure through the use of virtualization. Outages and the mitigation of (unrelated) attacks) on shared infrastructure may affect honeypot measurements and thereby attack detection. Therefore, researchers need to pay close attention to the fate-sharing risks and factors of an otherwise well-functioning honeypot system.
9.2 Economic Considerations
Attackers misusing amplifiers are often operating in pursuit of economic goals. For instance, fee-based booter (or stresser) operators sell DoS attacks as-a-service and have been linked to the misuse of open amplifiers [40, 41]. Booter operators run websites where any individual can purchase attacks [42]. Although some DDoS-as-a-service websites have been shown to utilize the same set of amplifiers, for most operating websites the overlap is minimal [40].
Researchers have used booter services to attack their own infrastructure and found attacks utilize on average 346 amplifiers from 27 autonomous systems [43]. Honeypots observed only 40% of DNS self-targeted attacks [41]. Overall, booter services are responsible for a significant number of amplification attacks, e.g., 26% of DNS and 13% of NTP attacks were linked to a specific set of booters [41]. This means that observations by honeypot sensors can be extremely biased if they are used by a specific booter. Furthermore, take downs of booter websites can reduce the number of observed attacks [44, 43] and negatively bias the attack landscape perceived by a honeypot system.
Unfortunately, little can be done to influence the selection process of attackers. Obviously providing potent amplifiers helps, however, this opposes ethical measurements which deploy rate limiting. Therefore, special care has to be taken while analyzing significant peaks and drops, e.g., for number of attacks for a specific protocol. Variations in attack detection may rather be caused by a specific booter omitting the honeypots from active use rather than a reflection of aggregate attack event trends.
10 Discussion
Why our results differ
Our results on the completeness of honeypot observations clearly differ from past research, indicating that honeypot systems miss a substantial share of all Internet-wide attacks. We identify two major reasons for the differences: First, honeypot observations, especially for early deployments, show a very fast convergence, which was misinterpreted as an indicator for completeness. Convergence, however, can only serve as an indicator for cost-efficiency of a particular deployment. Second, the access to orthogonal vantage points, e.g., commercial on-path mitigation appliances, is rare and regulated by NDAs. By closely cooperating with a DDoS mitigation provider, we designed a method that evaluates the completeness of honeypot observations but still respects data privacy.
Following our systematic approach, we believe that our results exhibit a more trustworthy view on the amplification ecosystem. This is because (i) we do not select a singular configuration but explore complete threshold spaces and analyze convergence after random permutations of the sensor order, and (ii) our completeness results are bolstered by a curated DDoS attack list from a major mitigation provider.
Our limitations
Our results are based on a dataset that was gathered recently and covers a specific time period. Not all datasets that were used in prior publications were at our disposal; hence we could not evaluate some of the prior research against our baseline data. Even with the data constraints, however, we were able to use the configurations of various publications to compare detection properties of multiple honeypot thresholds. Furthermore, we argue for our finding that honeypots capture only a limited part of the global attack landscape since other work [41, 32, 31] has raised similar concerns, while using complementary vantage points and time periods.
Convergence vs. completeness
Although convergence does not indicate completeness, both properties can occur at the same time. In § 10, we depict examples under which conditions these properties occur. Attackers who are able to detect honeypot sensors as their targets, e.g., due to rate-limiting at honeypots, can decide to never use them as amplifiers. This impedes completeness. At the same time, attackers that repeatedly use the same honeypot sensors for different attacks foster convergence since they add additional weight to the frequency of occurrence. This illustrates that deploying more honeypots sensors, even with a diverse geographical and topological distribution, does not necessarily lead to more reliable results. Instead, a thorough understanding of the attacker decision making is essential.
| Conv. | Compl. | Scenarios | |
| Honeypot Observations | Reflector Selection | ||
| ✘ | ✘ | Each sensor captured different attacks. | Some attackers did not use the honeypots. |
| \hdashline[.4pt/3pt]✓ | ✘ | Multiple sensors captured the same. | Some attackers did not use the honeypots. |
| \hdashline[.4pt/3pt]✘ | ✓ | Each sensor captured different attacks. | All attackers used the honeypots. |
| \hdashline[.4pt/3pt]✓ | ✓ | Multiple sensors captured the same. | All attackers used the honeypots. |
Honeypots are useful
It is discouraging to detect only up to 11% of attacks, in particular when facing the costs of deploying (renting cloud servers, buying dedicated hardware etc.) and maintaining amplification honeypots. Even though honeypots lack a complete view on the attack landscape, knowing this imperfection removes unwanted interpretation bias. We argue in favor of honeypot results as an important component of a larger complex ecosystem even if they are imperfect. We believe accepting this will help researchers to better interpret the observed phenomena and to understand their fragment of attacks. Since researchers are restricted to ethical measurements and hence rate limit honeypots, attackers will always be able to elude the trap.
Recommendations for attack definitions
A comprehensible, precise attack definition is essential for honeypot research. We find only textual definitions of attack thresholds in related work. Although these can be sufficient, they are ambiguous and open to interpretation. This is why we recommend precise wording, preferably taken from common sources. A good candidate for this is found in the IPFIX specification [45], from which we adopted the usage of idle timeout and flow.
Overall, at least three definitions are required: (i) What identifies a victim? This could be a single source IP address, an IP prefix, an autonomous system, a name etc. (ii) What is an attack flow? One should clarify which flow keys are observed for flow inference and which thresholds are applied. (iii) What is an attack (event)? This is especially important for system-wide flow identifiers, when distinct attack flows towards the same victim are observed from different vantage points.
Directions for the future
Our results indicate the importance of extensive baseline data and ground truth. However, our community should not depend on it. Non-proprietary, auxiliary vantage points such as telescopes and correlating observations can also help to assess or improve the precision of measurements. We see such heterogeneous deployments in active use by commercial parties, e.g., GreyNoise. Simply adding more honeypot sensors does not necessarily solve measurement challenges such as the honeypot convergence, which is among other potential obstacles caused by the decision making process of the attacker.
A fundamental problem for honeypot research is that aggressive scans exhibit traffic patterns similar to reflective amplification attacks. Conversely, low-volume attacks misusing relatively few amplifiers can resemble patterns of cautious scanners. Prior work was conducted based on the assumption that these phenomena do not intersect, but they do. This intersection can be illuminated by considering a careful definition and explanation of thresholds w.r.t. the observed data and the current amplification ecosystem.
The ever-changing ecosystem is the reason why we refuse to recommend a single best threshold configuration in this paper. It is likely that any such recommendation will soon be obsolete as attacks and methods evolve. Additionally, our results indicate that even perfect attack classifications will not be able to detect all attacks. There is room for clarification on the impact of thresholds, and the correlation of minor events to make classification of various measurements easier. However, opportunistic classifications into obvious scans and obvious attacks are valuable.
With these considerations in mind, we go beyond just a call for comparable metrics. Given the same dataset, we need a way to compare the effects of different thresholds. We also encourage authors to present detailed analysis on their choice of attack thresholds. Finally, since the observation range of honeypots is directly related to being targeted by attackers, we argue that a future research agenda should include methods to replicate the creation of amplifier hit lists. Mimicking this part would complement our tool set and improve informed honeypot deployment.
11 Conclusion and Outlook
In this paper, we revisited methods to measure and infer reflective amplification attacks based on honeypots. We applied a data-driven approach that allowed us to challenge long-held assumptions. Using data from a large-scale honeypot, multiple network telescopes, and extensive baseline data from a leading DDoS mitigation provider, we were able to reproduce, confirm, or disprove common measures of attack detection, honeypot convergence, and attack completeness.
Contrary to popular belief, we found that (i) honeypot convergence has limited significance because it is a statistically unstable metric and (ii) observations by honeypots are incomplete, honeypots miss large fractions of ground truth attacks. We explored the complete spectrum of attack detection thresholds and embedded the thresholds of related work in our system. Related work, although using different thresholds, largely produces comparable results but common thresholds cover only a very narrow part of the parameter space. We highlighted the various features that should be considered by researchers when deploying honeypots and analyzing data. These include setup properties, flow identifiers, and attack thresholds.
Our results underscore three open challenges. First, a well-defined definition of an attack, which accounts for traffic patterns observed by honeypots. Second, a reliable metric to assess the completeness of honeypot observations. Such metric should provide an error margin and not depend on external ground truth data. Third, to increase completeness, well-defined features that guide honeypot deployment. These might include deployments in heterogeneous network types, better protocol emulation, or sophisticated rate limiting methods. Most importantly, our community should gain a better understanding of the mechanics behind the creation of amplifier hit lists. Being able to reproduce the set of amplifiers used by attackers will allow researchers to tailor amplification honeypots in terms of location and behavior such that they will be targeted and capture a sufficiently complete view.
Acknowledgment
We would like to thank our shepherd Jianjun Chen and the anonymous reviewers for their very detailed and valuable feedback, which helped to improve this paper. We gratefully acknowledge the DDoS mitigation provider and the CCC honeypot team for providing data. This work was partly supported by the German Federal Ministry of Education and Research (BMBF) within the project PRIMEnet.
References
- [1] C. Rossow, “Amplification Hell: Revisiting Network Protocols for DDoS Abuse,” in Proc. of NDSS. Internet Society, 2014. [Online]. Available: https://www.ndss-symposium.org/ndss2014/amplification-hell-revisiting-network-protocols-ddos-abuse
- [2] F. J. Ryba, M. Orlinski, M. Wählisch, C. Rossow, and T. C. Schmidt, “Amplification and DRDoS Attack Defense – A Survey and New Perspectives,” Open Archive: arXiv.org, Technical Report arXiv:1505.07892, June 2015. [Online]. Available: http://arxiv.org/abs/1505.07892
- [3] NETSCOUT, “Cloud in the Crosshairs. 14th Annual Worldwide Infrastructure Security Report,” Website, 2019, retrieved: March, 2022. [Online]. Available: https://www.netscout.com/sites/default/files/2019-03/SECR_005_EN-1901%E2%80%93WISR.pdf
- [4] M. Nawrocki, M. Wählisch, T. C. Schmidt, C. Keil, and J. Schönfelder, “A Survey on Honeypot Software and Data Analysis,” Open Archive: arXiv.org, Technical Report arXiv:1608.06249, 2016. [Online]. Available: http://arxiv.org/abs/1608.06249
- [5] N. Provos and T. Holz, Virtual Honeypots. From Botnet Tracking to Intrusion Detection, 2nd ed. Upper Saddle River, NJ: Addison–Wesley, 2008.
- [6] L. Krämer, J. Krupp, D. Makita, T. Nishizoe, T. Koide, K. Yoshioka, and C. Rossow, “AmpPot: Monitoring and Defending Amplification DDoS Attacks,” in Proc. of RAID. Berlin, Heidelberg, N.Y.: Springer Verlag, 2015, pp. 615–636. [Online]. Available: https://doi.org/10.1007/978-3-319-26362-5_28
- [7] H. Griffioen, K. Oosthoek, P. van der Knaap, and C. Doerr, “Scan, Test, Execute: Adversarial Tactics in Amplification DDoS Attacks,” in Proc. of ACM CCS. New York, NY, USA: ACM, 2021, pp. 940–954. [Online]. Available: https://doi.org/10.1145/3460120.3484747
- [8] D. R. Thomas, R. Clayton, and A. R. Beresford, “1000 days of UDP amplification DDoS attacks,” in 2017 APWG Symposium on Electronic Crime Research (eCrime). Piscataway, NJ, USA: IEEE, 2017, pp. 79–84. [Online]. Available: https://doi.org/10.1109/ECRIME.2017.7945057
- [9] Daniel J. Bernstein, “SYN cookies,” Website, 1996, retrieved: September, 2022. [Online]. Available: https://cr.yp.to/syncookies.html
- [10] M. Nawrocki, R. Hiesgen, T. C. Schmidt, and M. Wählisch, “QUICsand: Quantifying QUIC Reconnaissance Scans and DoS Flooding Events,” in Proc. of ACM IMC. New York, NY, USA: ACM, 2021, pp. 283–291. [Online]. Available: https://doi.org/10.1145/3487552.3487840
- [11] M. Casado, T. Garfinkel, W. Cui, V. Paxson, and S. Savage, “Opportunistic Measurement: Extracting Insight from Spurious Traffic,” in Proc. of HotNets. New York, NY, USA: ACM, Nov 2005. [Online]. Available: https://conferences.sigcomm.org/hotnets/2005/papers/monitor_90.pdf
- [12] M. Abu Rajab, J. Zarfoss, F. Monrose, and A. Terzis, “A Multifaceted Approach to Understanding the Botnet Phenomenon,” in Proc. of ACM IMC. New York, NY, USA: ACM, 2006, pp. 41–52. [Online]. Available: https://doi.org/10.1145/1177080.1177086
- [13] E. Wustrow, M. Karir, M. Bailey, F. Jahanian, and G. Huston, “Internet Background Radiation Revisited,” in Proc. of ACM IMC. NY, USA: ACM, 2010, pp. 62–74. [Online]. Available: https://doi.org/10.1145/1879141.1879149
- [14] A. Dainotti, A. King, K. Claffy, F. Papale, and A. Pescapè, “Analysis of a ”/0” Stealth Scan from a Botnet,” IEEE/ACM ToN, vol. 23, no. 2, pp. 341–354, Apr 2015. [Online]. Available: https://doi.org/10.1145/2398776.2398778
- [15] V. Ghiette, N. Blenn, and C. Doerr, “Remote Identification of Port Scan Toolchains,” in Proc of IFIP NTMS, 2016, pp. 1–5. [Online]. Available: https://doi.org/10.1109/NTMS.2016.7792471
- [16] P. Richter and A. Berger, “Scanning the Scanners: Sensing the Internet from a Massively Distributed Network Telescope,” in Proc. of ACM IMC. New York, NY, USA: ACM, 2019, pp. 144–157. [Online]. Available: https://doi.org/10.1145/3355369.3355595
- [17] L. Izhikevich, R. Teixeira, and Z. Durumeric, “LZR: Identifying Unexpected Internet Services,” in Proc. of USENIX Security. Berkeley, CA, USA: USENIX Association, 2021, pp. 3111–3128. [Online]. Available: https://www.usenix.org/conference/usenixsecurity21/presentation/izhikevich
- [18] R. Hiesgen, M. Nawrocki, A. King, A. Dainotti, T. C. Schmidt, and M. Wählisch, “Spoki: Unveiling a New Wave of Scanners through a Reactive Network Telescope,” in Proc. of USENIX Security. Berkeley, CA, USA: USENIX Association, 2022, pp. 00–00, prepublication. [Online]. Available: https://www.usenix.org/conference/usenixsecurity22/presentation/hiesgen
- [19] A. Noroozian, M. Korczyński, C. H. Gañan, D. Makita, K. Yoshioka, and M. Van Eeten, “Who Gets the Boot? Analyzing Victimization by DDoS-as-a-Service,” in Proc. of RAID. Berlin, Heidelberg, N.Y.: Springer Verlag, 2016, pp. 368–389. [Online]. Available: https://doi.org/10.1007/978-3-319-45719-2_17
- [20] T. Heinrich, R. R. Obelheiro, and C. A. Maziero, “New Kids on the DRDoS Block: Characterizing Multiprotocol and Carpet Bombing Attacks,” in Proc. of PAM. Cham: Springer International Publishing, 2021, pp. 269–283. [Online]. Available: https://doi.org/10.1007/978-3-030-72582-2_16
- [21] C. Fachkha, E. Bou-Harb, and M. Debbabi, “Inferring distributed reflection denial of service attacks from darknet,” Computer Communications, vol. 62, pp. 59–71, 2015. [Online]. Available: https://doi.org/10.1016/j.comcom.2015.01.016
- [22] Z. Durumeric, E. Wustrow, and J. Halderman, “ZMap: Fast Internet-Wide Scanning and its Security Applications,” in Proc. of USENIX Security. Berkeley, CA, USA: USENIX Association, 2013, pp. 605–620. [Online]. Available: https://www.usenix.org/conference/usenixsecurity13/technical-sessions/paper/durumeric
- [23] J. Iyengar and M. Thomson, “QUIC: A UDP-Based Multiplexed and Secure Transport,” IETF, RFC 9000, May 2021. [Online]. Available: https://doi.org/10.17487/RFC1035
- [24] M. Nawrocki, J. Blendin, C. Dietzel, T. C. Schmidt, and M. Wählisch, “Down the Black Hole: Dismantling Operational Practices of BGP Blackholing at IXPs,” in Proc. of ACM IMC. New York, NY, USA: ACM, 2019, pp. 435–448. [Online]. Available: https://doi.org/10.1145/3355369.3355593
- [25] M. Jonker, A. Sperotto, R. van Rijswijk-Deij, R. Sadre, and A. Pras, “Measuring the Adoption of DDoS Protection Services,” in Proc. of ACM IMC. New York, NY, USA: ACM, 2016, pp. 279–285. [Online]. Available: https://doi.org/10.1145/2987443.2987487
- [26] J. Czyz, M. Kallitsis, M. Gharaibeh, C. Papadopoulos, M. Bailey, and M. Karir, “Taming the 800 pound gorilla: The rise and decline of NTP DDoS attacks,” in Proc. of ACM IMC. New York, NY, USA: ACM, 2014, pp. 435–448. [Online]. Available: https://doi.org/10.1145/2663716.2663717
- [27] Cloudflare Radar, “DDoS Attack Trends for Q4 2021,” Website, 2021, retrieved: March, 2022. [Online]. Available: https://radar.cloudflare.com/notebooks/ddos-2021-q4#network-layer-ddos-attacks-by-attack-rate
- [28] A. G. Oleg Kupreev, Ekaterina Badovskaya, “DDoS Attacks in Q4 2018,” Website, 2019, retrieved: March, 2022. [Online]. Available: https://securelist.com/ddos-attacks-in-q4-2018/89565/
- [29] The Shadowserver Foundation, “Scanning Project,” Website, 2022, retrieved: March, 2022. [Online]. Available: https://scan.shadowserver.org/
- [30] Shodan, “Shodan - the world’s first search engine for Internet-connected devices.” Website, 2014, retrieved: March, 2022. [Online]. Available: https://www.shodan.io/
- [31] M. Nawrocki, M. Jonker, T. C. Schmidt, and M. Wählisch, “The Far Side of DNS Amplification: Tracing the DDoS Attack Ecosystem from the Internet Core,” in Proc. of ACM IMC. New York, NY, USA: ACM, 2021, pp. 419–434. [Online]. Available: https://doi.org/10.1145/3487552.3487835
- [32] D. Kopp, C. Dietzel, and O. Hohlfeld, “DDoS Never Dies? An IXP Perspective on DDoS Amplification Attacks,” in Proc. of PAM. Cham: Springer International Publishing, 2021, pp. 284–301. [Online]. Available: https://doi.org/10.1007/978-3-030-72582-2_17
- [33] K. Lee, C. Huveneers, O. Gimenez, V. Peddemors, and R. Harcourt, “To catch or to sight? a comparison of demographic parameter estimates obtained from mark-recapture and mark-resight models,” Biodiversity and conservation, vol. 23, no. 11, pp. 2781–2800, 2014. [Online]. Available: https://doi.org/10.1007/s10531-014-0748-9
- [34] K. Tilling and J. A. Sterne, “Capture-recapture models including covariate effects,” American Journal of Epidemiology, vol. 149, no. 4, pp. 392–400, 1999. [Online]. Available: https://doi.org/10.1093/oxfordjournals.aje.a009825
- [35] M. Kührer, T. Hupperich, C. Rossow, and T. Holz, “Exit from Hell? Reducing the Impact of Amplification DDoS Attacks,” in Proc. of USENIX Security. Berkeley, CA, USA: USENIX Association, 2014, pp. 111–125. [Online]. Available: https://www.usenix.org/conference/usenixsecurity14/technical-sessions/presentation/kuhrer
- [36] M. Kührer, T. Hupperich, J. Bushart, C. Rossow, and T. Holz, “Going wild: Large-scale classification of open DNS resolvers,” in Proc. of ACM IMC. New York, NY, USA: ACM, 2015, pp. 355–368. [Online]. Available: https://doi.org/10.1145/2815675.2815683
- [37] M. Nawrocki, M. Koch, T. C. Schmidt, and M. Wählisch, “Transparent Forwarders: An Unnoticed Component of the Open DNS Infrastructure,” in Proc. of ACM CoNEXT. New York, NY, USA: ACM, 2021, pp. 454–462. [Online]. Available: https://doi.org/10.1145/3485983.3494872
- [38] M. Wählisch, A. Vorbach, C. Keil, J. Schönfelder, T. C. Schmidt, and J. H. Schiller, “Design, implementation, and operation of a mobile honeypot,” Open Archive: arXiv.org, Technical Report arXiv:1301.7257, 2013. [Online]. Available: http://arxiv.org/abs/1301.7257
- [39] J. Klick, S. Lau, M. Wählisch, and V. Roth, “Towards Better Internet Citizenship: Reducing the Footprint of Internet-Wide Scans by Topology Aware Prefix Selection,” in Proc. of ACM IMC. New York, NY, USA: ACM, 2016, pp. 421–427. [Online]. Available: https://doi.org/10.1145/2987443.2987457
- [40] J. J. Santanna, R. van Rijswijk-Deij, R. Hofstede, A. Sperotto, M. Wierbosch, L. Z. Granville, and A. Pras, “Booters—An analysis of DDoS-as-a-service attacks,” in Proc. of IFIP/IEEE IM. Piscataway, NJ, USA: IEEE, 2015, pp. 243–251. [Online]. Available: https://doi.org/10.1109/INM.2015.7140298
- [41] J. Krupp, M. Karami, C. Rossow, D. McCoy, and M. Backes, “Linking amplification DDoS attacks to booter services,” in Proc. of RAID. Cham: Springer International Publishing, 2017, pp. 427–449. [Online]. Available: https://doi.org/10.1007/978-3-319-66332-6_19
- [42] J. J. Santanna, R. O. De Schmidt, D. Tuncer, J. De Vries, L. Z. Granville, and A. Pras, “Booter blacklist: Unveiling DDoS-for-hire websites,” in Proc. of IEEE CNSM. Piscataway, NJ, USA: IEEE, 2016, pp. 144–152. [Online]. Available: https://doi.org/10.1109/CNSM.2016.7818410
- [43] D. Kopp, M. Wichtlhuber, I. Poese, J. Santanna, O. Hohlfeld, and C. Dietzel, “DDoS Hide & Seek: On the Effectiveness of a Booter Services Takedown,” in Proc. of ACM IMC. New York, NY, USA: ACM, 2019, pp. 65–72. [Online]. Available: https://doi.org/10.1145/3355369.3355590
- [44] B. Collier, D. R. Thomas, R. Clayton, and A. Hutchings, “Booting the Booters: Evaluating the Effects of Police Interventions in the Market for Denial-of-Service Attacks,” in Proc. of ACM IMC. New York, NY, USA: ACM, 2019, pp. 50–64. [Online]. Available: https://doi.org/10.1145/3355369.3355592
- [45] J. Quittek, S. Bryant, B. Claise, P. Aitken, and J. Meyer, “Information Model for IP Flow Information Export,” IETF, RFC 5102, January 2008. [Online]. Available: https://doi.org/10.17487/RFC5102
Appendix A Examining Convergence for LDAP
In Figure 9 and Figure 10, we present detailed results of the convergence measure for LDAP. These results confirm that our convergence observations for NTP presented in § 7.2 and § 7.3 also held for LDAP.
white {textblock*}(2cm,17cm)