Quantum sensing of magnetic fields with molecular color centers
Abstract
Molecular color centers, such as Cr(o-tolyl)4, show promise as an adaptable platform for magnetic quantum sensing. Their intrinsically small size, i.e., 1-2 nm, enables them to sense fields at short distances and in various geometries. This feature, in conjunction with tunable optical read-out of spin information, offers the potential for molecular color centers to be a paradigm shifting materials class beyond diamond-NV centers by accessing a distance scale opaque to NVs. This capability could, for example, address ambiguity in the reported magnetic fields arising from two-dimensional magnets by allowing for a single sensing technique to be used over a wider range of distances. Yet, so far, these abilities have only been hypothesized with theoretical validation absent. We show through simulation that Cr(o-tolyl)4 can spatially resolve proximity-exchange versus direct magnetic field effects from monolayer CrI3 by quantifying how these interactions impact the excited states of the molecule. At short distances, proximity exchange dominates through molecule-substrate interactions, but at further distances the molecule behaves as a typical magnetic sensor, with magnetostatic effects dominating changes to the energy of the excited state. Our models effectively demonstrate how a molecular color center could be used to measure the magnetic field of a 2D magnet and the role different distance-dependent interactions contribute to the measured field.
Precise measurements of magnetic fields are an important tool in understanding the spin properties and spatial distribution of magnetic fields in low dimensional materials. Over the past decade, intensive technique development in magnetic field sensing showcased the importance of coupling spatial resolution with minute sensitivity [1, 2, 3]. Where techniques, such as fluxgate [4] and hall effect sensors [5, 6], are limited to micrometer scale sensing resolution, recent advances in quantum sensing have focused on optically detected magnetic resonance (ODMR) with color centers in semiconductors, e.g., diamond-NV centers [7, 8]. These defect-based color centers feature two key advantages—optical read-out and a high sensitivity to local magnetic fields. In ODMR, the ground state spin is initialized with optical excitation, probed with microwave pulses to coherently drive the magnetic sublevels of a triplet ground state via a singlet excited state, and then optical read-out is used to determine the populations of the spin sublevels [7]. These color centers allow for nanoscale resolution of magnetic fields [9], but do not allow for intimate sensing of fields near the analyte, because defect qubits, like diamond-NV centers, operating as magnetic field sensors are spatially limited; they are difficult to bring in close proximity to the analyte as the defect is embedded in a crystal [10], e.g., the smallest analyte-qubit distance reported is 9 nm [11]. This limitation is functionally related to the nature of these defects, many of which would not be thermodynamically stable in isolation; indeed, placing defects closer to the surface leads to their removal or lower coherence times.
Molecules are zero-dimensional and functionally all surface. They may feature lower coherence times, but they are tunable and solution processable. This cross platform portability, in particular, enables post-synthetic processing of molecular color centers in thin film geometries to probe magnetic fields with distances ranging from angstroms to micrometers. Recent work has even highlighted this functionality with self-assembled monolayers of radical-based spins [12]. The molecular color center Cr(o-tolyl)4 has a paramagnetic triplet ground state (3A symmetry 111While the isolated molecule has symmetry, we use the symmetry labels of the idealized tetrahedral structure.) owing to the Cr4+ center and a zero-field splitting that allows for optical addressability analogous to color centers in solids [14, 15, 16, 17]. Here, light is used to resonantly excite an electron between the sublevels via a singlet excited state [7, 18]. When exposed to even tiny magnetic fields, these electronic states undergo a Zeeman shift in energy () proportional to the intensity of the magnetic field (), the free electron -factor (), the Bohr magneton (), and the Planck constant () as where is the difference in energy of the first singlet excited state (1E symmetry) in the presence of a finite magnetic field () from that at zero field ():
| (1) |
While precise sensing of magnetic fields is then obtained by experimentally measuring shifts in the energy levels sublevels [19], we use shifts in the 1E excited state as a surrogate in our model 222Accurate quantitative changes in zero field splitting values are difficult to obtain with single-particle orbitals from DFT [48]. Post-Hartree–Fock methods (i.e., complete active space self-consistent field methods) give more accurate results, but are not tractable for the sensor-analyte system explored. This necessitates a surrogate value for zero field splitting. Here we use the singlet excited state that is involved in the excitation to the magnetic sublevels as a proxy..

Recently, many correlated 2D magnets such as ferromagnetic CrGeTe3 and antiferromagnetic CrI3, which exhibits layer dependent magnetic ordering below 45 K, have been studied [21, 22]. To fully characterize these materials, high resolution sensors are needed. CrI3 is an ideal analyte for quantum magnetic field sensing at the nanoscale, as prior studies have shown large discrepancies (five orders of magnitude) in magnetic fields with distance away from the surface of the monolayer (Fig. 1a). Zhong et al. used a CrI3/WSe2 heterostructure to calculate an effective magnetic field of 13 T from the valley splitting in WSe2 at 3.50 Å from CrI3. Single spin microscopy with a diamond-NV center has measured maximum magnetic fields of 0.31 mT at a distance of 62 nm from CrI3 [23, 24]. Additional studies on CrI3-based heterostructures have shown that such large magnetic fields are due to proximity exchange rather than the typical magnetostatics associated with stray magnetic fields [25, 26]. This raises the question of how the 2D magnet distributes the magnetic flux, and this knowledge is needed to guide codesign of spin-based logic and memory devices [27].
One approach to resolve the distance dependent magnetic field strengths is to layer thin films of Cr(o-tolyl)4, the sensor, of varying thicknesses on CrI3, the analyte and perform thickness dependent ODMR measurements. This quantum sensing geometry in the single-molecule limit is shown in Fig. 1a and it is the configuration we consider. (We discuss thin film effects later.) We expect two important magnetic interactions, proximity exchange and direct magnetic fields, to occur between Cr(o-tolyl)4 and the CrI3 substrate. Proximity exchange is a local effect and should dominate at short distances where electron wavefunctions directly overlap [28]; in contrast, direct magnetic fields from diploar contributions should dominate at longer distances. Notably, it is very difficult to measure proximity exchange through conventional magnetic sensing techniques outside of NMR spectroscopy.
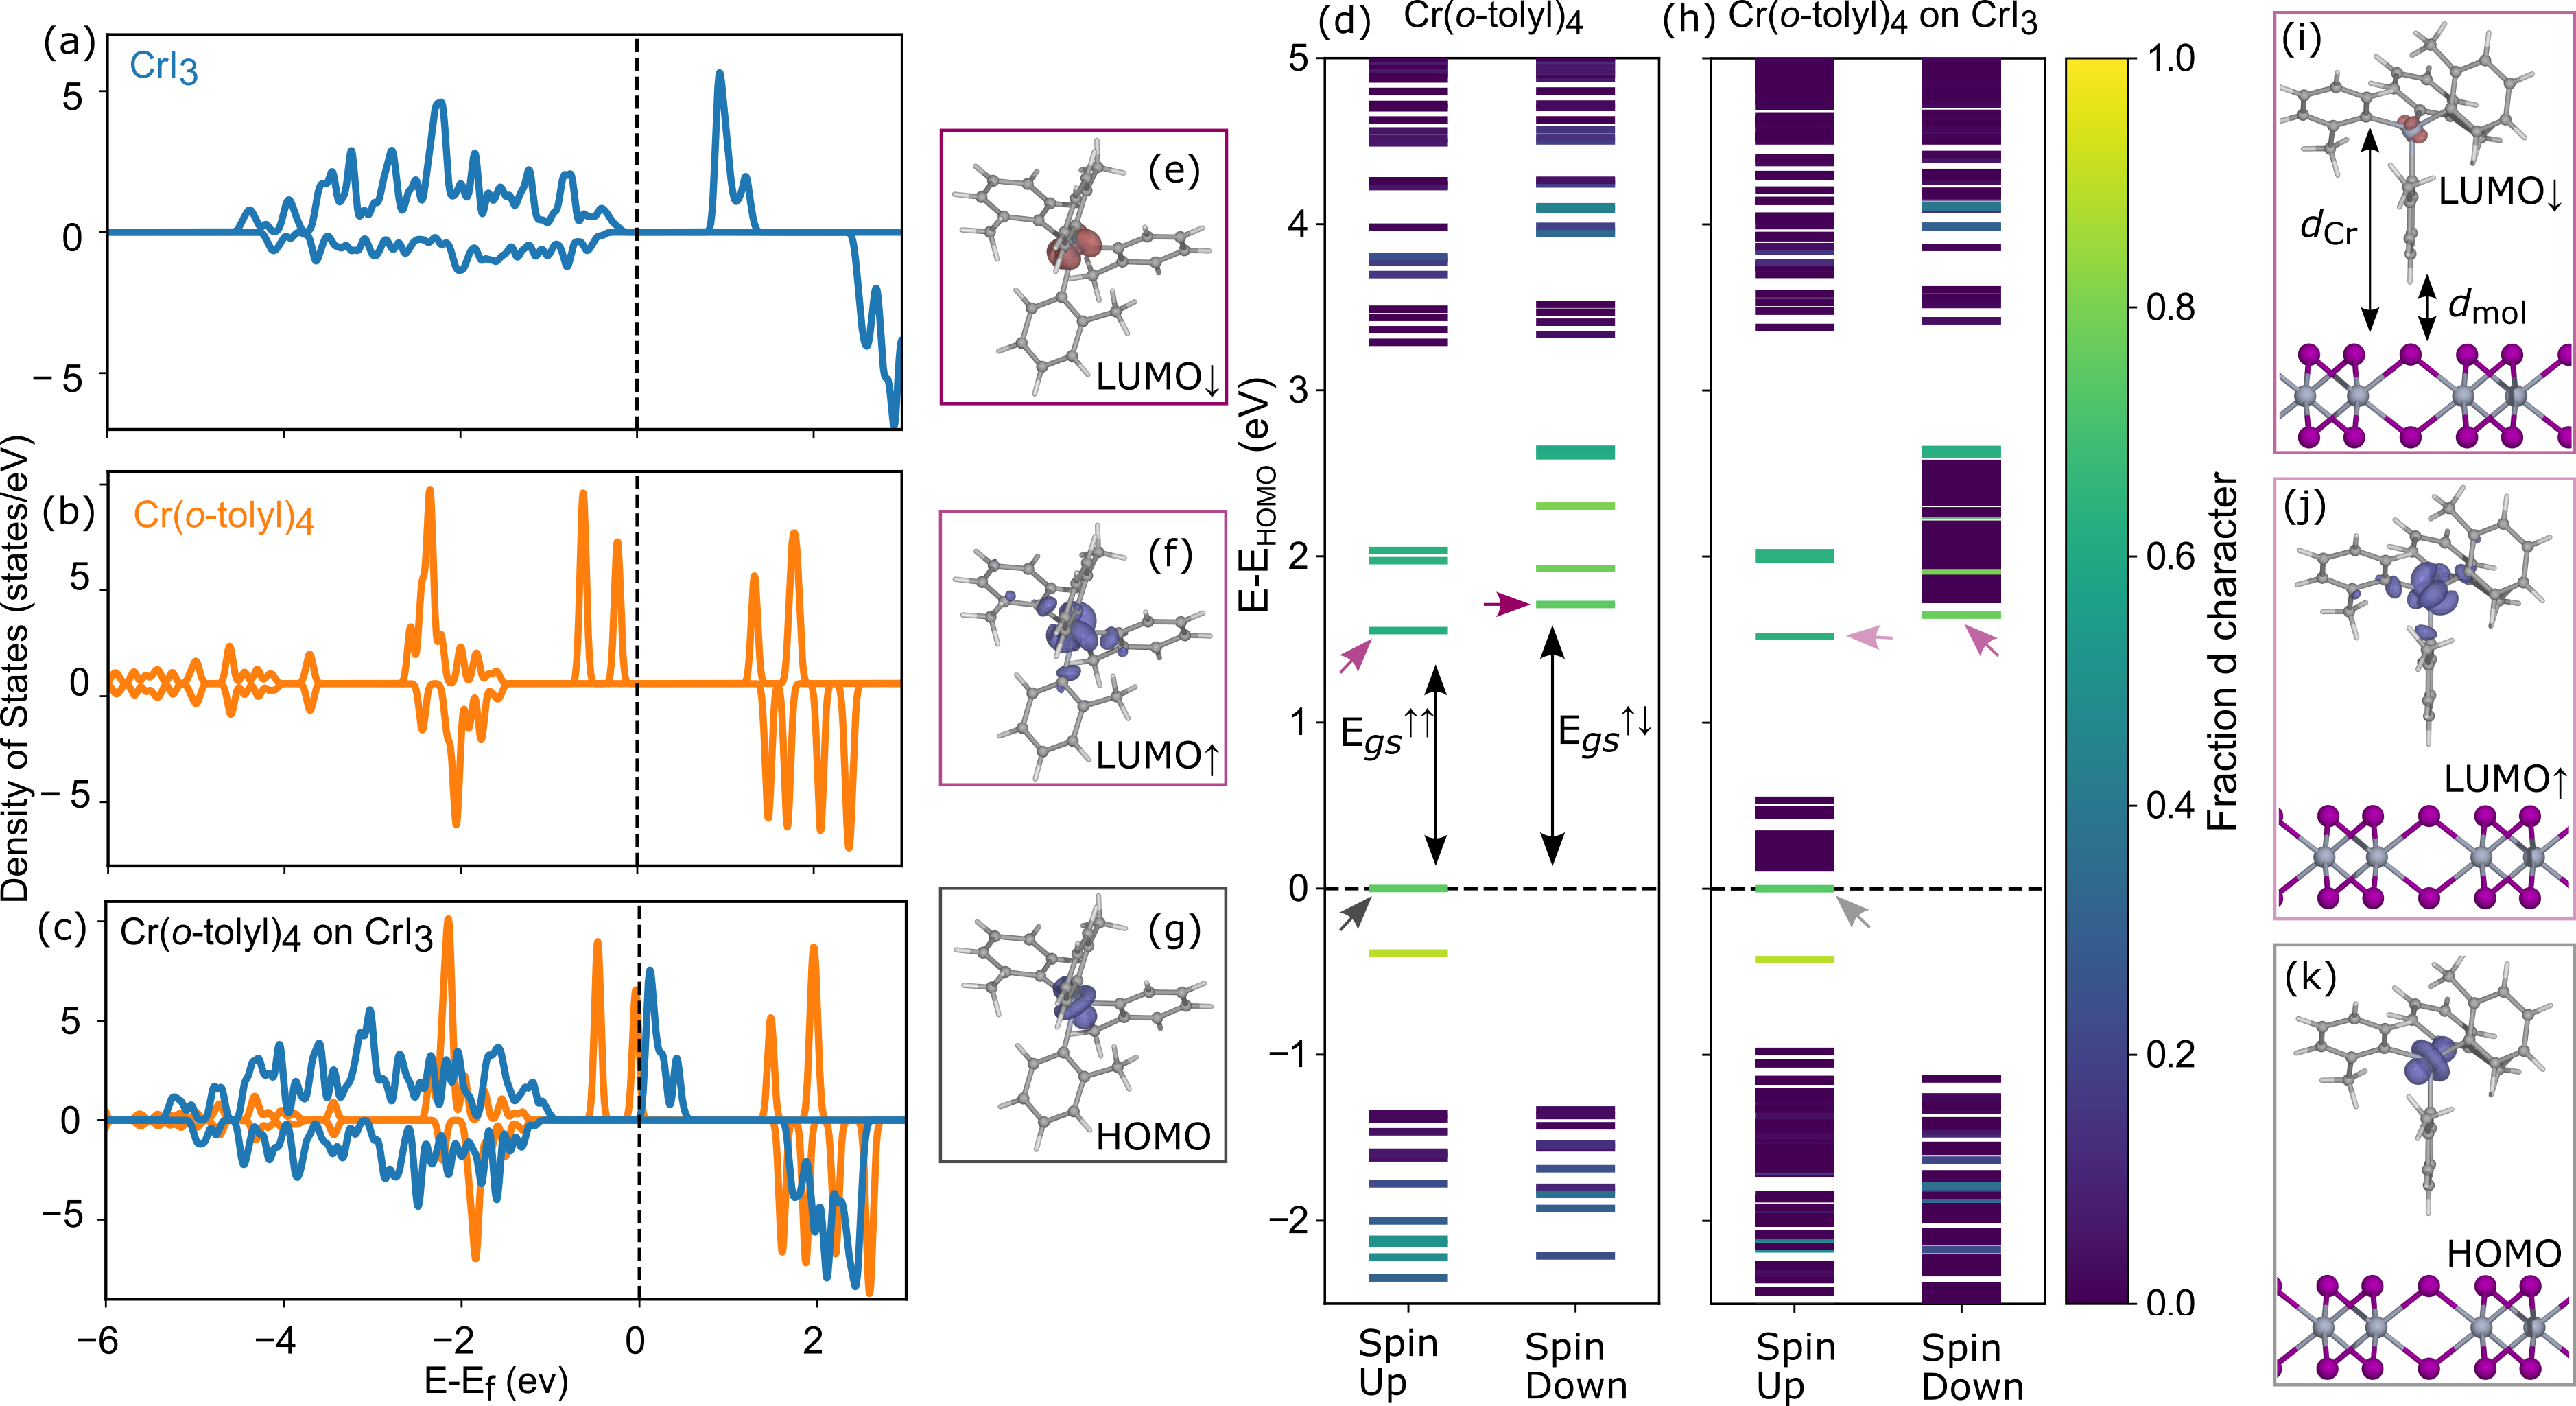
Here, we use density functional theory (DFT) simulations with magnetostatic calculations to show how the first excited state of Cr(o-tolyl)4 is affected by these interactions as a function of distance, demonstrating molecular color centers as a quantum magnetic sensing platform. We first performed electronic structure calculations on monolayer CrI3 at the DFT-PBE level without spin-orbit coupling and in a ferromagnetic spin configuration 333Ab-initio calculations were performed using the Vienna Ab-initio Simulation Package (VASP version 5.4.4) [49, 50, 51, 52] using projector augmented wave pseudo potentials [53, 54] and the PBE exchange correlation functional [55, 56] with the following valence configurations I(), Cr(), C(), and H(). We used a 600 eV energy cutoff for the planewave expansion and an energy convergence of . For -point integrations, Gaussian smearing of 0.05 eV was used. . Fig. 2a shows there is a 1.1 eV band gap and a large spin polarization, which leads to a local spin moment of 3.3 on the Cr3+ site consistent with prior monolayer studies [30]. Next, we simulated the electronic structure of Cr(o-tolyl)4 444For all systems involving the isolated molecule and the molecule on the substrate a single -point at the point was used. For calculations on the 2D monolayer CrI3 a -point grid was used. All components of the system were initially relaxed with a force convergence of 10-3 meV Å-1 within in a simulation cell providing an spacing of 15 Å between periodic images of the molecule in all directions or the substrate in the out of plane direction. Excited state (es) calculations were performed using the -SCF method [57, 58]. We calculate E by subtracting the total energy of a constrained occupancy calculation, where the electron in the the spin-up HOMO is promoted to the spin-down LUMO, from a standard ground state DFT calculation. For all calculations, including the constrained occupancy calculations, the relaxed ground state geometry is used. Changes in E were then used to calculate the implied magnetic fields based on the Zeeman shift using Equation 1. , which has the 3A ground state (gs) with both the d and d orbitals singly occupied (Fig. 2b). The first 1E excited state involves a spin nonconserving transition to a doubly occupied d orbital. Fig. 2d shows that the highest occupied molecular orbital (HOMO), spin up lowest unoccupied molecular orbital (LUMO), and spin down LUMO have significant d character (Fig. 2e-g). The energy difference between the HOMO and LUMO (E) is 1.52 eV, while the energy difference between the spin up HOMO and the spin down LUMO (E) is 1.64 eV. We find in the gas-phase approximation that the excited state energy is 0.62 eV, which is underpredicted from recent experiments that approximate it as 1.21 eV [15]. This underestimation is expected based on our use of a semilocal density functional.
Next, we created the combined analyte-sensor system. Cr(o-tolyl)4 is brought in proximity to the CrI3 surface in a parallel and perpendicular configuration, as shown in Fig. 1b. With these two configurations, we carried out adsorption site calculations with the metal center in Cr(o-tolyl)4 in the hollow and top positions of CrI3 (Fig. 1c). These calculations included van der Waals energy corrections implemented with the DFT-D3 method of Grimme [32, 33]. We find that the lowest energy configuration is the perpendicular orientation of the molecule at the hollow adsorption site at a distance of Å ( Å) from the surface. These two distances, shown in Fig. 1b, give the distance between the surface atom in monolayer CrI3 that is most extended in the out-of-plane direction, , with the nearest atom or the Cr cation, respectively, in Cr(o-tolyl)4. The energies for other sites were similar with a difference in energy of 40 eV between the lowest and highest energy configurations.
Fig. 2c shows the overall electronic structure of the constituent materials is largely unchanged in the equilibrium geometry for the combined system. There is a rigid shift in states for CrI3, owing to surface Fermi level pinning (charge neutrality level), that brings the HOMO of Cr(o-tolyl)4 just below the conduction band of CrI3. The semiconducting nature of monolayer CrI3 persists with minor changes in bandwidth. Similarly, there is a minor increase in the width of the HOMO. Fig. 2h presents the fraction d character for orbitals near the Fermi level for Cr(o-tolyl)4 adsorbed on CrI3 in its equilibrium position. Fig. 2i-k show no significant change in character for the orbitals in the Cr(o-tolyl)4 molecule. These findings cause us to deduce that Cr(o-tolyl)4 is physisorbed onto CrI3. (The parallel geometry also leads to no noticeable changes in the electronic structure of either the molecular color sensor or analyte.)
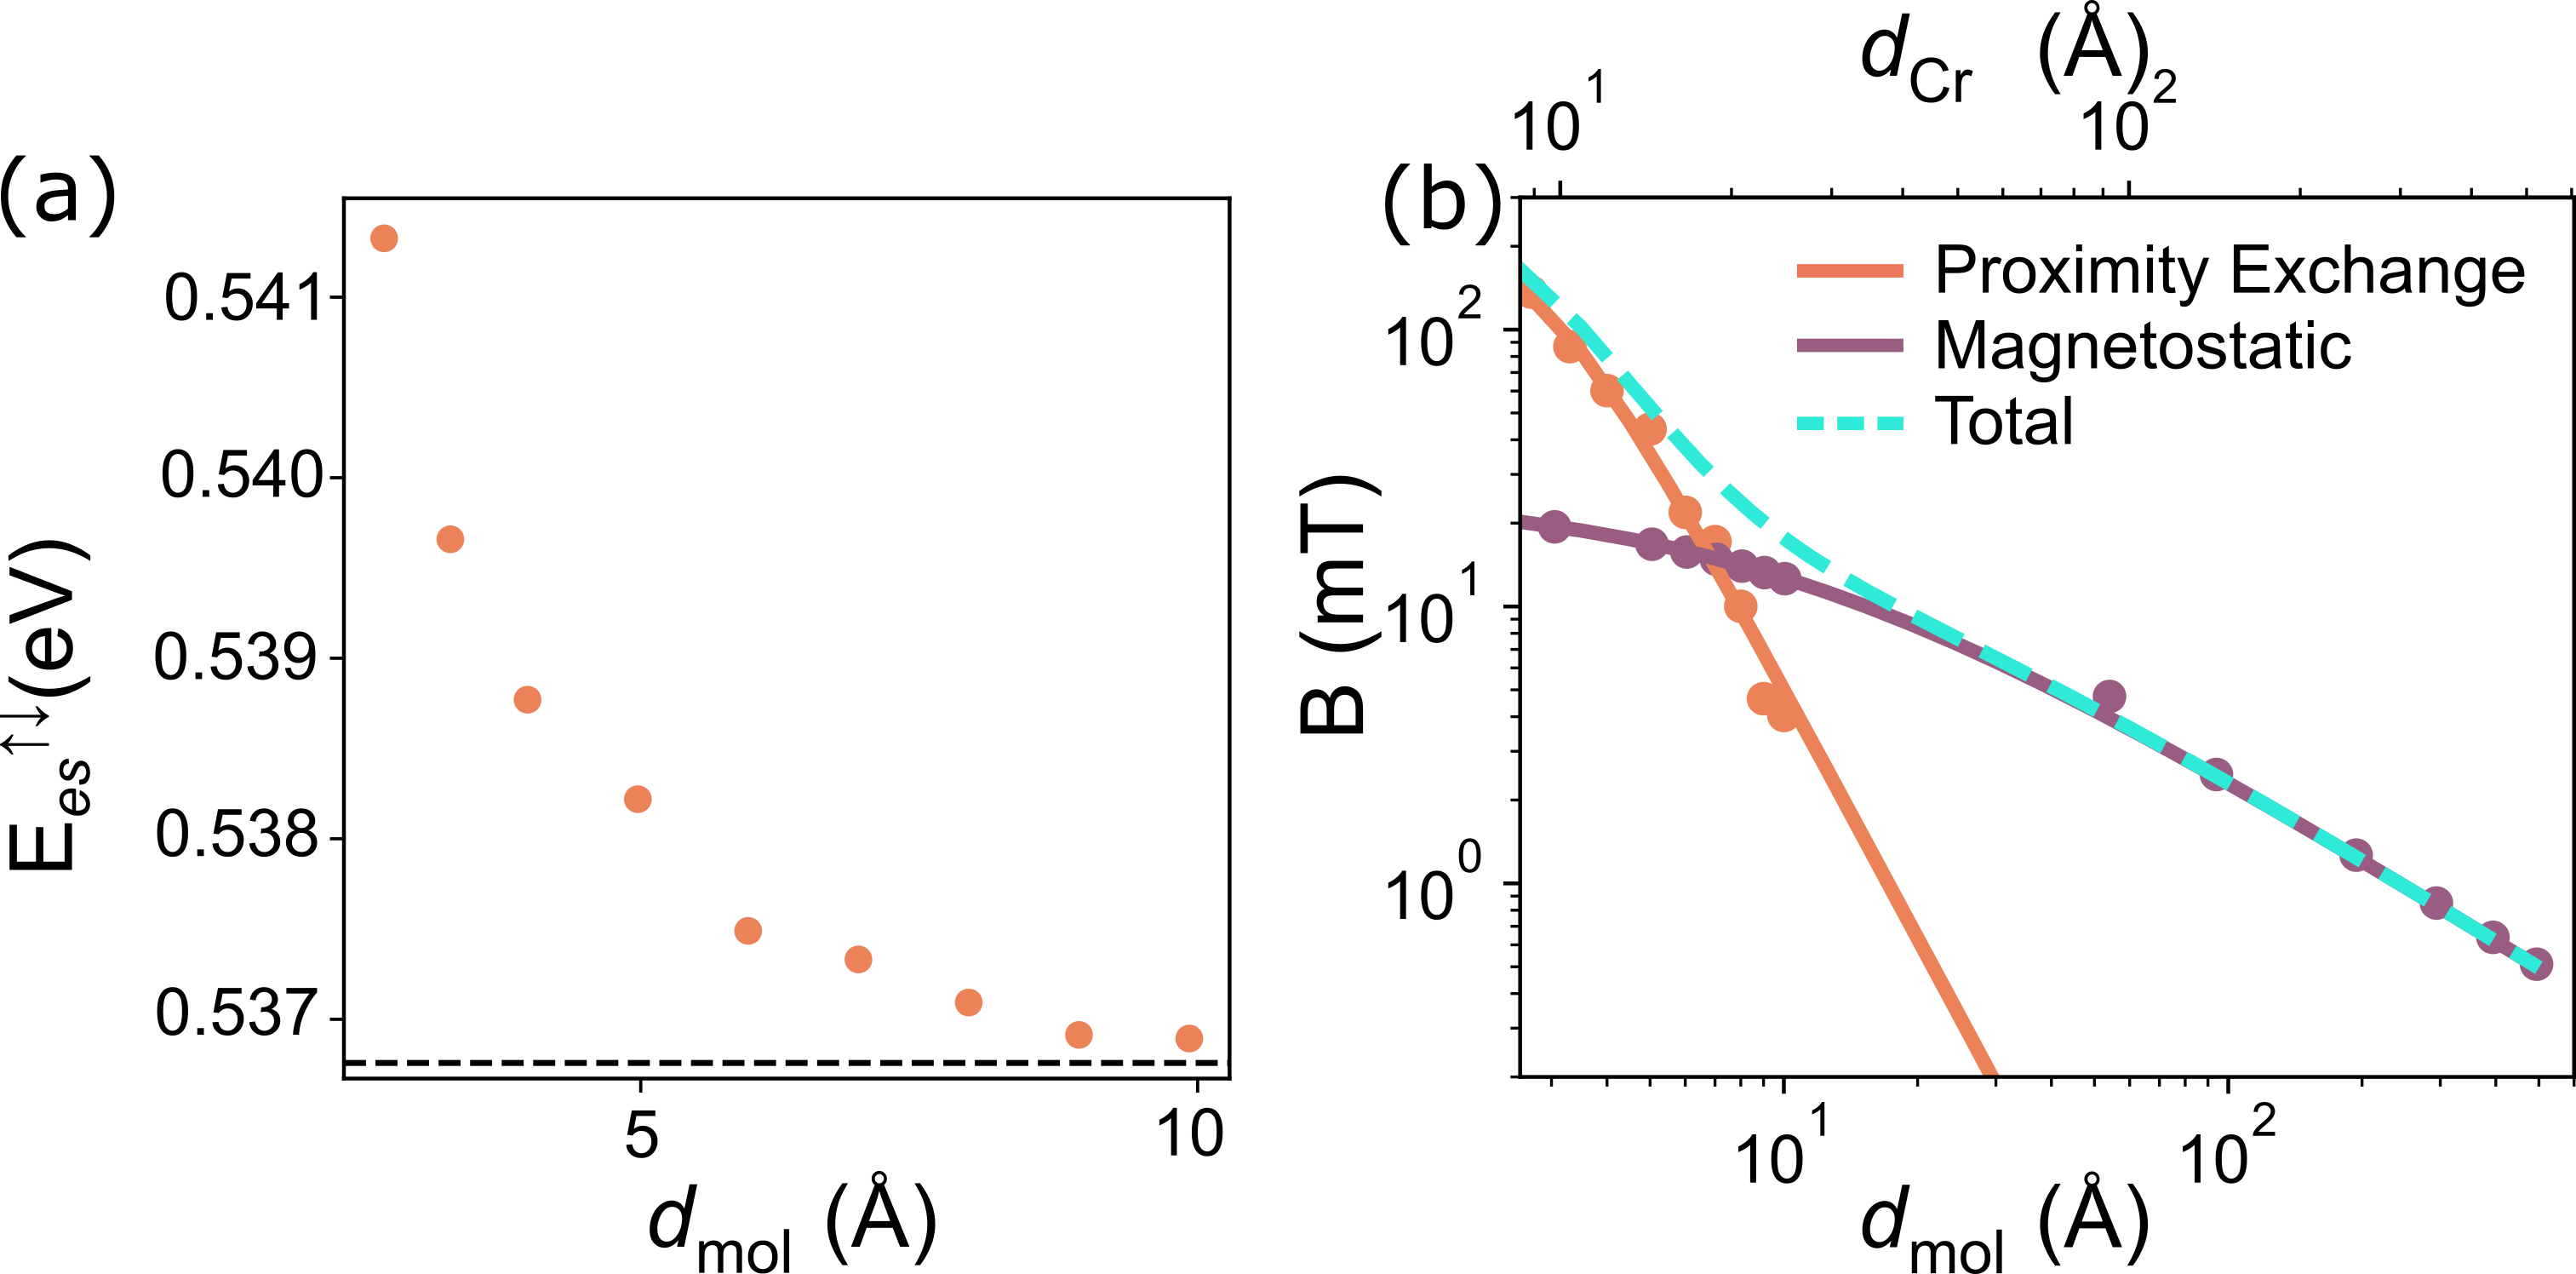
In the aforementioned equilibrium geometry, we find that E and E increase slightly to 1.55 eV and 1.71 eV, respectively. E also decreases to 0.540 eV. We use these changes in the 3A ground state and 1E excited state energies of Cr(o-tolyl)4 to calculate the implied magnetic field sensed by the molecular color center through the Zeeman interaction. Here we obtain mT at the equilibrium distance of 3 Å. We next examined the changes to these energies as a function of distance between between Cr(o-tolyl)4 and CrI3 as means to map the magnetic field distribution transverse to the analyte. Fig. 3a shows that the energy of the first excited state decreases as Cr(o-tolyl)4 approaches CrI3 over the range Å. This value falls off cubically as the distance increases, as shown in Fig. 3b, with the smallest computed field being 5.0 mT at 10 Å. As with the isolated molecule, these calculations do not account for relaxations in the excited state. Also, these excited state energies of the molecule for the combined system are obtained relative to the structure of the relaxed molecule at the equilibrium distance without any geometric changes due to the change in distance from CrI3; therefore, they represent the smallest changes expected as atomic displacements would further increase the energy differences.
We find the excited state energy of the isolated molecule changes from 0.621 eV in the fully relaxed geometry to 0.537 eV when the molecule’s geometry is taken from the relaxed equilibrium combined structure. We use from the fully relaxed molecule to calculate an effective magnetic field of T at Å from the surface. This may be compared to mT obtained at the same distance using from an unrelaxed geometry. This discrepancy is due to steric distortions to the inner shell of the Cr(o-tolyl)4 when adsorbed on the CrI3 surface without charge transfer or bond formation. We find a change in the coordination environment leading to an increase in the geometry index, which quantifies the distortion of a 4 coordinate metal complex on a scale from 0 (square planar) to 1 (tetrahedral) [34], from 0.941 to 0.960 for the isolated molecule and the molecule on the surface, respectively. As this change is caused by the interaction of the molecule with the surface, we expect it to decrease with increasing distance between the molecule and the substrate. Raman or infrared spectroscopy could be used to observe the structural distortion through shifts in the vibrational mode frequencies [35].
We next computed the magnetic fields using a generalized model for the magnetostatic interactions from a parallelepipedic magnet [36], representing a coarse-grained model of CrI3 555Scripts for magnetostatic modeling are available at https://github.com/MTD-group/Magnetostatic-Model-CrI3. Here, we modeled a freely suspended monolayer flake of CrI3 with in-plane dimensions of m within vacuum inside a m area simulation cell in order to sample the field at the edge and above the flake (Fig. 4a). The magnetic field was sampled every 7 Å over the plane of the simulation cell at vertical distances from the flake between Å. For input into the magnetostatic simulation, we modeled the magnetic polarization of CrI3 using two methods: (1) a constant polarization calculated from an average of the DFT calculated spin density and (2) a full spin-density with each element in the spin density grid treated as a magnetic parallelepiped. We used the grid-based spin density approach (model 2) to calculate magnetic fields at distances less than 20 Å, while for greater distances we used the average calculated spin density (model 1). Both the grid based and the average spin density models quantitatively agree at distances ( Å) as shown in the Supporting Information [38]. The largest differences in magnetic fields from these two models occur for short distances, e.g., the difference in maximum field is 4.6 mT at 5 Å. This difference is much smaller than the 5 orders of magnitude discrepancy between previous experimental measurements.
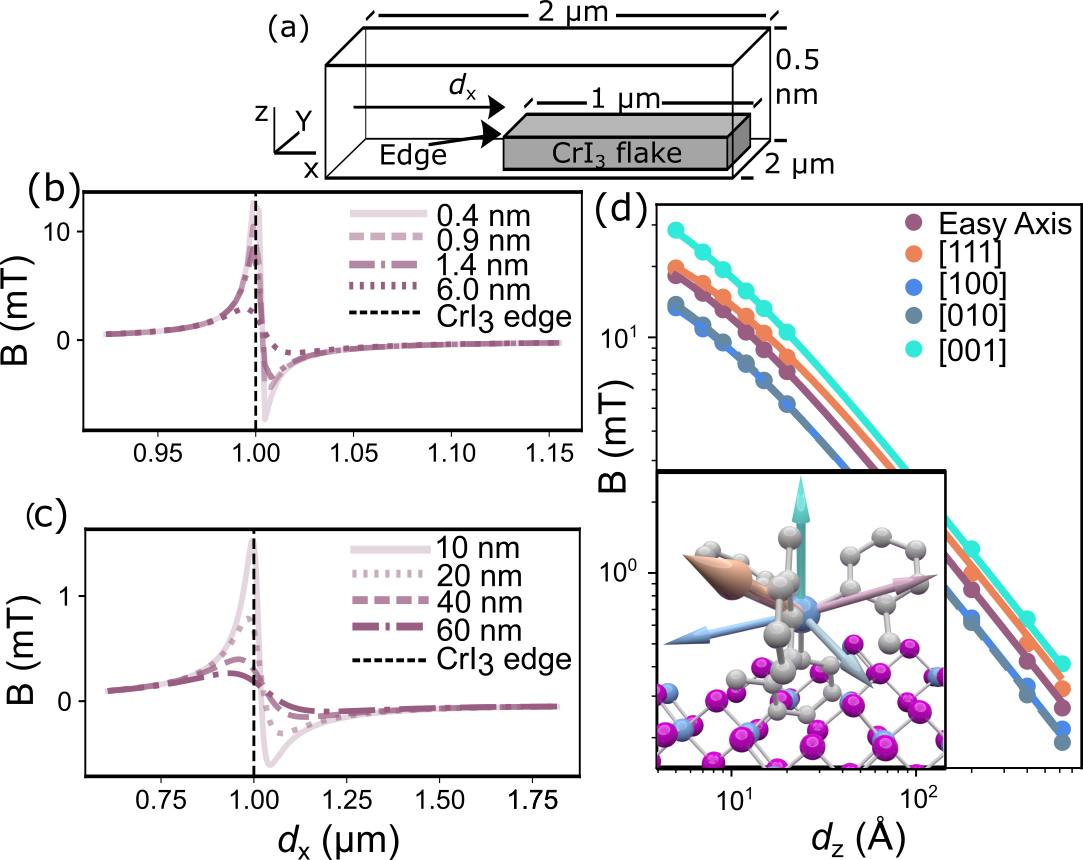
Fig. 4b,c show that the magnetic field sharply increases in magnitude at the edge of the CrI3 surface and then decreases to a small value over the top of the surface. The field then rapidly decreases to zero in the lateral direction beyond the CrI3 boundary. Fig. 4b,c further show that the peak magnetic field amplitude along the normal direction, , of monolayer CrI3 increases and becomes more localized (decreasing peak width) with decreasing distance between Cr(o-tolyl)4 and the analyte. We find for nm, the magnetic field mT. This value closely matches the experimental maximum magnetic field of 0.31 mT reported at the same distance [24], demonstrating fidelity of the molecular color center is comparable to state-of-the-art diamond-NV centers. We compute the corresponding changes in energy for these magnetic fields from , and find for the smallest fields eV, which are within the resolution of current ODMR measurements [14, 24].
Fig. 3b shows the total magnetic field sensed as a function of distance decomposed into contributions from proximity exchange and the magnetostatics. Proximity exchange contributions are dominate up to 8 Å from CrI3. The short span over which proximity exchange is the main contribution to the total magnetic field is due to the cubic distance dependent, , decrease in proximity exchange compared to the decrease for direct magnetic fields. While our analysis utilizes a single molecular color center, experimental setups would require molecular films. By comparing the distances where proximity exchange is the main contribution to the magnetic field to the inter-molecule spacing in the bulk molecular crystal ( Å), we can extrapolate and determine the interaction a monolayer molecular film of Cr(o-tolyl)4 senses. Here, proximity exchange would dominate the magnetic signal. In film thicknesses greater than these, the magnetostatic contributions would dominate the signal with proximity exchange having no measurable component. Experimental molecular films may also exhibit textures and grain boundaries. Such microstructure could elicit separate responses from distortions in the geometry of the molecule, which has a large effect on the excited state energy. This could lead to increased variance in energy changes, adding complexity to interpretation of ODMR results.
Although the magnetic field from CrI3 is a vector quantity, these sensors will yield a scalar value for the field that has been projected along the easy axis of the spin qubit. The axis of quantization is important in both understanding the field magnitude for our single color center model and how molecular conformations in deposited films, further from the analyte, modify the alignment of the molecule’s easy axis with respect to the direction of the magnetic field, thereby altering sensitivity. To understand how these factors affect the fidelity of the field read-out, we next determined the spin quantization axis by performing noncollinear relativistic DFT calculations with spin-orbit coupling on isolated Cr(o-tolyl)4. The energy of the easy axis aligned with the z axis, (-0.784, 0.500, 0.368), with respect to the combined molecule/substrate simulation cell was lower by 3.9 eV compared to the x axis and lower by 4.0 eV compared to the y axis (Fig. 4d, inset). Fig. 4d shows that the magnetic field decreases with independent of the quantization axis, and these values are in good quantitative agreement with experiment. There is, however, a strong dependence of the field strength on the axis of quantization, e.g., the largest different being 14 mT at 2.7 Å from the substrate.
Tailoring the easy axis of the sensor to the direction of the field would allow for maximum sensitivity. We now use this approach to quantize the simulated magnetic fields along the easy axis of a diamond-NV center and compare to the molecular color center. We find that they are within 20 T at nm. Comparing the magnetic field quantized along the easy axis from the Cr(o-tolyl)4 on CrI3, to the field quantized along the [111] easy axis of a diamond-NV center, shows similar field strengths with the diamond NV center slightly larger. Neither the lowest energy orientation of Cr(o-tolyl)4 nor the known easy axis of the NV center are aligned with the axis having the largest magnetic field for CrI3 (the z axis). The flexibility of molecular color centers both in the ligand and matrix may be useful variables to tune in maximizing the sensitivity of the sensor.
Cr(o-tolyl)4 has a highly temperature dependent relaxation time varying from 500 to 3 s between 5 and 40 K, respectively, which necessitates sensing at low temperatures [15, 14]. Our use case for the sensor shown here, monolayer magnets, also have low ordering temperatures (45 K for CrI3 and 42 K for CrGeTe3) [39, 40, 41], making the molecular color center an ideal sensing platform. Other potential use cases for these sensors include Kitaev materials, a SOC-entangled subclass of Mott insulators, such as RuCl3, which exhibits unique zig-zag magnetic ordering below 7 K [42, 43]. Additionally, magnetic defects, that may harm the performance of superconducting qubits via decoherence channels, could be spatially mapped, as these magnetic defects are known to occur below 12 K [44, 45]. Sensing higher temperature phenomena will require increasing relaxation times, and there are substantial efforts focused on engineering ligand environments in molecular color centers to expand the useful temperature ranges to above liquid nitrogen [15, 46, 47, 35].
In summary, we find that magnetic fields range from 94 mT to 0.28 mT over 3 Å to 60 nm, respectively, using a single-sensing platform. We predict that at distances beyond 8 Å from the 2D magnet, direct magnetic fields, i.e., the primary field probed by traditional magnetic field sensors, dominates the signal over the shorter range proximity exchange interaction. Our results show how molecular color centers can be used to sense magnetic fields with high fidelity over a range of distances, and how the platform forms a novel metrology to discern phenomena in low dimensional systems. The inherent flexibility of molecular color centers suggest alterations to the molecule could allow for optimizing the easy axis direction and the orientation of the molecule on the surface to allow for improved sensing.
Acknowledgements.
This work was supported by the U.S. Department of Energy, Office of Science, Basic Energy Sciences under award DE-SC0019356. This work used resources at the National Energy Research Scientific Computing Center, a DOE Office of Science User Facility supported by the Office of Science of the U.S. Department of Energy under Contract No. DE-AC02-05CH11231.References
- Ku et al. [2020] M. J. H. Ku, T. X. Zhou, Q. Li, Y. J. Shin, J. K. Shi, C. Burch, L. E. Anderson, A. T. Pierce, Y. Xie, A. Hamo, U. Vool, H. Zhang, F. Casola, T. Taniguchi, K. Watanabe, M. M. Fogler, P. Kim, A. Yacoby, and R. L. Walsworth, Imaging viscous flow of the Dirac fluid in graphene, Nature 583, 537 (2020).
- Vool et al. [2021] U. Vool, A. Hamo, G. Varnavides, Y. Wang, T. X. Zhou, N. Kumar, Y. Dovzhenko, Z. Qiu, C. A. C. Garcia, A. T. Pierce, J. Gooth, P. Anikeeva, C. Felser, P. Narang, and A. Yacoby, Imaging phonon-mediated hydrodynamic flow in WTe2, Nature Physics 17, 1216 (2021).
- Marchiori et al. [2022] E. Marchiori, L. Ceccarelli, N. Rossi, L. Lorenzelli, C. L. Degen, and M. Poggio, Nanoscale magnetic field imaging for 2D materials, Nature Reviews Physics 4, 49 (2022).
- Ripka [2000] P. Ripka, New directions in fluxgate sensors, Journal of Magnetism and Magnetic Materials 215–216, 735 (2000).
- Zheng et al. [2017] Y. Zheng, L. Huang, Z. Zhang, J. Jiang, K. Wang, L.-M. Peng, and G. Yu, Sensitivity enhancement of graphene Hall sensors modified by single-molecule magnets at room temperature, RSC Advances 7, 1776 (2017).
- Li et al. [2021] R. Li, S. Zhang, S. Luo, Z. Guo, Y. Xu, J. Ouyang, M. Song, Q. Zou, L. Xi, X. Yang, J. Hong, and L. You, A spin–orbit torque device for sensing three-dimensional magnetic fields, Nature Electronics 4, 179 (2021).
- Taylor et al. [2008] J. M. Taylor, P. Cappellaro, L. Childress, L. Jiang, D. Budker, P. R. Hemmer, A. Yacoby, R. Walsworth, and M. D. Lukin, High-sensitivity diamond magnetometer with nanoscale resolution, Nature Physics 4, 810 (2008).
- Degen et al. [2017] C. L. Degen, F. Reinhard, and P. Cappellaro, Quantum sensing, Rev. Mod. Phys. 89, 035002 (2017).
- Hong et al. [2013] S. Hong, M. S. Grinolds, L. M. Pham, D. Le Sage, L. Luan, R. L. Walsworth, and A. Yacoby, Nanoscale magnetometry with NV centers in diamond, MRS Bulletin 38, 155 (2013).
- Radtke et al. [2019] M. Radtke, E. Bernardi, A. Slablab, R. Nelz, and E. Neu, Nanoscale sensing based on nitrogen vacancy centers in single crystal diamond and nanodiamonds: Achievements and challenges, Nano Futures 3, 042004 (2019).
- Xie et al. [2022] M. Xie, X. Yu, L. V. H. Rodgers, D. Xu, I. Chi-Durán, A. Toros, N. Quack, N. P. de Leon, and P. C. Maurer, Biocompatible surface functionalization architecture for a diamond quantum sensor, Proceedings of the National Academy of Sciences 119, e2114186119 (2022).
- Tesi et al. [2023] L. Tesi, F. Stemmler, M. Winkler, S. S. Y. Liu, S. Das, X. Sun, M. Zharnikov, S. Ludwigs, and J. van Slageren, Modular approach to creating functionalized surface arrays of molecular qubits, Advanced Materials n/a, 2208998 (2023).
- Note [1] While the isolated molecule has symmetry, we use the symmetry labels of the idealized tetrahedral structure.
- Bayliss et al. [2020] S. L. Bayliss, D. W. Laorenza, P. J. Mintun, B. D. Kovos, D. E. Freedman, and D. D. Awschalom, Optically addressable molecular spins for quantum information processing, Science 370, 1309 (2020).
- Laorenza et al. [2021] D. W. Laorenza, A. Kairalapova, S. L. Bayliss, T. Goldzak, S. M. Greene, L. R. Weiss, P. Deb, P. J. Mintun, K. A. Collins, D. D. Awschalom, T. C. Berkelbach, and D. E. Freedman, Tunable Cr4+ Molecular Color Centers, Journal of the American Chemical Society 143, 21350 (2021).
- Koehl et al. [2017] W. F. Koehl, B. Diler, S. J. Whiteley, A. Bourassa, N. T. Son, E. Janzén, and D. D. Awschalom, Resonant optical spectroscopy and coherent control of spin ensembles in sic and gan, Phys. Rev. B 95, 035207 (2017).
- Diler et al. [2020] B. Diler, S. J. Whiteley, C. P. Anderson, G. Wolfowicz, M. E. Wesson, E. S. Bielejec, F. Joseph Heremans, and D. D. Awschalom, Coherent control and high-fidelity readout of chromium ions in commercial silicon carbide, npj Quantum Information 6, 1 (2020).
- Maze et al. [2008] J. R. Maze, P. L. Stanwix, J. S. Hodges, S. Hong, J. M. Taylor, P. Cappellaro, L. Jiang, M. V. G. Dutt, E. Togan, A. S. Zibrov, A. Yacoby, R. L. Walsworth, and M. D. Lukin, Nanoscale magnetic sensing with an individual electronic spin in diamond, Nature 455, 644 (2008).
- Rondin et al. [2012] L. Rondin, J.-P. Tetienne, P. Spinicelli, C. Dal Savio, K. Karrai, G. Dantelle, A. Thiaville, S. Rohart, J.-F. Roch, and V. Jacques, Nanoscale magnetic field mapping with a single spin scanning probe magnetometer, Applied Physics Letters 100, 153118 (2012).
- Note [2] Accurate quantitative changes in zero field splitting values are difficult to obtain with single-particle orbitals from DFT [48]. Post-Hartree–Fock methods (i.e., complete active space self-consistent field methods) give more accurate results, but are not tractable for the sensor-analyte system explored. This necessitates a surrogate value for zero field splitting. Here we use the singlet excited state that is involved in the excitation to the magnetic sublevels as a proxy.
- Gibertini et al. [2019] M. Gibertini, M. Koperski, A. F. Morpurgo, and K. S. Novoselov, Magnetic 2D materials and heterostructures, Nature Nanotechnology 14, 408 (2019).
- Wang et al. [2022] Q. H. Wang, A. Bedoya-Pinto, M. Blei, A. H. Dismukes, A. Hamo, S. Jenkins, M. Koperski, Y. Liu, Q.-C. Sun, E. J. Telford, H. H. Kim, M. Augustin, U. Vool, J.-X. Yin, L. H. Li, A. Falin, C. R. Dean, F. Casanova, R. F. L. Evans, M. Chshiev, A. Mishchenko, C. Petrovic, R. He, L. Zhao, A. W. Tsen, B. D. Gerardot, M. Brotons-Gisbert, Z. Guguchia, X. Roy, S. Tongay, Z. Wang, M. Z. Hasan, J. Wrachtrup, A. Yacoby, A. Fert, S. Parkin, K. S. Novoselov, P. Dai, L. Balicas, and E. J. G. Santos, The magnetic genome of two-dimensional van der waals materials, ACS Nano 16, 6960 (2022).
- Zhong et al. [2017] D. Zhong, K. L. Seyler, X. Linpeng, R. Cheng, N. Sivadas, B. Huang, E. Schmidgall, T. Taniguchi, K. Watanabe, M. A. McGuire, W. Yao, D. Xiao, K.-M. C. Fu, and X. Xu, Van der Waals engineering of ferromagnetic semiconductor heterostructures for spin and valleytronics, Science Advances 3, e1603113 (2017).
- Thiel et al. [2019] L. Thiel, Z. Wang, M. A. Tschudin, D. Rohner, I. Gutiérrez-Lezama, N. Ubrig, M. Gibertini, E. Giannini, A. F. Morpurgo, and P. Maletinsky, Probing magnetism in 2D materials at the nanoscale with single-spin microscopy, Science 364, 973 (2019).
- Zollner et al. [2020] K. Zollner, P. E. Faria Junior, and J. Fabian, Giant proximity exchange and valley splitting in transition metal dichalcogenide//(Co, Ni) heterostructures, Physical Review B 101, 085112 (2020).
- Zollner et al. [2019] K. Zollner, P. E. Faria Junior, and J. Fabian, Proximity exchange effects in and heterostructures with : Twist angle, layer, and gate dependence, Physical Review B 100, 085128 (2019).
- Ahn [2020] E. C. Ahn, 2d materials for spintronic devices, npj 2D Materials and Applications 4, 17 (2020).
- Zollner and Fabian [2022] K. Zollner and J. Fabian, Proximity effects in graphene on monolayers of transition-metal phosphorus trichalcogenides , Phys. Rev. B 106, 035137 (2022).
- Note [3] Ab-initio calculations were performed using the Vienna Ab-initio Simulation Package (VASP version 5.4.4) [49, 50, 51, 52] using projector augmented wave pseudo potentials [53, 54] and the PBE exchange correlation functional [55, 56] with the following valence configurations I(), Cr(), C(), and H(). We used a 600 eV energy cutoff for the planewave expansion and an energy convergence of . For -point integrations, Gaussian smearing of 0.05 eV was used.
- Wang and Sanyal [2021] D. Wang and B. Sanyal, Systematic Study of Monolayer to Trilayer CrI3: Stacking Sequence Dependence of Electronic Structure and Magnetism, The Journal of Physical Chemistry C 125, 18467 (2021).
- Note [4] For all systems involving the isolated molecule and the molecule on the substrate a single -point at the point was used. For calculations on the 2D monolayer CrI3 a -point grid was used. All components of the system were initially relaxed with a force convergence of 10-3 meV Å-1 within in a simulation cell providing an spacing of 15 Å between periodic images of the molecule in all directions or the substrate in the out of plane direction. Excited state (es) calculations were performed using the -SCF method [57, 58]. We calculate E by subtracting the total energy of a constrained occupancy calculation, where the electron in the the spin-up HOMO is promoted to the spin-down LUMO, from a standard ground state DFT calculation. For all calculations, including the constrained occupancy calculations, the relaxed ground state geometry is used. Changes in E were then used to calculate the implied magnetic fields based on the Zeeman shift using Equation 1.
- Grimme et al. [2010] S. Grimme, J. Antony, S. Ehrlich, and H. Krieg, A consistent and accurate ab initio parametrization of density functional dispersion correction (DFT-D) for the 94 elements H-Pu, The Journal of Chemical Physics 132, 154104 (2010).
- Grimme et al. [2011] S. Grimme, S. Ehrlich, and L. Goerigk, Effect of the damping function in dispersion corrected density functional theory, Journal of Computational Chemistry 32, 1456 (2011).
- Okuniewski et al. [2015] A. Okuniewski, D. Rosiak, J. Chojnacki, and B. Becker, Coordination polymers and molecular structures among complexes of mercury(II) halides with selected 1-benzoylthioureas, Polyhedron 90, 47 (2015).
- Amdur et al. [2022] M. J. Amdur, K. R. Mullin, M. J. Waters, D. Puggioni, M. K. Wojnar, M. Gu, L. Sun, P. H. Oyala, J. M. Rondinelli, and D. E. Freedman, Chemical control of spin–lattice relaxation to discover a room temperature molecular qubit, Chem. Sci. 13, 7034 (2022).
- Ravaud and Lemarquand [2009] R. Ravaud and G. Lemarquand, Magnetic field produced by a parallelpipedic magnet of various and uniform polarization, Progress In Electromagnetics Research 98, 207 (2009).
- Note [5] Scripts for magnetostatic modeling are available at https://github.com/MTD-group/Magnetostatic-Model-CrI3.
- [38] See Supplemental Material at [URL will be inserted by publisher] for additional details of the magnetostatic modeling.
- Tiwari et al. [2021] S. Tiwari, M. L. Van de Put, B. Sorée, and W. G. Vandenberghe, Magnetic order and critical temperature of substitutionally doped transition metal dichalcogenide monolayers, npj 2D Materials and Applications 5, 1 (2021).
- Burch et al. [2018] K. S. Burch, D. Mandrus, and J.-G. Park, Magnetism in two-dimensional van der waals materials, Nature 563, 47 (2018).
- Georgescu et al. [2022] A. B. Georgescu, A. J. Millis, and J. M. Rondinelli, Trigonal symmetry breaking and its electronic effects in the two-dimensional dihalides and trihalides , Phys. Rev. B 105, 245153 (2022).
- Trebst and Hickey [2022] S. Trebst and C. Hickey, Kitaev materials, Physics Reports 950, 1 (2022).
- Sears et al. [2015] J. A. Sears, M. Songvilay, K. W. Plumb, J. P. Clancy, Y. Qiu, Y. Zhao, D. Parshall, and Y.-J. Kim, Magnetic order in : A honeycomb-lattice quantum magnet with strong spin-orbit coupling, Phys. Rev. B 91, 144420 (2015).
- Fang et al. [2015] C. M. Fang, M. A. van Huis, Q. Xu, R. J. Cava, and H. W. Zandbergen, Unexpected origin of magnetism in monoclinic nb12o29 from first-principles calculations, J. Mater. Chem. C 3, 651 (2015).
- Sheridan et al. [2021] E. Sheridan, T. F. Harrelson, E. Sivonxay, K. A. Persson, M. V. P. Altoé, I. Siddiqi, D. F. Ogletree, D. I. Santiago, and S. M. Griffin, Microscopic Theory of Magnetic Disorder-Induced Decoherence in Superconducting Nb Films (2021).
- Fielding et al. [2006] A. J. Fielding, S. Fox, G. L. Millhauser, M. Chattopadhyay, P. M. Kroneck, G. Fritz, G. R. Eaton, and S. S. Eaton, Electron spin relaxation of copper(ii) complexes in glassy solution between 10 and 120k, Journal of Magnetic Resonance 179, 92 (2006).
- Atzori et al. [2018] M. Atzori, S. Benci, E. Morra, L. Tesi, M. Chiesa, R. Torre, L. Sorace, and R. Sessoli, Structural effects on the spin dynamics of potential molecular qubits, Inorganic Chemistry 57, 731 (2018).
- Kubica et al. [2013] A. Kubica, J. Kowalewski, D. Kruk, and M. Odelius, Zero-field splitting in nickel(ii) complexes: A comparison of dft and multi-configurational wavefunction calculations, The Journal of Chemical Physics 138, 064304 (2013).
- Kresse and Hafner [1993] G. Kresse and J. Hafner, Ab initio molecular dynamics for liquid metals, Physical Review B 47, 558 (1993).
- Kresse and Hafner [1994] G. Kresse and J. Hafner, Ab initio molecular-dynamics simulation of the liquid-metal–amorphous-semiconductor transition in germanium, Physical Review B 49, 14251 (1994).
- Kresse and Furthmüller [1996a] G. Kresse and J. Furthmüller, Efficiency of ab-initio total energy calculations for metals and semiconductors using a plane-wave basis set, Computational Materials Science 6, 15 (1996a).
- Kresse and Furthmüller [1996b] G. Kresse and J. Furthmüller, Efficient iterative schemes for ab initio total-energy calculations using a plane-wave basis set, Physical Review B 54, 11169 (1996b).
- Kresse and Joubert [1999] G. Kresse and D. Joubert, From ultrasoft pseudopotentials to the projector augmented-wave method, Physical Review B 59, 1758 (1999).
- Blöchl [1994] P. E. Blöchl, Projector augmented-wave method, Physical Review B 50, 17953 (1994).
- Perdew et al. [1997] J. P. Perdew, K. Burke, and M. Ernzerhof, Generalized Gradient Approximation Made Simple [Phys. Rev. Lett. 77, 3865 (1996)], Physical Review Letters 78, 1396 (1997).
- Perdew et al. [1996] J. P. Perdew, K. Burke, and M. Ernzerhof, Generalized Gradient Approximation Made Simple, Physical Review Letters 77, 3865 (1996).
- Hellman et al. [2004] A. Hellman, B. Razaznejad, and B. I. Lundqvist, Potential-energy surfaces for excited states in extended systems, The Journal of Chemical Physics 120, 4593 (2004).
- Gavnholt et al. [2008] J. Gavnholt, T. Olsen, M. Engelund, and J. Schiøtz, self-consistent field method to obtain potential energy surfaces of excited molecules on surfaces, Phys. Rev. B 78, 075441 (2008).