Constraints on the Size and Composition of the Ancient Martian Atmosphere from Coupled \ceCO2-\ceN2-\ceAr Isotopic Evolution Models
Abstract
Present-day Mars is cold and dry, but mineralogical and morphological evidence shows that liquid-water existed on the surface of ancient Mars. In order to explain this evidence and assess ancient Mars’s habitability, one must understand the size and composition of the ancient atmosphere. Here we place constraints on the ancient Martian atmosphere by modeling the coupled, self-consistent evolution of atmospheric \ceCO2, \ceN2, and \ceAr on Mars from 3.8 billion years ago (Ga) to the present. Our model traces the evolution of these species’ abundances and isotopic composition caused by atmospheric escape, volcanic outgassing, and crustal interaction. Using a Markov-Chain Monte Carlo method to explore a plausible range of parameters, we find hundreds of thousands of model solutions that recreate the modern Martian atmosphere. These solutions indicate that Mars’s atmosphere contained 0.3-1.5 bar \ceCO2 and 0.1-0.5 bar \ceN2 at 3.8 Ga. The global volume of deposited carbonates critically determines the ancient atmospheric composition. For example, a 1 bar \ceCO2 ancient atmosphere with 0.2-0.4 bar \ceN2 requires 0.9 bar \ceCO2 deposited in carbonates primarily in open-water systems. With the joint analysis of \ceC, \ceN, and \ceAr isotopes, we refine the constraints on the relative strengths of outgassing and sputtering, leading to an indication of a reduced early mantle from which the outgassing is sourced. Our results indicate that a \ceCO2-\ceN2 atmosphere with a potential \ceH2 component on ancient Mars is consistent with Mars’s geochemical evolution and may explain the evidence for its past warm and wet climate.
1 Introduction
Evidence for liquid-water on ancient Mars’s surface has yet to be reconciled with our knowledge of ancient Mars’s atmosphere and climate. Modern Mars is cold and has a thin atmosphere, leaving liquid-water unstable to evaporation or freezing on most of its surface (Haberle et al., 2001). However, geomorphological and mineralogical evidence convincingly shows abundant liquid-water existed at least transiently on Mars’s surface 3 billion years ago (Ga) and earlier (e.g., Fassett & Head, 2011). Thus, the climate on ancient Mars must have been significantly different from today. A thicker ancient atmosphere with various additional components has been proposed to explain this evidence, but the size, composition, and warming mechanism remain unknown empirically (e.g., Wordsworth, 2016). The putative ancient atmosphere must be consistent not only with the evidence for liquid-water, but also with Mars’s geochemical evolution. In other words, if there was a thick, multi-component atmosphere on ancient Mars, then it must have evolved to have the modern size and composition. Reconciling these aspects of ancient Mars will allow more precise evaluation of Mars’s biological potential and a better understanding of how Mars’s surface environment has changed over time.
CO2 alone cannot provide the greenhouse warming necessary to explain the evidence for liquid-water, but the addition of \ceN2 and \ceH2 may help. 1-dimensional and 3-dimensional climate models show that an atmosphere containing only \ceCO2 and \ceH2O cannot warm ancient Mars enough to explain the geologic evidence, regardless of the atmosphere’s size (Kasting, 1991; Forget et al., 2013; Wordsworth et al., 2013). One or more secondary atmospheric greenhouse gases are likely required. To this end, \ceH2 is a potential component of the ancient atmosphere that can cause at least episodic warming of the surface via \ceCO2-\ceH2 collision induced absorption (CIA) (Ramirez et al., 2014; Wordsworth et al., 2017; Ramirez et al., 2020; Wordsworth et al., 2021). Additionally, isotopic evolution models indicate that the ancient atmosphere may have contained substantial \ceN2 (Hu & Thomas, 2022), which can also contribute to surface warming. von Paris et al. (2013) show that up to 13K warming on ancient Mars could come from \ceN2-\ceN2 CIA and pressure broadening of \ceCO2 absorption lines, but potential warming from \ceH2 was not included. When combined with \ceH2, \ceN2-\ceH2 CIA is a powerful greenhouse mechanism even with small amounts of \ceH2 (Wordsworth & Pierrehumbert, 2013). Warming from these mechanisms may also be enhanced by high-altitude clouds (Urata & Toon, 2013; Ramirez & Kasting, 2017; Kite et al., 2021). From a climate perspective alone, various combinations of these mechanisms may provide enough warming on ancient Mars to be consistent with the geologic evidence for water.
As an alternative to reverse engineering the ancient atmosphere from the evidence for liquid-water, knowledge of Mars’s geochemical evolution can be used to constrain the ancient atmosphere. Specifically, the isotopic composition of present-day Mars offers a window into how the atmosphere has evolved. Planetary processes occurring throughout Mars’s history leave distinct fingerprints on the present-day atmosphere’s isotopic composition (Jakosky, 1991). For example, thermal and non-thermal atmospheric escape processes on Mars preferentially eject the lighter isotope of a given atmospheric species, causing isotopic fractionation. The different modes of atmospheric escape (e.g., sputtering, photochemical reactions) fractionate Mars’s atmosphere at different rates. Deposition and sequestration of volatiles as minerals (e.g., carbonates and nitrates) and organics also fractionates the atmosphere, with preference to either the light or heavy isotope (Faure, 1991; Lammer et al., 2020; House et al., 2022). Volcanically outgassed species introduced to the atmosphere will have an isotopic composition that reflects Mars’s interior (e.g., Wright et al., 1992; Mathew & Marti, 2001). Ultimately, the isotopic composition of present-day Mars’s atmosphere is a product of these and other processes operating throughout Mars’s history. By quantifying the rate at which they add or remove species from the atmosphere and their fractionation effect, it is possible to model the evolution of the mass and isotopic composition of Mars’s atmosphere.
Isotopic evolution modeling studies place constraints on Mars’s ancient atmospheric composition and its subsequent evolution (Jakosky, 1991; Pepin, 1991; Zahnle, 1993; Jakosky et al., 1994; Pepin, 1994; Jakosky & Jones, 1997; Lammer et al., 2003; Kurokawa et al., 2014; Hu et al., 2015; Villanueva et al., 2015; Kurokawa et al., 2016; Slipski & Jakosky, 2016; Kurokawa et al., 2018, 2021; Scheller et al., 2021; Hu & Thomas, 2022). An effective approach has been to find valid trajectories for Mars’s atmospheric composition and evolution by comparing isotopic evolution models to present-day measurements of Mars’s atmosphere. Jakosky et al. (1994) and Pepin (1994) laid the groundwork for modeling studies of this type, but more recent studies have been able to incorporate measurements from missions such as the Curiosity rover (Wong et al., 2013; Atreya et al., 2013; Webster et al., 2013) and MAVEN (Jakosky et al., 2015a). For example, Hu et al. (2015) model the evolution of \ceCO2 and suggest the atmosphere was less than 1 bar at 3.8 Ga unless there was significant carbonate deposition in open-water systems. Slipski & Jakosky (2016) model the evolution of argon and place constraints on the rates of sputtering, volcanic outgassing, and crustal erosion. Kurokawa et al. (2018) model the evolution of nitrogen and noble gases and find the atmosphere must be more than 0.5 bar at 4 Ga. Kurokawa et al. (2021) model the evolution of neon and suggest there was recent active volcanism. Scheller et al. (2021) model the evolution of D/H in water and suggest that 30-99 of the water on ancient Mars was sequestered into minerals in the crust. Hu & Thomas (2022) model the evolution of nitrogen and suggest that an atmosphere with hundreds of mbar \ceN2 at 3.8 Ga is likely. These studies reveal the power of isotopic evolution modeling to constrain the ancient Martian atmosphere.
We present a comprehensive, coupled model for the isotopic evolution of \ceCO2, \ceN2, and \ceAr in the Martian atmosphere, which are the three most abundant species today. This is the first study to self-consistently model the evolution of both the total abundances of \ceCO2, \ceN2, and \ceAr, and their relative amounts of , , , , , , and . Few previous models include all three of \ceCO2, \ceN2, and \ceAr, and those that do have not been able to incorporate recent Martian measurements (Jakosky et al., 1994), or did not include isotopic constraints from , , and (Kurokawa et al., 2018). Like previous coupled models, the abundances and isotopic ratios of the atmospheric species are dynamically updated at each timestep according to a range of planetary processes. Their subsequent mixing ratios are then used to calculate the rate at which planetary processes impact each species in the atmosphere for the next timestep. Because we include multiple species at once, existing constraints on individual species are tested against each other, and new, comprehensive constraints on the Martian atmosphere emerge. Thus, solutions found with this model are the first to be self-consistent with respect to the evolution of the abundances of \ceCO2, \ceN2, and \ceAr, and their constituent \ceC, \ceN, and \ceAr isotopes in Mars’s atmosphere. Other new aspects of our model include an obliquity and pressure dependent treatment of atmospheric collapse, and revised photochemical escape rates based on laboratory experiments and models. Like previous works (e.g., Kurokawa et al., 2018; Hu & Thomas, 2022), we also present a comprehensive analysis of parameter space using a Markov Chain Monte Carlo method.
The rest of this paper is structured as follows. In Section 2 we describe our model. In Section 3 we present constraints on the ancient Martian atmosphere and the results of our statistical analysis. In Section 4 we discuss the implications of our model results for the ancient Martian atmosphere and compare our results to other studies. In Section 5 we present conclusions from this study.
2 Methods
2.1 Model Overview
The model we present tracks the abundance and isotopic composition of \ceCO2, \ceN2, and \ceAr on Mars’s surface from 3.8 Ga to present. 3.8 Ga is chosen as the model starting point because it is after the last major impact (3.9 Ga; Fassett & Head, 2011; Robbins et al., 2013), and because geologic evidence indicates Mars’s internal magnetic field should have ceased by this time (Lillis et al., 2008). This model is based on previous models presented in Hu et al. (2015) and Hu & Thomas (2022). The time evolution of the abundances of \ceCO2, \ceN2, and \ceAr on Mars’s surface are described by the following equations:
| (1) |
| (2) |
| (3) |
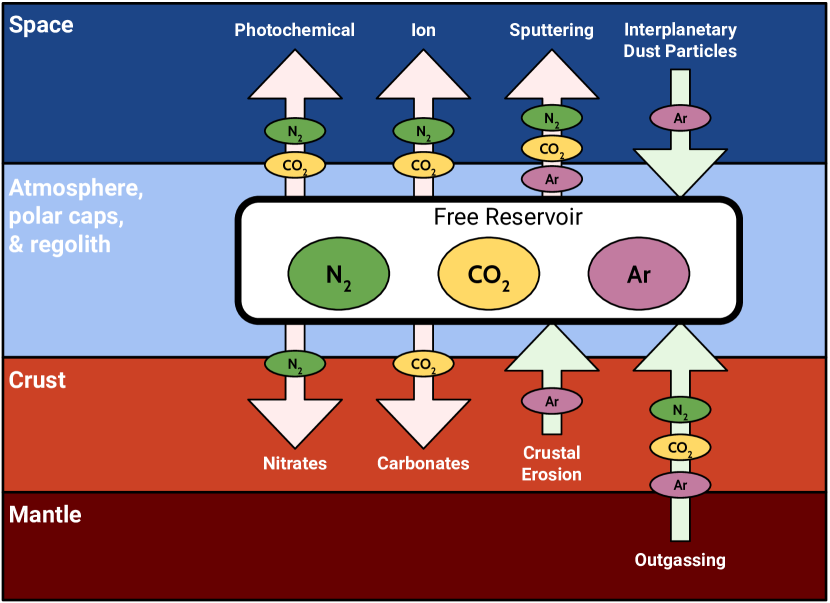
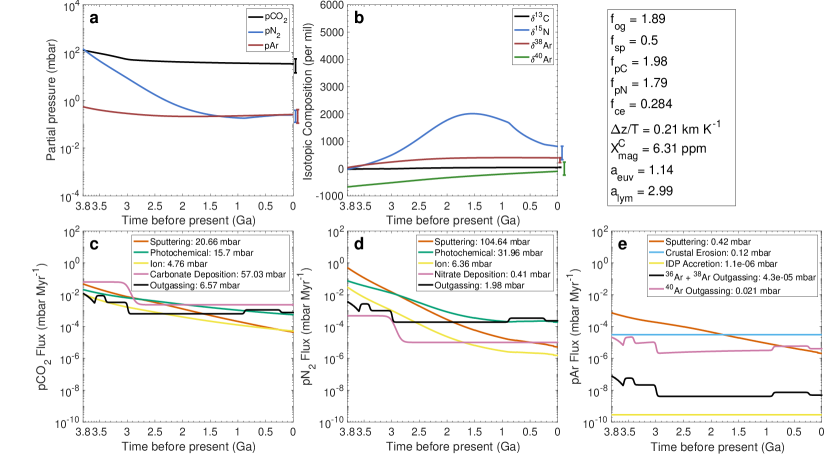
where represents the flux of species due to process in units mbar Myr-1. is volcanic outgassing, is escape caused by pickup-ion sputtering, is escape caused by photochemical reactions, is direct escape of ionized species, is the formation of carbonate minerals on the surface, is the formation of nitrate minerals on the surface, is release from crustal erosion, and is the delivery of interplanetary dust particles (IDPs). \cepCO2, \cepN2, and \cepAr are the partial pressures for each species in surface reservoirs that exchange on short timescales - referred to as the free reservoir (see Section 2.2). An overview of the model configuration is shown in Figure 1.
The evolution of the isotopic composition of \ceCO2, \ceN2, and \ceAr is determined by the fluxes described above. Isotopic composition is calculated using delta notation reported in parts per thousand (), defined for carbon in \ceCO2 as:
| (4) |
where the standard is VPDB with (Faure, 1991). For nitrogen, is the enhancement of relative to the Earth’s atmosphere, (Coplen et al., 2002). For argon, is the enhancement of relative to the solar value (Vogel et al., 2011; Pepin et al., 2012) and is the enhancement of relative to the modern Martian atmospheric value (Mahaffy et al., 2013). Sputtering, photochemical reactions, ion escape, and mineral formation are assumed to be Rayleigh fractionation processes with associated fractionation factors. Volcanic outgassing, crustal erosion, and the delivery of IDPs are mixing processes that introduce species of a distinct isotopic composition to the atmosphere, but do not have an inherent fractionation effect.
2.2 The Free Reservoir and Atmospheric Collapse
The free reservoir includes all surface reservoirs that exchange particles on short timescales such that they are in isotopic and thermodynamic equilibrium over geologic time. \ceN2 and \ceAr do not condense into ice within the temperature and pressure range of Mars’s history, so the free reservoir for these species only includes the atmosphere and any adsorption by the regolith. On the other hand, atmospheric \ceCO2 can collapse to form polar ice caps in vapor equilibrium with the bulk atmosphere (Haberle et al., 1994). For this reason, the free reservoir of \ceCO2 includes the atmosphere, the regolith, and the polar ice caps.
We consider the possibility that atmospheric collapse happened periodically throughout Mars’s history. The criteria for atmospheric collapse in our model are based on 3D General Circulation Model (GCM) simulations done at the Laboratoire de Météorologie Dynamique (the “LMD” model) (Forget et al., 2013). For a given surface pressure, there is a critical value of obliquity: if Mars’s obliquity is equal to or below this value, \ceCO2 will collapse to the polar caps. According to this model, the atmosphere will not collapse regardless of obliquity when the surface pressure is between 600 mbar and 3 bar.
We must know if the obliquity at a given time is below the critical value in order to determine if the atmosphere was collapsed. The past obliquity of Mars is chaotic and not explicitly known prior to several million years ago. Furthermore, the timescale of Mars’s obliquity cycle is much smaller than a typical model timestep, and thus the atmosphere may be both collapsed and uncollapsed in a single timestep (Ward, 1974). Laskar et al. (2004) put statistical constraints on the past obliquity of Mars and generate probability density functions for Mars’s obliquity at discrete times as far back as 4 Ga. We integrate these functions to estimate the amount of time that Mars had an obliquity below the critical value during a timestep in our model and calculate the probability that the atmosphere was collapsed ():
| (5) |
where is the model time, is Mars’s obliquity, is the critical obliquity from the GCM simulations, and is the probability density function from Laskar et al. (2004) that is closest to the model time. The probability of atmospheric collapse, , is interpreted as the fraction of each timestep spent in the collapsed state.
The flux of atmospheric escape for each species is calculated by taking the weighted average of the escape fluxes over a collapsed and an uncollapsed atmosphere. We first calculate the atmospheric escape fluxes for all species in the uncollapsed scenario, assuming the atmospheric \cepCO2 is equal to the \ceCO2 contained in the free reservoir. We then calculate the atmospheric escape fluxes assuming the atmosphere is collapsed, where all \ceCO2 in the free reservoir condenses onto the poles, and 6 mbar remains in the atmosphere to maintain vapor equilibrium. The fluxes calculated in these scenarios will be different because all atmospheric escape processes for each species depend on their mixing ratios, which depend on atmospheric \cepCO2. To calculate the actual fluxes used to evolve the model, we take the weighted average of the fluxes with respect to the fraction of time spent in the collapsed state:
| (6) |
where is the flux of species from a source or sink. We refer to this as the pressure-obliquity dependent treatment of atmospheric collapse. To test model sensitivity, we also consider a scenario in which atmospheric collapse does not happen at all ().
2.3 Volcanic Outgassing
Volcanic outgassing occurs when species dissolved in extrusive or intrusive Martian magma are exolved into the atmosphere. We model the flux of species outgassed into the free reservoir () via the following equation (Hu & Thomas, 2022):
| (7) |
where is the crustal production rate, is the density of the crust (2900 kg m-2), is the concentration of species i in the source magma, and is a multiplication factor that accounts for the uncertainty in the crustal production rate, concentrations in the source magma, and the outgassing efficiency (including the extrusive-to-intrusive ratio). We employ a crustal production rate based on a combination of thermal evolution models and photogeological analysis (Greeley & Schneid, 1991; Grott et al., 2011) which is also adopted by a previous model of the argon isotope system (Slipski & Jakosky, 2016). We consider the crater chronology of Mars’s surface from Hartmann (2005) as the baseline case, and Ivanov (2001) as the variant (see Hu & Thomas, 2022, Extended Data Figure 3b).
The concentration of in the source magma () is solubility-limited and dependent on the redox state of the Martian mantle (Hirschmann & Withers, 2008; Grott et al., 2011). These interior models indicate that ranges from 5 ppm at mantle oxygen fugacity of IW-1 to as much as 1,000 ppm at IW+1, so we explore this range. We assume that the concentration of in the source magma () is not solubility-limited, and we adopt the “Silicate Earth” concentration, ppm (Marty & Dauphas, 2003). The concentration and isotopic composition of \ceAr in the source magma is discussed in Section 2.4.
The introduction of species into the free reservoir via volcanic outgassing has an impact on isotopic composition due to bulk mixing. This is described by the equation:
| (8) |
where is the updated isotopic composition of species i in the free reservoir, is the partial pressure of species i outgassed per time step, is the partial pressure of species i in the free reservoir before the outgassing occurs, is the isotopic composition of species i in the source magma, and is the isotopic composition of species i in the free reservoir before the outgassing occurs. We assume -25 based on analysis of the mantle degassed from the magmatic component of the SNC (shergottites, nakhlites, chassignites) meteorites (Wright et al., 1992). We assume -30 based on measurements of the Martian meteorite ALH 84001 (Mathew & Marti, 2001).
2.4 The Argon Isotope System and Crustal Erosion
The three most abundant argon isotopes on present-day Mars are \ce^36Ar, \ce^38Ar, and \ce^40Ar (Atreya et al., 2013; Mahaffy et al., 2013). Thus, argon on the surface of Mars can be characterized by a total partial pressure of the 3 isotopes combined, and two values that relate to isotopic composition - and , both of which track enrichment relative to \ce^36Ar. \ce^36Ar and \ce^38Ar are both stable isotopes and \ce^40Ar is radiogenically produced from the decay of \ce^40K. The stable Ar isotopes are treated similarly to \ceCO2 and \ceN2. Following Slipski & Jakosky (2016), we derive Martian source magma abundances of and from Earth’s atmosphere. Thus, we assume ppm (Marty, 2012) and = 5.305 (Lee et al., 2006), which is equivalent to assuming = 36 relative to the solar abundance.
The treatment of is more complicated because it is sourced from the radioactive decay of \ce^40K. The radiogenic production of occurs almost entirely in the crust and mantle because potassium is highly refractory. Thus, the concentration of \ce^40Ar in the source magma for volcanic outgassing is directly related to the magma concentration of \ce^40K and changes as the planet evolves. Additionally, \ce^40K is sequestered into the Martian crust during volcanic emplacement, and will then decay into \ce^40Ar in the crust. This crustal \ce^40Ar can then be released by crustal erosion and represents another source of \ce^40Ar to the atmosphere. Once in the atmosphere, \ce^40Ar is treated the same as the other argon isotopes.
We follow the model of Slipski & Jakosky (2016) to calculate the evolution of \ce^40Ar. Their model tracks the abundance of \ce^40K and \ce^40Ar in the crust and mantle, and includes decay processes, volcanic emplacement, and crustal erosion. Following Slipski & Jakosky (2016), we assume a mantle \ce^40K concentration of 0.4 ppm at 4.4 Ga, which decreases with time as it decays and is sequestered into the crust. The crustal production rate and volcanic outgassing multiplier in our model determines how much \ce^40K is lost from the mantle to the crust. We extend our model crustal production rate from 3.8 Ga to 4.4 Ga by employing the interior model of Grott et al. (2011). We do not need to extend any other model processes to the time before our model domain because the \ce^40K and \ce^40Ar interior evolution does not depend on any other aspects of the modeled system. In the end, we obtain the \ce^40Ar source magma concentration () as a function of time from 3.8 Ga to present, which we use to calculate the \ce^40Ar volcanic outgassing flux.
During volcanic emplacement, \ce^40K is sequestered into the crust, where it eventually decays into \ce^40Ar. Following Leblanc et al. (2012) and Slipski & Jakosky (2016), we assume \ce^40K is enriched in the crust by a factor of 5 because it is an incompatible element and will concentrate in the melt during volcanic emplacement. Slipski & Jakosky (2016) show that the release of crustal \ce^40Ar to the atmosphere (termed crustal erosion) is critical for reproducing the modern atmospheric composition, but the process through which the release occurs is poorly understood. Multiple methods of crustal erosion have been hypothesized to occur on Earth, some of which depend on groundwater and some of which don’t (Watson et al., 2007), but none have been confirmed. For simplicity, we model the crustal erosion of \ce^40Ar as a constant rate throughout Mars’s history. Uncertainty in this approach is absorbed into the sputtering multiplier and the crustal erosion multiplier, which is described below. To calculate the rate of \ce^40Ar supplied to the atmosphere from crustal erosion, we first calculate the total amount of \ce^40Ar produced in the crust over Mars’s history in the same way we calculate the evolution of the mantle \ce^40Ar concentration. We then calculate the amount of \ce^40Ar released to the atmosphere from crustal erosion as some percentage of the total produced crustal \ce^40Ar. is the parameter that determines this percentage, and varies from 0 to 1. The amount of \ce^40Ar released from crustal erosion is then spread over the model time domain as a constant source flux.
2.5 Mass-Dependent Separation above the Homopause
Sputtering, photochemical reactions, and direct loss of ionized species all take place at altitudes above the homopause, where the atmosphere is no longer well-mixed and each species takes on its mass-dependent scale height. This has implications for fractionation due to atmospheric escape processes because the lighter version of a given species will accumulate higher in the atmosphere, where it is more likely to be ejected. This is a diffusive fractionation effect, which is different from the fractionation effect inherent to a given loss process. The total fractionation factor for an atmospheric escape process is the product of the diffusive and the inherent fractionation factors. The fractionation factor due to mass-dependent separation above the homopause () is:
| (9) |
where is Mars’s surface gravity, is the mass difference of the particles specified by and , is the distance from the homopause to the altitude of escaping particles (i.e. the exobase), is the Boltzmann constant, and is the mean temperature of the thermosphere.
The quantity is important for determining the fractionation factor due to mass-dependent separation above the homopause. This parameter has been recently constrained by MAVEN measurements of argon in Mars’s upper atmosphere (Jakosky et al., 2017). Analysis of the MAVEN data shows that varies on short timescales in the range 0.2-0.5 km K-1. Thus, we take this quantity as a free parameter within this range that is constant over our model time domain. By employing the same value of for carbon, nitrogen, and argon, we implicitly assume that all atmospheric sinks are generating escaping particles at the same source altitude. This assumption is justified by recent investigations. The MAVEN measurements of argon indicate that the altitude of the exobase is in the range 140 - 200 km (Jakosky et al., 2017). This range is broadly consistent with models of photochemically escaping carbon (Lo et al., 2021) and nitrogen (Fox, 1993), and observations of ion escape (Jakosky et al., 2015b).
2.6 Sputtering
Atmospheric loss via pickup ion sputtering occurs when oxygen ions are accelerated by the solar wind and collide with other particles in the upper atmosphere, ejecting them from Mars’s gravity (Kass, 1999; Leblanc, 2002). This process occurs because Mars does not have an intrinsic magnetic field to protect the atmosphere from the solar wind during the modeled period (Lillis et al., 2008). This process was likely more effective at early epochs when the solar extreme ultraviolet (EUV) flux was higher. To model the sputtering flux (), we employ the following equation:
| (10) |
where is the sputtering rate of \ceCO2, is the yield for species i, is the concentration of species i in the bulk atmosphere, is the separation factor between species i and \ceCO2 at the exobase (Eq. 9), is a factor that accounts for the dilution of species i by other species at the exobase (Eq. 12), and is a multiplication factor to account for uncertainty in the parameterization. There is no inherent isotopic fractionation due to sputtering because of the high energy imparted on the escaping particles. All fractionation from sputtering is due to mass-dependent separation above the homopause.
To calculate , we employ 3D Monte Carlo simulations (Leblanc, 2002) fitted to the functional form:
| (11) |
in units of particles per second, where is the solar EUV flux and subscript 0 indicates the present-day value. We model the evolution of the EUV flux as , where is the age, and the EUV flux is larger at earlier times (Ribas et al., 2005; Claire et al., 2012; Tu et al., 2015). We scale the above \ceCO2 sputtering rate to \ceN2 and \ceAr using the ratio of the yields calculated in Monte Carlo simulations by Jakosky et al. (1994): , , and .
The sputtering rate for a given species is reduced by the presence of other species that can collide with the incident ions. This is captured by the dilution factor ():
| (12) |
where the sum is over the relevant species in Mars’s atmosphere and is the diffusion separation between species and \ceCO2 (Eq. 9). In addition to \ceCO2, \ceN2, and \ceAr, we include the minor species in Mars’s atmosphere in this sum: \ceO and \ceCO, which we assume to have abundances of 0.16%, and 0.06% by volume, respectively.
2.7 Photochemical Escape
2.7.1 Carbon
We scale the photochemical escape rate of carbon () by the evolution of the solar lyman continuum flux and the atmospheric abundance of \ceCO2:
| (13) |
where is the solar Lyman continuum flux, is the mixing ratio of \ceCO2 in the bulk atmosphere, is a power-law index, is a multiplication factor, and subscript indicates the present-day value. The power-law index and the multiplication factor are included to capture the uncertainties in the total escape rate as well as its dependence on the evolution of the solar lyman continuum flux. We adopt based on observations of young solar-like stars and the wavelength ranges that drive the majority of photochemical carbon escape (Ribas et al., 2005; Claire et al., 2012; Lo et al., 2021).
We break down the total photochemical escape rate of carbon into the five most efficient escape reactions according to recent 1D Monte Carlo photochemical models (Lo et al., 2021):
| (14) |
where the terms on the right hand side correspond to rates of escape from photodissociation of \ceCO2 (44.5 of total escaping C at modern day), photodissociation of \ceCO (20), electron impact of \ceCO2 (12.3), dissociative recombination of \ceCO+ (13.1), and photoionization of \ceCO (8.7), respectively. Escape of carbon via photodissociation of \ceCO2 was previously unconsidered on Mars, but the recent results from the photoechemical model of Lo et al. (2021) suggest that it is actually the dominant escape mechanism. These models calculate the total rate of escaping carbon to be (C atoms s-1), and the five reactions considered here are responsible for 98.6% of the escaping carbon. We obtain the escape fluxes used here by averaging over the extremes of Mars’s orbit and the solar cycle, using the larger \ceC-\ceCO2 collisional cross section (Lo et al., 2021, their Table 2).
To calculate the overall inherent fractionation factor due to photochemical loss of carbon, we take the weighted average of the fractionation factors of the individual reactions. We calculate the fractionation factor of \ceCO2 photodissociation to be 0.68 (see Section 2.7.2). The fractionation factors of \ceCO photodissociation and \ceCO+ dissociative recombination have been previously calculated to be 0.6 and 0.8, respectively (Fox & Hać, 1997; Hu et al., 2015). Because it has not been calculated, we approximate the fractionation factor of electron impact of \ceCO2 by assuming it is equivalent to the fractionation factor of \ceCO+ dissociative recombination (0.8). We assume the fractionation factor of \ceCO photoionization is 1 because photoionization photons are typically much more energetic than the escape threshold. The weighted average fractionation factor for photochemical loss of carbon is thus 0.73.
2.7.2 Fractionation due to Photodissociation of \ceCO2

Because \ceCO2 photodissociation is now predicted to be the dominant loss mechanism of carbon on Mars (Lo et al., 2021), we present the first calculation of the \ceCO2 photodissociation fractionation factor. We utilize the Photochemical Isotope Effect (PIE) method (Hu et al., 2015; Hu & Thomas, 2022) to appropriately distribute energy from the incident photons into the dissociating \ceCO2 molecule. Energy from the incident photons that is above the threshold energy of the dissociation channels is partitioned into kinetic energy of the carbon and oxygen atoms from the dissociated \ceCO2 molecule. To determine the production rate of carbon atoms as a function of nascent kinetic energy, we employ a globally-averaged 1D coupled ion-neutral photochemical model that spans from the surface of Mars to 240 km, at 1 km resolution (Lo et al., 2020, 2021). This model takes as input the solar spectrum, the extremes of the solar cycle and Mars’s orbital distance, reaction rates among atmospheric species, cross sections for photochemical interaction, and branching ratios of dissociation pathways.
The results of this calculation are shown in Figure 2. \ce^12C is preferentially ejected from the atmosphere relative to \ce^13C because it has a lower escape energy and it obtains a higher portion of excess kinetic energy following photodissociation. We obtain the fractionation factor by integrating the shaded regions and dividing the fraction of escaping \ce^13C by the fraction of escaping \ce^12C. Via this method, we calculate the fractionation factor of escaping carbon due to photodissociation of \ceCO2 to be 0.68.
2.7.3 Nitrogen
We scale the photochemical escape rate of nitrogen () by the evolution of the solar EUV flux and the atmospheric abundance of \ceN2:
| (15) |
where is the mixing ratio of \ceN2 in the bulk atmosphere, is a power-law index, is a multiplication factor, and subscript 0 indicates the present-day value. The power-law index and the multiplication factor are included to capture the uncertainties in the total escape rate as well as its dependence on the evolution of the solar EUV flux. The evolution of the EUV flux is modeled as (See Section 2.6). Tu et al. (2015) suggest that this exponent can actually vary in the range -0.96 to -2.15 depending on the initial solar rotation rate. By compounding the assumed fixed value of -1.23 with the exponent, we explore a wide parameter range that covers most of the possible solar EUV evolution scenarios. This approach is justified because previous models that explore the full range of EUV evolution scenarios show that the atmospheric escape of nitrogen is insensitive to this effect (Hu & Thomas, 2022).
We break down the photochemical escape rate into different mechanisms because they each have different fractionation factors:
| (16) |
where , and are the rates of escape from photodissociation and photoionization, dissociative recombination, and other chemical reactions, respectively. The present-day escape rates of dissociative recombination and other chemical reactions are baselined in Fox (1993), and the present-day escape rate of photodissociation is calculated in Hu & Thomas (2022). We assume the scaling in Eq. 15 applies equally to these processes.
The inherent fractionation factors of photodissociation (Hu & Thomas, 2022) and dissociative recombination (Fox & Hać, 1997) are previously calculated ( and . The inherent fractionation factor due to other chemical reactions is assumed to be unity () because the dominant reactions supply much more kinetic energy than is required for escape (Fox & Dalgarno, 1983).
2.8 Ion Escape
Mars is susceptible to atmospheric erosion via ion escape, where charged atmospheric particles in the upper atmosphere are ejected via direct interaction with the solar wind. This process has been investigated directly by Mars Express and the Mars Atmosphere and Volatile Evolution Orbiter (MAVEN) (Barabash et al., 2007; Jakosky et al., 2015b), and the measured escape rates of \ceCO2+, \ceO2+, and \ceO+ generally agree with magneto-hydrodynamic (MHD) model predictions (Ma & Nagy, 2007). We extrapolate the escape rates back in time by fitting the present day measurement-validated MHD escape rates to a power law of the solar age via a parametric model (Manning et al., 2011). The ion loss rate of carbon, , is modeled as:
| (17) |
where is the present-day ion escape rate of \ceCO2+ from the parametric model and the last term accounts for the evolution of the solar EUV flux with the power-law index from the parametric model. The ion loss rate of nitrogen, , is proportional to the ion loss rate of carbon. It is modeled as:
| (18) |
where and are the present-day mixing ratios measured by MAVEN at the altitude of 160 km (Bougher et al., 2015). There is no inherent fractionation due to ion escape because it is much more energetic than the required escape energy for carbon and nitrogen. All fractionation from ion loss is due to mass-dependent separation above the homopause. We do not include an ion loss multiplier because the rate of escaping particles due to ion loss is several orders of magnitude lower than the other atmospheric escape processes. Thus, uncertainty in the ion escape rate can be incorporated into uncertainty in the other atmospheric escape processes.
2.9 Mineral Deposition
2.9.1 Carbonates
Following Hu et al. (2015), we assume 300-1400 mbar \ceCO2 is sequestered globally as carbonates on Mars. Carbonate minerals have been detected by orbital remote sensing of the Martian surface and in situ measurements (Bandfield et al., 2003; Ehlmann et al., 2008; Morris et al., 2010; Niles et al., 2013). Although they are detected, global infrared remote sensing observations indicate that carbonates are scarce on the surface compared to other secondary minerals (Ehlmann & Edwards, 2014). The limits we apply to the global mass of carbonates are consistent with this. The upper limit of 1400 mbar assumes carbonates are 5 wt% in the crust to a depth of 500 m, which is the maximum amount that would not be detectable from remote sensing. The lower limit of 300 mbar assumes carbonates are 1 wt% in the crust to the same depth, which is a more plausible value that is consistent with observation (Niles et al., 2013). There is also evidence for carbonates sequestered into the deep crust, although the exact size and method of deposition is uncertain (Wray et al., 2016). We do not explicitly consider this reservoir, however its potential presence should be taken into account when interpreting our results. We explore this range of values with the parameter C-DEP, the equivalent atmospheric \ceCO2 pressure sequestered in carbonates deposited before 3 Ga.
We model the rate of carbonate deposition as a step function, comprised of an early carbonate formation rate, a late carbonate formation rate, and a time of transition. We employ this method because we do not explicitly calculate surface temperature, and thus cannot accurately calculate the rate of deposition according to aqueous chemical kinetics. Additionally, taking the step function approach minimizes the number of free parameters and allows straightforward comparison to the geologic record. In reality, there would be short-timescale variability in the deposition rate depending on the transient presence of water.
We consider two early environments in which carbonate deposition occurred: open-water systems (OWS) and shallow sub-surface aquifers (SSA). The baseline scenario is deposition in open water systems (e.g. lakes and ponds), where the carbonate formed is 10 enriched in the heavy isotope compared to the atmosphere (Faure, 1991) and the time of transition from high to low formation rate is 3.5 Ga i.e., approximately between the Noachian and Hesperian. The variant scenario is deposition in shallow sub-surface aquifers, where the carbonate formed is up to 60 enriched compared to the atmosphere (Halevy et al., 2011) and the time of transition is 3 Ga i.e., by the end of the Hesperian. Following the transition to low carbonate formation, we assume 7 mbar of \ceCO2 is lost to carbonate formation throughout the rest of Mars’s history (Hu et al., 2015).
2.9.2 Nitrates
Evolved gas experiments with Sample Analysis at Mars (SAM) on the Curiosity rover have measured nitrate in Mars’s soil and rocks (Stern et al., 2015; Sutter et al., 2017). Thus, we include it in the model as a sink for atmospheric \ceN2. Like carbonate deposition, we model the rate of nitrate deposition as a step function, comprised of an early nitrate formation rate, a late nitrate formation rate, and a time of transition. We assume there is no fractionation of the free nitrogen reservoir due to the formation and deposition of nitrates (Hu & Thomas, 2022).
The time of transition in the model step function is fixed at the Hesperian-Amazonian boundary, 3.0 Ga. In the Amazonian period, we estimate the amount of \ceN2 deposited as nitrates by adopting the \ceNO3 concentration in the Rocknest samples (Sutter et al., 2017) and assuming a globally average regolith depth of 10 meters. This corresponds to mbar of \ceN2, which is then spread evenly over the Amazonian. The nitrate concentration in Noachian and Hesperian aged rocks is less constrained. Following Hu & Thomas (2022), we use a default rock concentration of 300 ppm by weight in \ceNO3, and assume an equivalent depth (). The equivalent depth can be as large as 1000 m, but due to the relative insensitivity of the atmospheric evolution to nitrate deposition (Hu & Thomas, 2022) we fix this value at m. The removal rate is then calculated by evenly distributing the nitrate deposited over the Noachian and Hesperian periods (3.0-3.8 Ga) to derive a constant rate.
2.10 Interplanetary Dust Particles (IDPs)
It has been suggested that the accretion of interplanetary dust particles (IDPs) is responsible for a non-negligable amount of noble gas addition to the Martian atmosphere over its history (Flynn, 1997; Kurokawa et al., 2018). The flux of accreting dust particles on Mars has never been directly measured, so we employ the model of Flynn (1997). This model utilizes measurements of IDPs in Earth’s stratosphere to calculate the IDP accretion rate, and it is consistent with IDP measurements made by Pioneer 10 and 11 in interplanetary space (Humes, 1980). The combined rate of accretion for and on Mars is calculated to be g yr-1. The ratio is not well constrained from this experiment, so we assume the solar value of 5.5. We assume there is negligible \ce^40Ar in accreted IDPs. The rate of Ar addition via IDP accretion is assumed to be a constant in our model’s time domain.
2.11 Impactors
Asteroids and comets (i.e., impactors) may have been important for the delivery and removal of volatiles in the Martian atmosphere in its early history (Svetsov, 2007; de Niem et al., 2012; Slipski & Jakosky, 2016; Kurokawa et al., 2018). Because our model starts at 3.8 Ga, it does not include the proposed large impactor flux of the Late Heavy Bombardment (LHB). The uncertainty in the effect of the LHB is then absorbed into the partial pressure of the species at 3.8 Ga in our model.
We assume that the delivery and erosion of volatiles via asteroid impacts is negligible during our model time domain. Erosion of \ceCO2 via impactors is potentially important during and before the LHB, but not after 3.8 Ga (Jakosky, 2019). Recent atmospheric evolution models suggest that the delivery and erosion of \ceN2 is negligible in comparison to other sources and sinks after 3.8 Ga (Kurokawa et al., 2018). Slipski & Jakosky (2016) estimate an upper limit of argon delivery by directly analyzing post-LHB Martian cratering records (Robbins & Hynek, 2012; Tanaka et al., 2014). They find that 1 of the present-day could be delivered via asteroids in the Amazonian, and 2.5 in the Hesperian. When spread over the modeled period, the rate of argon addition is negligible in comparison to other model uncertainties. For these reasons, we ignore asteroids and comets as a source or sink of atmospheric volatiles in our model.
2.12 Present-day Mars and 3.8 Ga Conditions
| Free Parameter | Description | Baseline MCMC | Extended Range MCMC |
|---|---|---|---|
| Volcanic Outgassing Multiplier | 0.5-2 | 0.01-20 | |
| Sputtering Multiplier | 0.5-2 | 0.01-20 | |
| Photochemical Multiplier - Carbon | 0.5-2 | 0.01-20 | |
| Photochemical Multiplier - Nitrogen | 0.5-2 | 0.01-20 | |
| Crutal Erosion Multiplier | 0-1 | 0-1 | |
| z/T | Upper atmosphere structure (km K-1) | 0.2-0.5 | 0.2-0.5 |
| \ceCO2 concentration in source magma (ppm) | 5-1000 | 5-1000 | |
| EUV power law index | 0.5-3 | 0.5-3 | |
| Lyman continuum power law index | 0.5-3 | 0.5-3 |
| Baseline MCMC | Variant MCMC | |
|---|---|---|
| Volcanism Profile | Hartmann (2005) | Ivanov (2001) |
| Atmospheric Collapse | Pressure and Obliquity Dependent | None |
| Carbonate Deposition Scenario | Open Water System | Shallow Subsurface Aquifer |
| Isotopic Composition at 3.8 Ga | , | , |
To compare the model results to present-day Martian conditions, we must determine the size and isotopic composition of the modern free reservoir for carbon, nitrogen, and argon. The atmospheric abundances of carbon, nitrogen, and argon have been directly measured on Mars (Franz et al., 2015): 6 mbar \ceCO2, 0.12 mbar \ceN2, 0.12 mbar \ceAr. We assume the present day polar cap reservoir contains 7 mbar \ceCO2 (Smith et al., 2009; Phillips et al., 2011). The size of the regolith reservoir for carbon, nitrogen, and argon is uncertain because we do not know the depth to which it extends or the grain size, which determines the available surface area for adsorption of a given species. We consider a range of possible scenarios assuming a maximum regolith depth of 100 meters and a grain surface area between 20 and 100 m2 g-1 (Zent et al., 1994; Zent & Quinn, 1995). Summing these reservoirs, we find the present-day total inventories are as follows: mbar, mbar, and mbar. The uncertainty represents the allowed range of model values that would constitute a solution and can be considered .
We assume the present-day isotopic composition of each species is equal to the directly measured isotopic composition of Mars’s atmosphere (Mahaffy et al., 2013; Atreya et al., 2013) and is uniform within the free reservoir (): , , (), and (). The isotopic composition of the three species at 3.8 Ga is required to evaluate the model evolution. In the baseline scenario, we assume and at the beginning of the model’s time domain - the same as the source magma (see Section 2.3). For , we use the value recorded in meteorite ALH 84001 corresponding to an age of 4.16 Ga (Cassata et al., 2010), ().
We use ALH 84001, which has a crystallization age of 4.16 Ga, to derive the conditions at the start of our model time domain (3.8 Ga). It is possible that the atmosphere evolved during the 300 Myr in between. For example, other models for the evolution of Mars’s atmosphere (Kurokawa et al., 2018) and additional analysis of ALH 84001 (Willett et al., 2022) indicate that and may have been elevated higher than the source magma at the start of our modeled period. To account for this, we also consider an endmember scenario in which enrichment in the heavy isotope occurred prior to 3.8 Ga, where we assume and .
2.13 Backward MCMC Search
To explore the parameter space we employ a backward-integrated Markov-Chain Monte Carlo (MCMC) method. On each iteration of the MCMC, we start from the present-day atmospheric partial pressures on Mars and integrate the atmospheric pressure backward in time until 3.8 Ga. This ensures that the predicted atmospheric abundances at 3.8 Ga are consistent with the present-day atmospheric abundances for the given set of parameters. At 3.8 Ga, the isotopic composition of each species is then set according to the source magma or Martian meteorite measurements (see Section 2.12). The partial pressures and isotopic compositions are then integrated forward in time from 3.8 Ga to present, and the modeled present-day isotopic composition is compared to the measured values. The size of the timestep is selected such that the total atmospheric pressure changes by no more than 0.05. The likelihood function (L) is defined as:
| (19) |
where the sum is over the isotopic compositions tracked in the model (, , , ) and is the uncertainty for the present-day isotopic composition of the free reservoir. For each MCMC simulation, two chains are produced starting from parameters chosen independently and randomly within the allowed ranges. These two chains are then tested for convergence using the Gelman-Rubin method (Gelman & Rubin, 1992) and if converged, they are combined. Model runs from these chains that reproduce the modern abundances and isotopic composition of all 3 species to within 3- uncertainty are deemed solutions and used to derive the posterior distributions shown below. The free parameters and their ranges explored in the MCMC search are summarized in Table 1. The extended range MCMC is the same as the baseline MCMC but parameters are allowed to vary in wider ranges to prevent biasing. We also consider several variant scenarios, described above, and summarized in Table 2. Variant scenarios are considered one by one, while all other aspects of the model follow the baseline.
3 Results
We systematically explore the free parameters in our model using the Markov Chain Monte Carlo (MCMC) method. This method allows us to find populations of model solutions that are consistent with the modern Martian atmosphere. With these solutions, we generate posterior probability distributions that constrain model parameters and the composition of the ancient atmosphere. A solution is defined as a model run that reproduces the modern isotopic composition of all 3 species (\ceCO2, \ceN2, and \ceAr) in the free reservoir to within 3 of their modern values. The modern abundances of the species are reproduced in all model evolutions because of the backtracking method we employ (See Section 2.13). We first discuss results from the baseline MCMC, including parameter probability distributions and individual evolutionary scenarios, then we show results from various sensitivity studies.
3.1 The Baseline Model
The parameter ranges explored in our baseline MCMC are shown in Table 1 and the assumptions made are shown in Table 2. Five different values for the amount of carbonate deposition before 3.5 Ga (C-DEP) were tested: 300, 600, 900, 1200, and 1400 mbar. Each MCMC successfully converged and yielded at least 25,000 solutions.
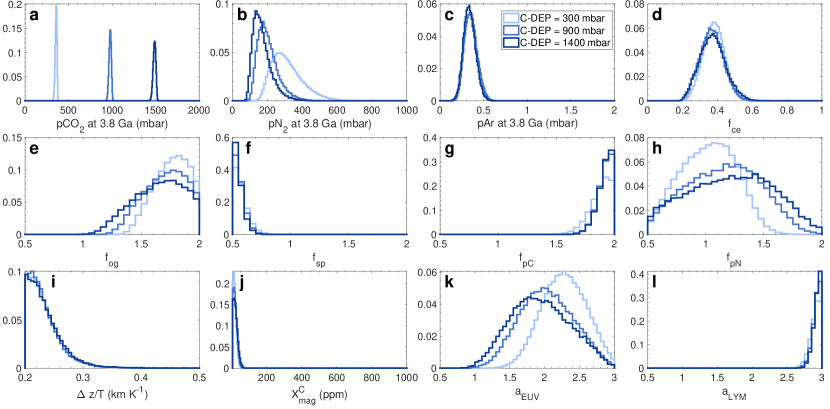
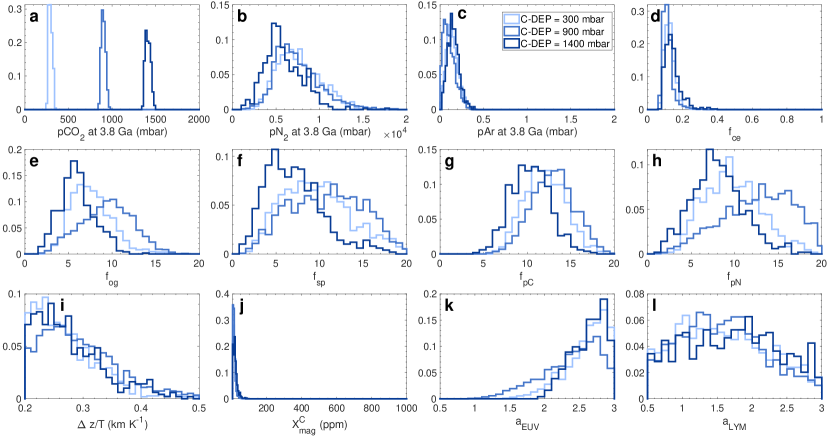
The baseline MCMC solutions constrain the composition and size of the Martian atmosphere at 3.8 Ga. Figures 3a, b, and c show the posterior distributions for \cepCO2(3.8Ga), \cepN2(3.8Ga), and \cepAr(3.8Ga) as a function of C-DEP in the baseline MCMC solutions. The posterior distributions for \cepCO2(3.8Ga) are sharply peaked and show a strong dependence on C-DEP. We place overall constraints on the abundance of a species by taking the lowest and highest bounds from the 95 confidence intervals of the three distributions. For \cepCO2(3.8Ga), it is the lower bound from the C-DEP = 300 mbar distribution and upper bound from the C-DEP = 1400 mbar distribution. Thus, \cepCO2(3.8Ga) is constrained to the range 334-1513 mbar. The posterior distributions for \cepN2(3.8Ga) show a weak anti-correlation with C-DEP, and we find that \cepN2(3.8Ga) is constrained to the range 97-522 mbar. The posterior distributions for \cepAr(3.8Ga) are invariant to C-DEP, and we find that \cepAr(3.8Ga) is constrained to the range 0.21-0.51 mbar.
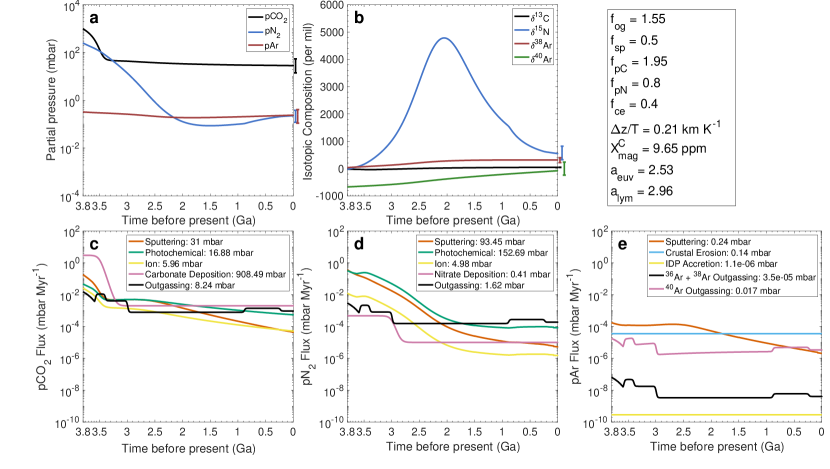
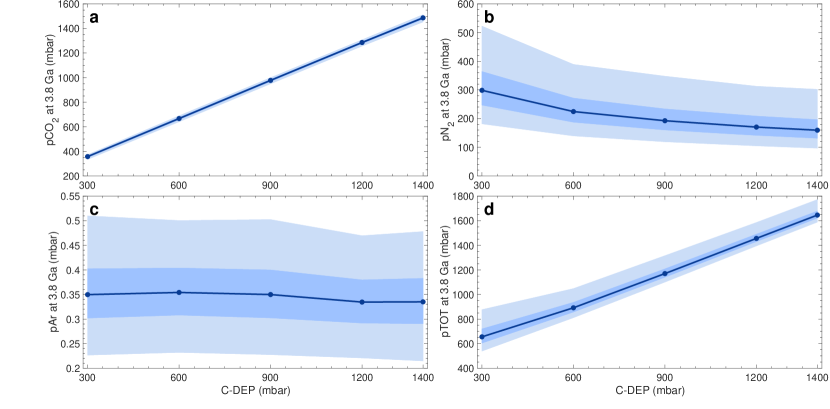
C-DEP strongly determines the atmospheric size and composition at 3.8 Ga. Figure 4a shows the linear relationship between C-DEP and \cepCO2(3.8Ga), with minimal spread in the 95 confidence intervals. As shown in a representative model solution (Figure 5), carbonate deposition is responsible for over 90 percent of \ceCO2 loss, making it more effective than any other source or sink by a factor of . C-DEP is anti-correlated with \cepN2(3.8Ga) (Figure 4b). This is mainly due to atmospheric escape at early times in the evolution, and is discussed below. Finally, C-DEP has little correlation with \cepAr(3.8Ga) (Figure 4c), and it is a minor component of the ancient atmosphere in all scenarios. Ultimately, C-DEP has the strongest effect on the size and composition of Mars’s atmosphere at 3.8 Ga; but regardless of the value for C-DEP, \cepN2(3.8Ga) is consistently higher than 100 mbar, with the specific amount depending on C-DEP and the corresponding \ceCO2 evolution.
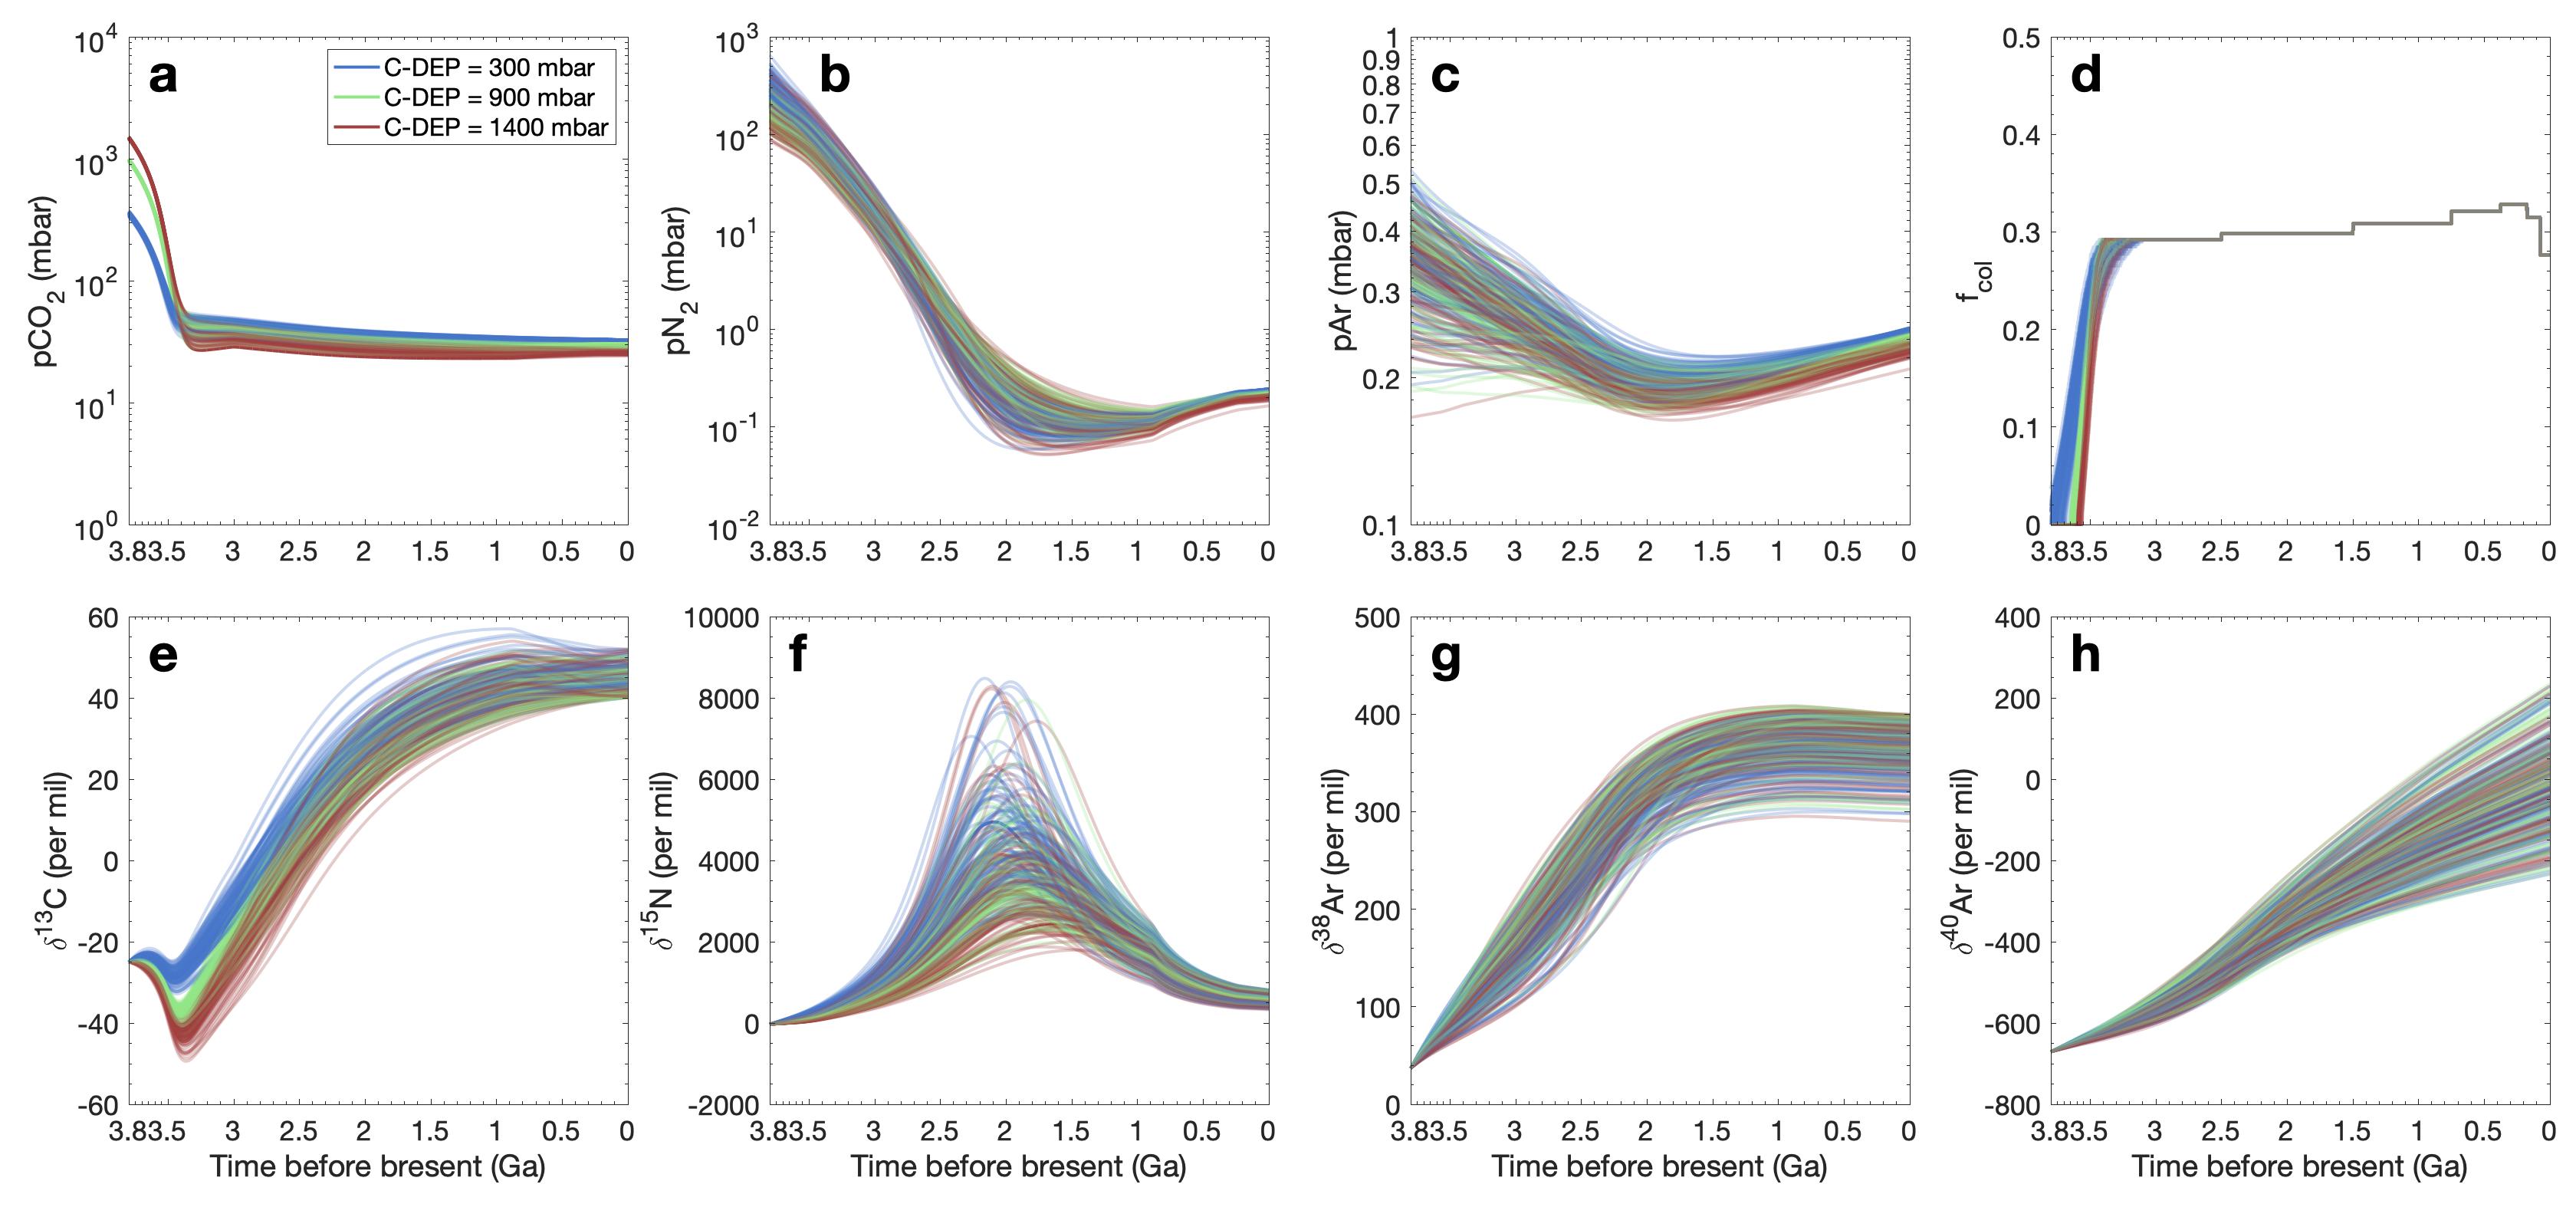
A very low concentration of \ceCO2 in the source magma for volcanic outgassing (X) is preferred in model solutions (Figure 3j). X is allowed to vary in the range 5-1000 ppm, yet it’s posterior distribution is pressed against the lower boundary for all values of C-DEP. This behavior can be explained by examining the C evolution. Atmospheric escape does not strongly fractionate carbon in \ceCO2 over the course of an evolution: photochemical escape is an effective fractionator, but does not occur at a high enough rate, and although sputtering occurs at a higher rate, it is not an effective fractionator. These processes must fractionate \ceCO2 enough to raise C from -25 at 3.8 Ga to 46 at present-day despite the continuous addition of volcanically outgassed \ceCO2 that has C = -25. Thus, in order to recreate the modern C, high fractionation from atmospheric escape and low \ceCO2 volcanic outgassing are required, as shown by the parameter distributions relevant to these processes in Figures 3e, g, j, and l. One might ask why must X be low, and not the total rate of volcanic outgassing instead? The total rate of volcanic outgassing cannot be lowered via the outgassing multiplier () because a non-negligible amount of recently outgassed \ceN2 is required to recreate the modern N value. Lowering the total outgassing rate would prevent this constraint from being satisfied, which forces X to be low instead.
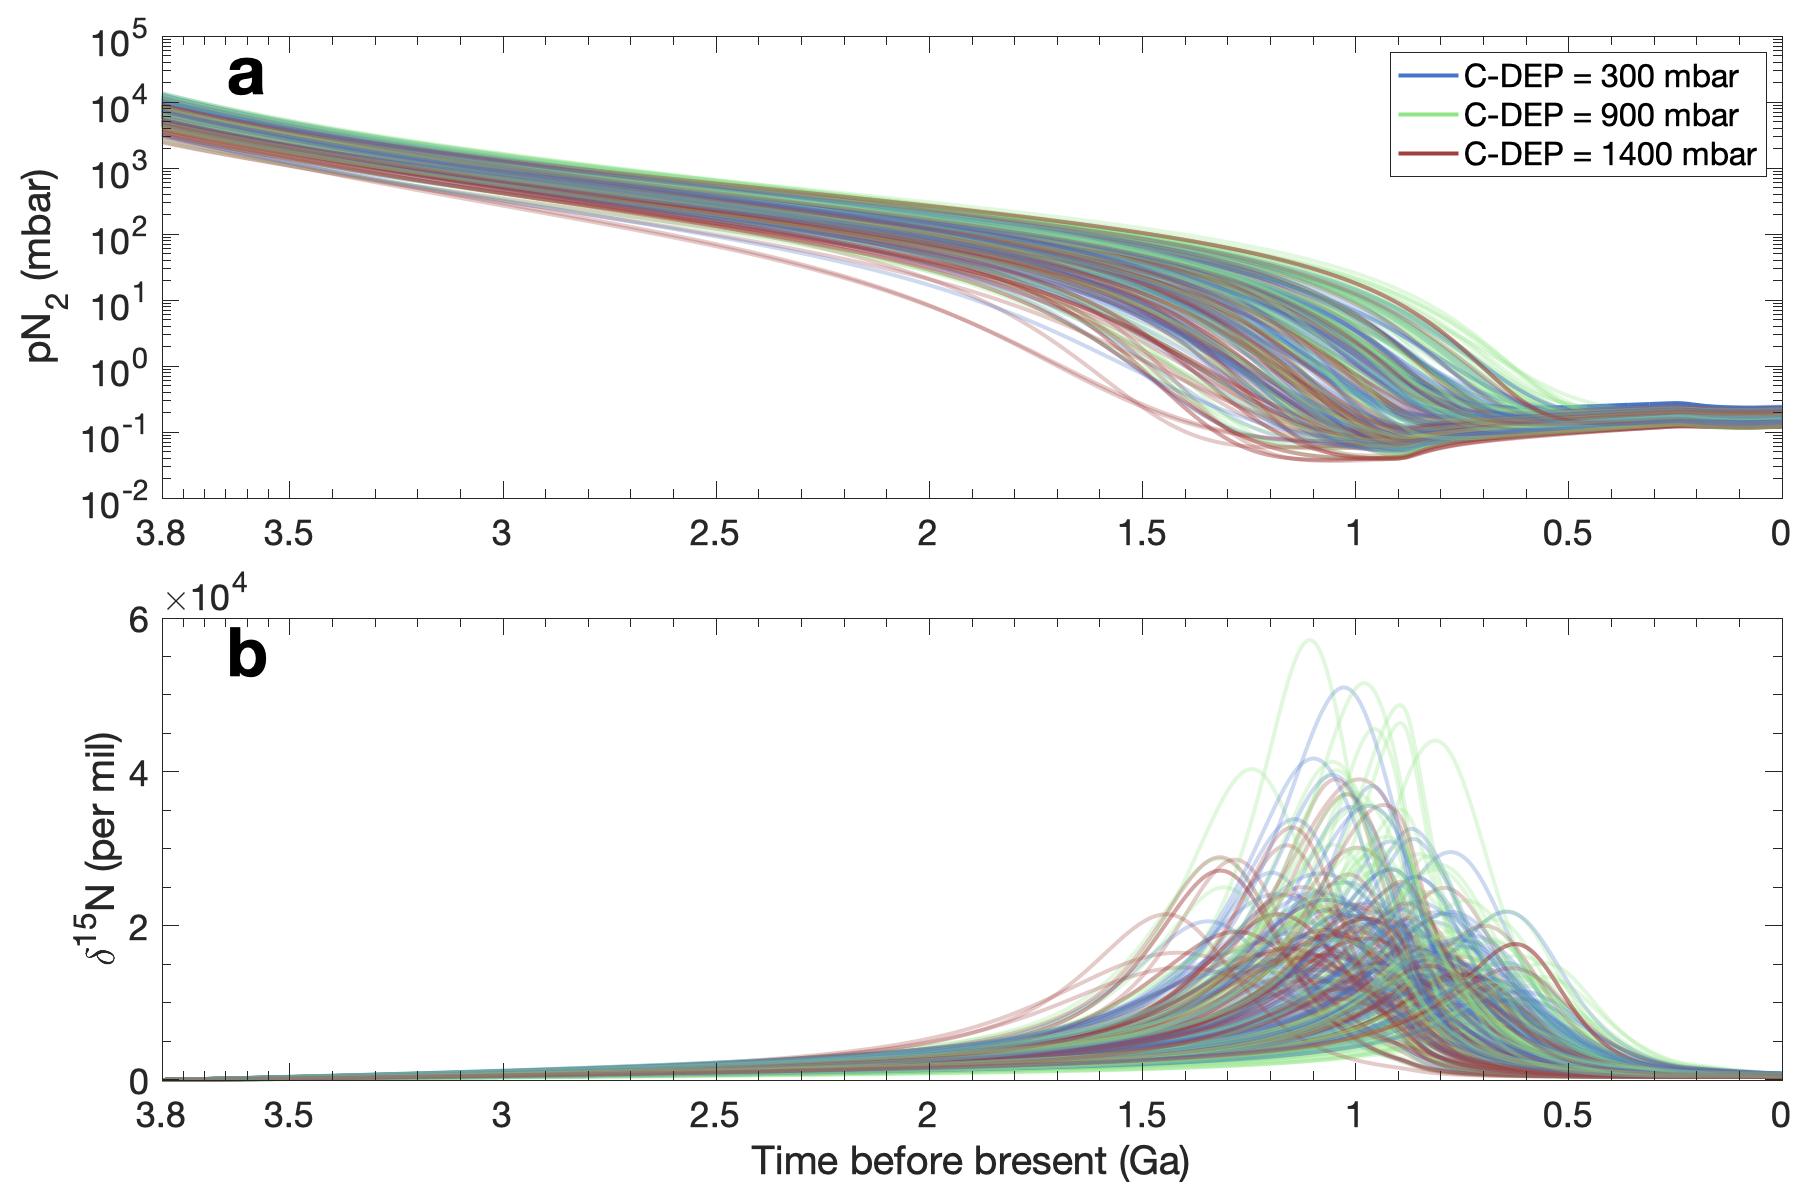
N2 follows a dynamical track evolution in all solutions found in the baseline MCMC. The dynamical track evolution, first identified in a model containing only \ceN2 (Hu & Thomas, 2022), is an evolutionary track for \cepN2 characterized by high abundance at 3.8 Ga and a gradual descent to the modern partial pressure. Figure 6 shows a random sample of \ceN2 evolutionary tracks from the baseline MCMC solutions in which \ceN2 descends to the modern pressure around 2 Ga. This late descent is characteristic of the dynamical track solutions, and the population shown here is directly comparable to the dynamical track solutions in Hu & Thomas (2022), their Figure 3a. The dynamical track solution is fundamentally due to the decoupling of the \ceN2 sputtering rate from the \ceN2 mixing ratio when the atmospheric abundances of \ceN2 and \ceCO2 are comparable (Hu & Thomas, 2022). This behavior is observed in Figure 5d when the \ceN2 sputtering rate is unchanged by the rapid \ceCO2 decline before 3.5 Ga, as opposed to photochemical and ion escape. Moreover, the dynamical track solutions are favored when parameters are kept closest to their nominal values because escape rates are not high enough to quickly drive \cepN2 down to its modern value. Dynamical track solutions are key for constraining the ancient atmospheric composition because they require a unique value of \cepN2(3.8Ga).
pN2(3.8Ga) is weakly anti-correlated with \cepCO2(3.8Ga) because a high partial pressure of \ceCO2 reduces the atmospheric escape rate of \ceN2. The mixing ratio of \ceN2 in the atmosphere is lower when there is a larger amount of \ceCO2. The atmospheric escape rate of \ceN2 depends directly on its mixing ratio. So, a larger value of \cepCO2 causes a lower \ceN2 mixing ratio and thus a lower atmospheric escape rate of \ceN2. Because atmospheric escape is the dominant sink for \ceN2, a lower escape rate means there must be less \cepN2 at 3.8 Ga. This effect is especially important at early times when atmospheric \ceCO2 has not been significantly lost to carbonate deposition, atmospheric collapse hasn’t occurred yet, and the early sun was emitting more EUV radiation which drives \ceN2 escape.
The evolution of \ceN2 is characterized by the relationship between early atmospheric escape and recent volcanic outgassing. Early atmospheric escape from sputtering and photochemical loss strongly fractionates \ceN2 and raises N as \cepN2 is driven to its low, near-modern value. With low \cepN2, atmospheric escape processes become less efficient and the \ceN2 introduced from Mars’s interior at recent times has a stronger influence on the N, which lowers it to the modern value. This behavior is also what drives the posterior distribution of to its lower boundary (Figure 3i). A higher would enhance the fractionation from all atmospheric escape processes. A higher recent outgassing rate would then be required in order to offset the enhanced fractionation. However, a larger volcanic outgassing rate cannot be employed because it would introduce too much \ceN2 into the atmosphere and raise \cepN2 above the modern value. Thus, a low value is preferred in the posterior distributions.
The evolution of argon constrains the overall sputtering rate and strengthens the constraints placed by other species. Sputtering is the only sink for all argon isotopes, and the only process that can significantly increase Ar. Thus, differences in the sputtering rate have the strongest effect on the argon evolution. The posterior distribution preference for a low sputtering rate (Figure 3f) is a consequence of this. A higher sputtering rate would require a larger value of \cepAr(3.8Ga), and the sputtering required to reach the modern \cepAr value would cause over-fractionation of Ar. This cannot be compensated by increased Ar outgassing with a larger because it would force X to be lower than the allowed range (see above). Because sputtering is a process that effects all three species, argon is thus constraining the entire evolution.
3.2 Sensitivity Tests
In this section we discuss the results from testing assumptions made in the baseline model. This includes extending the explored parameter ranges, changing the volcanic outgassing chronology, changing the carbonate deposition scenario, removing the treatment of atmospheric collapse, and exploring a scenario where the delta values at 3.8 Ga are higher due to potential fractionation before the modeled period.
3.2.1 Extended Parameter Ranges
Here we discuss results from the extended range MCMC (Table 1), where model free parameters are allowed to vary in a larger range of values than the baseline MCMC. We explore this scenario because, although the boundaries we impose in the baseline MCMC are physically reasonable, they may influence the results of the MCMC. The ranges for and are extended from 0.5-2 to 0.01-20. The other parameter ranges are unchanged.
The solutions in the extended range MCMC are similar to the solutions in the baseline MCMC, but they allow massive \cepN2 atmospheres at 3.8 Ga. The posterior distribution in the extended range (Figure 7b) shows that \cepN2(3.8Ga) peaks around 5 bar but can be as high as 20 bar. The posterior distributions in the extended range also show that all 4 multipliers are taking on values much higher than those in the baseline MCMC (Figure 7e, f, g, and h). The increased atmospheric escape requires a large \ceN2 atmosphere at 3.8 Ga in order to recreate the modern \cepN2 value it requires a large rate of volcanic outgassing rate to ensure that recreate the modern N value. As shown in Figure 8, these solutions follow a very similar trajectory to the baseline solutions, and \cepN2 descends to its modern value late in the evolution. Other important aspects of the extended range solutions are the same as the baseline solutions: \cepCO2(3.8Ga) is still tightly constrained by C-DEP, \cepAr(3.8Ga) is still invariant to C-DEP albeit slightly lower, and the posterior distribution for X is still at the lower end of its boundary.
3.2.2 Volcanism Profile
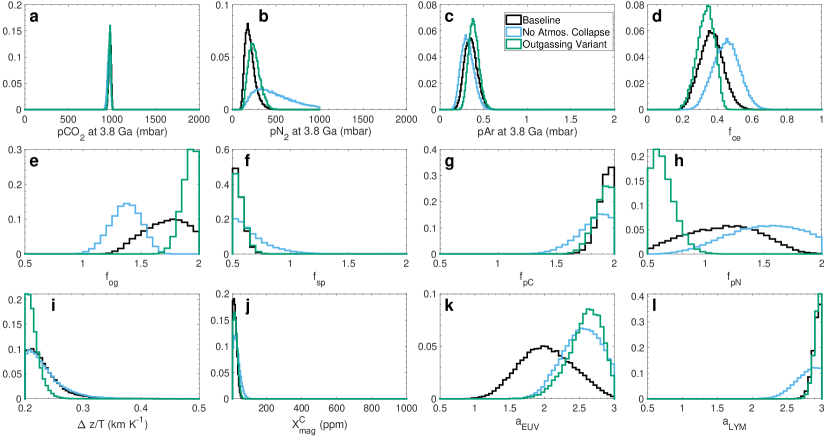
To test the model sensitivity to the rate of volcanic outassing over time, we run the baseline MCMC with the variant volcanism profile derived from the crater chronology of Ivanov (2001) instead of Hartmann (2005). The two chronologies are similar at the start of the model time domain, but the primary difference is that the variant chronology has less volcanic outgassing in the most recent billion years. This difference primarily affects \ceN2 because the baseline solutions rely on recent volcanic outgassing to lower N from its escape-induced peak to the modern value. To compensate for this, the MCMC posterior distributions show enhanced total volcanic outgassing and reduced photochemical escape of nitrogen (Figure 9). This parameter change effectively mitigates the difference in volcanic rate profiles, as the posteriors for atmospheric composition at 3.8 Ga and other parameters are very similar. Finally, it is interesting to note that the posterior distribution for the concentration of \ceCO2 in source magma (X) is unchanged, indicating that this result is robust to changes in the net outgassing rate over time.
3.2.3 Atmospheric Collapse
Atmospheric collapse causes enhanced escape rates of \ceN2 and \ceAr. When the atmosphere collapses in the baseline scenario, the atmospheric \cepCO2 used to calculate mixing ratios drops from potentially hundreds of mbars to 6 mbar. This drastically enhances the mixing ratios of \ceN2 and \ceAr, which in turn enhances their atmospheric escape rates. In the baseline MCMC solutions with C-DEP = 900 mbar, the average model run had a collapsed atmosphere 28 of the time. A sample of the collapse probability over time is shown in Figure 6d. In all cases, the probability becomes non-zero after a few hundred Myrs as \cepCO2 declines due to carbonate deposition. After \cepCO2 becomes sufficiently low, all samples tend to follow the same path because the obliquity of Mars – not the size of the atmosphere – is the limiting factor for collapse.
Posterior distributions in the MCMC are adjusted to compensate for the effects of ignoring atmospheric collapse (Figure 9). The MCMC posterior distributions show that parameters related to photochemical escape of \ceN2 are preferred to be higher than in the baseline scenario. With these parameter values, the \ceN2 escape rate is raised closer to what it would be if atmospheric collapse was included. Solutions with higher \cepN2 at 3.8 Ga then become available because the \ceN2 photochemical escape rate is also higher at early times, when \cepCO2 is high enough so that the atmosphere would not be collapsed in the baseline scenario anyway. So, although ignoring atmospheric collapse means a lower \ceN2 escape rate, compensating for this effect creates solutions with even higher \cepN2(3.8Ga). Additionally, the posterior distribution for the outgassing multiplier peaks at a lower value than the baseline and it is independent of the parameter boundaries. The evolution of \ceAr is responsible for this. Atmospheric escape of \ceAr is reduced for the same reasons as \ceN2; however, \ceAr is only removed via sputtering, which must remain low to avoid over-fractionation (see Section 3.1). Ignoring atmospheric collapse then results in a less effective total sink for \ceAr that cannot be compensated by increasing sputtering. Thus, volcanic outgassing is instead reduced to ensure that the modern pressure is recreated.
3.2.4 Carbonate Deposition Scenario
No model solutions are found with 100 or more mbar of carbonate deposition in the shallow subsurface aquifer (SSA) scenario. We tested model scenarios with 50, 100, 150, 200, and 250 mbar of SSA carbonate deposition in addition to the standard model runs with 300, 900, and 1400 mbar carbonate deposition. Model solutions are only found in the scenario with 50 mbar of SSA carbonate deposition - a representative case is shown in Figure 10. The atmosphere at 3.8 Ga in this representative case has 125 mbar \ceCO2 and \ce142 mbar \ceN2. The low amount of carbonate deposition causes less \ceCO2 at the start of the model because it is the main \ceCO2 sink.
Enhanced \ceCO2 fractionation in the SSA scenario causes low carbonate deposition and low \cepCO2(3.8Ga). In a typical model run in this scenario, solutions are difficult to find because the modeled C almost always ends up lower than the modern value. This is due to the fact that deposition in the SSA scenario fractionates carbon more strongly than deposition in open water systems (OWS), which is the baseline. The fractionation factor for deposition in SSA is 1.06, whereas in OWS it is 1.01. With more than 100 mbar of deposition, the atmosphere becomes significantly more enriched in the light isotope in the SSA scenario as opposed to the OWS scenario. In the baseline OWS model, atmospheric escape of carbon is able to offset this process and fractionate the atmosphere in the other direction enough to bring it to the modern value. Our MCMC search finds no scenarios where atmospheric escape can offset the enhanced fractionation from 100 mbar of carbonate deposition in SSA. Thus, there must have been less than 100 mbar of carbonate deposition if it was entirely in SSA. Because carbonate deposition is the dominant atmospheric \ceCO2 sink, this endmember scenario would require a small ancient atmosphere. In reality, carbonate deposition may have occurred in a combination of both scenarios. In general, the more SSA deposition occurred, the smaller the ancient atmosphere should be.
3.2.5 Isotopic Composition at 3.8 Ga
No model solutions were found in the scenario with elevated N and Ar values at 3.8 Ga. This scenario is presumed to be possible if there was enhanced atmospheric escape and fractionation of Ar and N before our model time domain. The modern N can still be recreated in this model scenario, as recent outgassing is always able to restore N enough to reach the modern value. No model solutions were found because the modern Ar cannot be reproduced in this scenario, as the model produces a value that is too high. Even though Ar in outgassed material is 36, the argon concentration is too low in the outgassed material to restore Ar to the modern value. The modern Ar still cannot be recreated when the MCMC explored an increased volcanic outgassing multiplier and a decreased sputtering multiplier, both of which should help lower Ar. Thus, if Ar was enhanced at 3.8 Ga, our models suggest that there must have been some other process affecting the subsequent Ar evolution, such as a cometary impact (Kurokawa et al., 2018).
4 Discussion
We have presented the first coupled, self-consistent simulations for the evolution of \ceCO2, \ceN2, and \ceAr that reproduce the modern abundances and isotopic composition of the Martian atmosphere. Our results provide insights into the ancient atmospheric composition and its subsequent evolution to the modern day state. Many of the critical constraints we’ve found arise from modeling multiple atmospheric species at once and would not be found in a model that includes just one species. This work is a comprehensive analysis of Mars’s atmospheric evolution and we advocate for more multi-species isotope analysis in future studies. Below we discuss the emerging picture of the ancient atmosphere, comparison with other studies, and model validity.
4.1 A \ceCO2-\ceN2-\ceH2 Atmosphere on Ancient Mars
Our evolutionary models indicate that a \ceCO2-\ceN2-\ceH2 ancient atmosphere is likely to exist on ancient Mars. This multi-component atmosphere provides a promising path to explain the geologic evidence for liquid-water activities in the past.
First, our models indicate that a large amount of \ceN2 is consistent with a large amount of \ceCO2 in the ancient atmosphere. This is fundamentally due to the dominance of the dynamical track \ceN2 solutions, first discovered in a similar model that focused on the evolution of \ceN2 (Hu & Thomas, 2022). We find that these dynamical track solutions are the only \ceN2 solution in the fully coupled model, and the steady state solutions have disappeared. The dynamical track solutions are characterized by a large \cepN2(3.8Ga) that gradually descends to the modern day value, as opposed to the steady state solutions which feature rapid decline of \ceN2 early in the evolution. Importantly, each dynamical track solution has a unique value for \cepN2(3.8Ga), so we are able to reconstruct the ancient atmosphere. We find that Mars’s atmosphere contained 0.1-0.5 bar \ceN2 with 0.3-1.5 bar \ceCO2 at 3.8 Ga for the explored range of carbonate deposition in our model. As suggested in Hu & Thomas (2022), an atmosphere with these relative abundances of C and N could have been formed by a late veneer of primitive bodies such as comets that have low C/N ratios (Bergin et al., 2015). In any case, our models uniformly suggest that \ceN2 is a non-negligible part of the ancient atmosphere and should thus be considered for climatic effects and atmospheric chemistry.
Second, we find that recreating the modern \cepCO2 and C requires a carbon content in the source magma that indicates a reduced Martian mantle. Across all of the solutions found in every MCMC and variant, the concentration of \ceCO2 in the source magma for volcanic outgassing () was preferred to be at the very bottom of the allowed parameter range. The lower bound on of 5 ppm corresponds to a source magma oxygen fugacity one log unit below the iron-wüstite buffer, IW-1 (Hirschmann & Withers, 2008). The highest value of that yields solutions is around 50 ppm, which corresponds to a source magma oxygen fugacity of IW. If we assume that directly reflects the magma oxygen fugacity, then our models require a reduced martian mantle of IW or lower. While modern Mars’s interior is thought to be at an oxygen fugacity of IW+1 (Grott et al., 2011), analysis of the oldest Martian meteorite, ALH84001, indicates that early Mars’s interior could have had an oxygen fugacity as low as IW-1 (Warren & Kallemeyn, 1996). Note that this insight arises from the joint analysis of the evolution of \ceCO2 and \ceN2, highlighting the importance of including multiple species in the model.
We can estimate the \ceH2 volcanic outgassing flux implied by the low mantle oxygen fugacity. We consider the magma to degas at typical outgassing temperature and pressure (1450 K, 5 bar) (Holland, 1984). The \ceH2:\ceH2O outgassing ratio controlled by the reaction \ce2 H2O ¡-¿[K1] 2 H2 + O2 is:
| (20) |
where is the outgassed \ceH2, is the outgassed \ceH2O, is the equilibrium constant of the reaction ( atm) (Ramirez et al., 2014), and is the oxygen fugacity of the source magma. At the typical outgassing temperature, an oxygen fugacity at IW corresponds to atm and \ceH2:\ceH2O = 1.69. For oxygen fugacity at IW-1, atm and \ceH2:\ceH2O = 5.33. There is no direct meteoric evidence constraining the Mars mantle water content during our highest modeled outgassing rates, 3.6-3.8 Ga. Brasser (2013) estimates the upper bound of the early Mars mantle water content is 2000 ppm by mass based on planet formation models. Other Mars interior modeling studies typically assume 100 ppm by mass as a baseline case (Morschhauser et al., 2011; Liu et al., 2018), and explore up to 1000 ppm by mass (Scheller et al., 2021). Thus, we explore an \ceH2O concentration in the source magma of ppm by mass. This encompasses the range of water content in Earth magma, which is typically 500-1000 ppm by mass (Morbidelli et al., 2000). For simplicity, we assume complete degassing of the \ceH2O in magma, as either \ceH2O or \ceH2, with the molar ratios calculated above. Because the \ceH2O content in the magma will decline as it is degassed, our estimates can be considered an upper limit given our assumptions.
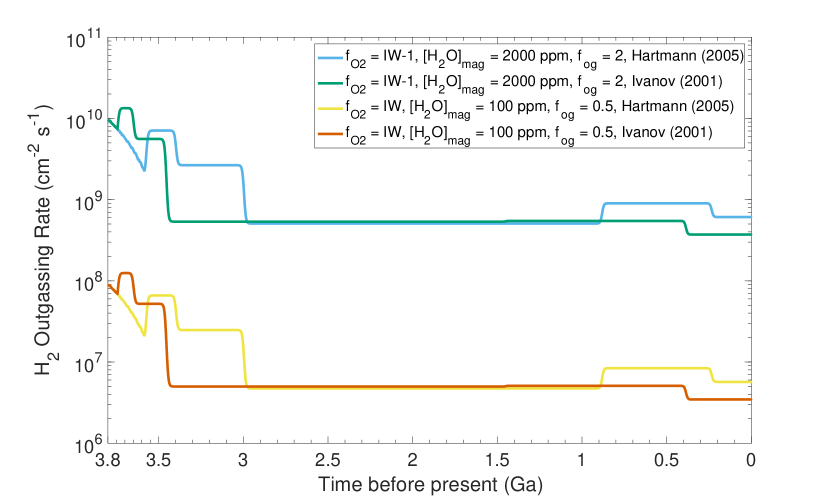
Our estimate indicates that the rate of \ceH2 outgassing is likely too low to support a substantial \ceH2 atmosphere on its own, despite the low oxygen fugacity. We find the \ceH2 concentration in the magma is 7-94 ppm by mass. We combine the calculated \ceH2 concentrations with our model crustal production rate to derive the \ceH2 outgassing rate (Figure 11). We consider the range for the volcanic outgassing multiplier employed in our baseline MCMC search (0.5-2) and test both the baseline profile and the variant. The maximum rate of \ceH2 volcanic outgassing implied by our modeling results is 1.34 cm-2 s-1, occurring with oxygen fugacity of IW-1, 2000 ppm \ceH2O in the magma, volcanic outgassing multiplier of 2, and the variant (Ivanov, 2001) volcanic profile. Note that this is well below previous estimates of early Mars’s \ceH2 outgassing rates (Ramirez et al., 2014; Batalha et al., 2015), which were derived by scaling the modern Earth’s outgassing rate. At least 3-5% \ceH2 is needed to generate substantial warming on ancient Mars for the maximum amount of atmospheric \ceCO2 we predict (Ramirez, 2017; Wordsworth et al., 2017; Turbet et al., 2020). The \ceH2 outgassing flux we estimate is over an order of magnitude too low to support a 5% \ceH2 atmosphere against atmospheric escape (Batalha et al., 2015). Thus, if \ceH2 was a substantial part of the ancient atmosphere, it must have come from sources other than volcanic outgassing. Crustal hydration and sequestration of water (Scheller et al., 2021) may provide the required \ceH2 flux (Adams et al., in prep.).
The atmospheric \ceN2 abundances we predict can provide surface warming on the order of 10 K on ancient Mars. von Paris et al. (2013) show that \ceN2-\ceN2 collisional induced absorption (CIA) and pressure broadening of \ceCO2 absorption lines can cause substantial warming. In our model scenario with C-DEP = 900 mbar, the atmosphere contains 1 bar \ceCO2 and 200-400 mbar \ceN2. According to von Paris et al. (2013), this atmosphere would provide 5-10 K surface warming from \ceN2-\ceN2 CIA and pressure broadening, with respect to an atmosphere with the same amount of \ceCO2 but without \ceN2. Additionally, \ceN2-\ceH2 CIA may contribute minor warming up to 1-2 K for the \ceN2 levels we predict (Wordsworth & Pierrehumbert, 2013; Ramirez et al., 2014).
Putting the arguments above together, we suggest that a \ceCO2-\ceN2-\ceH2 ancient atmosphere would be consistent with Mars’s geochemical evolution, and it provides a promising path forward for explaining the evidence of ancient surface liquid-water. Previous studies have explored a \ceCO2-\ceH2 greenhouse on early Mars to produce the necessary warming to explain the geologic evidence (e.g., Ramirez et al., 2014, 2020; Wordsworth et al., 2021). In order to produce even transient warming and melting in these studies, large \ceCO2 atmospheres and large \ceH2 sources to the atmosphere are required. Although these atmospheres may explain the evidence for water, a lower (probably less than 1 bar) \ceCO2 is more likely for the lack of widespread carbonates on Mars’s surface (Hu et al., 2015; Edwards & Ehlmann, 2015). Similarly, we place an upper limit on \ceCO2 of about 1.5 bar at 3.8 Ga. In the existing \ceCO2-\ceH2 atmosphere climate models, a 1.5 bar or smaller \ceCO2 atmosphere produces barely enough warming to produce melting consistent with the geologic evidence, and requires high variability of reduced gas source fluxes (Wordsworth et al., 2021) or over 10% \ceH2 (Ramirez et al., 2014). However, the large \ceN2 abundance indicated by our model results may compensate for the lower \ceCO2 abundance and generate additional warming. A substantial \ceH2 abundance combined with the \ceCO2-\ceN2 atmosphere would help explain the evidence for sustained surface conditions for liquid-water (e.g., Carr & Head, 2003; Di Achille & Hynek, 2010; Grotzinger et al., 2014). A detailed study of the climate and \ceH2 sources in this scenario is warranted and forthcoming (Adams et al., in prep.).
4.2 Comparison to Other Modeling Studies and Experimental Data
The presence of a thick \ceCO2 atmosphere on ancient Mars implies carbonate deposition occurred primarily in open-water systems. Our models indicate that deposition in open water systems (OWS) is consistent with the explored range of 300-1400 mbar \ceCO2 deposited in carbonates; however, deposition entirely in shallow subsurface aquifers (SSA) can only occur if less than 100 mbar \ceCO2 is deposited. This is due to the difference in \ceCO2 fractionation in these two mechanisms. So, if there was a thick \ceCO2 atmosphere on ancient Mars, carbonate deposition must have occurred predominantly in OWS in order to explain the modern C value. This finding is consistent with a previous isotopic evolution model that focused solely on carbon (Hu et al., 2015). A potentially large deep crustal reservoir may contain the volume of carbonates required to explain a \ceCO2-rich atmosphere (Michalski & Niles, 2010); however, directly observed near-surface carbonate deposits are scarce on Mars, where the largest exposure is found in Nili Fossae and contains up to 12 mbar \ceCO2 (Edwards & Ehlmann, 2015). If this indeed indicates a low global carbonate mass on Mars, then it implies that there was a thin \ceCO2 atmosphere with carbonate deposition occurring in both SSA and OWS. This implication is reversible: evidence for SSA deposition would imply a low global carbonate mass and a \ceCO2-poor ancient atmosphere. Our results are consistent with other paleo-pressure estimates (Kite et al., 2014; Kurokawa et al., 2018), but none of these provide sufficient constraints to narrow the uncertainty described above. Thus, measuring C in Martian carbonate samples (e.g., via Mars Sample Return) could help constrain the volume of surface water present on ancient Mars, the ancient \cepCO2, and the subsequent atmospheric evolution.
Furthermore, early carbonate deposition (which we parameterize) depends on the ancient atmospheric size and composition (which we predict). In the SSA scenario, we predict low atmospheric \ceCO2 (up to 100 mbar) at the time of peak deposition, which is consistent with the assumption that there was no surface liquid water for carbonate deposition to occur in. On the other hand, carbonate deposition in the OWS scenario requires that there was a significant amount of surface liquid water until 3.5 Ga. The greenhouse effect supplied by the atmosphere must thus be large enough to support that water. In our model runs, the OWS scenarios permit high atmospheric \ceCO2 when large amounts of carbonates are deposited; when combined with an additional greenhouse gas like \ceH2, this atmosphere can plausibly generate the warm temperatures required to support liquid water and be consistent with our parameterization. However, the OWS scenarios with low amounts of carbonate deposition (e.g., 300 mbar) require low atmospheric \ceCO2; it is likely that these atmospheres could not support liquid water without implausibly high abundances of a greenhouse gas like \ceH2. Thus, scenarios for Mars’s evolution where there was abundant liquid water but little open water carbonate deposition may be inconsistent. This indicates that our model predictions with more carbonate deposition in open water, and thus higher atmospheric \ceCO2, are more plausible than those with less carbonate deposition in open water.
The evolutionary pathways of C that we predict provide context to interpret recently measured C values in Martian soil (House et al., 2022). Sample Analysis at Mars (SAM) aboard the Curiosity rover has measured the C value in methane for 24 soil samples at Gale Crater. They found a wide range of values, from to . In our model solutions, atmospheric C in \ceCO2 varies from at the present-day to as low as in the Hesperian (Figure 6e). House et al. (2022) propose several mechanisms that could explain the very low C measurements that depend on the background value in atmospheric \ceCO2 including methanogenesis, abiotic reduction of \ceCO2, and photochemical reactions. Our results indicate that the process or processes responsible for the very low measured C values must have a significant inherent fractionation effect with respect to the background atmospheric \ceCO2; even the lowest C value in our models is still higher than the lowest measured C.
Our results are broadly consistent with Slipski & Jakosky (2016), who modeled the argon isotope system. Our model of the argon isotopes followed the general framework of Slipski & Jakosky (2016), but with several notable differences: our baseline \ceCO2 sputtering rates are similar in range but different in slope, the crustal production profiles are different, and the atmospheric component of our model only extends to 3.8 Ga whereas theirs extends to 4.4 Ga. Despite these model differences, we find general agreement between the two models. In our baseline MCMC solutions, = 0.4 on average, which is within the 0.31-0.67 range calculated in Slipski & Jakosky (2016) (Figure 3). On the other hand, we do not recover the same constraints on the outgassing multiplier in our baseline MCMC: our posterior distributions are pressed against the upper bound of 2, while theirs are constrained to 0.5-1.1. However, in the variant MCMC where atmospheric collapse is ignored, we find the outgassing multiplier is constrained to the range 1-1.7 which is in better agreement because this scenario is more consistent with the \ceCO2 evolution enforced by Slipski & Jakosky (2016). The consistency between our models strengthens our conclusions, but the differences highlight the importance of better constraining rates of atmospheric escape and volcanic outgassing.
Our modeling results are consistent with isotopic evolution models that include other noble gases. The nitrogen and noble gas isotopic models presented in Kurokawa et al. (2018) indicate that the atmosphere was greater than 0.5 bar at 4 Ga. This is consistent with our results, as the vast majority of our solutions have an atmosphere greater than 0.5 bar at 3.8 Ga, which would have been subject to loss since 4 Ga (Figure 4d). The neon isotopic models presented in Kurokawa et al. (2021) show evidence for significant recent volcanism on Mars. This strengthens the results we have found, as recent volcanism is important for recreating the modern N, which drives the behavior of all three species we included. The direct inclusion of Ne, Kr, and Xe isotopes in our model would make the constraints derived here more comprehensive. These species were not included here to ensure that the scope of this work is narrow enough to provide a rigorous analysis.
Additional measurements of Mars’s past isotopic composition can greatly improve modeling studies like the one presented here. As is shown in a sample of model solutions (Figure 6), the delta values have a wide envelope of possible trajectories that depend on the initial atmospheric composition and model parameter values. Narrowing these envelopes with data will provide even stronger constraints on Mars’s atmospheric evolution. Moreover, we are forced to assume delta values for each species at 3.8 Ga based on meteorite analysis and our knowledge of Mars’s interior. Future missions such as Mars Sample Return may allow the analysis of samples in contact with Mars’s atmosphere from billions of years ago. Isotopic analysis of these samples would be valuable for strengthening the constraints derived from isotopic modeling studies like this.
4.3 Model Validity
The parameterizations included in our model are consistent with the current best knowledge of planetary processes, but our results imply ancient atmospheric conditions that demand new model studies. A large amount of ancient atmospheric \ceN2 is indicated by our results; \cepN2 is comparable to \cepCO2 in baseline solutions and may be larger than \cepCO2 in extended range solutions. This introduces uncertainty because our atmospheric escape rates and collapse treatment are derived from a \ceCO2-dominated atmosphere. The photochemical escape rate of \ceN2 may be different in the extended range solutions when the mixing ratio of \ceN2 is near 1. A detailed photochemical modeling study would be needed to evaluate this, but this uncertainty is mitigated because sputtering is always found to be the dominant loss mechanism in these solutions.
Moreover, our parameterization of atmospheric collapse is subject to uncertainty. First, we base the threshold for collapse on the climate models of Forget et al. (2013), but other models yield slightly different threshold values (e.g., Soto et al., 2015). Additionally, the Forget et al. (2013) climate model does not include \ceN2 as a major component of the atmosphere, which may change the threshold values. Increased study of the thermodynamics of this potential atmosphere is warranted. Second, recent work suggests that Mars’s past obliquity may not have been as chaotic as we have assumed (Lissauer et al., 2012). Third, it is possible that the atmosphere would not have recovered once it entered a collapsed state due to hysteresis (Kurahashi-Nakamura & Tajika, 2006). We do not include this possibility here, but a similar simulation in which the atmosphere is always collapsed can be found in Hu & Thomas (2022). Taken together, these considerations indicate that atmospheric collapse throughout Mars history is a wide ranging and uncertain process. Our treatment of atmospheric collapse does not explore the full range of uncertainty, but acts as a representative example for understanding its impact on atmospheric evolution. We include the variant scenario with no atmospheric collapse as an endmember case to highlight this. Future studies will be strengthened by a more comprehensive analysis of atmospheric collapse throughout Mars’s history.
We assume a constant concentration of \ceCO2 in the source magma for volcanic outgassing; however, the \ceCO2 concentration may have varied with time, as indicated by the range of oxygen fugacities preserved in Martian meteorites and indicated by interior modeling studies (e.g., Warren & Kallemeyn, 1996; Grott et al., 2011). This is mitigated by the fact that recent volcanic emplacement is orders of magnitude slower than at ancient times, so a changing \ceCO2 concentration after 3-3.5 Ga is less impactful. Similar studies in the future will be strengthened by coupling mantle redox chemistry explicitly to atmospheric evolution.
Our assumption that the \ceN2 concentration in Martian source magma is equal to the “Silicate Earth” concentration (Marty & Dauphas, 2003) is subject to uncertainty. On one hand, \ceN solubility in magma is dependent on the redox state of the magma, with more reducing conditions allowing more dissolved \ceN (Boulliung et al., 2020). The early magma ocean on Mars may have been more reducing than Earth’s magma ocean (Armstrong et al., 2019), and as discussed above, Mars’s mantle since planet solidification may have been more reduced than Earth’s mantle. This would lead to a higher \ceN concentration in the Martian mantle than in the “Silicate Earth” assumption we employ. On the other hand, Earth’s mantle \ceN2 concentration may have been significantly affected by subduction processes that do not occur on Mars (Marty & Dauphas, 2003; Kurokawa et al., 2022). Thus, it is also possible that the true \ceN concentration in the Martian mantle is lower than our “Silicate Earth” assumption. Although we do not explicitly vary the model mantle \ceN concentration, uncertainty in its value is incorporated into the multipliers of volcanic outgassing and atmospheric escape of nitrogen. Higher values for these multipliers correspond to an enhanced magma \ceN2 concentration on Mars, and vice versa.
We do not include direct or indirect hydrodynamic escape. Analysis of noble gas isotopes (e.g., Cassata et al., 2022) indicates that significant hydrodynamic escape of Mars’s primary atmosphere ceased before our model time domain. Furthermore, up to 10% \ceH2 in the ancient atmosphere should have little effect on the evolution of the other species we model, as hydrodynamic drag from such a small \ceH2 component should be negligible (Zahnle & Kasting, 1986). Thus, we assume that the minimal hydrodynamic escape during our model time domain is incorporated into the uncertainty of our modeled escape rates via model parameters and multipliers. Reconciling the atmosphere we predict at 3.8 Ga with earlier hydrodynamic escape is an interesting challenge, though. The atmosphere we predict at 3.8 Ga is consistent with modern Mars’s escape rates and atmospheric composition; future studies may determine if it is also consistent with the vastly different processes occurring beforehand.
The extended range MCMC simulations further explore the boundary conditions of the model. Many solutions found in the extended range simulations are likely unrealistic because they push the model far from the current best estimates or the empirically constrained ranges. For example, the outgassing multiplier is not likely to be at the upper end of the extended range because we would have the record for much more volcanic activity on Mars. Thus, we feel that the solutions found in the baseline MCMC simulations are probably more realistic for the evolution of Mars’s atmosphere.
5 Conclusions
We have presented a comprehensive model that simulates the evolution of \ceCO2, \ceN2, and \ceAr in the Martian atmosphere from 3.8 billion years ago (Ga) to the present. The model keeps track of both the mass of each species and its isotopic composition through the course of an evolution as the atmosphere is subject to a host of planetary processes. The model includes atmospheric escape (via photochemical processes, pick-up ion sputtering, and direct ion loss), volcanic outgassing, interplanetary dust particle accretion, atmospheric collapse, carbonate formation, nitrate formation, and crustal erosion. There is no predetermined evolution for any atmospheric species. The abundances of the three species are dynamically updated at each timestep according to the planetary processes. The mixing ratios of the three species are calculated accordingly and, in turn, are used to calculate the rate at which planetary processes impact each species for the next timestep. Model runs that recreate the present day abundances and isotopic composition of \ceCO2, \ceN2, and \ceAr in the Martian atmosphere are considered solutions. We used a Markov-Chain Monte Carlo method to systematically explore the parameter space and identify hundreds of thousands of solutions, derive posterior distributions for parameters, and constrain the composition of Mars’s atmosphere at 3.8 Ga.
This analysis yields the following conclusions. (1) Including multiple species in the model is important. Because we jointly analyze \ceCO2, \ceN2, and \ceAr, constraints originally arising from individual species must now be consistent with all three. For example, the \ceN2 evolution requires a high volcanic production rate and the \ceAr evolution requires a low sputtering rate. The rates of volcanic production and sputtering affect all three species, so constraints on their values cause downstream constraints on other parameters (e.g., magma \ceCO2 concentration () and upper atmosphere structure ()). Thus, the joint analysis results in new constraints or strengthens existing ones, which improve our understanding of Mars’s ancient atmospheric composition and evolution. (2) Carbonate deposition critically determines the ancient \cepCO2. For 0.3-1.4 bar \ceCO2 in carbonates globally on Mars, we predict 0.3-1.5 bar atmospheric \ceCO2 at 3.8 Ga. If there was a \ceCO2-rich atmosphere on ancient Mars, extensive carbonate deposition in open water on Mars’s surface is required to recreate the modern \ceCO2 abundance and isotopic composition. Conversely, evidence that most carbonate deposition occurred in subsurface aquifers indicates a \ceCO2-poor ancient atmosphere. (3) Our models indicate the ancient Martian mantle had oxygen fugacity of IW to IW-1, suggesting a volcanic \ceH2 flux up to 1.34 cm-2 s-1 is consistent with a \ceCO2-rich atmosphere. This alone cannot support a 5% \ceH2 atmosphere required for substantial warming of the surface, so non-volcanic \ceH2 sources, such as crustal hydration, would be necessary. (4) Our models predict that \ceN2 was a major component of the atmosphere (0.1-0.5 bar) at 3.8 Ga. This is consistent with the “dynamical track” \ceN2 solutions found in a previous isotopic model (Hu & Thomas, 2022). (5) Our results point to an emerging picture of a \ceCO2-\ceN2-\ceH2 greenhouse atmosphere on ancient Mars. We have shown that a \ceCO2-rich atmosphere is compatible with hundreds of mbars of \ceN2 and a potential \ceH2 component.
The ancient Martian atmosphere must be consistent with the geologic evidence for surface liquid-water as well as Mars’s geochemical evolution. There are many potential atmospheric sizes and compositions that can generate a climate that supports liquid-water on ancient Mars. The evidence from Mars’s geochemical evolution can tell us which of these potential atmospheres actually existed. The \ceCO2-\ceN2 atmosphere we propose comes solely from analysis of the geochemical evolution, but may also explain the ancient climate when combined with additional \ceH2 source fluxes. Thus, the \ceCO2-\ceN2-\ceH2 atmosphere is a promising candidate for the ancient atmosphere that explains evidence from both the geochemical evolution and the ancient climate. Studies of the implied climate from this atmosphere and the in situ and sample return analysis of the isotopic record will be useful for further refining and testing this prediction. This effort ultimately improves our understanding of ancient Mars: an important, potentially habitable environment elsewhere in the solar system.
We thank Y. L. Yung, B. Ehlmann, and B. Jakosky for helpful discussions. This work was supported by NASA Habitable Worlds grant NNN13D466T, later changed to 80NM0018F0612. The research was carried out at the Jet Propulsion Laboratory, California Institute of Technology, under a contract with the National Aeronautics and Space Administration.
The Matlab source code for the coupled atmospheric evolution model, the associated configuration files used in this study, and the data required to make the figures in the main text are publicly available at Zenodo (https://doi.org/10.5281/zenodo.7600495).
References
- Armstrong et al. (2019) Armstrong, K., Frost, D. J., McCammon, C. A., Rubie, D. C., & Boffa Ballaran, T. 2019, Science, 365, 903, doi: 10.1126/science.aax8376
- Atreya et al. (2013) Atreya, S. K., Trainer, M. G., Franz, H. B., et al. 2013, Geophysical Research Letters, 40, 5605, doi: 10.1002/2013GL057763
- Bandfield et al. (2003) Bandfield, J. L., Glotch, T. D., & Christensen, P. R. 2003, Science, 301, 1084, doi: 10.1126/science.1088054
- Barabash et al. (2007) Barabash, S., Fedorov, A., Lundin, R., & Sauvaud, J.-A. 2007, Science, 315, 501, doi: 10.1126/science.1134358
- Batalha et al. (2015) Batalha, N., Domagal-Goldman, S. D., Ramirez, R., & Kasting, J. F. 2015, Icarus, 258, 337, doi: 10.1016/j.icarus.2015.06.016
- Bergin et al. (2015) Bergin, E. A., Blake, G. A., Ciesla, F., Hirschmann, M. M., & Li, J. 2015, Proceedings of the National Academy of Sciences, 112, 8965, doi: 10.1073/pnas.1500954112
- Bougher et al. (2015) Bougher, S., Jakosky, B., Halekas, J., et al. 2015, Science, 350, aad0459, doi: 10.1126/science.aad0459
- Boulliung et al. (2020) Boulliung, J., Füri, E., Dalou, C., et al. 2020, Geochimica et Cosmochimica Acta, 284, 120, doi: 10.1016/j.gca.2020.06.020
- Brasser (2013) Brasser, R. 2013, Space Science Reviews, 174, 11, doi: 10.1007/s11214-012-9904-2
- Carr & Head (2003) Carr, M. H., & Head, J. W. 2003, Journal of Geophysical Research, 108, 5042, doi: 10.1029/2002JE001963
- Cassata et al. (2010) Cassata, W. S., Shuster, D. L., Renne, P. R., & Weiss, B. P. 2010, Geochimica et Cosmochimica Acta, 74, 6900, doi: 10.1016/j.gca.2010.08.027
- Cassata et al. (2022) Cassata, W. S., Zahnle, K. J., Samperton, K. M., Stephenson, P. C., & Wimpenny, J. 2022, Earth and Planetary Science Letters, 580, 117349, doi: 10.1016/j.epsl.2021.117349
- Claire et al. (2012) Claire, M. W., Sheets, J., Cohen, M., et al. 2012, The Astrophysical Journal, 757, 95, doi: 10.1088/0004-637X/757/1/95
- Coplen et al. (2002) Coplen, T. B., Böhlke, J. K., De Bièvre, P., et al. 2002, Pure and Applied Chemistry, 74, 1987, doi: 10.1351/pac200274101987
- de Niem et al. (2012) de Niem, D., Kührt, E., Morbidelli, A., & Motschmann, U. 2012, Icarus, 221, 495, doi: 10.1016/j.icarus.2012.07.032
- Di Achille & Hynek (2010) Di Achille, G., & Hynek, B. M. 2010, Nature Geoscience, 3, 459, doi: 10.1038/ngeo891
- Edwards & Ehlmann (2015) Edwards, C. S., & Ehlmann, B. L. 2015, Geology, 43, 863, doi: 10.1130/G36983.1
- Ehlmann & Edwards (2014) Ehlmann, B. L., & Edwards, C. S. 2014, Annual Review of Earth and Planetary Sciences, 42, 291, doi: 10.1146/annurev-earth-060313-055024
- Ehlmann et al. (2008) Ehlmann, B. L., Mustard, J. F., Murchie, S. L., et al. 2008, Science, 322, 1828, doi: 10.1126/science.1164759
- Fassett & Head (2011) Fassett, C. I., & Head, J. W. 2011, Icarus, 211, 1204, doi: 10.1016/j.icarus.2010.11.014
- Faure (1991) Faure, G. 1991, Principles and applications of inorganic geochemistry: a comprehensive textbook for geology students (New York : Toronto : New York: Macmillan Pub. Co. ; Collier Macmillan ; Maxwell Macmillan International)
- Flynn (1997) Flynn, G. J. 1997, Journal of Geophysical Research: Planets, 102, 9175, doi: 10.1029/96JE03883
- Forget et al. (2013) Forget, F., Wordsworth, R., Millour, E., et al. 2013, Icarus, 222, 81, doi: 10.1016/j.icarus.2012.10.019
- Fox (1993) Fox, J. L. 1993, Journal of Geophysical Research: Planets, 98, 3297, doi: 10.1029/92JE02289
- Fox & Dalgarno (1983) Fox, J. L., & Dalgarno, A. 1983, Journal of Geophysical Research: Space Physics, 88, 9027, doi: 10.1029/JA088iA11p09027
- Fox & Hać (1997) Fox, J. L., & Hać, A. 1997, Journal of Geophysical Research: Planets, 102, 9191, doi: 10.1029/97JE00086
- Franz et al. (2015) Franz, H. B., Trainer, M. G., Wong, M. H., et al. 2015, Planetary and Space Science, 109-110, 154, doi: 10.1016/j.pss.2015.02.014
- Gelman & Rubin (1992) Gelman, A., & Rubin, D. B. 1992, Statistical science, 7, 457
- Greeley & Schneid (1991) Greeley, R., & Schneid, B. D. 1991, Science, 254, 996, doi: 10.1126/science.254.5034.996
- Grott et al. (2011) Grott, M., Morschhauser, A., Breuer, D., & Hauber, E. 2011, Earth and Planetary Science Letters, 308, 391, doi: 10.1016/j.epsl.2011.06.014
- Grotzinger et al. (2014) Grotzinger, J. P., Sumner, D. Y., Kah, L. C., et al. 2014, Science, 343, 1242777, doi: 10.1126/science.1242777
- Haberle et al. (2001) Haberle, R. M., McKay, C. P., Schaeffer, J., et al. 2001, Journal of Geophysical Research: Planets, 106, 23317, doi: 10.1029/2000JE001360
- Haberle et al. (1994) Haberle, R. M., Tyler, D., McKay, C. P., & Davis, W. L. 1994, Icarus, 109, 102, doi: 10.1006/icar.1994.1079
- Halevy et al. (2011) Halevy, I., Fischer, W. W., & Eiler, J. M. 2011, Proceedings of the National Academy of Sciences, 108, 16895, doi: 10.1073/pnas.1109444108
- Hartmann (2005) Hartmann, W. K. 2005, Icarus, 174, 294, doi: 10.1016/j.icarus.2004.11.023
- Hirschmann & Withers (2008) Hirschmann, M. M., & Withers, A. C. 2008, Earth and Planetary Science Letters, 270, 147, doi: 10.1016/j.epsl.2008.03.034
- Holland (1984) Holland, H. D. 1984, The chemical evolution of the atmosphere and oceans, Princeton series in geochemistry (Princeton, N.J: Princeton University Press)
- House et al. (2022) House, C. H., Wong, G. M., Webster, C. R., et al. 2022, Proceedings of the National Academy of Sciences, 119, e2115651119, doi: 10.1073/pnas.2115651119
- Hu et al. (2015) Hu, R., Kass, D. M., Ehlmann, B. L., & Yung, Y. L. 2015, Nature Communications, 6, 10003, doi: 10.1038/ncomms10003
- Hu & Thomas (2022) Hu, R., & Thomas, T. B. 2022, Nature Geoscience, 15, 106, doi: 10.1038/s41561-021-00886-y
- Humes (1980) Humes, D. H. 1980, Journal of Geophysical Research: Space Physics, 85, 5841, doi: 10.1029/JA085iA11p05841
- Ivanov (2001) Ivanov, B. A. 2001, in Chronology and Evolution of Mars, ed. R. Kallenbach, J. Geiss, & W. K. Hartmann, Vol. 12 (Dordrecht: Springer Netherlands), 87–104, doi: 10.1007/978-94-017-1035-0_4
- Jakosky (1991) Jakosky, B. M. 1991, Icarus, 94, 14, doi: 10.1016/0019-1035(91)90138-J
- Jakosky (2019) —. 2019, Planetary and Space Science, 175, 52, doi: 10.1016/j.pss.2019.06.002
- Jakosky & Jones (1997) Jakosky, B. M., & Jones, J. H. 1997, Reviews of Geophysics, 35, 1, doi: 10.1029/96RG02903
- Jakosky et al. (1994) Jakosky, B. M., Pepin, R. O., Johnson, R. E., & Fox, J. 1994, Icarus, 111, 271, doi: 10.1006/icar.1994.1145
- Jakosky et al. (2017) Jakosky, B. M., Slipski, M., Benna, M., et al. 2017, Science, 355, 1408, doi: 10.1126/science.aai7721
- Jakosky et al. (2015a) Jakosky, B. M., Lin, R. P., Grebowsky, J. M., et al. 2015a, Space Science Reviews, 195, 3, doi: 10.1007/s11214-015-0139-x
- Jakosky et al. (2015b) Jakosky, B. M., Grebowsky, J. M., Luhmann, J. G., et al. 2015b, Science, 350, aad0210, doi: 10.1126/science.aad0210
- Kass (1999) Kass, D. M. 1999, PhD thesis
- Kasting (1991) Kasting, J. F. 1991, Icarus, 94, 1, doi: 10.1016/0019-1035(91)90137-I
- Kite et al. (2021) Kite, E. S., Steele, L. J., Mischna, M. A., & Richardson, M. I. 2021, Proceedings of the National Academy of Sciences, 118, e2101959118, doi: 10.1073/pnas.2101959118
- Kite et al. (2014) Kite, E. S., Williams, J.-P., Lucas, A., & Aharonson, O. 2014, Nature Geoscience, 7, 335, doi: 10.1038/ngeo2137
- Kurahashi-Nakamura & Tajika (2006) Kurahashi-Nakamura, T., & Tajika, E. 2006, Geophysical Research Letters, 33, n/a, doi: 10.1029/2006GL027170
- Kurokawa et al. (2018) Kurokawa, H., Kurosawa, K., & Usui, T. 2018, Icarus, 299, 443, doi: 10.1016/j.icarus.2017.08.020
- Kurokawa et al. (2022) Kurokawa, H., Laneuville, M., Li, Y., et al. 2022, Geochemistry, Geophysics, Geosystems, 23, e2021GC010295, doi: 10.1029/2021GC010295
- Kurokawa et al. (2021) Kurokawa, H., Miura, Y. N., Sugita, S., et al. 2021, Icarus, 370, 114685, doi: 10.1016/j.icarus.2021.114685
- Kurokawa et al. (2014) Kurokawa, H., Sato, M., Ushioda, M., et al. 2014, Earth and Planetary Science Letters, 394, 179, doi: 10.1016/j.epsl.2014.03.027
- Kurokawa et al. (2016) Kurokawa, H., Usui, T., & Sato, M. 2016, GEOCHEMICAL JOURNAL, 50, 67, doi: 10.2343/geochemj.2.0407
- Lammer et al. (2003) Lammer, H., Kolb, C., Penz, T., et al. 2003, International Journal of Astrobiology, 2, 195, doi: 10.1017/S1473550403001605
- Lammer et al. (2020) Lammer, H., Scherf, M., Kurokawa, H., et al. 2020, Space Science Reviews, 216, 74, doi: 10.1007/s11214-020-00701-x
- Laskar et al. (2004) Laskar, J., Correia, A., Gastineau, M., et al. 2004, Icarus, 170, 343, doi: 10.1016/j.icarus.2004.04.005
- Leblanc (2002) Leblanc, F. 2002, Journal of Geophysical Research, 107, 5010, doi: 10.1029/2000JE001473
- Leblanc et al. (2012) Leblanc, F., Chassefière, E., Gillmann, C., & Breuer, D. 2012, Icarus, 218, 561, doi: 10.1016/j.icarus.2012.01.006
- Lee et al. (2006) Lee, J.-Y., Marti, K., Severinghaus, J. P., et al. 2006, Geochimica et Cosmochimica Acta, 70, 4507, doi: 10.1016/j.gca.2006.06.1563
- Lillis et al. (2008) Lillis, R. J., Frey, H. V., & Manga, M. 2008, Geophysical Research Letters, 35, L14203, doi: 10.1029/2008GL034338
- Lissauer et al. (2012) Lissauer, J. J., Barnes, J. W., & Chambers, J. E. 2012, Icarus, 217, 77, doi: 10.1016/j.icarus.2011.10.013
- Liu et al. (2018) Liu, Y., Chen, Y., Guan, Y., et al. 2018, Earth and Planetary Science Letters, 490, 206, doi: 10.1016/j.epsl.2018.03.019
- Lo et al. (2020) Lo, D. Y., Yelle, R. V., & Lillis, R. J. 2020, Icarus, 352, 114001, doi: 10.1016/j.icarus.2020.114001
- Lo et al. (2021) Lo, D. Y., Yelle, R. V., Lillis, R. J., & Deighan, J. I. 2021, Icarus, 360, 114371, doi: 10.1016/j.icarus.2021.114371
- Ma & Nagy (2007) Ma, Y.-J., & Nagy, A. F. 2007, Geophysical Research Letters, 34, doi: 10.1029/2006GL029208
- Mahaffy et al. (2013) Mahaffy, P. R., Webster, C. R., Atreya, S. K., et al. 2013, Science, 341, 263, doi: 10.1126/science.1237966
- Manning et al. (2011) Manning, C. V., Ma, Y., Brain, D. A., McKay, C. P., & Zahnle, K. J. 2011, Icarus, 212, 131, doi: 10.1016/j.icarus.2010.11.028
- Marty (2012) Marty, B. 2012, Earth and Planetary Science Letters, 313-314, 56, doi: 10.1016/j.epsl.2011.10.040
- Marty & Dauphas (2003) Marty, B., & Dauphas, N. 2003, Earth and Planetary Science Letters, 206, 397, doi: 10.1016/S0012-821X(02)01108-1
- Mathew & Marti (2001) Mathew, K. J., & Marti, K. 2001, Journal of Geophysical Research: Planets, 106, 1401, doi: 10.1029/2000JE001255
- Michalski & Niles (2010) Michalski, J. R., & Niles, P. B. 2010, Nature Geoscience, 3, 751, doi: 10.1038/ngeo971
- Morbidelli et al. (2000) Morbidelli, A., Chambers, J., Lunine, J. I., et al. 2000, Meteoritics & Planetary Science, 35, 1309, doi: 10.1111/j.1945-5100.2000.tb01518.x
- Morris et al. (2010) Morris, R. V., Ruff, S. W., Gellert, R., et al. 2010, Science, 329, 421, doi: 10.1126/science.1189667
- Morschhauser et al. (2011) Morschhauser, A., Grott, M., & Breuer, D. 2011, Icarus, 212, 541, doi: 10.1016/j.icarus.2010.12.028
- Niles et al. (2013) Niles, P. B., Catling, D. C., Berger, G., et al. 2013, Space Science Reviews, 174, 301, doi: 10.1007/s11214-012-9940-y
- Pepin (1991) Pepin, R. O. 1991, Icarus, 92, 2, doi: 10.1016/0019-1035(91)90036-S
- Pepin (1994) —. 1994, Icarus, 111, 289, doi: 10.1006/icar.1994.1146
- Pepin et al. (2012) Pepin, R. O., Schlutter, D. J., Becker, R. H., & Reisenfeld, D. B. 2012, Geochimica et Cosmochimica Acta, 89, 62, doi: 10.1016/j.gca.2012.04.024
- Phillips et al. (2011) Phillips, R. J., Davis, B. J., Tanaka, K. L., et al. 2011, Science, 332, 838, doi: 10.1126/science.1203091
- Ramirez (2017) Ramirez, R. M. 2017, Icarus, 297, 71, doi: 10.1016/j.icarus.2017.06.025
- Ramirez et al. (2020) Ramirez, R. M., Craddock, R. A., & Usui, T. 2020, Journal of Geophysical Research: Planets, 125, doi: 10.1029/2019JE006160
- Ramirez & Kasting (2017) Ramirez, R. M., & Kasting, J. F. 2017, Icarus, 281, 248, doi: 10.1016/j.icarus.2016.08.016
- Ramirez et al. (2014) Ramirez, R. M., Kopparapu, R., Zugger, M. E., et al. 2014, Nature Geoscience, 7, 59, doi: 10.1038/ngeo2000
- Ribas et al. (2005) Ribas, I., Guinan, E. F., Güdel, M., & Audard, M. 2005, The Astrophysical Journal, 622, 680
- Robbins & Hynek (2012) Robbins, S. J., & Hynek, B. M. 2012, Journal of Geophysical Research: Planets, 117, n/a, doi: 10.1029/2011JE003966
- Robbins et al. (2013) Robbins, S. J., Hynek, B. M., Lillis, R. J., & Bottke, W. F. 2013, Icarus, 225, 173, doi: 10.1016/j.icarus.2013.03.019
- Scheller et al. (2021) Scheller, E. L., Ehlmann, B. L., Hu, R., Adams, D. J., & Yung, Y. L. 2021, Science, 372, 56, doi: 10.1126/science.abc7717
- Slipski & Jakosky (2016) Slipski, M., & Jakosky, B. M. 2016, Icarus, 272, 212, doi: 10.1016/j.icarus.2016.02.047
- Smith et al. (2009) Smith, D. E., Zuber, M. T., Torrence, M. H., et al. 2009, Journal of Geophysical Research, 114, E05002, doi: 10.1029/2008JE003267
- Soto et al. (2015) Soto, A., Mischna, M., Schneider, T., Lee, C., & Richardson, M. 2015, Icarus, 250, 553, doi: 10.1016/j.icarus.2014.11.028
- Stern et al. (2015) Stern, J. C., Sutter, B., Freissinet, C., et al. 2015, Proceedings of the National Academy of Sciences, 112, 4245, doi: 10.1073/pnas.1420932112
- Sutter et al. (2017) Sutter, B., McAdam, A. C., Mahaffy, P. R., et al. 2017, Journal of Geophysical Research: Planets, 122, 2574, doi: 10.1002/2016JE005225
- Svetsov (2007) Svetsov, V. V. 2007, Solar System Research, 41, 28, doi: 10.1134/S0038094607010030
- Tanaka et al. (2014) Tanaka, K., Robbins, S., Fortezzo, C., Skinner, J., & Hare, T. 2014, Planetary and Space Science, 95, 11, doi: 10.1016/j.pss.2013.03.006
- Tu et al. (2015) Tu, L., Johnstone, C. P., Güdel, M., & Lammer, H. 2015, Astronomy & Astrophysics, 577, L3, doi: 10.1051/0004-6361/201526146
- Turbet et al. (2020) Turbet, M., Boulet, C., & Karman, T. 2020, Icarus, 346, 113762, doi: 10.1016/j.icarus.2020.113762
- Urata & Toon (2013) Urata, R. A., & Toon, O. B. 2013, Icarus, 226, 229, doi: 10.1016/j.icarus.2013.05.014
- Villanueva et al. (2015) Villanueva, G. L., Mumma, M. J., Novak, R. E., et al. 2015, Science, 348, 218, doi: 10.1126/science.aaa3630
- Vogel et al. (2011) Vogel, N., Heber, V. S., Baur, H., Burnett, D. S., & Wieler, R. 2011, Geochimica et Cosmochimica Acta, 75, 3057, doi: 10.1016/j.gca.2011.02.039
- von Paris et al. (2013) von Paris, P., Grenfell, J., Rauer, H., & Stock, J. 2013, Planetary and Space Science, 82-83, 149, doi: 10.1016/j.pss.2013.04.009
- Ward (1974) Ward, W. R. 1974, Journal of Geophysical Research, 79, 3375, doi: 10.1029/JC079i024p03375
- Warren & Kallemeyn (1996) Warren, P. H., & Kallemeyn, G. W. 1996, Meteoritics & Planetary Science, 31, 97, doi: 10.1111/j.1945-5100.1996.tb02059.x
- Watson et al. (2007) Watson, E. B., Thomas, J. B., & Cherniak, D. J. 2007, Nature, 449, 299, doi: 10.1038/nature06144
- Webster et al. (2013) Webster, C. R., Mahaffy, P. R., Flesch, G. J., et al. 2013, Science, 341, 260, doi: 10.1126/science.1237961
- Willett et al. (2022) Willett, C. D., Cassata, W. S., & Marks, N. E. 2022, Geochimica et Cosmochimica Acta, 329, 119, doi: 10.1016/j.gca.2022.04.017
- Wong et al. (2013) Wong, M. H., Atreya, S. K., Mahaffy, P. N., et al. 2013, Geophysical Research Letters, 40, 6033, doi: 10.1002/2013GL057840
- Wordsworth et al. (2013) Wordsworth, R., Forget, F., Millour, E., et al. 2013, Icarus, 222, 1, doi: 10.1016/j.icarus.2012.09.036
- Wordsworth et al. (2017) Wordsworth, R., Kalugina, Y., Lokshtanov, S., et al. 2017, Geophysical Research Letters, 44, 665, doi: 10.1002/2016GL071766
- Wordsworth et al. (2021) Wordsworth, R., Knoll, A. H., Hurowitz, J., et al. 2021, Nature Geoscience, 14, 127, doi: 10.1038/s41561-021-00701-8
- Wordsworth & Pierrehumbert (2013) Wordsworth, R., & Pierrehumbert, R. 2013, Science, 339, 64, doi: 10.1126/science.1225759
- Wordsworth (2016) Wordsworth, R. D. 2016, Annual Review of Earth and Planetary Sciences, 44, 381, doi: 10.1146/annurev-earth-060115-012355
- Wray et al. (2016) Wray, J. J., Murchie, S. L., Bishop, J. L., et al. 2016, Journal of Geophysical Research: Planets, 121, 652, doi: 10.1002/2015JE004972
- Wright et al. (1992) Wright, I., Grady, M. M., & Pillinger, C. 1992, Geochimica et Cosmochimica Acta, 56, 817, doi: 10.1016/0016-7037(92)90100-W
- Zahnle (1993) Zahnle, K. J. 1993, Journal of Geophysical Research, 98, 10899, doi: 10.1029/92JE02941
- Zahnle & Kasting (1986) Zahnle, K. J., & Kasting, J. F. 1986, Icarus, 68, 462, doi: 10.1016/0019-1035(86)90051-5
- Zent et al. (1994) Zent, A., Quinn, R., & Jakosky, B. 1994, Icarus, 112, 537
- Zent & Quinn (1995) Zent, A. P., & Quinn, R. C. 1995, Journal of Geophysical Research, 100, 5341, doi: 10.1029/94JE01899