High-Harmonic Generation with a twist: all-optical characterization of magic-angle twisted bilayer graphene.
Abstract
If we stack up two layers of graphene while changing their respective orientation by some twisting angle, we end up with a system that has striking differences when compared to single-layer graphene. For a very specific value of this twist angle, known as magic angle, twisted bilayer graphene displays a unique phase diagram that cannot be found in other systems. Recently, high harmonic generation spectroscopy has been successfully applied to elucidate the electronic properties of quantum materials. The purpose of the present work is to exploit the nonlinear optical response of magic-angle twisted bilayer graphene to unveil its electronic properties. We show that the band structure of magic-angle twisted bilayer graphene is imprinted onto its high-harmonic spectrum. Specifically, we observe a drastic decrease of harmonic signal as we approach the magic angle. Our results show that high harmonic generation can be used as a spectroscopy tool for measuring the twist angle and also the electronic properties of twisted bilayer graphene, paving the way for an all-optical characterization of moiré materials.
Introduction
The discovery of magic-angle twisted bilayer graphene (MATBG) (Cao et al., 2018a, b) has sparked a huge increase of attraction into moiré quantum materials (Andrei et al., 2021) in the recent years. One of the key reasons for that increase is that MATBG shows a unique plethora of exotic phenomena (Andrei and MacDonald, 2020), which includes correlated insulators (Cao et al., 2018a; Lu et al., 2019), unconventional superconductivity (Cao et al., 2018b; Yankowitz et al., 2019; Lu et al., 2019), interacting topological phases (Nuckolls et al., 2020; Choi et al., 2021; Xie et al., 2021a), ferromagnetism (Sharpe et al., 2019) and also strange metal behavior (Cao et al., 2020; Jaoui et al., 2022). Such phase diagram has some resemblance with the phenomenology present in cuprates (Keimer et al., 2015) and iron pnictides (Fernandes et al., 2022) superconductors. For instance, both systems share the presence of superconducting domes surrounded by correlated insulating states as doping is varied. Moiré materials have opened completely new avenues in research thanks to the unprecedented in-situ tunability of their electronic properties through electronic gates, strain, magnetic field, pressure or substrate alignement among others. This has for example allowed observing many different correlated insulating states in a single MATBG sample, including integer and fractional Chern insulators as well as trivial insulators with or without charge density modulations (Xie et al., 2021a).
At the heart of the correlated phases of MATBG it is the existence of two flat bands (Bistritzer and MacDonald, 2011; Lisi et al., 2021; Lopes dos Santos et al., 2007) at the so-called magic angle . As the bandwidth is reduced, the role played by the interactions increases (Choi et al., 2019; Datta et al., ) and rich and complex physics arises. The nature of these flat bands is far from trivial, as they are formed by the hybridization of the Dirac cones of each layer of graphene (Cao et al., 2018a; San-Jose et al., 2012). A proper characterization of the low energy bandstructure of MATBG is key to unveil the origin of the correlated states. On the other hand, studying the electronic properties of these flat bands requires of new spectroscopic tools as the large moiré unit cell and the two dimensionality of MATBG complicate the applicability of many experimental techniques of common use in other strongly correlated materials.
In parallel, the study of the interaction between ultrashort laser pulses and condensed matter systems has also experienced a huge growth in relevance (Kruchinin et al., 2018). Such short pulses can drive the system’s electrons into a non-equilibrium excited state within times below their own cycle. As a consequence of this excitation, the electrons emit coherent radiation in multiples (up to the hundreds) of the laser frequency, providing us a tool to unveil their dynamics. Even though this high-harmonic generation (HHG) had its origins in atomic and molecular physics (Krausz and Ivanov, 2009), it has been recently, and successfully, applied to condensed matter systems as a spectroscopy tool (Ghimire and Reis, 2018; Goulielmakis and Brabec, 2022). For instance, it has allowed for the observation of ultrafast electron-hole dynamics (Vampa et al., 2015a), insulator-to-metal transitions (Silva et al., 2018; Bionta et al., 2021), topological transitions (Silva et al., 2019a; Chacón et al., 2020), and light-driven band structure (Uzan-Narovlansky et al., 2022).
Why HHG can be effectively used as a spectroscopy tool, can be understood thanks to its underlying physical mechanisms. The HHG spectrum in solids comes from two distinct contributions, namely intraband and interband currents. Intraband harmonics are generated due to the accelerated motion of the electron (hole) in the conduction (valence) band after a multiphoton/tunneling excitation of the electron from the valence band. Afterwards, the recombination of such pair gives rise to the interband harmonics. While intraband contributions are generally associated with low order harmonics (Jürgens et al., 2020), higher-order ones are caused by the latter contributions (Vampa et al., 2014). In the presence of a strong low frequency laser field, the charge carriers are drifted through the whole Brillouin zone, exploring sections, and hence physics, that are not commonly seen by other optical tests, such as second harmonic generation (Boyd, 2008).
In the present work, we aim to bridge the gap between these two distinct fields by studying HHG in magic-angle twisted bilayer graphene. Remarkably, in spite of extensive work in twisted bilayer graphene (Bernevig et al., 2021a; Song et al., 2021; Bernevig et al., 2021b; Lian et al., 2021; Bernevig et al., 2021c; Xie et al., 2021b), its ultrafast dynamics have been hardly explored, with very few exceptions (Ikeda, 2020; Mrudul and Dixit, 2021; Du et al., 2021; Yang et al., 2020). However and to the knowledge of the authors, no previous work has dealt with highly nonlinear optical response in MATBG. Here we show that the emitted spectrum reveals the formation of the flat bands at the magic angle.
results
As it has been discussed earlier, the HHG of solids is extremely dependent on the electronic band structure of the system (Tancogne-Dejean et al., 2017; Silva et al., 2019b), up to the point that one can reconstruct the band structure from its high-harmonic spectrum (Vampa et al., 2015b). Therefore, the harmonic spectra of twisted bilayer graphene must inevitably reflect the existence (or absence) of the flat bands.
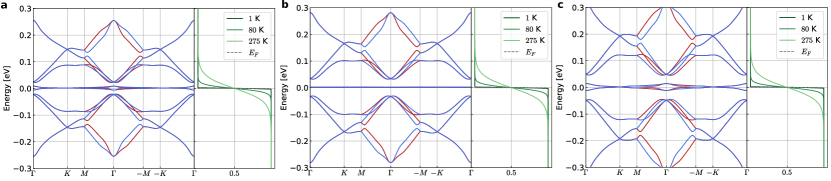
The purpose of this work is to show that one can characterize the magic angle in an all-optical way, offering an alternative to other characterization techniques, such as scanning tunneling microscopy (Lisi et al., 2021). We show that when the twist angle of the TBG gets near , the intensity of the high harmonics (from the third upwards) is reduced by several orders of magnitude. Moreover, it is shown that the effect is robust against important variations of the laser field and to temperature changes, providing a more robust probe of magic angle over the existing ones.To check this hypothesis, we performed numerical simulations (see Methods for more details on the model and the time propagation scheme). To test the effect of the flat bands on the emission spectra, we will scan a set of twist angles, near , ranging from to . In Fig. 2, we show the band structure for 3 different angles: the magic angle itself ( in our model), one angle above () and one below it (). One can notice how the bands lose their flatness when we move away from .
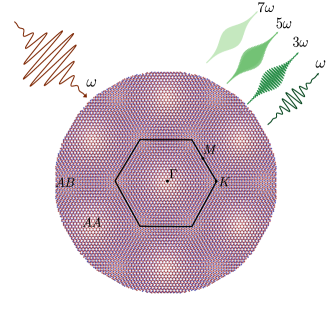
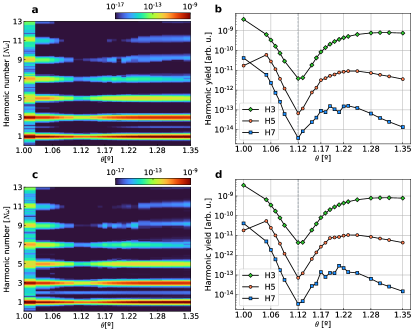
Figure 3(a) shows the harmonic spectrum of the TBG for a laser in the direction (see Fig. 1) as a function of the twist angle. A main feature emerge: a strong suppression of the intensity of the odd non-linear harmonics for twist angles near . In order to obtain a clearer grasp of the magnitude of this decrease, Fig. 3(b) presents the harmonic yield from the third up to the seventh harmonic. In spite of the small angle differences, the intensities of each of the three harmonics differ by several orders of magnitude. This disparity would allow for all-optical characterization of the magic-angle twisted bilayer graphene, even for twist angles close to each other; see for instance, the difference between versus .
Even though the process here described is rather complex, the physical intuition behind it, is not. At a semiclassical level, the intraband current can be expressed as (Vampa et al., 2014)
| (1) |
where is the energy of the -th band and the crystal momentum is given by . Therefore, the most relevant contribution to the emission spectra is the curvature of the bands. Hence, when the band starts to flatten, the harmonic intensity will be reduced. While this semiclassical explanation cannot account for all the subtle, yet interesting, physics of the system, it provides an understandable picture of this process.
Consequently, this phenomenon must be robust under important variations of the laser because it is only based on the existence of the flat bands. This intuition is confirmed by our numerical simulations. Figure 3(c,d) shows the same quantities as in 2(a,b) but for a laser in the direction, see Fig. 1. Independently of the laser direction, the same physics appears; when the twist angle gets close to , a depression of several orders of magnitude appears in the emission spectrum.
As seen above, the suppression of the harmonic intensity close to the magic angle crucially depends on the narrowing of the flat bands but, what happens when other bands are involved on the dynamics? For instance, when the upper conduction bands have some population due to an increase in the temperature, see Fig. 2. Intuitively, one would expect that when upper bands get populated, the current will have relevant intraband contributions and hence, the decrease on the emission will be smoothed out, as the harmonic signal will not be exclusively originated from the flat bands.
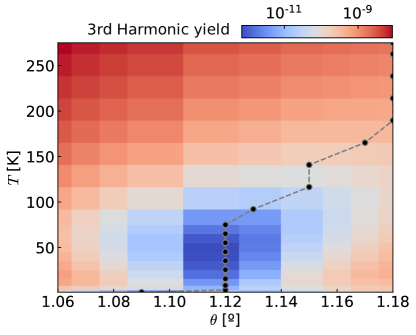
To check this hypothesis, we performed a wide temperature scan for a set of angles near . Fig. 4 shows the yield for the 3rd harmonic in terms of the twist angle and the temperature. For temperatures below K, the depression on the intensity is heavily located around the magic angle. As seen from the location of black circles which signify the minimum of the 3rd harmonic, the minimum is located at the magic angle (). However, this depression near disappears when the temperature is enough to populate the upper bands, and the minimum moves away from the magic-angle. This effect is still visible for temperatures that are well above the ones at which the correlated insulators and superconductivity have been observed in MATBG.
For low frequency laser pulses, the most important contributions to the current, and therefore to the harmonic signal, come from bands near the Fermi energy, in the case of TBG, the flat bands. In particular, by choosing laser frequencies that are smaller than the typical bandwidth of the flat bands in TBG (here ), spurious contributions from higher conductions bands can be avoided. Such small laser frequencies are crucial for our study and to detect experimentally the drop in the harmonic efficency due to the flattening of the bands. Laser frequencies and intensities similar to the ones considered here have been used in high harmonic generation measurements on a graphene monolayer (Hafez et al., 2018), making the experiments proposed experimentally feasible.
discussion
Our results have shown that the flatness of the bands of MATBG has a strong impact on its high harmonic spectrum. Their narrowing close to the magic angle produces a decrease of several orders of magnitude in the emission intensity. Such discrepancy in the optical response can be used in a fully optical study of MATBG. This effect is crucially based only on the existence of the flat bands and it holds for a wide range of laser parameters, even showing no anisotropy in the laser direction. In addition, we have confirmed that the suppression is maintained within a relatively wide range of temperatures up until 100 K, far away from the ultralow temperature regime used in most MATBG experiments. Nevertheless, we hope that our work can not only be useful as a spectroscopy tool but also, shed light onto the mechanisms behind electronic ultrafast dynamics in twisted materials.
Methods
To model TBG we start from the continuum model (Lopes dos Santos et al., 2007; Bistritzer and MacDonald, 2011; San-Jose et al., 2012) taking a graphene Fermi velocity of eV, where is the lattice constant of graphene, and a ratio between the interlayer tunneling at AA and AB regions of (Nam and Koshino, 2017). With these parameters the magic angle is found at . In the continuum model the two valleys of graphene are assumed to be uncoupled. The spectrum of TBG equals the sum of the contributions of each valley. In each of the valleys the model satisfies the symmetries: , (the combined operation involving time reversal symmetry and ), and a valley preserving mirror symmetry . Here and , involve respectively and rotations with respect to an axis perpendicular to the TBG and is a layer exchanging two fold rotation around an axis parallel to the TBG. We then adapt the Wannier function model of TBG with 8 orbitals per valley (Carr et al., 2019; Calderón and Bascones, 2020) to approximate the bandstructure model obtained with the continuum model. The resulting tight binding model includes hopping up to a radius of 10 moiré lattice constant. This Wannier model satisfies the symmetries of the continuum model in each valley. The TBG is assumed to be undoped for all the calculations by setting the chemical potential for each temperature. Since we are interested in the optical response of the bilayer, we need to assume some form for the position operator , and we restrain ourselves to the diagonal approximation (nez Azpiroz et al., 2022; Silva et al., 2019b).
Inversion and time reversal symmetry are satisfied only when the two valleys are included. The spectrum of the even harmonics is finite for each valley but it vanishes when adding the contribution of both valleys.
The time-dependent calculations were performed by solving the semiconductor Bloch equations (SBE), using Maximally Localized Wannier functions (Marzari et al., 2012) that are well suited for the model describe above, following the formalism presented in (Silva et al., 2019b). During this work, we have considered the interaction of the twisted bilayer graphene with a relatively weak pulse in the microwave regime and a gaussian envelope with a full width at half-maximum of ps. This optical regime was chosen so to properly isolate the flat bands, i.e., to avoid transitions between them and the upper conduction bands. Otherwise, such processes would give relevant interband contributions to the spectrum. Nevertheless, the physical behavior is robust under variations of both the amplitude and the frequency of the field. We note that, even though the field amplitude may seem weak, for the case of MATBG it will be relatively strong due to the reduced bandwidth of the system. The reduced density matrix was propagated in the Wannier gauge using a Monkhorst–Pack grid and a time step of fs. We checked that the dynamics were properly converged for all numerical parameters. The dephasing term (Vampa et al., 2014; Silva et al., 2019b) was set to fs , where is the laser period. However, we checked that the same results were obtained if the value of was varied.
Acknowledgments
E. B. M. and R. E. F. S. acknowledge support from the fellowship LCF/BQ/PR21/11840008 from “La Caixa” Foundation (ID 100010434). This research was supported by Grant PID2021-122769NB-I00 funded by MCIN/AEI/10.13039/501100011033.
References
- Cao et al. (2018a) Y. Cao, V. Fatemi, A. Demir, S. Fang, S. L. Tomarken, J. Y. Luo, J. D. Sanchez-Yamagishi, K. Watanabe, T. Taniguchi, E. Kaxiras, R. C. Ashoori, and P. Jarillo-Herrero, Nature 556, 80 (2018a).
- Cao et al. (2018b) Y. Cao, V. Fatemi, S. Fang, K. Watanabe, T. Taniguchi, E. Kaxiras, and P. Jarillo-Herrero, Nature 556, 43 (2018b).
- Andrei et al. (2021) E. Y. Andrei, D. K. Efetov, P. Jarillo-Herrero, A. H. MacDonald, K. F. Mak, T. Senthil, E. Tutuc, A. Yazdani, and A. F. Young, Nature Reviews Materials 6, 201 (2021).
- Andrei and MacDonald (2020) E. Y. Andrei and A. H. MacDonald, Nature Materials 19, 1265 (2020).
- Lu et al. (2019) X. Lu, P. Stepanov, W. Yang, M. Xie, M. A. Aamir, I. Das, C. Urgell, K. Watanabe, T. Taniguchi, G. Zhang, A. Bachtold, A. H. MacDonald, and D. K. Efetov, Nature 574, 653 (2019).
- Yankowitz et al. (2019) M. Yankowitz, S. Chen, H. Polshyn, Y. Zhang, K. Watanabe, T. Taniguchi, D. Graf, A. F. Young, and C. R. Dean, Science 363, 1059 (2019).
- Nuckolls et al. (2020) K. P. Nuckolls, M. Oh, D. Wong, B. Lian, K. Watanabe, T. Taniguchi, B. A. Bernevig, and A. Yazdani, Nature 588, 610 (2020).
- Choi et al. (2021) Y. Choi, H. Kim, Y. Peng, A. Thomson, C. Lewandowski, R. Polski, Y. Zhang, H. S. Arora, K. Watanabe, T. Taniguchi, J. Alicea, and S. Nadj-Perge, Nature 589, 536 (2021).
- Xie et al. (2021a) Y. Xie, A. T. Pierce, J. M. Park, D. E. Parker, E. Khalaf, P. Ledwith, Y. Cao, S. H. Lee, S. Chen, P. R. Forrester, K. Watanabe, T. Taniguchi, A. Vishwanath, P. Jarillo-Herrero, and A. Yacoby, Nature 600, 439 (2021a).
- Sharpe et al. (2019) A. L. Sharpe, E. J. Fox, A. W. Barnard, J. Finney, K. Watanabe, T. Taniguchi, M. A. Kastner, and D. Goldhaber-Gordon, Science 365, 605 (2019).
- Cao et al. (2020) Y. Cao, D. Chowdhury, D. Rodan-Legrain, O. Rubies-Bigorda, K. Watanabe, T. Taniguchi, T. Senthil, and P. Jarillo-Herrero, Phys. Rev. Lett. 124, 076801 (2020).
- Jaoui et al. (2022) A. Jaoui, I. Das, G. Di Battista, J. Díez-Mérida, X. Lu, K. Watanabe, T. Taniguchi, H. Ishizuka, L. Levitov, and D. K. Efetov, Nature Physics 18, 633 (2022).
- Keimer et al. (2015) B. Keimer, S. A. Kivelson, M. R. Norman, S. Uchida, and J. Zaanen, Nature 518, 179 (2015).
- Fernandes et al. (2022) R. M. Fernandes, A. I. Coldea, H. Ding, I. R. Fisher, P. J. Hirschfeld, and G. Kotliar, Nature 601, 35 (2022).
- Bistritzer and MacDonald (2011) R. Bistritzer and A. H. MacDonald, Proceedings of the National Academy of Sciences 108, 12233 (2011).
- Lisi et al. (2021) S. Lisi, X. Lu, T. Benschop, T. A. de Jong, P. Stepanov, J. R. Duran, F. Margot, I. Cucchi, E. Cappelli, A. Hunter, A. Tamai, V. Kandyba, A. Giampietri, A. Barinov, J. Jobst, V. Stalman, M. Leeuwenhoek, K. Watanabe, T. Taniguchi, L. Rademaker, S. J. van der Molen, M. P. Allan, D. K. Efetov, and F. Baumberger, Nature Physics 17, 189 (2021).
- Lopes dos Santos et al. (2007) J. M. B. Lopes dos Santos, N. M. R. Peres, and A. H. Castro Neto, Phys. Rev. Lett. 99, 256802 (2007).
- Choi et al. (2019) Y. Choi, J. Kemmer, Y. Peng, A. Thomson, H. Arora, R. Polski, Y. Zhang, H. Ren, J. Alicea, G. Refael, F. von Oppen, K. Watanabe, T. Taniguchi, and S. Nadj-Perge, Nature Physics 15, 1174 (2019).
- (19) A. Datta, M. Calderón, A. Camjayi, and E. Bascones, “Heavy quasiparticles and cascades without symmetry breaking in twisted bilayer graphene,” ArXiv:2301.13024.
- San-Jose et al. (2012) P. San-Jose, J. González, and F. Guinea, Phys. Rev. Lett. 108, 216802 (2012).
- Kruchinin et al. (2018) S. Y. Kruchinin, F. Krausz, and V. S. Yakovlev, Rev. Mod. Phys. 90, 021002 (2018).
- Krausz and Ivanov (2009) F. Krausz and M. Ivanov, Rev. Mod. Phys. 81, 163 (2009).
- Ghimire and Reis (2018) S. Ghimire and D. A. Reis, Nature Physics 15, 10 (2018).
- Goulielmakis and Brabec (2022) E. Goulielmakis and T. Brabec, Nature Photonics 16, 411 (2022).
- Vampa et al. (2015a) G. Vampa, T. J. Hammond, N. Thiré, B. E. Schmidt, F. Légaré, C. R. McDonald, T. Brabec, and P. B. Corkum, Nature 522, 462 (2015a).
- Silva et al. (2018) R. E. F. Silva, I. V. Blinov, A. N. Rubtsov, O. Smirnova, and M. Ivanov, Nature Photonics 12, 266 (2018).
- Bionta et al. (2021) M. R. Bionta, E. Haddad, A. Leblanc, V. Gruson, P. Lassonde, H. Ibrahim, J. Chaillou, N. Émond, M. R. Otto, A. Jiménez-Galán, R. E. F. Silva, M. Ivanov, B. J. Siwick, M. Chaker, and F. m. c. Légaré, Phys. Rev. Research 3, 023250 (2021).
- Silva et al. (2019a) R. E. F. Silva, Á. Jiménez-Galán, B. Amorim, O. Smirnova, and M. Ivanov, Nature Photonics 13, 849 (2019a).
- Chacón et al. (2020) A. Chacón, D. Kim, W. Zhu, S. P. Kelly, A. Dauphin, E. Pisanty, A. S. Maxwell, A. Picón, M. F. Ciappina, D. E. Kim, C. Ticknor, A. Saxena, and M. Lewenstein, Phys. Rev. B 102, 134115 (2020).
- Uzan-Narovlansky et al. (2022) A. J. Uzan-Narovlansky, Á. Jiménez-Galán, G. Orenstein, R. E. F. Silva, T. Arusi-Parpar, S. Shames, B. D. Bruner, B. Yan, O. Smirnova, M. Ivanov, and N. Dudovich, Nature Photonics 16, 428 (2022).
- Jürgens et al. (2020) P. Jürgens, B. Liewehr, B. Kruse, C. Peltz, D. Engel, A. Husakou, T. Witting, M. Ivanov, M. J. J. Vrakking, T. Fennel, and A. Mermillod-Blondin, Nature Physics 16, 1035 (2020).
- Vampa et al. (2014) G. Vampa, C. R. McDonald, G. Orlando, D. D. Klug, P. B. Corkum, and T. Brabec, Phys. Rev. Lett. 113, 073901 (2014).
- Boyd (2008) R. W. Boyd, Nonlinear optics (Academic press, 2008).
- Bernevig et al. (2021a) B. A. Bernevig, Z.-D. Song, N. Regnault, and B. Lian, Phys. Rev. B 103, 205411 (2021a).
- Song et al. (2021) Z.-D. Song, B. Lian, N. Regnault, and B. A. Bernevig, Phys. Rev. B 103, 205412 (2021).
- Bernevig et al. (2021b) B. A. Bernevig, Z.-D. Song, N. Regnault, and B. Lian, Phys. Rev. B 103, 205413 (2021b).
- Lian et al. (2021) B. Lian, Z.-D. Song, N. Regnault, D. K. Efetov, A. Yazdani, and B. A. Bernevig, Phys. Rev. B 103, 205414 (2021).
- Bernevig et al. (2021c) B. A. Bernevig, B. Lian, A. Cowsik, F. Xie, N. Regnault, and Z.-D. Song, Phys. Rev. B 103, 205415 (2021c).
- Xie et al. (2021b) F. Xie, A. Cowsik, Z.-D. Song, B. Lian, B. A. Bernevig, and N. Regnault, Phys. Rev. B 103, 205416 (2021b).
- Ikeda (2020) T. N. Ikeda, Phys. Rev. Research 2, 032015 (2020).
- Mrudul and Dixit (2021) M. S. Mrudul and G. Dixit, Phys. Rev. B 103, 094308 (2021).
- Du et al. (2021) M. Du, C. Liu, Z. Zeng, and R. Li, Phys. Rev. A 104, 033113 (2021).
- Yang et al. (2020) F. Yang, W. Song, F. Meng, F. Luo, S. Lou, S. Lin, Z. Gong, J. Cao, E. S. Barnard, E. Chan, L. Yang, and J. Yao, Matter 3, 1361 (2020).
- Tancogne-Dejean et al. (2017) N. Tancogne-Dejean, O. D. Mücke, F. X. Kärtner, and A. Rubio, Phys. Rev. Lett. 118, 087403 (2017).
- Silva et al. (2019b) R. E. F. Silva, F. Martín, and M. Ivanov, Phys. Rev. B 100, 195201 (2019b).
- Vampa et al. (2015b) G. Vampa, T. J. Hammond, N. Thiré, B. E. Schmidt, F. Légaré, C. R. McDonald, T. Brabec, D. D. Klug, and P. B. Corkum, Phys. Rev. Lett. 115, 193603 (2015b).
- Hafez et al. (2018) H. A. Hafez, S. Kovalev, J.-C. Deinert, Z. Mics, B. Green, N. Awari, M. Chen, S. Germanskiy, U. Lehnert, J. Teichert, Z. Wang, K.-J. Tielrooij, Z. Liu, Z. Chen, A. Narita, K. Müllen, M. Bonn, M. Gensch, and D. Turchinovich, Nature 561, 507 (2018).
- Nam and Koshino (2017) N. N. T. Nam and M. Koshino, Phys. Rev. B 96, 075311 (2017).
- Carr et al. (2019) S. Carr, S. Fang, H. C. Po, A. Vishwanath, and E. Kaxiras, Phys. Rev. Research 1, 033072 (2019).
- Calderón and Bascones (2020) M. J. Calderón and E. Bascones, Phys. Rev. B 102, 155149 (2020).
- nez Azpiroz et al. (2022) J. I. nez Azpiroz, F. de Juan, and I. Souza, SciPost Phys. 12, 070 (2022).
- Marzari et al. (2012) N. Marzari, A. A. Mostofi, J. R. Yates, I. Souza, and D. Vanderbilt, Reviews of Modern Physics 84, 1419 (2012).